ACTUARIAL COSTING OF UNIVERSAL HEALTH INSURANCE COVERAGE IN INDONESIA Options and Preliminary Results Yves Guerard, Mitch Wiener, Claudia Rokx, George Schieber, Pandu Harimurti, Eko Pambudi and Ajay Tandon April, 2011
Transcript
ACTUARIAL COSTING OF UNIVERSAL HEALTH INSURANCE COVERAGE IN INDONESIA
Options and Preliminary Results
Yves Guerard, Mitch Wiener, Claudia Rokx, George Schieber, Pandu Harimurti, Eko Pambudi and Ajay Tandon
April, 2011
ii
Health, Nutrition and Population (HNP) Discussion Paper
Health, Nutrition and Population (HNP) Discussion Paper
Actuarial Costing of Universal Health Insurance Coverage in Indonesia:
Options and Preliminary Results
Yves Guerarda, Mitch Wienerb, Claudia Rokxc, George Schieberd, Pandu Harimurtie, Eko Pambudif and Ajay Tandong a Consultant, East Asia Pacific. World Bank, Washington, USA b Senior Social Protection Economist, East Asia Pacific. World Bank, Indonesia c Lead Health Specialist, East Asia Pacific. World Bank, Indonesia
d Consultant, East Asia Pacific. World Bank, Washington, USA
e Health Specialist, East Asia Pacific. World Bank, Indonesia
f Consultant, East Asia Pacific. World Bank, Indonesia g
Senior Economist, East Asia Pacific. World Bank, Washington, USA
Paper prepared for Indonesia Health Systems Strengthening Program with Support from DFID, UK-Aid
Abstract: The cost of a health insurance program will largely be determined by the size and composition of the covered population, the benefit package, cost sharing arrangements, the current and future supply of health care providers and facilities, and the provider payment mechanisms used. This brief summarizes in broad strokes the subset of the possible Universal Coverage (UC) transition scenarios and their related costs in Indonesia. These scenarios were selected based on initial discussions with key stakeholders, and further broad-based discussion with stakeholders will be needed to finalize the design, financing and transition options. This brief shows how decisions regarding the transition steps, benefit package and the choice of eligible population affect public Health Insurance (HI) expenditures as Indonesia transitions to UC. The details can be found in the World Bank publication on which this brief is based : Actuarial Costing of Universal Halth Insurance in Indonesia: Options and Preliminary Results. This work follows closely the earlier World Bank report Health Financing in Indonesia; A Road Map for Reform. Keywords: Health Financing, Actuarial Costing, Health Systems Disclaimer: The findings, interpretations and conclusions expressed in the paper are entirely those of the authors, and do not represent the views of the World Bank, its Executive Directors, or the countries they represent. Correspondence Details: Claudia Rokx, Email: [email protected]
i
Table of Contents
Acknowledgments .................................................................................................................... ii
List of Abbreviations and Acronyms .................................................................................... iii
I. Introduction .......................................................................................................................... 2
II. Constructing an Actuarial Baseline for Indonesia .......................................................... 5
2.1 Adjusting ASKES Baseline Data to Represent the Entire Indonesian Population ........... 6
2.2 Creating a Range of Baselines ....................................................................................... 11
III. Achieving Universal Coverage for all Indonesians by 2020 ........................................ 13
3.1 Gradual Expansion to All Population Sectors ............................................................... 13
3.2 ‘Jamkesmas For All’ Scenario ....................................................................................... 17
IV. Alternative Policy Choices for Transition to Universal Coverage ............................. 20
V. Summary of Results and Conclusions ........................................................................... 23
Appendix One - Cost Summary ........................................................................................... 27
List of Tables
Table 2-1: Estimated Current Health Insurance Coverage Baseline (2008)............................................ 6 Table 2-2: Askes Health Insurance Information (2008) .......................................................................... 6 Table 2-3: Askes Health Insurance Information (Adjusted to 2010) ...................................................... 9 Table 2-4: Age-Specific CMPM, Askes (Adjusted to 2010)(In Rp) ..................................................... 10 Table 2-5: Load Factors for CMPM ...................................................................................................... 11 Table 2-6: CMPM under Alternative Scenarios (2010) ........................................................................ 12 Table 2-7: CMPM and Total Expenditures for Three Baseline Scenarios (2010) ................................ 12 Table 3-1: Calculation of Elasticity Factors for Regions Other Than GJKT ........................................ 14 Table 3-2: GDP, Government Expenditures and Total Population in 2010, 2015 and 2020 ................ 14 Table 3-3: Estimated Real CMPM and Expenditures of Gradual Expansion to UC ............................. 15 Table 3-4: Expenditures of ‘Jamkesmas For All’ Program ................................................................... 18 Table 4-1: Antenatal and Delivery Benefit Package Design ................................................................. 21 Table 4-2: Expenditures of Universal Coverage for Maternal Health Care .......................................... 21 Table 4-3: Expenditures of All Children Under 15 ............................................................................... 22 Table 4-4: Cost of Universal Coverage for Children under the Low Scenario ..................................... 22
List of Boxes Box 3-1: Elasticity Factors: Further Discussion .................................................................................... 16
ii
Acknowledgments
The authors are grateful to the World Bank for publishing this report as an HNP Discussion Paper. The authors gratefully acknowledge the kind assistance and insights of Bjorn Ekman (Senior Health Economist) and Jack Langenbrunner (Lead Health Economist). Overall guidance for this note was provided by Juan Pablo Uribe (Health Sector Manager EAPHH) and Emmanuel Jimenez (Human Development Sector Director, EAP). This note is based on the 2010 Actuarial Consultant Report by Yves Guerard for the World Bank and on various consultations with key representatives from the Government of Indonesia Final editing was provided by Chris Stewart. Special thanks are due to PT Askes for providing the data and UKAID for contributing funding for this task.
iii
List of Abbreviations and Acronyms
ASKES Asuransi Kesehatan (Health Insurance Program)Indonesia BBP Basic Benefit Package CMPM Cost per Member per Month DRG Diagnosis-related Group FFS Fee For Service GAD Government Actuarial Department GDP Gross Domestic Product GJKT Greater Jakarta GoI Government of Indonesia Jamkesmas Jaminan Kesehatan Masyarakat Health Insurance Program for the Poor OECD Organization for Economic Co-operation and Development OOP Out-of-Pocket Puskesmas Pusat Kesehatan Masyarakat Local Health Center SHI Social Health Insurance SJSN National Social Security Law UC Universal Coverage WHO World Health Organization
1
Executive Summary
In 2009, The World Bank report Health Financing in Indonesia laid out a road map for achieving the Government of Indonesia’s 2004 promise to provide health insurance coverage to Indonesia’s entire population. The report assessed progress to date, the strengths and weaknesses of the current health system and provided a comprehensive list of needed critical policy decisions and three main options being considered in the debate on universal coverage (UC). Given estimates of Indonesia’s future fiscal space, it also provided some very preliminary estimates of the potential future costs and sustainability of UC.
The analysis showed that, no matter which path Indonesia chooses, the move towards UC will likely have a sizable impact on future government health spending. The report highlighted the need for Indonesia to start addressing the weaknesses in its health system in order to lay the basis for a financially sustainable future. It would be unwise to expand coverage to over 100 million uninsured individuals on an inefficient base system.
Furthermore, given the paucity of sound actuarial analyses, largely due to the lack of up-to-date unit cost, insurance claims and national health accounts information, the report stressed the critical policy need for additional base data and actuarial studies. These latter issues are the subject of this follow up note which provides estimates of the likely spending needed for a range of possible transition paths to achieving UC. It also illustrates the impact of key policy choices on the costs of the program. It is important to note, however, that the sophistication of the analysis and models continues to be limited by data availability and quality as well as very limited information about the risk profiles of the currently insured versus the currently uninsured. There is also a lack of information on the government’s plans to expand the severely constrained health service delivery system.
In addition to providing senior government decision makers and Members of Parliament with much needed data for decision making, the other purpose of this new report is to provide technical policy staff with both a methodological basis and a tool for undertaking future estimates. This study highlights the type of data adjustments that need to be made to develop a sound actuarial model, as well as approaches for estimating the impacts of alternative policies. A spreadsheet model which has been developed to underlie this study is being made available to GoI technicians and other stakeholders. The study provides both health policy makers and technical staff with a practical tool to estimate future health care spending under alternative UC policy scenarios, an area that has been badly neglected by the international community.
In theory, from an aggregate perspective, estimating the costs of expanding health insurance coverage is conceptually straightforward–population covered times unit price of service times quantity of service plus administrative costs. However, as the study points out, operationalizing these simple price and quantity concepts is far from straightforward. First, what does the concept of price mean–for example efficient unit costs of production or the fee schedules paid by insurers or set by private providers. Does it include supply-side subsidies to public institutions in the form of salaries and capital? Second, service use will also depend on both demand and supply factors such as the risk profiles of the covered and uncovered populations, the contents of the basic insurance benefits package, cost-sharing provisions, provider payment methods and cost-containment measures, and supply-side availability. Future program cost estimates therefore need to take into account, among other things, changes in demand and disease patterns, aging, technological advances, and changes in supply.
One of the major advantages of this note over previous studies is the use of detailed 2008 Askes claims data from the public employees’ health insurance program for the entire country which is available at the individual level by age, sex and geographic area. Askes covers some 14 million civil
2
servants and dependents. By adjusting these data for the UC options under consideration in terms of the basic benefit packages (BBP), cost sharing, and socioeconomic characteristics of the remaining uninsured, detailed estimates of UC spending based on the different risk and geographic profiles of the uninsured and/or specific groups of the uninsured (for example women and children) can be made.
In 2008, the average cost of the Askes program was just under Rp 16,000 per member per month (CMPM). CMPM is the total Askes program expenditure divided by the number of members. The cost in Greater Jakarta is almost 2.5 times higher than the cost in other regions of the country, reflecting greater access, reimbursement rates and availability of services. After adjusting Askes data for such factors as population and age distribution, Class III hospital bed coverage (the likely service covered in a UC BBP), and tariff increases, the national average CMPM is Rp 11,671 and Rp 20,724 in Greater Jakarta. These notional premium levels are well in excess of the administratively set government contribution of just over Rp 4,000 CMPM that was made in 2008 for the one-third of the population covered by the government’s Jamkesmas program for the poor and near poor, suggesting that there will be a significant expenditure increase needed to continue coverage of this group under a uniform national UC program.
The adjusted CMPM of Rp 11,671 is low and may suggest that UC could be achieved at reasonable cost. However, this significantly underestimates the real cost as it does not include extensive out-of-pocket (OOP) expenses (for example some 40 percent of all health spending in Indonesia), large subsidies to the public system and serious supply constraints. Including estimates of these ‘costs’, assuming various scenarios, provides a more realistic expenditure estimate ranging from Rp 19,258 CMPM to Rp 36,029. The latter assumes access and availability of services as currently seen in Greater Jakarta.
Projecting costs forward to 2020 suggests that UC in Indonesia is likely to require an expenditure range between Rp 127 trillion (6.66 percent of total public expenditures and 1.17 percent of GDP) and Rp 221 trillion (11.58 percent and 2.03 percent). The lower estimate assumes low levels of OOP and increased supply while the higher estimate assumes that the rest of the country catches up to Greater Jakarta access and utilization of services. In terms of partial coverage options, a UC package for maternity services only would cost between Rp 16-30 trillion in 2020, 0.86-1.58 percent of total public spending, and 0.15 to 0.28 of GDP.
These estimates assume gradual expansion toward UC between 2010 and 2020, factoring in aging and epidemiological changes as well as advances in medical technology and increased demand. These expenditures do not include public spending for other public health activities such as health promotion, surveillance or training, and do not include private spending on health which is currently almost one-half of total health spending. Moreover, this study focuses on the expenditure implications of UC and does not (except in one case) deal with alternative revenue-raising options in terms of alternative forms of public funding (for example general revenues vs payroll taxes vs earmarking) as well as different cost-sharing and premium structures for the nonpoor, especially informal sector workers. While this is a serious limitation of the approach, it is an area that can be readily accommodated in future permutations of the model.
Other scenarios for achieving UC, starting with coverage of vulnerable populations, are also developed as alternatives and as inputs to the ongoing debate on the various transition paths to achieve UC and make good on the promise made with the passage of Law No. 40/2004 on Social Security. Much work remains to be done to finalize the design and cost of universal health care in Indonesia. The estimates in this report give an idea of the possible range of spending required under various assumptions and provide a useful modifiable tool for undertaking further estimates. However, the data are not sufficiently robust to estimate: (i) spending for programs that cover a more limited package of medical interventions (for example, not covering tertiary care); (ii) the impact of changes in the supply of medical services; or (iii) the impact of changing technologies on utilization patterns.
2
I. Introduction
The purpose of this actuarial costing exercise is to respond to the Government of Indonesia’s (GoI) request to assist in developing baseline estimates for the costs of existing health insurance programs in Indonesia and to perform an actuarial analysis of the costs of some different options for attaining universal coverage (UC).1 This effort has several objectives beyond providing key information for decision making to policy makers and other stakeholders.2
‘Big bang’ health insurance reform proposals such as Indonesia’s Law No. 40/2004 create particular challenges given that most actuarial studies only deal with marginal changes to an existing system. Few countries undertake the massive reforms that Indonesia is proposing. Moreover, there is no Indonesian evidence base for assessing the proposed transition policies to UC. This is particularly critical given the magnitude of the changes under consideration:
The exercise also underscores the need for appropriate underlying data such as unit cost information, clean and representative health insurance claims information, and updated national health accounts (NHA) information to undertake such policy-relevant actuarial estimations. Furthermore, it highlights the need for the GoI to develop and institutionalize its NHA and health modeling and actuarial costing capabilities, important areas typically lacking in most developing countries.
• the provision of new insurance coverage to half the population;
• supply-side considerations (that is the number and distribution of delivery capacity); and
• demand inducement impacts (that is previously uninsured people now having access to free or highly subsidized services).
When countries expand formal health insurance coverage to previously uncovered groups, the basic formula for determining UC expenditures is quite straightforward. The formula is:
Pop x [P x Q] + A = E
where: Pop = Population
P = Unit price of service / person Q = Quantity of service / person (that is utilization) A = Administrative costs E = Total health expenditure under UC
1 For the purposes of this study ‘costs’ means the total amount of public and/or private resources expended for health insurance-covered services, including administrative costs. They include direct payments through insurance programs in the form of capitation and fee for service (FFS) and DRG (Diagnosis-related Group) type payments, as well as indirect subsidies through the Ministry of Health (MoH) and other government entities for salary, capital, and furniture subsidies to public health care facilities and staff. This study focuses on expenditures, not revenues, although one ‘contributory’ option is analyzed. Further studies will focus on other revenue raising/contributory options, thereby facilitating calculations of the net increases (expenditures minus revenues) in public, total, and private health spending. Earlier work laying out several of the options analyzed here includes the World Bank publication Health Financing in Indonesia; a Reform Road Map (2009). 2 It is expected that the results will properly rank the various options in relative terms. However, since a number of assumptions had to be made to fill gaps in the data, there remains a significant margin of uncertainty in the results in absolute terms.
3
However, the ‘price’3
• socioeconomic and epidemiological status of covered and previously uncovered individuals;
and quantity components in the above formula depend upon a number of key demographic, socioeconomic, policy and behavioral factors. These include:
• benefit package, including scope, limits on benefits and cost-sharing requirements;
• current service use;
• demand effects/behavioral response to lower out-of-pocket (OOP) costs for both current insureds and the previously uninsured;
• supply-side response (will supply expand sufficiently to meet newly created demand for health services?); and
• cost containment/provider payment methods and levels, and ability of providers to ‘extra-bill.’
Future program costs will depend on:
• demand for services;
• increase in population;
• aging and epidemiological changes;
• delivery model;
• technology adoption;
• control of the use of medicines;
• changes in the supply of primary care physicians, specialists, beds, laboratories and radiology facilities; and
• improvements in the quality of services and in efficiency.
While the formula itself is rather straightforward, finding even the most basic information on prices/‘costs’ of services, baseline service use levels, and the actual numbers and differences in the risk profiles of the insured versus uninsured in developing countries is extremely problematic. Further compounding these base data problems is estimating the behavioral responses on both the demand (demand inducement) and supply sides (supply response), issues that are problematic in developed countries as well. However, in developing countries, many of which are facing severe supply constraints (as opposed to the excess capacity sometimes found in richer countries), increased costs resulting from supply expansions and/or savings from forced rationing can be quite significant and cannot be ignored, particularly when the changes in coverage are not incremental.
3 ‘Price’ is a rather vague concept and is often confused with ‘cost’ of service provision. Price normally reflects the insurer’s or provider’s fee schedule. However, from a national policy perspective, the more important ‘price’ is the real cost of providing the service, including indirect subsidies to providers which are generally paid through separate ‘supply-side’ funding flows and bear little or no relationship to the fee schedules. Further complicating the determination of the ‘true or real costs’ of services is that cost has several connotations including the actual costs vs. efficient costs. Public payments should provide incentives for and pay ‘efficient’ costs rather than whatever costs a provider might generate. However, determining technically efficient costs is a major challenge and since Indonesia has no unit cost information, about the best one can do is to sum the insurance payments and the indirect subsidies received by public providers for salary payments, capital costs, and furniture as these two flows provide a reasonable approximation for the amounts of resources devoted to providing the service. Given the dearth of unit cost and facility-level utilization information, defining ‘efficient cost’ is well beyond the scope of this study.
4
Countries often promise services that they can not deliver due to provider shortages, resulting in lower claim costs than would be expected because actual utilization of services is far below what it would be if there was sufficient provider capacity to deliver all promised benefits. If models are based on actual experience only, it will appear the country is providing a rich benefit package at low cost, when in reality it is not. On the other hand, if a country chooses to significantly expand its capacity to start providing what has been promised, claim costs can jump sharply. Supply can be increased by bringing private facilities and providers into the system and/or by expanding public facilities. The latter option may lead to significant government expenditures outside the UC system for upgrading or constructing new public facilities.
This is certainly the case in Indonesia today where per capita health care spending is well below the level in other countries with similar levels of economic development. Claim costs for both the Askes and Jamkesmas programs are well below what they would be if all promised services were provided to all eligible participants, and if the government actively promoted and explained benefit entitlements to those covered by Jamkesmas. The government often states that the low claim costs indicate the programs are operating efficiently, when, in fact, the costs are constrained by severe supply-side induced rationing. Consequently, Askes and Jamkesmas claim costs cannot be used directly to estimate the likely cost of a well-designed and operated universal health coverage program.
When looking at the cost of medical care for the country, it is also important to look at all sources of expenditures and not just focus on public spending or insurance premiums. Spending includes all of the following components:
• Government: Basic health services provided for free by the government through the central and local budgets, government spending on construction and maintenance of new and existing public health facilities, salaries for workers in public health facilities, purchases of medical equipment and contributions or provision of free care for civil servants and the poor.
• Employers: Contributions to social health insurance (SHI) or private medical insurance on behalf of workers and any health facilities or programs that may be directly provided by employers.
• Citizens: Health care premiums, deductibles, coinsurance and copayments, excess billing, full payment for services not covered by existing health programs or for services provided outside of the health program contracted facilities.
The revenue side of the health system also raises many complex policy issues in terms of the types of tax and nontax revenues used, central versus provincial and local government contributions, and the issue of individual contributions (whether through cost sharing or premium payments or ‘balance billing’). Taxes need to be evaluated on the basis of revenue generation, efficiency, equity, sustainability, cyclicality, and administrative capacity. Such assessments depend on the socioeconomic status of the population, rates of formal versus informal sector employment, firm sizes and locations, and intergovernmental fiscal relations, in addition to the types and levels of the tax and nontax instruments employed.
The health care financing options will be addressed in more detail in a separate paper. The focus of this paper is estimating total expenditures for universal care, the variations in cost due to the specifics of the benefit program and the impact of various external factors and policy decisions on the cost of the benefits package. It is important to keep in mind that total expenditures, with the exception of cost-sharing, are generally not impacted by the financing method. Financing determines who pays, but not the total cost of the program.
5
II. Constructing an Actuarial Baseline for Indonesia
The analytical and conceptual focus of the actuarial model we use for Indonesia is focused on the expenditure side. Future efforts will be needed with regard to the revenue side. Nonetheless, developing even a highly simplified actuarial cost projection model for Indonesia has been difficult due to the lack of relevant data and a well-specified Basic Benefit Package (BBP).
The BBP has not been elaborated; instead, coverage of broad categories of service types has been specified. There is also no detailed unit cost information. Consequently, the focus of this report is on estimating expenditures for the current broadly defined and comprehensive package that is similar across the three existing major publicly administered health insurance programs: Jamkesmas, Jamsostek and Askes. It should be remembered, however, that while all these programs promise a comprehensive package, it is arguable whether they actually deliver it.
The approach followed for the actuarial analysis is to analyze the payments made by a public insurer for different detailed age-sex-geographic regions and type of service categories of the population. These payments reflect the current benefit program, the current level of providers (including health providers, facilities etc) in the regions where the participants live or receive services and the current level of reimbursements paid by the insurer to the health care providers. Assuming this same BBP with minor modifications (such as coverage of Class III–rather than Class I and II–level hospital accommodations) would be the uniform national program, it is possible to estimate the costs of covering these individuals through the universal care program based upon several important assumptions:
• The base insurance payments plus the supply-side subsidies to public providers reflect the actual costs of providing services;
• The government will continue the same level of supply-side subsidies to public providers for salaries and capital costs that it is currently providing;
• An uninsured person with the same age-sex-geographic characteristics would consume the same amount and types of services as a currently insured person; and
• The same level of supply-side constraints as exists in the current insured program will apply after the introduction of UC. If supply is only 60 percent of demand today, for example, we assumed it will remain 60 percent of demand after UC is introduced. Note that this still implies a significant increase in the number of participating providers and facilities since aggregate demand will increase as the number of covered individuals increases.
In almost every health system in the world, the demand for health services exceeds the supply of services. Health care is also very much a local service. Only in rare instances do individuals travel a great distance to receive care in another region or country. Consequently, there can be oversupply of providers in one locale while there are severe shortages elsewhere. Generally speaking, major cities tend to have far more health services available than rural areas. It is, therefore, important to analyze the supply and demand for services on a local and regional basis.
Some 51.7 percent of the population had HI coverage in 2008 (Table 2-1). Thirty-three percent had coverage through Jamkesmas, 6 percent through Askes, 2.5 percent through Jamsostek, and the remaining 10 percent through a variety of other small public programs, private insurance, group insurance or self insurance. Thus, 50 percent is a good approximation to current coverage levels, despite some variations in the benefit packages.
6
Table 2-1: Estimated Current Health Insurance Coverage Baseline (2008)
Health Insurance Program
Estimated Population
Covered
Source
Jamkesmas 76,000,000 Administrative data – quota
Askes 14,257,280 Membership data Jamsostek 5,661,572 Membership data JPKM 8,912,409 Susenas 2008 JKPM &
Health funds Private Insurance
2,647,480 Susenas 2008
Self Insurance 4,618,331 Estimate using Susenas 2008
Other 5,941,099 Assumes it includes Police and Armed Forces – Susenas 2008
Total any insurance
118,038,171 51.7% of total population*
Note: * Based on BPS census data: total population of 228,523,300.
Table 2-2: Askes Health Insurance Information (2008) Item National Regions GJKT*
Primary care Inpatient (RITP)
44 48 3
Medicines (OBRJTP) 49 53 7 Primary Care Outpatient (RJTP)
Source: Guerard (2010). Slight difference in total is due to rounding off.
2.1 Adjusting ASKES Baseline Data to Represent the Entire Indonesian Population
Claims data from the 2008 Askes civil servants’ program were utilized to develop the baseline estimates, as Jamkesmas claims information was not available. Moreover, while Jamkesmas information would have been a bigger sample covering the largest share of the covered population, this group is not representative of the remaining uncovered population and would also have required adjustment for use in estimating the cost of UC.
Fortunately, Askes membership, which covers civil servants and their dependents–some 6 percent of the population–is large enough to be geographically representative of the whole country. The Askes claims data are disaggregated by age, sex, geographic region and type of service. PT Askes divides Indonesia into 12 regions and four primary categories of care.4
• RJTP: Primary outpatient care in Puskesmas or Health Center;
• RITP: Primary inpatient care in Puskesmas or Health Center (this is quite limited, especially in urban areas, as very few Puskesmas have beds. It is primarily maternity care);
• RJTL: Outpatient care in hospital; and • RITL: Inpatient care in hospital.
For all primary categories of care except RITP, there is a companion category covering medicines. So in total, there are seven categories of expenses. For each category, in each region, data are available in five-year age groups for each sex. These data tables provide basic information on the amount of expenses but no diagnostic or DRG codes. The location and type of facility in which the service was provided is known, but the type of medical procedures provided is not known.
4 RJTP: Rawat Jalan Tingkat Pertama; RITP: Rawat Inap Tingkat Pertama; RJTL: Rawat Jalan Tingkat Lanjut; RITL: Rawat Inap Tinkgat Lanjut.
7
Askes claim information for 2008 starts with the cost per member per month (CMPM) in rupiah for service provided at different types of facilities, with the cost of medicines separated from the cost of all other care (Table 2-2). Information is provided separately for Greater Jakarta (GJKT) and for all other regions. National information is a weighted-average of costs in GJKT and the regions based upon the Askes membership distribution. These data reflect Askes’ payments only, not government supply-side subsidies to public facilities.
Costs in Greater Jakarta are significantly higher than in the other regions. The disparity between GJKT and the other regions is caused by a variety of factors:
• Higher average age of the GJKT group covered by Askes relative to the average age in the other regions;
• Greater utilization of services in GJKT compared to the rest of the country;
• Higher reimbursement rate for medical services in GJKT. This is due to a combination of factors such as greater use of Class A and B hospitals, use of more experienced doctors, and a different mixture of procedures (and more tertiary care) than in the regions;
• Higher cost for prescription drugs, most likely due to greater use of more expensive drugs in Greater Jakarta than elsewhere in the country; and
• Greater usage of hospital outpatient services for primary care than in the other regions.
More research is needed regarding the reasons for the difference in expenditures in Greater Jakarta and the regions. While all the factors listed above undoubtedly contribute to the higher costs in Greater Jakarta, the relative contribution of each of the factors cannot be separately identified. More research is also needed regarding the differences (if any) in Askes reimbursement rates for the same procedure performed in the same type of facility in different regions.
It is also important to remember that the CMPM is based on the supply and demand for services and the average reimbursement rate for those services. For example, in Jakarta, virtually no Puskesmas have inpatient beds, so the CMPM for this category of service is much lower in Jakarta than in the regions. However, outpatient care at hospitals is much more prevalent in Jakarta than the regions, so the CMPM for this type of service is much higher.
This Askes data must be adjusted before it can be used to estimate the cost of UC. This is due to the following reasons:
• The distribution of participants by age, sex and geographic location in Askes is not the same as the distribution for the whole population;
• Region 4, which comprises GJKT, shows a much higher level of costs than all other regions. A greater percentage of Askes members live in GJKT than for the nation as a whole;
• Coverage at ages 0 to 14 in the Askes data is significantly underreported, so the total number of covered lives needs to be adjusted upward;
• The cost of primary care reflects only the capitation charge of Rp 1,000 set by the ministerial tariff and not the actual cost of providing primary care services;
• A large proportion of hospitalizations are in class I rooms with the remainder in class II, whereas basic coverage would be in class III;
8
• Askes members can use either public or private facilities, as long as they are in the network. However, very few private facilities are in the network so most primary care and basically all secondary and tertiary care is provided in public facilities;
• Even for those private hospitals in their network, Askes reimburses only the agreed upon rate and the hospital bills the patient for the difference between its standard charges and the Askes reimbursement rate. This practice is commonly referred to as ‘excess billing’;
• Askes beneficiaries are often unhappy with the quality of care in public health institutions, so they spend large amounts of their own funds out-of-pocket to access care in nonparticipating private hospitals and clinics, particularly for outpatient care; and
• There is a disconnect between claims expenditures and the actual service costs. Public hospitals and Puskesmas receive subsidies from the government for salaries, furniture and capital costs. Thus, Askes’ fee schedule and primary care capitation payments are lower than they would be if fees had to cover the full costs of care including salaries, furniture and capital costs.
Under UC there would presumably not be such strong incentives to use only public institutions. Both public and private facilities would need to participate in the program to assure an adequate supply of medical services. In some cases (outpatient care) half of all care is currently delivered in private institutions, so it is inevitable that private facilities would participate in any scaled-up UC program. In this instance, both public and private facilities would be subject to more stringent quality of care standards and excess billing would likely be prohibited or severely constrained.
Of course, private institutions may not wish to participate if their reimbursement rate is the same as the public facilities. As previously mentioned, the central budget subsidizes the capital and operating costs of Puskesmas and other public facilities. Consequently, the Askes reimbursement rate is designed to cover only that portion of the costs which is not government subsidized. Private providers get no such subsidies, and they must rely on the reimbursement to cover all their costs and produce a profit.
If the subsidies to public facilities are very large and both public and private receive the same reimbursement rate, the private facilities may choose not to participate unless they are permitted to excess bill. On the other hand, if the private reimbursement rate is higher than the public rate, then total UC expenditures will be very sensitive to the percentage of members who choose to go to private facilities.
Average costs using Askes’ membership distribution are also high because of an excess number of older members and undercounting of members at younger ages. Adjusting the exposure at young ages and applying age-specific rates to the actual target population distribution eliminates this distortion. This significantly reduces the average cost per member per month.5
The actuarial baseline model developed from Askes claims data, therefore requires numerous adjustments in order to estimate the range of possible costs of services under a UC program.
6
5 Details of these and other calculations can be found in the accompanying report on Actuarial Baseline by Yves Guerard on which this note is based. The report is available upon request..
The following adjustments have been made to the raw 2008 Askes claim data to estimate the costs of a UC program that begins in 2010 with similar benefits to those currently promised under the Askes program:
6 There are no data on service costs. It is assumed here that the Askes fee schedule plus the adjustments for government supply-side subsidies approximate what the actual costs of providing the services are. In the absence of unit cost information, this is the only viable approach using extant data to approximate insurance program costs/expenditures.
9
Table 2-3: Askes Health Insurance Information (Adjusted to 2010) Category National Regions GJKT
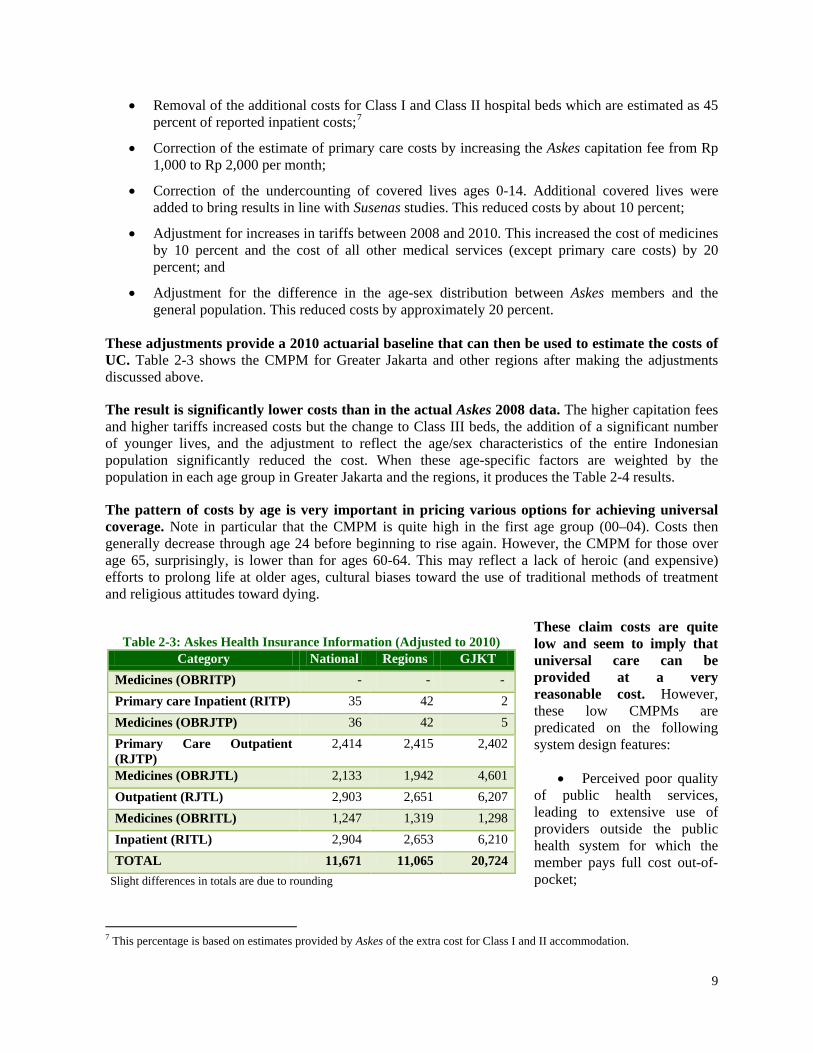
• Removal of the additional costs for Class I and Class II hospital beds which are estimated as 45 percent of reported inpatient costs;7
• Correction of the estimate of primary care costs by increasing the Askes capitation fee from Rp 1,000 to Rp 2,000 per month;
• Correction of the undercounting of covered lives ages 0-14. Additional covered lives were added to bring results in line with Susenas studies. This reduced costs by about 10 percent;
• Adjustment for increases in tariffs between 2008 and 2010. This increased the cost of medicines by 10 percent and the cost of all other medical services (except primary care costs) by 20 percent; and
• Adjustment for the difference in the age-sex distribution between Askes members and the general population. This reduced costs by approximately 20 percent.
These adjustments provide a 2010 actuarial baseline that can then be used to estimate the costs of UC. Table 2-3 shows the CMPM for Greater Jakarta and other regions after making the adjustments discussed above.
The result is significantly lower costs than in the actual Askes 2008 data. The higher capitation fees and higher tariffs increased costs but the change to Class III beds, the addition of a significant number of younger lives, and the adjustment to reflect the age/sex characteristics of the entire Indonesian population significantly reduced the cost. When these age-specific factors are weighted by the population in each age group in Greater Jakarta and the regions, it produces the Table 2-4 results.
The pattern of costs by age is very important in pricing various options for achieving universal coverage. Note in particular that the CMPM is quite high in the first age group (00–04). Costs then generally decrease through age 24 before beginning to rise again. However, the CMPM for those over age 65, surprisingly, is lower than for ages 60-64. This may reflect a lack of heroic (and expensive) efforts to prolong life at older ages, cultural biases toward the use of traditional methods of treatment and religious attitudes toward dying.
These claim costs are quite low and seem to imply that universal care can be provided at a very reasonable cost. However, these low CMPMs are predicated on the following system design features:
• Perceived poor quality of public health services, leading to extensive use of providers outside the public health system for which the member pays full cost out-of-pocket;
7 This percentage is based on estimates provided by Askes of the extra cost for Class I and II accommodation.
10
Table 2-4: Age-Specific CMPM, Askes (Adjusted to 2010)(In Rp)
• Continued practice of “excess billing” where public and private facilities and private providers can charge members more than the amount paid by the health system to the facility;
• Continued acceptance of Rp 2,000 per member per month capitation fee as payment in full for primary care;
• Class III hospital beds only;
• Continued large subsidies to public health facilities from government budgets;
• Administrative costs of the system are paid from the government budget; and
• Continued supply-side constraints that limit the availability of promised care.
If all these conditions hold true, then the cost of universal care could be as low as is implied by Table 2-3. For example, we generally believe this is an accurate representation of the likely initial cost of a ‘Jamkesmas For All’ health care system based solely on the use of public facilities or where private providers and facilities are permitted to excess bill. This option is discussed further later in this Note.
However, many of these conditions are generally considered unacceptable in a well-designed national health care system.
• The health care system should provide good quality medical care to everyone. If the quality of the public system is poor, those who are wealthier will seek care elsewhere and only those with no choice will use the public system.
• The health care system should encourage members to access the system as early as possible and in the appropriate setting. If members can not afford to see a doctor or pay for medications when needed, then they may use the system only when they become very ill and at a much higher cost.
• One of the fundamentals of an SHI system, as required by the SJSN law, is that it substitutes small and regular payments of contributions to the health care fund for irregular and often high payments for health services that are paid as health services are utilized. Consequently, requiring payments to an SHI fund and then also requiring significant OOP payments is not good design on either equity or cost-containment grounds.
• Heavy subsidies to public providers could also price private practitioners out of the system.
The actual cost of a properly designed universal care system will, therefore, likely cost more. This is because:
11
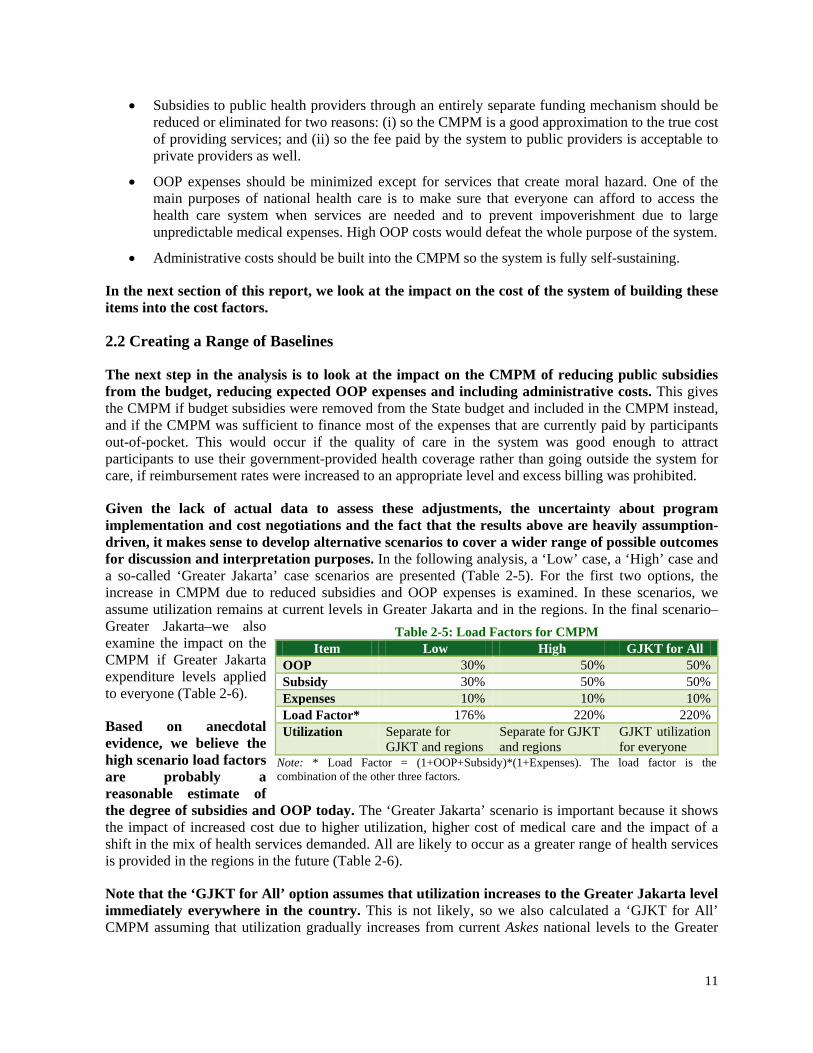
Table 2-5: Load Factors for CMPM Item Low High GJKT for All
OOP 30% 50% 50% Subsidy 30% 50% 50% Expenses 10% 10% 10% Load Factor* 176% 220% 220% Utilization Separate for
GJKT and regions Separate for GJKT and regions
GJKT utilization for everyone
Note: * Load Factor = (1+OOP+Subsidy)*(1+Expenses). The load factor is the combination of the other three factors.
• Subsidies to public health providers through an entirely separate funding mechanism should be reduced or eliminated for two reasons: (i) so the CMPM is a good approximation to the true cost of providing services; and (ii) so the fee paid by the system to public providers is acceptable to private providers as well.
• OOP expenses should be minimized except for services that create moral hazard. One of the main purposes of national health care is to make sure that everyone can afford to access the health care system when services are needed and to prevent impoverishment due to large unpredictable medical expenses. High OOP costs would defeat the whole purpose of the system.
• Administrative costs should be built into the CMPM so the system is fully self-sustaining.
In the next section of this report, we look at the impact on the cost of the system of building these items into the cost factors.
2.2 Creating a Range of Baselines
The next step in the analysis is to look at the impact on the CMPM of reducing public subsidies from the budget, reducing expected OOP expenses and including administrative costs. This gives the CMPM if budget subsidies were removed from the State budget and included in the CMPM instead, and if the CMPM was sufficient to finance most of the expenses that are currently paid by participants out-of-pocket. This would occur if the quality of care in the system was good enough to attract participants to use their government-provided health coverage rather than going outside the system for care, if reimbursement rates were increased to an appropriate level and excess billing was prohibited.
Given the lack of actual data to assess these adjustments, the uncertainty about program implementation and cost negotiations and the fact that the results above are heavily assumption-driven, it makes sense to develop alternative scenarios to cover a wider range of possible outcomes for discussion and interpretation purposes. In the following analysis, a ‘Low’ case, a ‘High’ case and a so-called ‘Greater Jakarta’ case scenarios are presented (Table 2-5). For the first two options, the increase in CMPM due to reduced subsidies and OOP expenses is examined. In these scenarios, we assume utilization remains at current levels in Greater Jakarta and in the regions. In the final scenario–Greater Jakarta–we also examine the impact on the CMPM if Greater Jakarta expenditure levels applied to everyone (Table 2-6).
Based on anecdotal evidence, we believe the high scenario load factors are probably a reasonable estimate of the degree of subsidies and OOP today. The ‘Greater Jakarta’ scenario is important because it shows the impact of increased cost due to higher utilization, higher cost of medical care and the impact of a shift in the mix of health services demanded. All are likely to occur as a greater range of health services is provided in the regions in the future (Table 2-6).
Note that the ‘GJKT for All’ option assumes that utilization increases to the Greater Jakarta level immediately everywhere in the country. This is not likely, so we also calculated a ‘GJKT for All’ CMPM assuming that utilization gradually increases from current Askes national levels to the Greater
12
Table 2-6: CMPM under Alternative Scenarios (2010) CMPM
Category National Other
Regions GJKT Region
Low 20,542 19,474 36,475 High 25,677 24,343 45,594 GJKT for All 46,382 46,382 46,382
Table 2-7: CMPM and Total Expenditures for Three Baseline Scenarios (2010)
Scenario Low High GJKT for All
CMPM 20,542 25,677 36,029
Cost of Universal Coverage assuming 50% coverage in 2010
Total cost in trillions of Rp. 30 37 52
Total cost as % of GDP 0.50 0.62 0.88
Total cost as % of Gov. Expenses
2.85 3.56 5.00
Jakarta level over time. For 2010, we estimated a “phase-in” CMPM equal to 50 percent of the high option national CMPM of Rp 25,677 plus 50 percent of the difference between the high option and the full ‘GJKT for All’ CMPM of Rp 46,382. This gives a phase-in CMPM of Rp 36,029 for 2010.8
The ‘GJKT for All’ CMPM of Rp 46,382 is only slightly greater than the ‘High’ option CMPM for the Greater Jakarta region of Rp 45,494. These two numbers differ by less than expected because the entire population is considerably younger than the population of Greater Jakarta alone. Consequently, the weights applied to the age-specific CMPMs differ for the two calculations. The difference between the national average costs and the cost in the GJKT region is substantial; costs are almost double. A global index of disparity can be constructed by comparing the national average with the Greater Jakarta average. By reference to Table 2-6, the initial disparity is 44 percent, that is national rates are 56 percent of Greater Jakarta. The reduction in disparity over time under the different scenarios will be an indication of the progress towards equal treatment for all.
The next step is to estimate the total UC expenditures for 2010 under the various alternative sets of assumptions. For the purposes of our study, we have assumed that the government will not be able to cover everyone immediately. Instead, we assumed initial coverage would be equal to 50 percent (about the coverage level today) and would increase to 100 percent over a period of 10 years and all groups will be brought in uniformly.
The figures presented in Table 2-7 reflect only the expenditures that would be undertaken through the public UC program. They do not reflect public spending for other health activities such as basic public health, disease surveillance systems, training, IEC (Information, Education,
and Communication), supply-side subsidies to facilities and OOP expenses. In fact, budget expenditures for subsidies and member OOP expenses would reduce under these scenarios.
Assuming 50 percent coverage and no changes in supply in 2010, the total costs of health insurance could range from Rp 30 trillion in the ‘Low’ case scenario to as much as Rp 52 trillion in the ‘GJKT for All’ case. The ‘Low’ CMPM of Rp 20,542 in 2010 is much higher than the estimated CMPM reported to be paid by the government for Jamkesmas members in 2008 as it includes loading for expenses, subsidies and OOP as well as higher utilization (Askes utilization rates exceed Jamkesmas utilization rates), which causes the increase in public spending to be much higher than the increase in coverage.
8 Based on the formula ((Rp25,677 + (Rp46,382-Rp25,677/2)).
13
III. Achieving Universal Coverage for all Indonesians by 2020
In this section, we look at several different possible scenarios for achieving universal coverage by 2020. We examine alternative ways of sequencing the coverage of the population and also explore alternative BBPs other than the current Askes benefit scheme.
3.1 Gradual Expansion to All Population Sectors
The simplest case is to assume that the Askes benefit package expands gradually from a 50 percent coverage rate in 2010, to 75 percent in 2015 and full coverage by 2020. In this scenario, the rate of coverage increases gradually and uniformly in all segments of the population. In other words, the government does not target particular groups such as rural workers, the poor, or the most underserved areas first. Under this scenario, the Jamkesmas, Askes and Jamsostek-eligible population will be absorbed into the new UC program, as will other currently insured segments of the population.
Additional assumptions are necessary for projecting costs beyond 2010:
• Change in the size of the total population;
• Changes in the age/sex composition of the population;
• Expected increases in health care expenditures resulting from technology change and other endogenous and exogenous factors; and
• Inflation (if costs are to be expressed in nominal terms).
While we directly account for increased numbers of people getting public HI coverage as well as changes in the age-sex distribution of the population, studies in industrialized countries have shown that adaptation of new medical technologies and excess health care cost inflation also have important impacts on health spending. Our focus will be on presenting results in real terms, ignoring the impact of inflation. These numbers are generally easier to comprehend and present a clearer picture of the impact of rising real medical costs.
To reflect excess health cost increase pressures found in other countries with mature UC systems, for regions other than Greater Jakarta, we applied an elasticity factor each year equal to 125 percent of the growth of real GDP per capita to the age-specific CMPM factors. This adjusts for cost increases due to enhanced technologies, changing epidemiology, and increased demand for medical services through better consumer information and improvements in service quality.
This elasticity factor reflects OECD nominal total health spending elasticity, which is based on nominal total health spending increases relative to nominal GDP increases from 1995 to 2008 in all OECD countries. It is used as a proxy for the cost pressures found in mature UC systems, a situation which Indonesia will approach as it moves to UC. This increases the real CMPM by 36.0 percent by 2015 and by 87.4 percent by 2020 (average of 6.48 percent per year). Table 3-1 shows the derivation of the real CMPM increase factors for regions other than Greater Jakarta.
14
Table 3-1: Calculation of Elasticity Factors for Regions Other Than GJKT Year GDP
Different factors were applied for health spending elasticity in Greater Jakarta which was assumed to be 3 percent per year. This produces a 15.9 percent increase by 2015 and a 34.4 percent real increase over the 10-year period. This is based on the assumption that costs in the regions will increase more rapidly than costs in Greater Jakarta due to the change in the mix of procedures in the regions and some opportunities for increased efficiency in Greater Jakarta.
The real increase in the cost of medical care affects only the age-specific claim costs for Greater Jakarta and the regions. However, the national average claim cost is also impacted by the change in the population distribution between Greater Jakarta and the regions and the change in the age composition of the population. The population in Greater Jakarta grows more slowly and it therefore ages more rapidly than the regions. The average age of the population in the regions also increases, but more slowly, since most of the population increase is assumed to occur outside of Greater Jakarta. As a result of changes in the population composition, costs in Greater Jakarta increase by 8.7 percent and in the regions by 3.0 percent by 2015, and by 19.9 percent and 5.9 percent respectively by 2020.
Table 3-2 shows the real GDP, real total government expenditures and the total population projected to 2015 and 2020. These figures are used to calculate the total UC expenditures in future years and to express the projected future expenditures as a percent of GDP and as a percent of government expenditures.
Table 3-2: GDP, Government Expenditures and Total Population in 2010, 2015 and 2020 Factor 2010 2015 2020
GDP (in trillions of Rp) 5,981 8,065 10,895 Government Expenditures (in trillions of Rp) 1,048 1,413 1,911 Total population (in thousands) 242,3779 255,108 266,319 Coverage percent 50% 75% 100%
9 Current estimates for the 2010 population are higher than earlier projections. To better match GDP projections we are using population projections moved forward by three years.
15
Table 3-3 shows the increases in spending to achieve UC by 2020. It assumes supply constraints are at the same relative level as today, it excludes adverse selection and assumes a normal pooling of good and bad risks even though the coverage rates remain partial until 2020. The scenarios are based on the national average CMPMs.
In real terms, the ‘Low’ case scenario for UC would see an increase in annual expenditures to a total of Rp 65 trillion with 75 percent coverage in 2015 and Rp 127 trillion in 2020 with full UC. Under the ‘High’ scenario, total expenditures are estimated at Rp 82 trillion in 2015 and Rp 159 trillion in 2020. In the ‘High’ scenario, this represents almost 6 percent of total government expenditures in 2015 and more than 8 percent in 2020, while in the ‘Low’ case scenario, 4.6 percent and 6.7 percent of total government expenditures would be needed in 2015 and 2020 respectively.
Table 3-3: Estimated Real CMPM and Expenditures of Gradual Expansion to UC
Year Low High Greater Jakarta Estimated Cost per Member per Month in Rp.
Annual total expenditures in trillions of Rp. 2010 30 37 52 2015 65 82 130 2020 127 159 221
Annual total expenditures as % of GDP 2010 0.50% 0.62% 0.88% 2015 0.81% 1.01% 1.61% 2020 1.17% 1.46% 2.03%
Annual total expenditures as % of government expenses 2010 2.85% 3.56% 5.00% 2015 4.62% 5.78% 9.21% 2020 6.66% 8.33% 11.58%
Source: Guerard (2010).
Even under the worst case scenario, our projections show the total cost of UC will be only 2.03 percent of GDP in 2020. This is low for a middle-income country and is less than most other comparable countries in the region are spending. However, these amounts do not include public spending for any other health activities such as health promotion, surveillance, or training. They also largely represent prospective spending by the national government on publicly mandated HI coverage. As such, significant amounts of potential spending by provincial and local governments are not reflected in these figures.
Moreover, these figures do not reflect any private health spending which currently accounts for about one-half of Indonesia’s total health spending. In theory, OOP expenditures under these scenarios should reduce significantly due to improvements in health system quality and elimination of excess billing. However, there will still be some private spending due to individuals opting for better amenities (that is Class I or II beds) and higher quality services. Private spending could also remain high if there is dissatisfaction with the quality of the public system and this could also undermine equity and cost-containment objectives as well as public support for the government’s health programs. Policy makers need to be concerned about all components of health spending–government-supported insurance, other government health spending and private health spending.
16
While the increases, even under the Greater Jakarta scenario, appear manageable, this is driven by a number of key assumptions including the exclusion of Class I and II hospital beds, managed care with emphasis on primary care, negotiated rates and a focus on equal treatment for all. Lastly, Indonesia’s historically low levels of health spending and relatively low utilization levels are also due to supply constraints and large amounts of self treatment due to cultural reasons and the perceived poor quality of the health system.
Box 3-1: Elasticity Factors: Further Discussion One of the more difficult tasks is estimating the elasticity rates to apply to medical care costs in developing countries like Indonesia. Historically, the elasticities of health spending relative to GDP (that is the percentage change in health spending relative to the percentage change in GDP) vary substantially by country income classes. The following table displays these elasticities from the WHO National Health Accounts Database for 1995-2009 for total, public, and private health spending.
Country grouping Total Public Private OECD 1.24 (0.29) 1.23 (0.34) 1.22 (0.50) High-Income Non-OECD
0.98 (0.24) 0.97 (0.28) 0.99 (0.31)
Upper Middle Income 1.06 (0.22) 1.07 (0.21) 1.05 (0.37) Lower Middle Income 1.14 (0.40) 1.25 (0.46) 1.04 (0.58) Low Income 1.09 (0.21) 1.13 (0.33) 1.04 (0.23) Indonesia 1.12 1.32 0.97
Note: Data are from WHO 1995-2009 NHA Database. Standard deviation in parentheses.
The elasticity reflects increases in medical care costs due to inflation, changes in treatment protocols, greater use of technology and other institutional factors including provider payment policies and cost-containment mechanisms. However, elasticity is just one component of the increase in medical care costs. The total increase in the cost of care also includes the increase in the size of the population and population aging. We use the OECD total elasticity assumptions to project the increase in the baseline CMPMs by age and geographic region. These CMPMs are then multiplied by the projected age, sex and geographic distribution of the entire Indonesian population to estimate the total future cost of medical care. An argument could be made that the OECD total elasticity assumption is not appropriate for Indonesia. However, we assumed that as the program expanded to cover the entire population, the system would become more mature and the rate of medical care cost increases would approach those for more mature Western systems. In addition, as the public-private mix is also in flux, we choose to use the OECD elasticity for total as opposed to public health spending. Arguments can also be made that the rate of increase should be higher or lower than what we assumed. On the one hand, Indonesia’s total health spending is only about 2 percent of GDP while other low-middle income countries are spending about 4.4 percent of GDP on health. In order to catch up to the norm, Indonesia’s health spending might need to increase even more rapidly. On the other hand, the elasticity rate for low and low-middle income countries is less than for OECD countries, so it could be argued that the elasticity rates for this study should be lower. Ultimately, the rate of increase will depend on government policy–whether the GoI chooses to continue to underemphasize health care relative to other sectors or chooses to increase spending on health care to catch up with other countries at similar levels of development. In our opinion, universal health care will put more pressure on the government to increase health care spending, to improve both the quality and quantity of available care. Consequently, we believe the assumptions used in this study are a reasonable estimate of likely outcomes.
In analyzing the public expenditure implications of the alternative scenarios, it is important to reiterate that only the expenditure side of the government ‘balance sheet’ is being analyzed. No assumptions have been made about the sources of the government revenues needed to support and
17
sustain these expenditures.10
3.2 ‘Jamkesmas For All’ Scenario
Revenues can come from nontax sources such as sales of natural resources, general government tax revenues, earmarked taxes, and required contributions by firms and individuals. The GoI will need to make specific policy choices to find the revenues to finance the new UC system, and these choices need to be thoroughly analyzed.
Early in the debate on UC, the option of extending Jamkesmas to the entire population was discussed. While some have argued that such a policy is not consistent with the 2004 Social Security legislation, from a pure policy option and cost perspective, it is worth considering. It should be noted however, as this package only covers public services, that the expenditure increase illustrated is exclusive of the significant share of the expenditures that would need to be financed through OOP payments by individuals.
In assessing the costs of ‘Jamkesmas For All’ options, it is important to know what baseline spending under Jamkesmas was in 2008 and would be in the 2010 baseline year if current eligibility levels are maintained. As previously discussed, in 2008 Jamkesmas covered 72.6 million people and official expenditures were Rp 3.6 trillion.11
If we assume the Askes and Jamkesmas programs provide roughly comparable benefits, cover the same target population and compensate providers the same way, then the costs of the two programs should be very similar. For this reason, we chose to use our Askes data to estimate the likely cost of a ‘Jamkesmas For All’ program and we made the following additional assumptions:
This implies a CMPM of just Rp 4,132 per month for a program with a benefit package that is more generous than the current Askes program. In our opinion, these numbers are inconsistent with the Askes claim data and consequently, we did not use the Jamkesmas claims data to estimate the likely cost of a ‘Jamkesmas For All’ program.
• The Jamkesmas program would be gradually expanded to include the entire population;
• The Jamkesmas program design and delivery would remain unchanged;
• Coverage would be 50 percent in 2010, expanding to 75 percent by 2015 and 100 percent by 2020; and
• Given capacity constraints, patients will use both public and participating private facilities, and those choosing more expensive facilities will absorb the extra cost themselves or purchase private insurance policies. This is broadly consistent with current dual practice options and practices regarding excess billing.
The assumption made in the projections is that the estimated CMPM is sufficient to obtain services from public institutions with little or no OOP and is made available to all patients whether they use private or public services. This means providers would invoice the program for the preset agreed tariffs, but would be allowed to bill additional amounts to the patients or private insurers for the extra costs over and above what is publicly reimbursed.
The consequence is that the program would essentially incur the full expenditures for health services to the whole population at the cost level associated with public health providers and institutions, while patients would have the choice of participating providers. That would allow more flexibility in the utilization of resources but would not meet the objective of equal treatment for all since those who can afford the extra billing or have complementary insurance have more flexible access 10 An earlier publication by the World Bank (Fiscal Space for Health: Giving More Weight to Health) lays out different revenue possibilities for health expenditures. 11 We are using NHA 2008 data (WHO) for ratio calculations.
18
Table 3-4: Expenditures of ‘Jamkesmas For All’ Program Year National GJKT
to health care. Further, it is assumed that Jamkesmas utilization would rise gradually to similar levels as Askes but only at the standard (Class III hospital bed) level, so there are no assumed changes to the benefit package.
Based on these assumptions, we used the baseline 2010 CMPM for the Askes program with no loading for subsidies, OOP expenses and administrative costs as the basis for estimating the cost of such a program. Using the actual age and geographic composition of the current Jamkesmas population, such a program would have an estimated CMPM of Rp 11,414. If the actual age and geographic composition of the entire population is used, the CMPM is Rp 11,671. Although this is above the official CMPM for the Jamkesmas program, it seems reasonably consistent with our understanding of the true cost of the program today.
Table 3-4 shows the expenditures for this scenario. There are no ‘low’ and ‘high’ scenarios for this option, since there are no loadings for reduced subsidies and OOP. The practice of excess billing explicitly remains. Administrative expenses are also assumed to be paid by the government. Instead, we calculated costs on two different bases–assuming expenditures at the national average level for Askes and assuming expenditures at the Greater Jakarta level.
At first glance, the government may conclude that this is the best design for universal coverage because it appears to be so much cheaper than other options (see Table 2-7 on page 15) we have presented. While it may be a viable option, the government should be cautious about adopting this approach, as it carries significant political and financial risk.
• While the CMPM may be lower under this option than the alternatives, members will incur significant OOP expenses when seeking services, particularly at participating private health facilities.
• The government budget will continue to subsidize the cost of the health program by paying for the salaries and capital costs at public health facilities.
• The government will have a financial incentive to keep supply-side constraints in place.
• The system will remain highly inequitable. Wealthier Indonesians will have significantly better and more flexible health care options than the poor.
• There will be less incentive for the government to improve the quality of the public health system, particularly for outpatient care, since the poor will primarily use these facilities while the wealthy will go to private doctors and pay the additional cost from their own pocket. If more members choose to go outside the system for care, the cost of the public UC program will be cheaper.
• These costs assume existing levels of supply-side constraints remain in place. These constraints can lead to long waiting times for services, under-the-table payments for treatment and denial of promised benefits. If service availability and quality are improved over time, the CMPM will be significantly higher than what is shown in Table 3-4.
19
• If the system is based on the SHI model, members may resent having to make contributions to the fund while also incurring high OOP expenses. Wealthier Indonesians will also have an incentive to try to avoid participating in the national health insurance scheme.
While the CMPM may be lower under this option, the cost to the government budget will be higher. Any real savings will come from reduced utilization caused by high OOP costs and individuals choosing to go outside the system at their own expense to receive better care. System costs are kept low through severe health care rationing and significant OOP expenses.
This option carries a high risk of rapid cost escalation after the start of the new system. Member complaints about poor quality, inability to get promised benefits and poor health outcomes may lead to political pressure to improve the system, and to expand the number of public and private providers participating in the system.
20
IV. Alternative Policy Choices for Transition to Universal Coverage
Full universal coverage is clearly not the only policy choice available to the government, especially if resources are scarce. Many other countries have scaled up to UC by first covering vulnerable groups like pregnant women, children and the elderly, or alternatively, only covering primary care or starting with underserved remote areas first.
The section analyzes different scenarios to achieve UC by phasing in coverage for pregnant women and children under age 15 first. However, in interpreting the results below it is important to keep in mind that the projected expenditure increases would duplicate some expenditures being made through current government-funded public health programs. While such duplication also would occur to some extent in the full UC options, it would be much less significant because, under full UC, the bulk of spending would be for curative care directed to individuals, not public health-related services.
These estimates also do not take into account that some members of the covered group already have coverage for maternity and child care through Jamkesmas or other SHI programs. We have shown the full expected cost under the new UC program. In reality, these costs would be offset by the savings in benefit payments under the existing programs. The incremental cost would be the full cost for those who are currently not covered by any program plus the improvement in the benefit package for those who already have coverage.
4.1 UNIVERSAL COVERAGE OF MATERNITY CARE
One scenario discussed and requested by the GoI is to start with UC of all maternity care. Maternal health is one of the key priorities of the government and the Ministry of Health. Despite past efforts, the incidence of preventable maternal death remains high and more efforts are needed to address the constraints women face when in need of care. The illustrated benefit package includes coverage for antenatal care and delivery, and it also includes transport expenditures for those who need it.
Table 4-1 describes the design and estimated costs of the assumed benefit package for UC maternity care. The calculations are based on the cost of the benefit package multiplied by the estimated number of births.12
The primary assumptions used to calculate the estimated cost are as follows:
The cost basis in this scenario is not derived from existing Askes data but rather from an estimate of actual costs based on interviews and data obtained from those working in the health sector.
• The proportion of deliveries in hospital and Puskesmas is assumed to reach 75 percent by 2020;
• Ten percent will incur complications and up to 6 percent may require C-Sections;13
• Cost of drugs is estimated at 25 percent of professional fees;
• Estimates include four antenatal care visits;
• Transportation is provided in rural areas for the four antenatal care visits plus delivery; and
• Per diem allocation for two persons for six days are included to allow pregnant mothers to travel accompanied and in advance to a facility when necessary to ensure timely availability of delivery support.
12 Instead of pregnancies we will use births–data is based on the number of live births increased by an assumed percentage to account for still births or abortions. 13 These estimates are based on worldwide experience and estimated occurrences of complications and need for C-sections.
21
Table 4-1: Antenatal and Delivery Benefit Package Design Care Component Estimated
cost in Rp in 2010
Description
I. BASIC DELIVERY EXPENSES Traditional Birth 145,000 Assisting 20% in 2010 with gradual decrease to 5% in 2020 Midwife 300,000 Assisting 35% in 2010 with gradual decrease to 20% in 2020 Puskesmas or private facility 500,000 Assisting 35% in 2010 gradually increasing to 45% in 2020 Hospital 850,000 Assisting 10% in 2010 gradually increasing to 30% in 2020 II. COST OF COMPLICATIONS Addition for C-section 1,850,000 6% of deliveries Abortion with Narcose 2,250,000 10% of estimated abortions Addition for other complications 500,000 10% of deliveries III. ADDITIONAL COSTS Medicines Applied on total fees Loadings for OOP and Subsidy Except traditional births and midwives Transport from rural areas 50,000 All except traditional births Per diem from rural areas 20,000 Per diem for 2 persons except traditional births and midwife Administration 10% of loaded total IV. ANTENATAL CARE EXPENSES Antenatal care 25,000 4 visits for all Medicines 25% On fees Loading for OOP and subsidy OOP, Subsidy Transport for rural areas 50,000 Antenatal visits rural Administration 10% on total
Source: Guerard (2010). Table 4-2: Expenditures of Universal Coverage for
Total Expenditures (trillions of Rp.) 2010 8 10 14
2015 12 14 23 2020 17 21 30
Total Costs as % of GDP 2010 0.14% 0.16% 0.23% 2015 0.15% 0.18% 0.28% 2020 0.16% 0.19% 0.28% Total Costs as a % of Government Expenditures 2010 0.79% 0.94% 1.30% 2015 0.84% 1.01% 1.63% 2020 0.91% 1.10% 1.58%
Source: Guerard (2010).
Table 4-2 shows the per birth expenditures and annual total expenditures in real terms. Four scenarios are presented based on the same earlier constructed baselines.
The annual expenditure per birth for maternal care should not be compared to the CMPM under the Askes and Jamkesmas scenarios. Those costs were expressed per member and per month. These costs are annual and are per birth, not per member. Costs as a percentage of GDP should be compared to look at the comparative costs of maternal care only versus a larger benefit package. For example, the cost in 2010 as a percentage of GDP under the high scenario is 0.16 percent for maternal only and 0.62 percent for the Askes package. Even that comparison may not give a completely valid comparison as two different methodologies were used to calculate the two numbers.
22
Table 4-4: Cost of Universal Coverage for Children under the Low Scenario
In addition to maternal health, child health care is a high priority for the Government of Indonesia. Although child mortality has declined substantially and Indonesia is set to attain the MDG for child mortality by 2015, child health remains a serious concern and increasing access to care for children by removing financial barriers will help improve child health, especially among the poor in rural and remote areas.
The estimates shown in Table 4-3 below are based on the number of children below age 15 and the Askes age-specific rates for the three age groups 0-4, 5-9 and 10-14. The cost of full UC coverage for this segment of the population is estimated under the usual three sets of assumptions. Total expenditures to cover all Indonesian children under the age of 15 under the “Low” and “High” cost scenarios would amount to Rp 20 trillion and Rp 25 trillion respectively in 2020 (0.19 percent and 0.23 percent of GDP and 1.06 percent and 1.33 percent of total expenditures respectively).
We also calculated the cost of universal coverage of child care on two other bases: (i) only children under age 5 are covered; and (ii) coverage of all children under age 15 was phased in over time. Only those under age 5 were initially covered. In each subsequent year, the age limit was raised by one year until all children under age 15 are covered by 2020. Under this option, in 2011, children under age 6 would be covered (all the children covered in the prior year plus children born in the current year). Table 4-4 compares the cost of these three options under the Low scenario in 2010, 2015 and 2020.
Note that the monthly cost per child decreases as the size of the age group increases. Costs are highest for the 0-4 age group, are lower for the 5-9 age group, and are lower still for the 10-14 age group. As the age of the covered group is increased, the number of children increases but the cost per child decreases. In 2010, if only children 0-4 are covered, the cost is 0.12 percent of GDP, but if all children 0-14 are covered, the cost increases to only 0.19 percent of GDP.
23
V. Summary of Results and Conclusions This work follows closely the earlier World Bank report Health Financing in Indonesia; A Road Map for Reform. This Note presents a subset of the possible UC transition scenarios and their related costs. These scenarios were selected based on initial discussions with key stakeholders, and further broad-based discussion with stakeholders will be needed to finalize the design, financing and transition options.
The cost of a health insurance program will largely be determined by the size and composition of the covered population, the benefit package, cost sharing arrangements, the current and future supply of health care providers and facilities, and the provider payment mechanisms used. Indonesia’s goal is to provide universal coverage, so the covered population decision has already been made. Due to data limitations, we have assumed the supply-side shortage remains at its current level as a percentage of demand throughout the analysis period. Putting aside provider payment mechanisms which are being addressed in separate studies, this leaves the benefit package and cost sharing as the primary determinants of total expenditures.
It’s useful to look at the existing health programs in Indonesia today to see how they control costs and ration care:
• Askes and Jamsostek: The Askes program for civil servants is theoretically a rich benefit package providing all services to members at little or no cost, however, in practice the quality of care at many public facilities is perceived to be poor. Since the members are well educated and have relatively high and steady salaries, many members choose to go outside the system and pay the full expense in order to get quality outpatient care. For more expensive procedures requiring hospitalization or surgery, however, members generally choose to use their insurance and get needed services from public facilities. Those who seek care at more expensive public hospitals, however, may have to pay the portion of the invoice in excess of the Askes reimbursement amount.
The end result is that the Askes program operates in practice like a catastrophic care program. For routine outpatient care, members pay out-of-pocket, but for more serious and expensive treatment, they use their insurance. Costs are controlled by effectively requiring members to pay for primary care out-of-pocket and by excess billing for more complex procedures performed in more expensive facilities. Similar comments can be made for the Jamsostek program, though Jamsostek’s health program also specifically excludes coverage for many expensive procedures.
• Jamkesmas: The Jamkesmas program is for the poor and near poor and also promises a rich benefit package at public facilities. The poor are generally from the informal sector and a much higher percentage live in rural areas than for the Askes program. The near poor occasionally go to private facilities at their own expense, but for the most part both the poor and the near poor use the public system or traditional medicine. This creates a two-tier medical system in the country. The poor receive lower-quality care at public institutions at little or no cost while the wealthy go to private doctors at their own expense. For more serious medical conditions, the poor must compete with the wealthy for hospital and surgical treatment at public facilities. The supply of such services is limited in Indonesia. Here patients who can afford to pay or who have better insurance tend to get preferential treatment. The wealthy are more likely to get needed care while the poor may be put on a waiting list or not receive needed care at all. Cost in this system is controlled by limiting membership, lack of understanding of the program and how to use its benefits, and by strict rationing of more expensive services.
24
If Indonesia decides to provide a comprehensive benefit package for everyone, the primary methods of cost control available are charging OOP fees and rationing services (and assuring efficient provision through results-based provider payment systems). In such a system, payment from the national health care system will likely be for the cheapest method of treatment by the least experienced practitioners. Those who want better quality care from more experienced doctors at better facilities will pay for it from their own pocket. This will create a two-tiered health system in the country. Those who are wealthy can choose to pay for higher quality care if they wish while those who are poor will be forced to accept those services that are free. System costs would be further controlled by rationing. The number of doctors and hospitals available for expensive tertiary care is very limited. If everyone is covered for catastrophic care, it is likely that the system would not be able to cope and waiting lists and under-the-table payments would inevitably develop. This system would likely allow universal access to public primary care for everyone at no cost, but not much more. It is also highly questionable whether such a system is consistent with the SJSN law.
Another option for Indonesia is to provide a more limited package of benefits to everyone with little or no OOP expenses and limited budget subsidies to public facilities. Under this model, the expected cost of the system is controlled by promising a more limited benefit package. Members would have free choice of public or private providers without additional OOP expense. The question is which services will be covered and which will be excluded.
Ideally this system would cover those services accounting for the largest burden of disease as well as those services that, if paid for privately, could drive people into poverty. Unfortunately there are tradeoffs here. A catastrophic care system like the current Askes program would meet the needs of the wealthy. They can afford to pay for routine medical care and pharmaceuticals out-of-pocket and need protection against financial catastrophe caused by a serious medical condition. A primary care system would meet the needs of many of the poor. It would give them access to doctors and pharmaceuticals as needed for routine medical conditions. But it would leave both the poor and the wealthy financially exposed to the costs of a serious illness. The wealthy, however, would have the option of purchasing private health insurance to cover these catastrophic expenses. Indonesian policy makers need to look at how much the country can afford to spend on medical care, decide who should pay for those costs, and design a system that meets the country’s social goals.
In this Note it is have shown how decisions regarding the transition steps, benefit package and the choice of eligible population affect public HI expenditures as Indonesia transitions to UC. In addition to these initial choices, the Note also looks at the impact of subsequent decisions on how fast to increase coverage and whether to cover the entire population or vulnerable groups first. Another purpose of this Note is to assist the GoI in the development of an actuarial model for decision making that reflects the multitude of policy choices that need to be made as the country transitions to universal health insurance coverage. The intent of the different scenarios is to demonstrate the importance and financial impact of the numerous decisions that need to be made regarding the transition paths to UC, the BBP and incremental eligibility changes.
Appendix 1 summarizes all of the cost estimates in this Note, expressed in 2010 rupiah, as a percentage of both GDP and government expenditures. Depending on the choices made, expenditures for publicly funded full or partial UC in 2020 vary from 0.14 percent for maternity only under the ‘Low’ scenario to 2.03 percent of GDP for current Askes coverage under the ‘Greater Jakarta’ scenario. These are large differences and policy makers will need to take a serious look at the composition of the benefit package and financial feasibility of the scenario that would best fit Indonesia at its current stage of development and with its available fiscal space. One must also keep in mind that these costs reflect only the costs of the publicly funded health insurance system, not other government
25
spending on health and not private health spending by individuals, private insurers, and firms. Given the obvious interrelationships and tradeoffs among the three categories, rational policy requires a holistic approach.
While the increases in public spending for publicly mandated HI coverage are relatively modest under most scenarios, and potentially affordable given Indonesia’s projected future fiscal space, decision makers must keep in mind a number of critical facts:
• For the full UC scenarios, the projected expenditures apply only to public spending for HI coverage. There will still need to be additional public spending by the Ministry of Health and other government agencies for basic public health programs and other noninsurance-related health spending.
• Indonesia’s base spending levels are low compared to other comparable income countries, and Indonesia faces major supply constraints both in terms of availability of personnel and facilities as well as limited access to sophisticated medical technologies. The estimates here do not account for a major scaling up on the supply side, but rather technology growth and cost pressures similar to mature OECD UC systems. Consequently, they do not fully reflect the capital costs of scaling up Indonesia’s extremely low supply-side base. Moreover, they do not reflect the potential impacts of alternative ‘results-based’ approaches for reimbursing medical care providers, an important area for efficiency gains. Efficiency gains are, in effect, an additional financing source.
• These estimates do not specifically capture the potential cost offset to UC from spending currently being made through MoH as well as provincial and local public health programs, thus potentially overstating the net expenditure increases to governments.
• There is no estimate of the impact of the various policy options on private health spending. This is an important caveat as a BBP restricted to Class III hospital beds as well as certain policies requiring use of public facilities will undoubtedly lead many members to pay out-of-pocket the full costs for private health services. It may orient private investments to serving high-income groups, increasing the pressure on public facilities and reducing accessibility for the general population.
• This Note focuses on the expenditure increases associated with various coverage expansion options. In order to assess the full impact on government, individuals, and the overall Indonesian economy, various methods of raising revenue to finance the program must be explored.
• This report is purely a health system expenditure analysis. It does not estimate the potential positive impact on individuals and the economy from universal access to health care and improved health outcomes.
Even though economic growth is stable and projected to remain between 5 and 7 percent in the coming years, an expansion in health expenditures based on the different scenarios can have important implications for the allocation of the budget among sectors. Clearly, some reallocation would be needed if Indonesia aggressively implements UC and decides on a comprehensive benefit package and a rapid scaling-up of its human resources and physical health infrastructure. Alternatively, Indonesia may decide on a more modest transition with a more limited benefit package and a more measured alleviation of supply-side constraints.
The most extensive, but also most resource-intensive UC scenario is the full coverage, Greater Jakarta scenario. This would allow all citizens the same access and choice of providers as is currently
26
available in Great Jakarta. Of course, given supply-side constraints and Indonesia’s geography, this option cannot be fully implemented in the short term. The maternal care and child care options are potential transition options focused on vulnerable groups that would address the serious current problems in maternal and child mortality. However, as with the universal coverage for all, it would require the supply side to be ready as well.
Another important point of this exercise is to emphasize the need for the government to develop a robust social security modeling capability for the health program and the other SJSN programs. Combinations of Excel worksheets can be used to generate some results but such an arrangement is not robust enough and not suitable for the analysis of the long-term impacts of different policy options under a range of economic and demographic scenarios covering fiscal, monetary, labor and social issues.
Models are a mathematical description of how a scheme’s financial position depends upon its design, performance and surrounding economic and demographic factors. It allows its users to measure the cash flows and other indicators under different sets of conditions. One of the main purposes of a model is to help policy makers understand the fundamental dynamic of a scheme. Indeed, a model is a powerful tool to illustrate, study and analyze how economic and demographic changes and different provisions interact to affect various aspects of the performance of a system, including fiscal sustainability and social adequacy and fairness. It also serves to assess the impact of various reform scenarios on existing systems. Better data would enable more accurate cost projections to be made but these need to be updated regularly as experience emerges and the socioeconomic environment evolves. Modeling is a recurring exercise, which improves with usage. Model results can be a management tool and can be used as the benchmark for monitoring and providing early warnings.
Governments are key users of actuarial expertise and in some countries it has been found efficient to regroup the actuaries within a special unit. In the UK, for example, this is called the Government Actuarial Department (GAD) and in other countries, the Office of the Actuary. Given the relatively small size of the actuarial profession, it is a way to reach a critical mass that facilitates peer review and quality control. As the GoI has very few actuaries on staff, it could benefit from the availability of such a neutral source to outsource some work that cannot be done internally on a timely basis. This process could lead to the eventual development of an Office of the Actuary in Indonesia which, in turn, could become an alternative source of actuarial expertise for social security work, increasing the depth of available resources.
We hope this report assists the government in estimating the likely costs of various options for moving to universal care and provides an understanding of the factors that affect the ultimate cost of a UC program. The World Bank looks forward to continue working with the government to help it make critical design decisions and develop a health modeling capability to manage the risks associated with the UC program.
27
Baseline Data for Cost per Member per Month (CMPM) Based on Askes Data
Baseline range and future costs
Askes 2008: National Rp 15,879
Adjusted by : • Remove additional cost for
class I & II • Increase CMPM capitation
fee by Rp 1000 • Correct underexposure
ages 0-14
Adjusted by: • Medical fee increases
of 20% • Pharmaceutical cost
increases of 10% • Age specific rates
Population 2010 adjusted National Rp 11,671
Greater Jakarta baseline Assumptions: • Add 10% administration cost • Both Supply side subsidy and OOP costs
are set to 50% • GJKT cost levels for entire population • Future costs are increased gradually to
reach Higher case Greater Jakarta Population costs by 2020
CMPM: Rp 36,029
Low baseline Assumptions: • Add 10% administration cost • Both Supply side subsidy and OOP
costs are set to 30% • Future costs increase by elasticity
except for Greater Jakarta population where the increase is 3%/year
CMPM: Rp 20,542
High baseline Assumptions: • Add 10% administration cost • Both Supply side subsidy and OOP
costs are set to 50% • Future costs increase by elasticity
except for Greater Jakarta population where the increase is 3%/year
CMPM: Rp 25,677
Population 2010 loaded
Appendix One - Cost Summary
• Same level of supply constraints as exists today. Excludes adverse selection and assumes a normal pooling of good and bad risks. • Amounts in Rupiah are expressed in real terms. There is no adjustment for inflation. • The amounts include only public expenditures on health insurance. Government budget spending and OOP costs are excluded.
Estimated Cost for Achieving Universal Coverage for All Indonesians Gradually (2010:50%, 2015:75%, 2020: 100%) Scenario Low case High case Greater Jakarta case Year 2010 2015 2020 2010 2015 2020 2010 2015 2020 CMPM 20,542 28,442 39,835 25,677 35,553 49,793 36,029 56,705 9,222 Annual exp (trillions of Rp)
30 65 127 37 82 159 52 130 21
Estimated Cost for Expanding Jamkesmas to Entire Population Scenario National Greater Jakarta case Year 2010 2015 2020 2010 2015 2020 CMPM 11,671 16,160 22,633 16,377 25,775 31,465 Annual exp (trillions of Rp)
17 37 72 24 59 101
Assumptions: a) Only for Class III coverage, large number of people not seeking care due to poor quality. No reduction in subsidies or OOP expenses. Administrative costs paid by government
Estimated Cost for Maternity Care - Universal Coverage Scenario Low case High case Greater Jakarta case Year 2010 2015 2020 2010 2015 2020 2010 2015 2020 Annual cost per birth 1,582,117 2,314,200 3,407,389 1,868,022 2,773,292 4,136,806 2,593,496 4,454,219 5,913,974 Annual exp (trillions of Rp)
Assumption - Short term abortion not covered - Estimated include 4 times ANC visit - Proportion delivery in hospital 75% by 2020 - 10% complication, 6% require c-sections - Cost of drug 25% professional fee - Per diem 2 person for 6 days
Estimated Cost for Children < 15 years old - Universal Coverage Scenario Low case High case Greater Jakarta case Year 2010 2015 2020 2010 2015 2020 2010 2015 2020 Monthly cost per child 14,925 19,714 26,650 18,656 24,643 33,312 22,189 29,328 33,730 Annual exp (trill. Rp) 11 15 20 14 19 25 17 22 26 Note : Estimated number of children < 15 years old : (2010:62.919.300) (2015:63.907.900) (2020:63.403.800)
28
Scenarios Total Annual Expenditures as % of GDP Total Annual Expenditures as % of Gov’t Expenditure