Acute Effects of Increase in Pulmonary Vascular Distending Pressures on Pulmonary Blood Volume and Pulmonary Extravascular Fluid Volume in Man STEPHEN M. AUSTIN, M.D., BERNARD F. SCHREINER, M.D., PRAVIN M. SHAH, M.D., AND PAUL N. YU, M.D. SUMMARY The acute hemodynamic effects of supine leg exercise or atrial pacing were studied in 114 patients undergoing right and either transseptal (87 cases) or retrograde (27 cases) left heart catheterization. Seventy-one patients - 15 with coronary artery dis- ease, 22 with aortic valve disease, and 34 with mitral valve disease - performed exercise on a bicycle ergometer. Forty-three patients, of whom 22 had coronary artery disease, nine aortic valve disease and 12 mitral valve disease, were studied during rapid atrial pacing. Cardiac index (CI), pulmonary artery mean (PAm), and left atrial mean (LAm) pressure, pulmonary blood volume (PBV) and pulmonary ex- travascular volume (PEV) were measured during the control state and during acute intervention. Both exercise and pacing resulted in significant elevations in PAm (range 37-65%) and LAm (range 36-43%) mean pressures in all patients. Cardiac index rose between 34 and 58% in the exercise groups, but did not change in those who were paced. During intervention both PBV and PEV increased significantly in all but the nine patients with aortic valve disease who PREVIOUS STUDIES from this and other laboratories have examined the relationships of pulmonary blood volume (PBV) and pulmonary extravascular fluid volume (PEV) to clinical and hemodynamic parameters among patients with cardiac disease.' Studies in subjects with normal hemo- dynamics and in patients with valvular or myocardial heart disease have indicated that the PBV tends to increase above the normal range among American Heart Association func- tional Class III patients as left atrial mean and/or left ven- tricular end-diastolic pressures rise.1-4 However among Class IV patients with chronic left atrial hypertension of either myocardial or valvular etiology, the PBV tends to be normal or even subnormal.'-' Since pressures in the pulmonary artery and left atrium are greatly elevated, pulmonary vascular compliance is severely reduced in com- parison to less incapacitated patients. In contrast there is a progressive rise in PEV in patients with increasing degrees of left atrial hypertension, functional impairment and radiologic evidence of pulmonary "'vascu- lar" congestion." ` Thus the ratio of PEV/PBV increases, suggesting that the PEV is more sensitive than the PBV to pressure elevations within the pulmonary circulation.5 8 In patients with left atrial hypertension secondary to acute myocardial infarction, elevations in PEV have been found to From the Cardiology Unit, Department of Medicine, University of Rochester Medical Center, Rochester, New York. Supported in part by grants HL 03966, HL 05500, and contract NO 1 HV 81331 (MIRU) from the National Heart and Lung Institute, National Institutes of Health, Bethesda, Maryland. This work was done during Dr. Shah's tenure as an American Heart Association Teaching Scholar Award. Address for reprints: Dr. Bernard F. Schreiner, Cardiology Unit, Strong Memorial Hospital, 601 Elmwood Avenue, Rochester, New York 14642. Received October 11, 1974; revision accepted for publication September 8, 1975. 356 were paced. Although volume increases occurred, they did not achieve the 5% significance level. For all patients the mean increment in PBV ranged between 37 and 123 ml/ml over control, while PEV rose between 15 and 35 ml/m'. In each group the increases in PEV and PBV were proportionate, so that the ratio of PEV/PBV did not change significantly between the control and intervention states. Thus PEV and PBV increases occurred with elevations in pulmonary vascular pressures whether or not blood flow increased. Our data in patients with normal pulmonary vascular beds (i.e., coronary artery disease and aortic valve disease) strongly support the hypothesis that recruitment of vascular channels accounts for the acute changes in PEV and PBV and that the changes in PEV over a brief period of time do not necessarily reflect a "true" increase in extravascular lung water. Although pressures are higher in the lungs of patients with mitral valve disease, the data also suggest that recruitment is likely to be the mechanism for the observed proportionate increase in pulmonary extravascular volume and pulmonary blood volume. correlate directly with clinical and radiologic manifesta- tions of congestive heart failure.10 The purpose of this study is to investigate the changes in PEV and PBV during acute interventions in which pulmo- nary vascular pressures and flow increase concomitantly (supine exercise) and in which only pulmonary vascular pressures increase (atrial pacing) in patients with valvular or coronary artery disease. Materials and Methods One hundred and fourteen adult patients undergoing diagnostic cardiac catheterization were investigated. The study was approved by the Clinical Investigation Committee of this University and informed consent was obtained from each patient. Although the patients do not represent a con- secutive series, only two criteria were used for exclusion: I) cardiovascular compromise deemed too advanced to permit safe hemodynamic intervention; and 2) valvular regurgita- tion causing significant distortion of indicator dilution curves. Thirty-seven patients had coronary artery disease. Of these 15 were exercised and 22 were paced. Among the 31 patients with aortic valve disease all of the nine who were paced had predominant aortic stenosis. Twenty-two patients were exercised, of whom nine had aortic stenosis, ten aortic regurgitation, and three mixed lesions. Forty-six patients had mitral valve disease. Exercise was performed by 34 patients of whom 27 had pure or predominant mitral stenosis. In none of the latter group did the left atrial mean pressure exceed 18 mm Hg during the control state. Six patients had nonrheumatic mitral regurgitation and one was a postoperative patient who had a Starr-Edwards mitral valve prosthesis for predominant mitral stenosis. The 12 by guest on June 14, 2018 http://circ.ahajournals.org/ Downloaded from
Transcript
Acute Effects of Increase in Pulmonary VascularDistending Pressures on Pulmonary Blood Volumeand Pulmonary Extravascular Fluid Volume in Man
STEPHEN M. AUSTIN, M.D., BERNARD F. SCHREINER, M.D., PRAVIN M. SHAH, M.D.,
AND PAUL N. YU, M.D.
SUMMARY The acute hemodynamic effects of supine leg exerciseor atrial pacing were studied in 114 patients undergoing right andeither transseptal (87 cases) or retrograde (27 cases) left heartcatheterization. Seventy-one patients - 15 with coronary artery dis-ease, 22 with aortic valve disease, and 34 with mitral valve disease-performed exercise on a bicycle ergometer. Forty-three patients, ofwhom 22 had coronary artery disease, nine aortic valve disease and 12mitral valve disease, were studied during rapid atrial pacing. Cardiacindex (CI), pulmonary artery mean (PAm), and left atrial mean
(LAm) pressure, pulmonary blood volume (PBV) and pulmonary ex-
travascular volume (PEV) were measured during the control state andduring acute intervention. Both exercise and pacing resulted insignificant elevations in PAm (range 37-65%) and LAm (range36-43%) mean pressures in all patients. Cardiac index rose between34 and 58% in the exercise groups, but did not change in those whowere paced. During intervention both PBV and PEV increasedsignificantly in all but the nine patients with aortic valve disease who
PREVIOUS STUDIES from this and other laboratorieshave examined the relationships of pulmonary blood volume(PBV) and pulmonary extravascular fluid volume (PEV) toclinical and hemodynamic parameters among patients withcardiac disease.' Studies in subjects with normal hemo-dynamics and in patients with valvular or myocardial heartdisease have indicated that the PBV tends to increase abovethe normal range among American Heart Association func-tional Class III patients as left atrial mean and/or left ven-
tricular end-diastolic pressures rise.1-4 However among
Class IV patients with chronic left atrial hypertension ofeither myocardial or valvular etiology, the PBV tends to benormal or even subnormal.'-' Since pressures in thepulmonary artery and left atrium are greatly elevated,pulmonary vascular compliance is severely reduced in com-
parison to less incapacitated patients.In contrast there is a progressive rise in PEV in patients
with increasing degrees of left atrial hypertension, functionalimpairment and radiologic evidence of pulmonary "'vascu-lar" congestion." ` Thus the ratio of PEV/PBV increases,suggesting that the PEV is more sensitive than the PBV topressure elevations within the pulmonary circulation.5 8 Inpatients with left atrial hypertension secondary to acutemyocardial infarction, elevations in PEV have been found to
From the Cardiology Unit, Department of Medicine, University ofRochester Medical Center, Rochester, New York.Supported in part by grants HL 03966, HL 05500, and contract NO 1 HV
81331 (MIRU) from the National Heart and Lung Institute, NationalInstitutes of Health, Bethesda, Maryland.
This work was done during Dr. Shah's tenure as an American HeartAssociation Teaching Scholar Award.
Address for reprints: Dr. Bernard F. Schreiner, Cardiology Unit, StrongMemorial Hospital, 601 Elmwood Avenue, Rochester, New York 14642.
Received October 11, 1974; revision accepted for publication September 8,1975.
356
were paced. Although volume increases occurred, they did not achievethe 5% significance level. For all patients the mean increment in PBVranged between 37 and 123 ml/ml over control, while PEV rosebetween 15 and 35 ml/m'. In each group the increases in PEV andPBV were proportionate, so that the ratio of PEV/PBV did notchange significantly between the control and intervention states. ThusPEV and PBV increases occurred with elevations in pulmonaryvascular pressures whether or not blood flow increased. Our data inpatients with normal pulmonary vascular beds (i.e., coronary arterydisease and aortic valve disease) strongly support the hypothesis thatrecruitment of vascular channels accounts for the acute changes inPEV and PBV and that the changes in PEV over a brief period oftime do not necessarily reflect a "true" increase in extravascular lungwater. Although pressures are higher in the lungs of patients withmitral valve disease, the data also suggest that recruitment is likely tobe the mechanism for the observed proportionate increase inpulmonary extravascular volume and pulmonary blood volume.
correlate directly with clinical and radiologic manifesta-tions of congestive heart failure.10The purpose of this study is to investigate the changes in
PEV and PBV during acute interventions in which pulmo-nary vascular pressures and flow increase concomitantly(supine exercise) and in which only pulmonary vascularpressures increase (atrial pacing) in patients with valvular orcoronary artery disease.
Materials and Methods
One hundred and fourteen adult patients undergoingdiagnostic cardiac catheterization were investigated. Thestudy was approved by the Clinical Investigation Committeeof this University and informed consent was obtained fromeach patient. Although the patients do not represent a con-secutive series, only two criteria were used for exclusion: I)cardiovascular compromise deemed too advanced to permitsafe hemodynamic intervention; and 2) valvular regurgita-tion causing significant distortion of indicator dilutioncurves.
Thirty-seven patients had coronary artery disease. Ofthese 15 were exercised and 22 were paced. Among the 31patients with aortic valve disease all of the nine who werepaced had predominant aortic stenosis. Twenty-two patientswere exercised, of whom nine had aortic stenosis, ten aorticregurgitation, and three mixed lesions. Forty-six patientshad mitral valve disease. Exercise was performed by 34patients of whom 27 had pure or predominant mitralstenosis. In none of the latter group did the left atrial meanpressure exceed 18 mm Hg during the control state. Sixpatients had nonrheumatic mitral regurgitation and one wasa postoperative patient who had a Starr-Edwards mitralvalve prosthesis for predominant mitral stenosis. The 12
by guest on June 14, 2018http://circ.ahajournals.org/
patients who were paced had advanced mitral stenosis andwere in sinus rhythm. No patient with critical aortic stenosisor severe mitral stenosis was exercised.
All patients underwent simultaneous right and eithertransseptal (87 patients) or retrograde (27 patients) left heartcatheterizations. Cardiac output and PBV (in those patientswith transseptal left heart catheterization) were determinedat least in duplicate at rest by the indicator dilution tech-nique, as reported previously from this laboratory.4Pulmonary blood volume was not calculated in the patientswho had retrograde left heart procedures. Indocyanine green
was injected sequentially into the main pulmonary artery(PA) and left atrium (LA) with sampling of dye from a
brachial artery cannula. The data were analyzed by an XDSSigma 3 computer for determination of cardian output andmean transit time of each curve using a program incor-porating the Stewart-Hamilton equation.2Pulmonary blood volume, defined as that volume in the
pulmonary arteries, pulmonary capillaries, pulmonary veinsand an indeterminate portion of the left atrium, was
calculated from the equation:
PBV = CI X (TmPA-BA- TmLABA)
where PBV = pulmonary blood volume (ml/m')= mean cardiac index (ml/m'/sec)
TmPA-BA = mean transit time of indocyanine green
from pulmonary artery to brachial artery(sec)
TmLA.BA = mean transit time of indocyanine greenfrom left atrium to brachial artery (sec)
Pulmonary extravascular fluid volume was measured bythe simultaneous injection of a mixture of radioisotopes,radioiodinated serum albumin, and tritiated water into themain pulmonary artery, as modified from Chinard andEnns."1 Sequential samples of 1.5 to 2.0 ml were collectedfrom the brachial arterial cannula at two second intervals.Plasma aliquots were analyzed in a three channel BeckmanLS 250 beta scintillation counter, as reported elsewhere.10The mean transit time was determined for each indicatorand PEV calculated by the equation:
PEV = CI X (TmTHO PA-BA) TmRISA(PA-BA)
where PEV = pulmonary extravascular fluid volume(ml/ml)
Cl = mean cardiac index (ml/m'/sec)TmTHO(PA-BA) = mean transit time of THO from
pulmonary artery to brachial artery(sec)
TABLE 1. Reproducibility of Duplicate DeterminationsBlood Volumes
TmRISA(PA BA. = mean transit time of RISA frompulmonary artery to brachial artery(sec)
The observed PEV was multiplied by a correction factorof 0.8, as suggested by Chinard et al.'2 and reportedpreviously from this laboratory.'0 In order to test thereproducibility of the method, duplicate measurements ofPEV over a 15-20 min period were made in 16 patients notincluded in this series in whom no hemodynamic inter-vention was made. The mean value was 138 ml/m2 with a
standard deviation of 15.6 ml/m2 (11.3% of the mean value)and a correlation coefficient of 0.96.
Duplicate PBV determinations at rest were made in all 87patients who had transseptal left heart catheterizations(table 1). The mean values of the duplicates varied by only 3ml/m2, and had a standard error of 2.6. This value comparesto our previous study on the reproducibility of the method in57 patients in whom the standard error of duplicate deter-minations of PBV was 2.1.4 During the interventions du-plicate determinations of PBV were available in 28 patientswho were paced and in 25 patients who were exercised. Thestandard errors of these duplicate measurements were 3.1and 4.5 respectively.
Pressures were recorded by conventional methods usingStatham P23DB transducers and a direct writing os-
cillograph (Brush Instruments, Model 480). Mean pressureswere obtained by electronic integration.
During the control period patient composure, heart rate,and constancy of intravascular pressures were monitoredover a 15 minute period. Initially two or three indicator dilu-tion curves were inscribed in order to accustom the patientto the procedure and to adjust amplifier gain. Deter-minations of PBV were then carried out in duplicate and ofcardiac index in quadruplicate. All blood sampled was
collected aseptically in a syringe and reinfused into thepatient. Because of the relatively large blood samples re-
quired for in vitro analysis, only one determination of PEVwas made. The ratio of PEV/PBV was computed.Pulmonary artery, left atrial, and systemic artery mean
pressures were recorded. During the intervention allparameters were repeated.
Supine leg exercise was performed on a bicycle ergometerwith a load sufficient to increase oxygen consumption two tothree times over the control value. Minute ventilation was
monitored by a wet test meter and oxygen consumption was
determined by analysis of oxygen content by the Scholandertechnique. Exercise was maintained for 10-15 min duringwhich a steady state was achieved.
of Cardiac Index, Mean Transit Times, and Pulmonary
Condition Number CI SEM TmPA-BA SEM TmLA-BA SENI PBV SEM
Abbreviations: CI = mean cardiac index (LM2in); SEM standard error of the mean difference; TmPA-BA = mean transit time frommain pulmonary artery to brachial artery (sec); TmLA-BA = mean transit time from left atritum to brachial artery (sec); PBV =pulmonary blood volume (ml/312).
357
by guest on June 14, 2018http://circ.ahajournals.org/
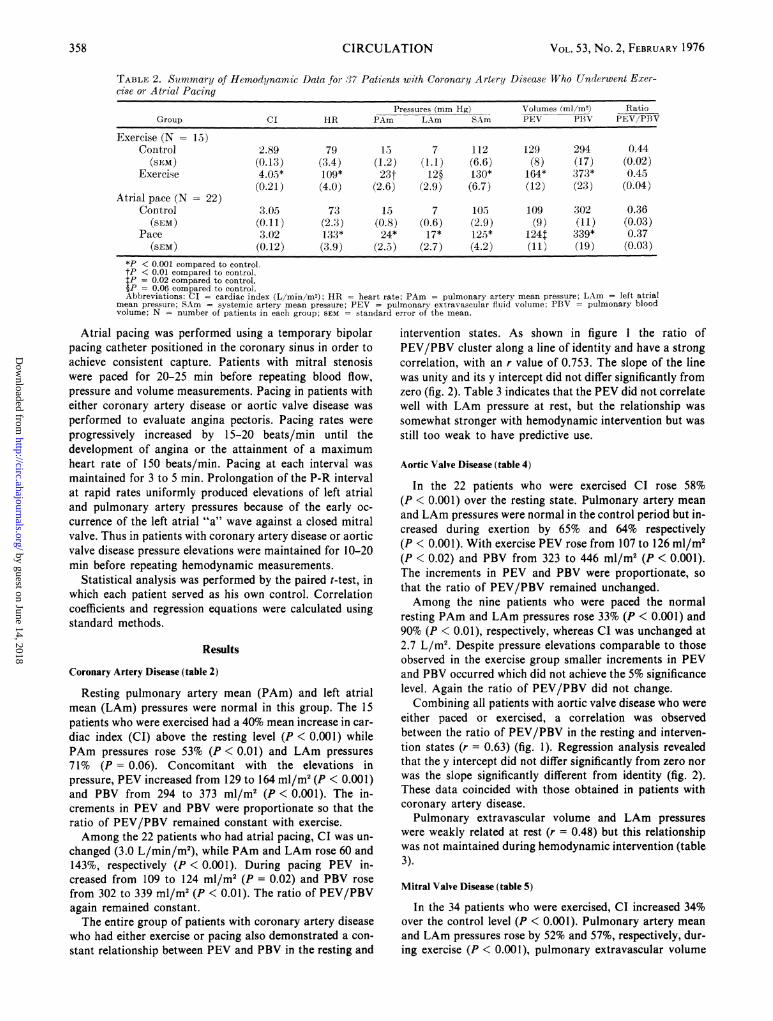
*P < 0.001 compared to control.tP < 0.01 compared to control.tP = 0.02 compared to control.-P= 0.06 compared to control.Abbreviations: CI - cardiac index (L/min/M2); HR = heart rate; PAm = pulmonary artery mean pressure; LAm left atrial
mean pressure; SAm systemic artery mean pressure; PEV = pulmonary extravascular fluid volume; PBV = pulmonary bloodvolume; N = number of patients in each group; SEM = standard error of the mean.
Atrial pacing was performed using a temporary bipolarpacing catheter positioned in the coronary sinus in order toachieve consistent capture. Patients with mitral stenosiswere paced for 20-25 min before repeating blood flow,pressure and volume measurements. Pacing in patients witheither coronary artery disease or aortic valve disease wasperformed to evaluate angina pectoris. Pacing rates wereprogressively increased by 15-20 beats/min until thedevelopment of angina or the attainment of a maximumheart rate of 150 beats/min. Pacing at each interval wasmaintained for 3 to 5 min. Prolongation of the P-R intervalat rapid rates uniformly produced elevations of left atrialand pulmonary artery pressures because of the early oc-currence of the left atrial "a" wave against a closed mitralvalve. Thus in patients with coronary artery disease or aorticvalve disease pressure elevations were maintained for 10-20min before repeating hemodynamic measurements.
Statistical analysis was performed by the paired t-test, inwhich each patient served as his own control. Correlationcoefficients and regression equations were calculated usingstandard methods.
Results
Coronary Artery Disease (table 2)
Resting pulmonary artery mean (PAm) and left atrialmean (LAm) pressures were normal in this group. The 15patients who were exercised had a 40% mean increase in car-diac index (CI) above the resting level (P < 0.001) whilePAm pressures rose 53% (P < 0.01) and LAm pressures71% (P = 0.06). Concomitant with the elevations inpressure, PEV increased from 129 to 164 ml/m2 (P < 0.001)and PBV from 294 to 373 ml/m2 (P < 0.001). The in-crements in PEV and PBV were proportionate so that theratio of PEV/PBV remained constant with exercise.Among the 22 patients who had atrial pacing, CI was un-
changed (3.0 L/min/m2), while PAm and LAm rose 60 and143%, respectively (P < 0.001). During pacing PEV in-creased from 109 to 124 ml/m2 (P = 0.02) and PBV rosefrom 302 to 339 ml/m2 (P < 0.01). The ratio of PEV/PBVagain remained constant.The entire group of patients with coronary artery disease
who had either exercise or pacing also demonstrated a con-stant relationship between PEV and PBV in the resting and
intervention states. As shown in figure 1 the ratio ofPEV/PBV cluster along a line of identity and have a strongcorrelation, with an r value of 0.753. The slope of the linewas unity and its y intercept did not differ significantly fromzero (fig. 2). Table 3 indicates that the PEV did not correlatewell with LAm pressure at rest, but the relationship wassomewhat stronger with hemodynamic intervention but wasstill too weak to have predictive use.
Aortic Valve Disease (table 4)
In the 22 patients who were exercised CI rose 58%(P < 0.001) over the resting state. Pulmonary artery meanand LAm pressures were normal in the control period but in-creased during exertion by 65% and 64% respectively(P < 0.001). With exercise PEV rose from 107 to 126 ml/m2(P < 0.02) and PBV from 323 to 446 ml/m2 (P < 0.001).The increments in PEV and PBV were proportionate, sothat the ratio of PEV/PBV remained unchanged.Among the nine patients who were paced the normal
resting PAm and LAm pressures rose 33% (P < 0.001) and90% (P < 0.01), respectively, whereas CI was unchanged at2.7 L/m2. Despite pressure elevations comparable to thoseobserved in the exercise group smaller increments in PEVand PBV occurred which did not achieve the 5% significancelevel. Again the ratio of PEV/PBV did not change.Combining all patients with aortic valve disease who were
either paced or exercised, a correlation was observedbetween the ratio of PEV/PBV in the resting and interven-tion states (r = 0.63) (fig. 1). Regression analysis revealedthat the y intercept did not differ significantly from zero norwas the slope significantly different from identity (fig. 2).These data coincided with those obtained in patients withcoronary artery disease.Pulmonary extravascular volume and LAm pressures
were weakly related at rest (r = 0.48) but this relationshipwas not maintained during hemodynamic intervention (table3).
Mitral Valve Disease (table 5)
In the 34 patients who were exercised, CI increased 34%over the control level (P < 0.001). Pulmonary artery meanand LAm pressures rose by 52% and 57%, respectively, dur-ing exercise (P < 0.001), pulmonary extravascular volume
358 CIRCULATION
by guest on June 14, 2018http://circ.ahajournals.org/
FIGURE 1 The ratio ofpulmonary extravascular volume (PEV) to pulmonary blood volume (PBV) are plotted at rest(abcissa) and during both pacing and exercise intervention for the three groups ofpatients studied. The right lower panelindicates all data for the 114 patients.
increased from 133 to 155 ml/m2 and PBV from 350 to 422ml/m2. The increases in both volume measurements were
highly significant (P < 0.001). During exercise the in-crements in PEV and PBV were proportionate, so that theratio of PEV/PBV remained essentially unchanged (0.38 atrest and 0.35 with exercise).
All 12 patients who underwent atrial pacing had advancedmitral stenosis. Their resting PAm and LAm pressures of 35and 22 mm Hg, respectively, were substantially higher thanthose of the exercise group. With pacing PAm and LAmpressures increased by 37% and 36%, respectively,(P < 0.001) but their CI remained unchanged at 2.7 L/m2.Despite the lack of change in cardiac index, PEV rose from171 to 206 ml/m2 (P < 0.01) and PBV from 344 to 417ml/m2 (P < 0.001). These increments were proportionate.The mean PEV/PBV ratio of 0.48 during pacing was lowerthan the control value of 0.54 but was not of statisticalsignificance.
Considering all patients with mitral valve disease who hadeither protocol a constant relationship was found betweenthe ratio of PEV/PBV at rest and during intervention.Figure 1 shows a correlation coefficient of r = 0.75.However, linear regression analysis of the data revealed a yintercept of 0.20 which was significantly different from zero
(P < 0.01) and from the identity line which described thePEV/PBV for patients with coronary artery disease andaortic valve disease (fig. 2). When the patients with mitral
valve disease who were examined were compared to thosewho were paced, the resting PAm, LAm, and PEV, but notthe PBV, were significantly greater in the latter group.Furthermore the ratio of PEV/PBV was also significantlyhigher in those patients who were paced.
For all patients with mitral valve disease an association
TABLE 3. Relationship of Pulmonary Extravascular FluidVolume (PEV) and Left Atrial Mean Pressure (LAm) in theControl State and During Hemodynamic Intervention
r = correlation coefficient; SEE = standard error of the estimate; CAD- coronary artery disease; AoV D - aortic valve disease; MV D = mitralvalve disease; C = control; I = intervention.
a 1.00-
.80-
.60-
D A0-
.20-
1.00-
.80-
.60-
q 40=
.20- r00.70
80 100
I I
I I
359
by guest on June 14, 2018http://circ.ahajournals.org/
0 MITRAL VALVE DISEASE been suggested that the excellent reproducibility of duplicateY = .202 + .445 - x determination of PBV at rest may not extend to inter-S. E. ESTIMATE = .087 r .747 ventions; especially those in which changes in blood flow oc-
cur. The data in the present study do not support this con-A AORT= C VALVE DISEASE tention since the reproducibility of PBV both with pacing
S. E. ESTI MATE .094 r .629 g and with exercise was good in the 53 patients in whomCORORAT,A duplicate determinations were made (table 1). It would
E:] CORONARYARTERYDISEASELI therefore appear that single determination of PBV in the
S. E. EST8IMATE089 r=753 remaining patients are reliable and that the observed in-. / creases in PBV are valid.
In the determination of PEV potential error may be-,adraiidiae ermabui RSA en rnl/__~ related to the subtracted values of the tritiated water (THO)
.o>5o ~ ~ ~~~and radioiodinated serum albumin (RISA) mean transittimes. The results of the duplicate resting PEV deter-mination in our 16 patients showed close agreement(r = 0.96). Since the cardiac index remained unchanged, the
)- ,' -A subtracted mean transit times of THO and RISA indicatorhad to agree closely. Furthermore, even though there may bea significant potential error in a given patient, it should not
_____________________________________ I be a systematic error. In examining a large group of.20 .40 .60 .80 I00 patients, such as those in this study, any subtraction error
0 .20 .40 .60 .80 ).00 between mean transit times would be random and would
PEV/PBV (kEST)FIGURE 2 Linear regression equations for the ratios ofpulmonaryextravascular volume (PEV) to pulmonary blood volume (PBV) atrest (abcissa) and during both exercise and pacing interventions (or-dinate). For patients with aortic valve disease and coronary arterydisease the y intercepts are not significantly different from zero nor
are the slopes different from identity. In contrast the y intercept forpatients with mitral valve disease does differ significantlyfrom zero
and the slope ofthe line is significantlyflatter than for the other twogroups ofpatients.
was found between resting PEV and LAm pressures
(r = 0.46). The correlation improved with the intervention(r = 0.55) (table 3).When all patients were considered together and both pac-
ing and exercise were compared, the PEV/PBV at rest cor-
related with that during the intervention (r = 0.70) (fig. 1).
Discussion
Before considering the implications of this study, possiblesources of methodological errors should be defined. It has
cancel out.The results of the duplicate PEV determinations in our
series of 16 patients are similar to those reported by others.McCredie reported duplicate resting PEV in 13 patients inwhich the standard deviation was 15.2 ml/m' or 11.2% of themean value.6 Similar studies by Luepker et al. in seven
patients had a standard deviation of 21 ml or 10% of themean.'3 Animal studies in 13 dogs in which 37 duplicatemeasurements were made had a mean percentile deviation of15%. 14 Thus despite potential sources of error duplicate PEVvalues generally fall within 10% of one another in man andapproximately ±15% in dogs.
In patients with valvular and coronary artery disease bothPBV and PEV were observed to increase during the stress ofeither exercise or atrial pacing. Increases in pulmonaryartery and left atrial pressures and increases in both PBVand PEV occurred regardless of whether or not restingpressures were normal or elevated. Furthermore, the in-creases in PBV and PEV were independent of changes inblood flow since cardiac output did not change with atrialpacing. It may be concluded that pressure elevations were
responsible for the observed increases in both PBV and
TABLE' 4. Summary of Hemodynamic Data for 31 Patients with Aortic Valve Disease who Underwent Exerciseor Atrial Pacing
Pressures (mm Hg) Volumes (mI/M2) RatioGroup CI HR PAm LAm SAm PEV PBV PEV/PBV
*P < 0.001 compared to control.tP < 0.01 compared to control.For abbreviations, see table 2.
PEV. To our knowledge no other similar observations havebeen previously made in man.
On the basis of acute dog experiments Maseri andassociates have suggested that recruitment of previouslyclosed channels rather than distensibility changes in thepulmonary vascular bed is the major determinant of changesin pulmonary vascular volume under conditions of alteredinflow pressure."5 16 If indeed volume changes in the pulmo-nary circulation occur primarily through changes in thenumber of vessels perfused (i.e. recruitment and de-recruit-ment), then acute changes in PBV must necessarily be ac-
companied by changes in PEV as measured by the doubleisotope indicator dilution technique. Each vessel recruitednot only contributes to the augmented PBV but also to themeasured PEV, even if no real increases in extravascularlung water were to occur. Thus a valuable marker of thesignificance of changes in PEV could be obtained by examin-ing the ratio of PEV/PBV in the control and interventionstates.'7 Furthermore it has been shown in dogs that in-crements in PEV are time dependent, with little increase inPEV/PBV occurring over the first 30 min after the attain-ment of an average transcapillary gradient of 25 mmHg.'4 18
Increases in PEV only occurred during the second half hourwhen the PEV/PBV had risen from a control of 0.20 to0.39.14
Both animal studies support our over-all observations inman. Failure of the PEV/PBV ratio to rise during either in-tervention suggests recruitment of additional vascularchannels. If the ratio increased over the control value a realincrease in lung extravascular water volume would be im-plied. In addition our observations were made for shorterperiods of time and at lower transcapillary gradients thanthe animal studies of Levine and associates.'8Our findings in 68 patients with coronary artery disease or
aortic valve disease in whom the pulmonary vasculature ispresumably normal or nearly so are entirely in keeping withthe recruitment hypothesis. In both groups of patientsresting pulmonary artery and left atrial pressures were nor-
mal during the control period and the pressure elevations atboth sites, whether caused by exercise or pacing, resulted ina proportionate increase in PBV and PEV. In all of thestudies the stimulus to pressure elevation was applied for lessthan 30 min, suggesting that the Starling hypothesis of fluidtransudation is time dependent as well as determined by themagnitude of elevation of pulmonary capillary pressure.'4 18
Otherwise the PEV/PBV would rise during our period ofobservation signifying a "true" increase in lung water.The recruitment concept is also supported by pulmonary
function studies in which carbon monoxide diffusingcapacity (DLco) and capillary blood volume (Vc) weremeasured during changes in position,'9 20 during inflation ofantigravity SUitS21' 22 and during exercise23 24 in normal sub-jects. Assumption of the supine position, augmentation ofvenous return by peripheral venous compression, and exer-cise each produced an increase in DLco and Vc which variedfrom 14 to 90% above control. The increases in Vc with exer-cise varied depending upon the lung volume. At functionalresidual capacity the increase averaged 15% compared to90% at total lung capacity.24 In all of these studies recruit-ment of previously closed vascular beds or limited dilatationof already open capillaries were suggested mechanisms. Thepresent study would support the former mechanism as play-ing a dominant role.McCredie and Chia2 examined the relationship between
PEV and indirect left atrial mean pressure in a group ofpatients who were exercised for more than five minutes.They demonstrated a weak correlation between PEV andLAm pressures during exercise (r = 0.40), as well as a cor-relation between these variables both at rest and with exer-cise in subjects who had a resting PEV above 150 ml/m2. Onthe basis of these data it was suggested that the PEV may bea useful index of left ventricular failure in ischemic heart dis-ease. They did not, however, determine PBV. Based uponobservations made in our laboratory, we believe that theelevation of PEV after five minutes of exercise probablyreflects increases in PBV due to recruitment of vascularchannels, and not true increases in the water content of thelungs. Thus the implication that an elevated PEV, par-ticularly during an intervention, is a useful index of left ven-tricular failure is probably not warranted.Whether or not the recruitment-de-recruitment
hypothesis applied to patients with normal lungs and normalPAm and LAm pressures can be equally applied to thosewith mitral valve disease is probably less certain. Thehemodynamics in the latter patients formed a continuum,from those with mild left atrial and pulmonary hyper-tension to those patients with moderately severe left atrialhypertension (LAm = 22 mm Hg) who were paced. Themore severe the hemodynamic pressure abnormality, thegreater the mean PEV and the higher the PEV/PBV ratio
361
by guest on June 14, 2018http://circ.ahajournals.org/
(table 5). These findings are similar to those reportedpreviously."' 5 8 It may be suggested that in some of ourpatients in whom LAm pressure exceeded 20 mm Hg at restthat all vascular channels would be open because criticalclosing pressures were exceeded. With further pressureelevations during either intervention, recruitment of ad-ditional vascular channels would not be possible. However,since the pulmonary vasculature in mitral valve disease ischaracterized by structural changes in the pulmonaryarteries, capillaries and veins as well as by functionalvasconstriction affecting both arteries and veins, thepressure volume characteristics are likely to be severelyaltered."' 2, 26 Thus some capillary networks might not beperfused despite the presence of significant left atrialhypertension because of altered pressure-volumerelationships in the lung with decreased pulmonary vascularcompliance. These vessels would be operating on the steepportion of the pressure-volume curve. Despite their relativeresistance to volume elevations, they are not necessarily im-pervious to pressure changes. Increases in PBV and PEVcould then occur in response to further elevation in left atrialpressure.
Corroborative evidence of an increased pulmonarycapillary bed in mitral valve disease is conflicting. Previousstudies from this laboratory have indicated that Vc was nor-mal in 56 patients with mitral valve disease (FunctionalClass II and III) but reduced in 13 Class IV patients.27Palmer et al. studied Vc in 30 patients of whom 27 hadpredominant mitral stenosis.28 The mean Vc in their group Ito II (which were approximately comparable to theAmerican Heart Association functional classification byclass) increased with exercise from approximately 100 ml(Group I) to 160 ml (Group III), but the range varied from70 to 300 ml. In contrast, exercise in Group IV patientsresulted in an average increase in Vc of only 45 ml (range: 35to 70 ml). The latter mean was significantly lower than theaverage values for Groups I to III. The resting averagepulmonary artery systolic and diastolic pressures for thesefour groups varied as follows: Group I: 34/12; Group II:53/23; Group III: 58/34; Group IV: 80/45. In the samelaboratory the mean value for Vc in normal exercising sub-jects was 143 ml at an average oxygen consumption of 1.2L/min.
These data lend support to our contention that thenumber of perfused pulmonary capillaries can be increasedin patients with mitral valve disease even though con-siderable left atrial and pulmonary hypertension are presentat rest. It would appear that our exercised patients are com-parable mainly to patients in Groups I and II studied byPalmer et al.28 since resting PAm averaged 25 mm Hg andLAm averaged 16 mm Hg. (It is reasonable to assume thatthe pulmonary diastolic pressures and left atrial meanpressures were comparable.) The paced patients had aresting PAm of 35 mm Hg with an average LAm of 22 mmHg (comparable to Group II and possibly Group III). Thusit could be assumed that elevation of pressures in our exer-cising or paced patients would result in an appreciable in-crease in Vc even though this parameter was not measuredin the present study.The more extensive disease of the pulmonary circulation
and the altered pressure-volume relationships in patients
with mitral valve disease is further emphasized by the regres-sion line formed by the PEV/PBV at rest and during in-tervention (fig. 2). The y intercept is positive and the slope issignificantly flatter than the lines of the other two groupsstudied. The higher resting PEV/PBV ratios have beendocumented by Luepker and associates as well asourselves., 8, 1 Although the data of Luepker et al. de-monstrates a proportionate increase in both PEV and PBVand an apparent linear relationship between PEV at rest andduring exercise our linear regression analysis of their datahas a positive y intercept and a flattened slope when com-pared to identity [y = 0.245 + 0.528x]. Our data are essen-tially similar.
While none of our data contradict the recruitmenthypothesis we admit that in mitral valve disease it is con-ceivable that the constancy of the PEV/PBV is a resultant oftwo opposing mechanisms, i.e., capillary distension tendingto increase the ratio, and pulmonary artery and venous dis-tension tending to decrease the ratio.To summarize, in patients with coronary artery disease or
aortic valve disease we have found increases in PEV andPBV accompanying elevations in PAm and LAm pressuresduring supine leg exercise or atrial pacing. The increases inPEV and PBV were proportionate so that the ratio ofPEV/PBV remained almost constant and they wereobserved in the absence of changes in cardiac index duringrapid atrial pacing as well as during exercise. These obser-vations support the hypothesis that recruitment of vascularchannels accounts for the acute changes in PEV and PBVand that the changes in PEV over a brief period of time donot necessarily reflect a real increase in pulmonary extra-vascular water.
Similar changes in PEV, PBV, PAm and LAm pressureswere observed in patients with mitral valve disease duringeither intervention. However the recruitment hypothesis isless easily substantiated in the presence of already elevatedPAm and LAm pressure. Nonetheless evidence is presentedwhich suggests that a similar recruitment phenomenon islikely to be present in these patients as well.
Acknowledgment
We wish to thank Drs. James Dove, Donald Logan, John Farnham, UllrichEttinger, Dennis Ehrich and Charles Gross for their participation in some ofthese studies, and Mr. Dennis Edwards and Mrs. Connie Katos for their ex-pert technical assistance. The nursing skills of Miss Virginia Paddock, R.N.,and Mrs. Janice Kucil, R.N., and the secretarial aid of Mrs. Nancy Tripp aregratefully acknowledged.
3. Varnauskas E, Forsberg SA, Widimsky J, Paulins: Pulmonary bloodvolume and its relation to pulmonary hemodynamics in cardiac patients.Acta Med Scand 173: 529, 1963
4. Yu PN: Pulmonary Blood Volume in Health and Disease. Philadelphia,Lea and Febiger, 1969, p 77
15. Maseri A, Caldini P, Harward P, Joshi RC, Permutt S, Zierler KL:Determinants of pulmonary vascular volume. Recruitment versus disten-sibility. Circ Res 31: 218, 1972
16. Maseri A, Giuntini C, Fayir F, L'Abbat A: Intervascular pressures andinterstitial water space in the lung. In Central Hemodynamic and GasExchange, edited by Giuntini C, Torino, Minerva Medica, 1973, p 163
17. Permutt S, Caldini P: Theoretical aspects of the relation betweenpulmonary blood volume and the measurement of extravascular water. InCentral Hemodynamics and Gas Exchange, edited by Giuntini C, Torino,Minerva Medica, 1971, p 239
18. Levine OR, Mellins RB, Senior RM, Fishman AP: The application ofStarling's Law of capillary exchange to the lungs. J Clin Invest 46: 934,1967
19. Lewis BM, Lin TH, Noe FE, Komisaruk R: The measurement ofpulmonary capillary blood volume and pulmonary membrane diffusingcapacity in normal subjects; the effects of exercise and position. J ClinInvest 37: 1061, 1958
20. Newman F: The effect of change in posture on alveolar capillary diffusionand capillary-blood volume in the human lung. J Physiol 162: 29, 1962
21. Daly WJ, Giammona ST, Ross JC, Feigenbaum H: Effects of pulmonaryvascular congestion on postural changes in the perfusion and filling ofpulmonary vascular bed. J Clin Invest 43: 48, 1964
22. Ross JC, Maddock GW, Ley GD: Effect of pressure suit inflation on
is published by the American Heart Association, 7272 Greenville Avenue, Dallas, TX 75231Circulation doi: 10.1161/01.CIR.53.2.356
1976;53:356-363Circulation.
http://circ.ahajournals.org/content/53/2/356World Wide Web at:
The online version of this article, along with updated information and services, is located on the
http://circ.ahajournals.org//subscriptions/
is online at: Circulation Information about subscribing to Subscriptions:
http://www.lww.com/reprints Information about reprints can be found online at: Reprints:
document. Permissions and Rights Question and Answer about this process is available in the
located, click Request Permissions in the middle column of the Web page under Services. Further informationEditorial Office. Once the online version of the published article for which permission is being requested is
can be obtained via RightsLink, a service of the Copyright Clearance Center, not theCirculationpublished in Requests for permissions to reproduce figures, tables, or portions of articles originallyPermissions:
by guest on June 14, 2018http://circ.ahajournals.org/