TOXICOLOGY AND APPLIED PHARMACOLOGY 77, 187-200 (1985) Acute Toxicity and Recovery in the Hemopoietic System of Rats after Treatment with Ethylene Glycol Monomethyl and Monobutyl Ethers DEREK GRANT, SUE SUESH, Huw B. JONES, SHARAT D. GANGOLLI, AND WILLIAM H. BUTLER The British Industrial Biological Research Association, Woodmansteme Road, Carshalton. Surrey, SM5 4DS, England Received May 10, 1984; accepted August 27, 1984 Acute Toxicity and Recovery in the Hemopoietic System of Rats after Treatment with Ethylene Glycol Monomethyl and Monobutyl Ethers. GRANT, D., SULSH, S., JONES, H. B., GANGOLLI, S. D., AND BUTLER, W. H. (1985). Toxicol. Appl. Pharmacol. 77, 187-200. Male rats were given ethylene glycol monomethyl ether (EGM) or ethylene glycol monobutyl ether (EGB) po for 4 consecutive days at doses of 100 or 500 mg/kg body wt/day for EGM, and 500 or 1000 mg/kg body wt/day for EGB. Animals were killed on Days 1,4, 8, and 22 atIer the final treatment. Both EGM and EGB produced thymic atrophy and lymphocytopenia and, in the cam of EGM, neutropenia also. Hemolytic anemia induced by EGB resulted in splenic extramedullary hemopoicsis, hypcrplasia of both spleen and bone marrow, and rcticulocytosis. Apart from residual slight increases in spleen weight, mean red cell volume, and mean corpuscular hemoglobin at the end of the recovery period, other effectswere reversible. With EGM, reduction in the numbers of circulating red cells was only slight. Treatment with EGM also abolished splenic extramedtdkuy hemopoiesis which pamally recovered on Day 4, followed by a marked response on Day 8, and return to the moderate control values on Day 22. Femoral bone marrow was hemorrhagic 1 day after treatment with EGM which appeared to be associated with sinus endothelial cell damage. By Day 4 the histologic appearance of the marrow was normal. Testicular atrophy was also produced in EGM-treated animals which persisted for the duration of the experiment. It is concluded that EGM and EGB differ considerably in the spectrum of toxic changes induced, and apart from testicular atrophy, these changes were. largely reversible within a short time of the end of treatment. 8 1985 Academic Pras. Inc. Ethylene glycol monoalkyl ethers are colorless volatile liquids with widespread industrial applications owing to their miscibility with many organic solvents, and with water- and oil-based formulations. The presence of eth- ylene glycol ethers in paints, lacquers, dyes, inks, and cleaning agents has generated con- siderable interest in their toxicology. Several case histories have been reported in which adverse effects were produced in individuals who had absorbed ethylene glycol ethers through the skin by direct contact (Ohi and Wegmann, 1978), via the lung after inhaling vapors (Avon, 1963), or through the gut when mistaken for alcohol and ingested (Nit- ter-Hauge, 1970). The spectrum of toxicity induced by the ethylene glycol ethers in various species in- clude disorders of the hemopoietic, repro- ductive, and central nervous systems, with the site of action and severity of toxicity depending upon the particular ethylene glycol ether and species involved (ECETOC, 1982). In view of the reported differences in tox- icity between closely related ethylene glycol ethers (Werner et al., 1943; Carpenter et al., 187 0041-008X/85 $3.00 Cowi@ 8 1985 by Academic Press, Inc. All rights of npmduction in any form -4.
Transcript
TOXICOLOGY AND APPLIED PHARMACOLOGY 77, 187-200 (1985)
Acute Toxicity and Recovery in the Hemopoietic System of Rats after Treatment with Ethylene Glycol Monomethyl and Monobutyl Ethers
DEREK GRANT, SUE SUESH, Huw B. JONES, SHARAT D. GANGOLLI, AND WILLIAM H. BUTLER
The British Industrial Biological Research Association, Woodmansteme Road, Carshalton. Surrey, SM5 4DS, England
Received May 10, 1984; accepted August 27, 1984
Acute Toxicity and Recovery in the Hemopoietic System of Rats after Treatment with Ethylene Glycol Monomethyl and Monobutyl Ethers. GRANT, D., SULSH, S., JONES, H. B., GANGOLLI, S. D., AND BUTLER, W. H. (1985). Toxicol. Appl. Pharmacol. 77, 187-200. Male rats were given ethylene glycol monomethyl ether (EGM) or ethylene glycol monobutyl ether (EGB) po for 4 consecutive days at doses of 100 or 500 mg/kg body wt/day for EGM, and 500 or 1000 mg/kg body wt/day for EGB. Animals were killed on Days 1,4, 8, and 22 atIer the final treatment. Both EGM and EGB produced thymic atrophy and lymphocytopenia and, in the cam of EGM, neutropenia also. Hemolytic anemia induced by EGB resulted in splenic extramedullary hemopoicsis, hypcrplasia of both spleen and bone marrow, and rcticulocytosis. Apart from residual slight increases in spleen weight, mean red cell volume, and mean corpuscular hemoglobin at the end of the recovery period, other effects were reversible. With EGM, reduction in the numbers of circulating red cells was only slight. Treatment with EGM also abolished splenic extramedtdkuy hemopoiesis which pamally recovered on Day 4, followed by a marked response on Day 8, and return to the moderate control values on Day 22. Femoral bone marrow was hemorrhagic 1 day after treatment with EGM which appeared to be associated with sinus endothelial cell damage. By Day 4 the histologic appearance of the marrow was normal. Testicular atrophy was also produced in EGM-treated animals which persisted for the duration of the experiment. It is concluded that EGM and EGB differ considerably in the spectrum of toxic changes induced, and apart from testicular atrophy, these changes were. largely reversible within a short time of the end of treatment. 8 1985 Academic
Pras. Inc.
Ethylene glycol monoalkyl ethers are colorless volatile liquids with widespread industrial applications owing to their miscibility with many organic solvents, and with water- and oil-based formulations. The presence of eth- ylene glycol ethers in paints, lacquers, dyes, inks, and cleaning agents has generated con- siderable interest in their toxicology. Several case histories have been reported in which adverse effects were produced in individuals who had absorbed ethylene glycol ethers through the skin by direct contact (Ohi and Wegmann, 1978), via the lung after inhaling
vapors (Avon, 1963), or through the gut when mistaken for alcohol and ingested (Nit- ter-Hauge, 1970).
The spectrum of toxicity induced by the ethylene glycol ethers in various species in- clude disorders of the hemopoietic, repro- ductive, and central nervous systems, with the site of action and severity of toxicity depending upon the particular ethylene glycol ether and species involved (ECETOC, 1982).
In view of the reported differences in tox- icity between closely related ethylene glycol ethers (Werner et al., 1943; Carpenter et al.,
187 0041-008X/85 $3.00 Cowi@ 8 1985 by Academic Press, Inc. All rights of npmduction in any form -4.
188 GRANT
1956; Nagano et al., 1979), a comparative study was initiated using ethylene glycol monomethyl ether (EGM) and ethylene glycol monobutyl ether (EGB) to characterize the differences in toxicity in the hemopoietic system and the reversibility of such effects in the period following treatment.
METHODS
Animals. Male F344 rats, aged approximately 4 weeks, were obtained from Charles River U.K. Ltd., Margate, Kent. They were housed in a room designed to provide a temperature of 20 + 2°C 12 to 15 air changes per hour, a relative humidity of 40 to 602, and a lighting cycle of 12 hr light: 12 hr dark. Animals were allowed free access to feed (R & M No. 1 expanded, Special Diet Services, Witham, Essex) and domestic mains water throughout.
Materials. EGM was obtained from Sigma Chemical Company, Poole, Dorset, and EGB from Aldrich Chem- ical Company, Gillingham, Dorset. The purity of both test materials was 99.9% as determined by gas-liquid chromatography.
Design and treatment. On receipt, rats were randomly assigned to five groups with the aid of random number tables (Fisher, 1965). Each group contained 24 animals, housed 6 to a cage and allowed to acclimatize for 1 week. Animals were dosed po with water (control), EGM (100 or 500 m&kg/day), or EGB (500 or 1000 mg/kg/ day) daily for 4 consecutive days. The glycol ethers were diluted in water and given at a dose volume of 5 ml/kg body wt. These doses of EGM and EGB were chosen on the basis of effects obtained in preliminary range finding studies. Six animals from each group were bled, then killed, and autopsied on Days 1, 4, 8, and 22 after the last treatment.
Hematology. Animals were warmed in a container heated to approximately 40°C and bled from a lateral caudal vein, and the following were determined: red blood cell count (RBC), white blood cell count (WBC), hemoglobin concentration (Hb), mean red cell volume (MCV), hematocrit (Hct), reticulocyte count, and differ- ential white cell count. The RBC, WBC, Hct, and MCV were determined on a Coulter Counter (model ZF) coupled to a Coulter MCV/Hct accessory. During the period of reticulocytosis in EGB-treated animals, the WBC was determined by a manual method using an improved Neubauer counting chamber. Hemoglobin concentrations were measured on a Coulter Hemoglo- binometer.
Necropsy and histopathology. After overnight fasting, animals were weighed and killed by ip injection with sodium pentobarbitone. The spleen, thymus, liver, testes, and kidneys were weighed, and together with cervical
ET AL.
and mesenteric lymph nodes, these were fixed in neutral buffered Formalin for examination by light microscopy. Femoral bone marrow was immersed in a solution containing 4% formaldehyde and 1% glutaraldehyde adjusted to pH 7.2 with 0.1 M phosphate buffer (Mc- Dowell and Trump, 1976), a fixation method suitable for both light and electron microscopy. Samples of marrow for electron microscopy were postfixed in 1% osmium tetroxide, dehydrated through graded ethanols, and embedded in agar lOO/araldite. Sections were cut at a thickness of 1 pm and stained with toluidine blue for light microscopy, or at a thickness of 60 to 90 nm and stained with lead citrate and uranyl acetate for transmis- sion electron microscopy. Other samples of bone marrow and the remainder of the tissues were processed into paraffin wax, cut at 5 pm, and stained with hematoxylin and eosin.
Statistical analyses. Data were analyzed by one-way analysis of variance; means were compared by least significant difference criteria (Snedecor and Cochran, 1968).
RESULTS
Body Weights and Organ Weights
The mean weights of the animals were similar in all groups before the commence- ment of treatment. Treatment-related reduc- tions in the rates of body weight gain were seen only in the high-dose EGB group (Ta- ble 1).
Reduced relative weights (g/ 100 g body wt) of kidneys, spleen, testes, and thymus were seen in EGM-treated rats on Day 1 of recov- ery (Table 1). With the exception of weights of kidneys, these reductions were dose related. The weights of spleens recovered to exceed control values by Day 8. By Day 22, all organ weights in EGM-treated animals were similar to or slightly higher than those of the control group apart from weights of testes which remained lower throughout.
In contrast, EGB caused dose-related in- creases in the relative weights of spleen, liver, and kidneys on Day 1 of recovery, but in common with EGM, thymic weights were reduced (Table 1). These weight changes in EGB-treated animals returned to normal by Day 22 apart from the weights of livers and spleens which remained slightly raised.
ACUTE TOXICITY OF GLYCOL ETHERS 189
TABLE 1
RELATIVE ORGAN WEIGHTS OF MALE F344 RATS DOSED WITH ETHYLENE GLYCOL MONOMETHYL ETHER
Note. Values are the means of six animals and those marked with an asterisk differ significantly from the control values using least significant difference criteria (*p < 0.05, **p < 0.01, ***p < 0.001). Figures in parentheses are SD.
ACUTE TOXICITY OF GLYCOL ETHERS 191
Histopathology
In the high-dose EGM group, femoral bone marrow was severely hemorrhagic, with loss of much of the normal nucleated tissue (Fig. 1). Electron microscopy revealed exten- sive thinning of the sinus endothelial cells of marrow sinuses which had cytoplasmic pro- cesses extending into ‘the lumen (Fig. 2). Large discontinuities which often contained erythrocytes were frequently seen in the en- dothelial cell layer in the sinuses. These breaks were not at the point of cell to cell contact as the zonulae adherens were intact. Pinocytotic activity was normal as judged by the numbers and appearance of vesicles, al- though some cells contained a small number of autophagosomes and secondary lysosomes. There was also slightly increased electron density and crenation of some nuclei. Despite the severity of the initial hemorrhage, the normal architecture of the marrow was re- stored by Day 4. Only one of the six animals in the low-dose group had hemorrhagic mar- row on Day 1.
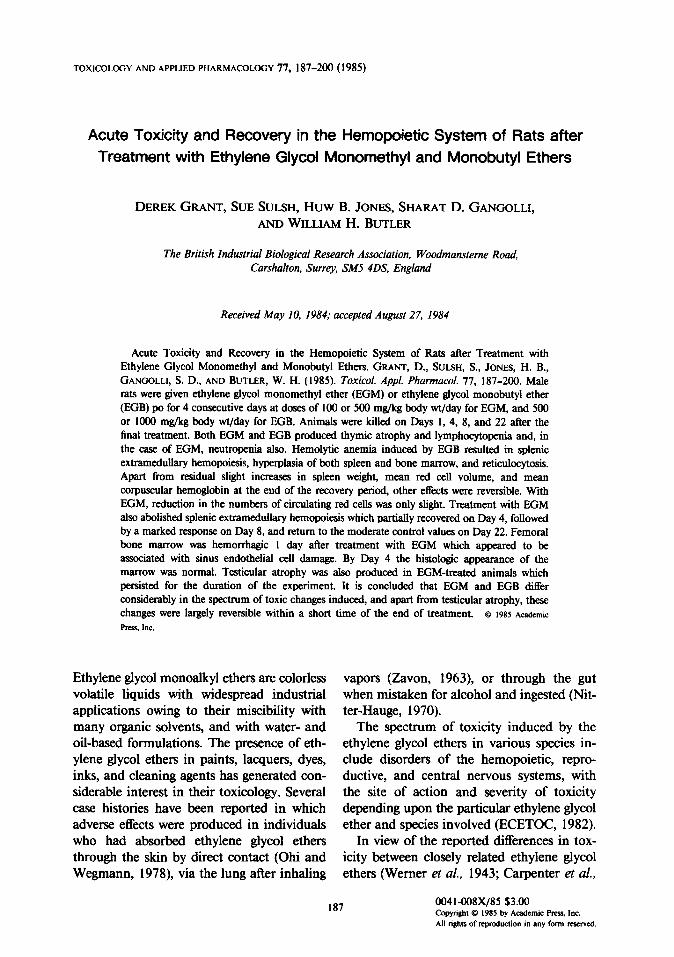
In the spleen the moderate amount of extramedulhuy hemopoiesis (EMH) normally present in animals of this age was abolished by treatment with 500 mg EGM/kg body wt, and reduced in most of the lOO-mg EGM/ kg body wt group (Fig. 3). This reduced amount of EMH returned to normal or near normal values in the lowdose EGM group within 8 days, whereas in animals of the high-dose group there was partial recovery on Day 4 and a marked increase on Day 8. The degree of EMH had returned to normal by Day 22.
Testicular atrophy was severe in the high- dose EGM group with disruption of the architecture of the seminiferous tubules and
degenerative changes in the spermatocytes similar to those described by Greasy and Foster (1984). This change was reflected in the absence of spermatozoa in the epididym- ides. Testes were of normal histologic ap- pearance in the low-dose EGM group.
Treatment with EGB produced marrow hyperplasia with no evidence of hemorrhage at any time. Splenic EMH was marked in both EGB-treated groups on Day 1 but this change had returned to normal by Day 8. Unlike EGM, treatment with EGB had no discemable effects on the testes.
Histologic changes common to rats treated with either EGM or EGB at the high doses were slight hepatic EMH in the first week of recovery and lymphocyte depletion of the thymic cortex on Day 1 (Erg. 4). This lym- phocyte depletion was only transient as the appearance of thymic tissue was normal by Day 4. Kidneys and lymph nodes were of normal appearance in all groups.
Hematology
Changes in the circulating blood were pro- duced by both EGM and EGB, but there were qualitative and quantitative differences in the responses seen.
EGM (Table 2) produced slight reductions of the BBC, Hct, and Hb values at Day 4 and 8 posttreatment, resulting in a mild normochromic, normocytic anemia. The re- ticulocyte count was slightly depressed in these EGM-treated. animals on Days 1 and 4, whereas on Day 8 the numbers of circu- lating reticulocytes were signScantly in- creased (p < 0.05).
The leukocyte count was markedly reduced in the high-dose EGM group on Day 1 due to reduced numbers of neutrophils and lym-
FIG. 1. Femoral bone marrow morphology-Day 1 recovery. (a) Control rat. Note the well-ordered nucleated marrow tissue surrounding a sinus. (b) Rat treated with 500 mg EGM/k&Iay for 4 consecutive days. The sinus endothelium is morphologically abnormal with an irregular outline and large gaps in which red blood cells can be seen. Much of the normal nucleated marrow tissue is missing, and there are large numbers of mature red cells occupying the extravascular areas. Resin embedded, I-srn sections, stained with toluidine blue stain, X1460.
192 GRANT ET AL.
FIG, 2. Sinus endothelial cell ultrastructure-Day 1 recovery. (a) Control rat. The nuclei and luminal surfaces of the endothelium are smooth in outline. (b) Rat treated with 500 mg EGM/kg/day for 4 consecutive days. The endothelial cell nuclei are very irregular in outline and the cytoplasm varies from extreme thinness to areas of thickening with frequent knob-like processes. Lead citrate and uranyl acetate staining, x2030. Inset shows irregular endothelium with intact zonulae adherens, x7190.
phocytes. These leukocyte counts subse- Animals treated with the lower dose of EGM quently increased but failed to reach control had slightly reduced leukocyte counts on values by the end of the recovery period. Day 1.
ACUTE TOXICITY OF GLYCOL ETHERS 193
In contrast, EGB (Table 2) caused pro- nounced dose-dependent effects on circulating red and white cells. Animals treated with the highest dose of EGB (1000 mg/kg body wt/ day) had reduced RBC, Hct, Hb, and mark- edly elevated MCV, reticulocyte counts, and mean corpuscular hemoglobin (MCH) at the end of treatment. Most of these changes in the red cells disappeared over the recovery period, although the MCV and MCH re- mained slightly elevated at Day 22. The reticulocytosis was particularly striking on Days 1 and 4, but by Day 8 the reticulocyte counts had returned to normal. Examination of Romanowski-stained blood films taken from this group revealed increased numbers of circulating nucleated RBCs (normoblasts), pronounced anisocytosis, polychromasia, and the presence of Howell Jolly bodies (Fig. 5). These changes had resolved by Day 8. Leu- kocyte counts were also depressed on Day 1 in the high-dose EGB group, due principally to a reduction in the numbers of circulating lymphocytes. The leukocyte numbers grad- ually increased, although, in common with EGM-treated animals, they did not reach control values by the end of the recovery period. These effects on red and white cells were also seen in animals treated with the lower dose of EGB (500 mg/kg body w-t/ day), although the severity of the changes was less marked.
DISCUSSION
The two ethylene glycol ethers, EGM and EGB, which differ only in their alkyl moieties, produced several markedly dissimilar changes in circulating blood and selected tissues after acute treatment.
The major hematological effect of EGM was leukopenia, whereas EGB produced both leukopenia and anemia. The pronounced leukopenia in EGM-treated animals appeared to be associated with reductions in both lymphocytes and neutrophils, as opposed to those treated with EGB in which lymphocytes
were preferentially affected. With both eth- ylene glycol ethers there was also a loss of lymphocytes from the thymic cortex and reductions in thymic weights, but whether this change indicates direct toxicity to the thymus or is mediated by possible effects on circulating lymphocytes or bone marrow is unclear.
Since lymphocytopenia was common to animals treated with either of the ethylene gIyco1 ethers, but marrow toxicity was con- fined to those treated with EGM, the lym- phocytopenia does not appear to be related to bone marrow toxicity. There does, how- ever, seem to be some association between neutropenia and bone marrow toxicity in EGM-treated animals. The impairment of granulopoiesis in damaged marrow would be expected to lead to a rapid neutropenia owing to the short half-life of neutrophils in the circulating blood (Wade and Mandell, 1983).
Full recovery from the leukopenia pro- duced by the ethylene glycol ethers was equivocal owing to the raised number of circulating leukocytes in control animals at the end of the recovery period.
The reductions in RBC, Hct, Hb, and marginally lower reticulocyte counts during the initial period of recovery from EGM treatment, together with reduced splenic EMH and bone marrow toxicity, suggest an inhibitory action on erythropoiesis. If contin- ued this inhibition would eventually lead to anemia by the failure to replace effete red cells. Indeed, it has been reported that anemia occurs in rats and several other species when the duration of exposure to EGM is more prolonged (Miller et al., 1981; Doe et al., 1983). On Day 8 the markedly elevated splenic EMH and the modest increase in the numbers of circulating reticulocytes suggest recovery from the inhibition of erythropoiesis.
In contrast, the various changes seen in circulating red cells after EGB treatment are typical of hemolytic anemia with an asso- ciated reticulocytosis and hyperplasia of both bone marrow and spleen. This observation is in agreement with the findings of Carpenter
194 GRANT ET AL.
ACUTE TOXICITY OF GLYCOL ETHERS 195
FIG. 3. Splenic extramedullary hemopoiesis (EMH)-Day 1 recovery. (a) Control rat. Islands of EMH are clearly distinguishable in the red pulp area. (b) Rat treated with 500 mg EGM/kg/day for 4 consecutive days. The red pulp is devoid of any overt EMH. (c) Rat treated with 1000 mg EGB/kg for 4 consecutive days. Note the marked increase in EMH which occupies a major proportion of the red pulp, H & E, X290.
et al. (1956) who have demonstrated hemo- lysis and increased osmotic fragility in rats treated with EGB.
The majority of these effects on the red cell population were reversible, although in- creases in MCH and MCV were more per& tent, probably due to the selective hemolytic action of EGB on aged red cells (Carpenter et al., 1956), leaving a population of young erythrocytes. In addition, erythrocytes which are produced during remission from severe acute anemia tend to be macro&c and contain more Hb (Schalm et al., 1975), factors which may also contribute to the persistence of these changes. The long-lasting spleen weight increases produced by these ethylene glycol ethers may be a residual effect of the elevated concentration of splenic EMH.
In contrast to the proliferative response in
the marrow of EGB-treated animals, those given EGM had severely hemorrhagic mar- rows. The major site of toxicity relating to hemorrhage appeared to be endothelial cells lining the sinuses, many of which had evi- dence of damage. The presence of mature erythrocytes in the large gaps of the sinus walls and their abundance in the substance of the marrow tissue suggest that the integrity of the sinus endothelium was impaired. This, together with the loss of the resident popu- lation of nucleated cells, agrees with previous reports of marrow hypocellularity after treat- ment with EGM (Miller et al., 1981). The pathogenesis of nucleated marrow cell loss is unclear at present.
Testicular atrophy similar to that described by Foster et al. (1983) and Creasy and Foster ( 1984) was evident in animals treated with
TABL
E 2
HEM
ATOL
~CY
OF
MAL
E F3
44
RATS
DO
SED
WIT
H ET
HYLE
NE
GLYC
OL
MON
OMET
HYL
ETHE
R (E
GM)
OR
ETHY
LENE
GL
YCOL
M
ONOB
UTYL
ET
HER
(EGB
)
Dose
RB
C
b%.W
day)
( l
o’2/
1)
MCV
(fl)
Hct
(%)
Hb
(g/d
])
Retic
uloc
ytes
(IRBC
)
MCH
(PP)
To
tal
Leuk
ocyte
s ( 1
09/1
)
Neut
roph
ils
Lym
phoc
ytes
CON
EGM
EGB
CON
EGM
EGB
0
100
500
500
loo0
0
100
500
500
1000
6.55
60
.2
38.7
(0
.15)
(1
.2)
(1.5
) 6.
58
59.7
38
.8
(0.2
8)
(0.5
) (1
.3)
6.67
59
.3
39.2
(0
.2
1)
W-V
(1
.3)
5.04
***
74.5
***
37.3
(0
.50)
(2
.2)
(2.7
) 3.
34**
* 82
.7**
* 27
.8**
*
(0.6
I)
(2.5
) (4
.3)
6.65
59
.2
(0.3
1)
03
.8)
6.64
57
.7
(0.4
7)
W3)
6.
22
57.5
(0
.17)
(0
.6)
6.06
* 68
.7**
* (0
.28)
(2
.9)
4 80
***
”
(0:7
2)
77 6
*- ’
(4:2
)
38.7
(1.5
) 37
.7
(2.7
) 35
.3*
(1.4
) 41
.2
(1.2
) 37
.2”
(4.4
)
Day
1 re
cove
ry
15.7
4.
2h
(0.3
) (1
.8)
15.7
3.
9
(0.6
) W
) 15
.4
2.7
(0.4
) (1
.0)
14.0
* 25
.2**
*
(1.1
) (9
.3)
10.6
***
32.6
**+
(1.9
) (6
.9)
Day
4 re
cove
ry
16.3
10
.4
(0.5
) (3
.6)
15.9
9.
1
(0.6
) (5
.1)
14.4
***
6.6”
(0.4
) (5
.9)
16.7
22
.4+
(0.5
) (9
.9)
15.3
*” 51
3*
**
U
(1.2
) (1
1:8)
24.0
4.
93
0.55
4.
37
(0.4
) (1
.19)
(0
.26)
( 1
.03)
23
.8
3.85
; 0.
5 1
3.33
**
(0.5
) (0
.31)
(0
.09)
(0
.31)
23
.1
1.52
-f 0.
13**
‘ I .
30**
* ‘
0
(0.5
) (0
.32)
(0
.02)
(0
.17)
F
27.9
***
2.68
***
0.48
2.
16**
* 5
(1.0
) (0
.61)
(0
.16)
(0
.54)
3
I .8*
**
1.75
-e
0.46
1.
29”*
$
(1.6
) (0
.39)
(0
.29)
(0
.19)
F
24.5
5.
23
0.54
(0.6
) (0
.52)
(0
.2
I) 24
.0
6.04
**
0.37
(1.4
) (0
.60)
(0
.08)
23
.2
3.00
***
0.10
***
(0.5
) (0
.31)
(0
.07)
27
.6**
4.
59*
0.59
(1.8
) (0
.48)
(0
.29)
32
.1**
* ”
2 36
***
a (0
140)
0.
32*”
(2.3
) (0
.12)
4.58
(0.4
7)
5.60
***
(0.5
6)
2.90
***
(0.2
6)
3.95
* (0
.29)
1
77++
+ ”
(0:3
6)
CON
EGM
EGB
CON
EGM
EGB
0
100
500
500
1000
0
100
500
500
1000
6.94
(0
.29)
6.
99
(0.2
8)
6.46
. (0
.25)
6.
23**
*
(0.3
0)
6.16
***
(0.3
9)
7.63
(0
.25)
7.
72
(0.1
2)
7.39
(0
.70)
7.
46
(0.2
1)
7.
36
(0.1
5)
60.5
41
.5
(0.6
) (2
.1)
59.2
41
.0
(1.2
) (2
.2)
60.5
38
.5*
(1.1
) (2
.1)
65.2
***
40.3
(1.2
) (2
.4)
71
o***
”
(3:2
)
42.8
”
(2.3
)
58.7
43
.8
(1.4
) (2
.1)
57.3
f 43
.5
(0.5
) (0
.6)
58.7
42
.7
(0.8
) (5
.0)
59.0
43
.4
(0.9
) (1
.6)
6 1.
2***
44
.5
(0.8
) (0
.6)
Day
8 re
cove
ry
16.7
5.
5
(0.7
) (1
.9)
16.1
(0.3
) (3
) 15
.5**
(0.8
) ,;:
;;
16.5
(0.7
) (K
) 17
.4
6.9
(0.7
) (2
.6)
Day
22
reco
very
16.7
3.
2
(0.5
) (1
.1)
16.5
3.
8
(0.2
) (1
.3)
16.9
3.
2
(1.3
) (1
.0)
17.2
(0.4
) ,::
,“,
17.3
(0.2
) (2
)
24.0
6.
13
0.72
5.
32
(0.5
) (1
.08)
(0
.16)
( 1
.04)
23
.1
5.39
0.
54
4.81
(0.8
) (0
.85)
(0
.24)
(0
.69)
23
.9
4.49
- 0.
52
3.91
**
(0.6
) (0
.58)
(0
.18)
(0
.52)
26
.5**
* 5.
52
1.10
4.
39’
(0.9
) (0
.47)
(0
.30)
(0
.27)
29
.4**
* 5.
55”
1.29
**
4.24
”
(1.2
) (0
.82)
(0
.56)
(0
.51)
21.9
9.
90
1.22
8.
61
(0.3
) (2
.97)
(0
.45)
(2
.70)
21
.3’
8.43
0.
84*
6.04
*+
(0.2
) (3
.97)
(0
.28)
(0
.46)
22
.9
6.25
*+
1.00
5.
20**
*
(0.7
) (0
.8
1)
(0.1
9)
(0.7
5)
23.0
***
6.06
**
1.26
4.
76++
+
(0.3
) (0
.41)
(0
.19)
(0
.32)
23
.5**
* 5.
30**
1.
06
4.18
***
(0.5
) (0
.42)
(0
.28)
(0
.43)
Note
. Va
lues
ar
e th
e m
eans
of
six
an
imal
s an
d th
ose
mar
ked
with
an
as
teris
k di
ffer
signi
fican
tly
from
th
e co
ntro
l va
lues
us
ing
leas
t sig
nific
ant
diffe
renc
e cr
iteria
(*p
4 0.
05,
**p
< 0.
01,
l **p
-C
0.00
1).
Figu
res
in
pare
nthe
ses
are
SD.
” M
ean
value
of
fiv
e an
imal
s.
h M
ean
value
of
fo
ur
anim
als.
’ Mea
n va
lue
of
thre
e an
imal
s.
FIG. 4. Thymus morphology-Day I recovery. (a) Control rat. Note the clear distinction between the outer cortex and inner medulla. (b) Rat treated with 500 mg EGM/kgjday for 4 consecutive days. There is considerable depletion of lymphocytes from the cortex and an increased lymphocyte population in the medulla. The demarcation between the two areas is less distinct, H & E, X60.
198
ACUTE TOXICITY OF GLYCOL ETHERS 199
FIG. 5. Blood film from a rat given 1000 mg EGB/kg/day for 4 consecutive days-Day I recovery. Note the pronounced polychromasia, anisocytosis, and nucleated red blood cell (normoblast) containing a Howell Jolly body. May-Grunwald-Giemsa stain, X 1460.
500 mg EGM/kg body wt. This atrophy persisted for the duration of the recovery period, whereas EGB had no discemable effect on either testis weights or on their histologic appearance at doses which were clearly toxic to the hemopoietic system. The studies by Foster et al. (1983) have shown that a longer period of recovery, equivalent to one maturation cycle (7 to 8 weeks), after dosing rats with 500 mg EGM/kg body wt permits the resumption of spermatogenesis.
In conclusion, it is clear that there are considerable differences between EGM and EGB in many of the toxic changes induced, and that, apart from testicular atrophy, most of the other histologic and hematologic changes resolve within 3 weeks or less of the cessation of treatment. The reasons for the differential toxicity between the two glycol ethers are unknown, but it is likely that
events related to the metabolism of the two compounds are involved as the acetic acid metabolites appear to be largely responsible for the toxic effects induced by the ethylene glycol ethers (Miller et al., 1982, 1983).
ACKNOWLEDGMENTS
We thank Mrs. L. Beech for the preparation of speci- mens for electron microscopy, and Mr. A. Dagnall for photographic assistance. This work is part of a research program on acute/chronic toxicity relationships, and we thank the Food and Drink Industries Council for their support.
REFERENCES
CARPENTER, C. P., POZZANI, U. C., WEIL,, C. S., NAIR, J. H., AND BECK, G. A. (1956). The toxicity of butyl cellusolve solvent. Arch. Ind. Health 14, 114-13 1.
CREASY, D. M., AND FOSTER, P. M. D. (1984). The morphological development of glycol ether induced
GRANT :- ’ - tl AL.
testicular atrophy in the rat. Exp. Mol. Pathol. 40, 169-176.
DOE, J. E., SAMUELS, D. M., TINSTON, D. J.. AND DE SILVA WICKRAMARATNE, G. A. (1983). Comparative aspects of the reproductive toxicology by inhalation in rats of ethylene glycol monomethyl ether and propylene glycol monomethyl ether. Toxicol. Appl.
Pharmacol. 69, 43-47. ECETOC (1982). The Toxicology of Ethylene Gl.vcol
Monoalkyl Ethers and Ifs Relevance to Man, Technical Rep. No. 4. European Chemical Industry Ecology & Toxicology Centre, Brussels.
FISHER, G. H. (1965). The New Form Statistical Tables:
Open University Set Book. Univ. of London Press. London.
FOSTER, P. M. D., CREASY, D. M., FOSTER, J. R., THOMAS, L. V., COOK, M. W., AND GANCOLLI, S. D. (1983). Testicular toxicity of ethylene glycol mono- methyl and monoethyl ethers in the rat. Toxicol. Appl.
Pharmacol. 69,385-399. MCDOWELL, E. M., AND TRUMP, B. F. (1976). Histologic
fixatives suitable for diagnostic light and electron microscopy. Arch. Pathol. Lab. Med. 100, 405-414.
MILLER, R. R., AYRES, J. A., CALHOUN, L. L., YOUNG, J. T., AND MCKENNA, M. J. (1981). Comparative short-term inhalation toxicity of ethylene glycol monomethyl ether and propylene glycol monomethyl ether in rats and mice. Toxicol. Appl. Pharmacol. 61,
368-377. MILLER, R. R., CARREON, R. E., YOUNG, J. T., AND
MCKENNA, M. J. (1982). Toxicity of methoxyacetic acid in rats. Fundam. Appl. Toxicol. 2, 158-160.
MILLER, R. R., HERMANN, E. A., LANGVARDT, P. W., MCKENNA, M. J., AND SCHWETZ, B. A. (1983). Com- parative metabolism and disposition of ethylene glycol monomethyl ether and propylene glycol monomethyl ether in male rats. Toxicol. Appl. Pharmacol. 67, 229-
237. NAGANO. K., NAKAYAMA, E., KOYANO, M., OOBAYASHI,
H.. ADACHI, H., AND YAMADA, T. (1979). Testicular atrophy of mice induced by ethylene glycol mono alkyd ethers. Jap. J. Ind. He&h 21, 29-35.
NITI-ER-HAUGE, S. ( 1970). Poisoning with ethylene glycol monomethyl ether: Report of two cases. Acta Med.
&and. 188, 277-280.
OHI, G.. AND WEGMAN, D. H. (1978). Transcutaneous ethylene glycol monomethyl ether poisoning in the work setting. J. Occup. Med. 20, 675-676.
SCHALM, 0. W., JAIN, N. C., JAIN, A. H., AND CARROLL, E. J. (1975). Veterinary Hematology, 3rd ed. p. 4 I 1. Lea & Febiger, Philadelphia.
SNEDECOR, G. W.. AND COCHRAN, W. G. (1968). Sta-
tistical Methods, 6th ed. Iowa State Univ. Press, Ames. WADE, B. H., AND MANDELL, G. L. (1983). Polymor-
phonuclear leukocytes: Dedicated professional phago- cytes. Amer. J. Med. 74, 686-693.
WERNER, H. W., NAWROCKI, C. Z., MITCHELL, J. L., MILLER, J. W., AND VON OETTINGEN, W. F. (1943). Effects of repeated exposures of rats to vapors of monoalkyl ethylene glycol ethers. J. Ind. Hyg. Toxicol. 25,374-379.
ZAVON, M. R. (1963). Methyl cellusolve intoxication. Amer. Ind. Hyg. Assoc. 24, 36-4 I.