i Acute Unscheduled Care Model (AUCM): Enhancing Appropriate Admissions A Physician-Focused Payment Model (PFPM) for Emergency Medicine submitted by: Laura Wooster 2121 K Street NW, Suite 325 Washington DC 200037-1886 202.728.0610 [email protected]
Transcript
i
Acute Unscheduled Care Model (AUCM): Enhancing Appropriate Admissions
A Physician-Focused Payment Model (PFPM) for Emergency Medicine
June 12, 2018 Physician-Focused Payment Model Technical Advisory Committee (PTAC) C/o HHS Asst. Secretary for Planning and Evaluation Office of Health Policy 200 Independence Avenue S.W. Washington, D.C. 20201 [email protected] Re: Acute Unscheduled Care Model (AUCM): Enhancing Appropriate Admissions Dear Committee Members: On behalf of nearly 38,000 members, the American College of Emergency Physicians (ACEP) is proud to submit our physician-focused payment model, the Acute Unscheduled Care Model (AUCM): Enhancing Appropriate Admissions, to the PTAC for consideration. This model is presented to you after years of work conducted by an alternative payment model (APM) task force established by the College as well as technical assistance from the PTAC. Every day, emergency physicians act as gatekeepers to hospitals, making critical decisions about whether the patient should be kept for observation, admitted to the hospital, or discharged. The AUCM model is designed to reflect and reward this important role that emergency physicians play in the health care system. Structured as a bundled payment model, it will improve quality and reduce costs in Medicare by allowing emergency physicians to accept some financial risk for the decisions they make around discharges for certain episodes of acute unscheduled care. It is flexible enough to allow the full spectrum of emergency physicians to participate, should they so choose -- from those with dedicated infrastructure and experience with reporting and meeting quality metrics and taking downside risk, to smaller groups of physicians who do not have as much experience in these areas. We are look forward to continuing to engage with you on this innovative model. As you consider the model, please feel free to contact Laura Wooster, ACEP’s Associate Executive Director of Public Affairs at [email protected]. Sincerely,
4. VALUE OVER VOLUME ....................................................................................................... 20 5. FLEXIBILITY ....................................................................................................................... 20 6. ABILITY TO BE EVALUATED ............................................................................................... 21 7. INTEGRATION AND CARE COORDINATION .......................................................................... 22 8. PATIENT CHOICE ................................................................................................................ 23 9. PATIENT SAFETY ................................................................................................................ 23
Traditional Patient Safety .................................................................................................... 24 10. HEALTH INFORMATION TECHNOLOGY ............................................................................... 24
iv
APPENDIX I: MODEL SPECIFICATIONS .............................................................................. I
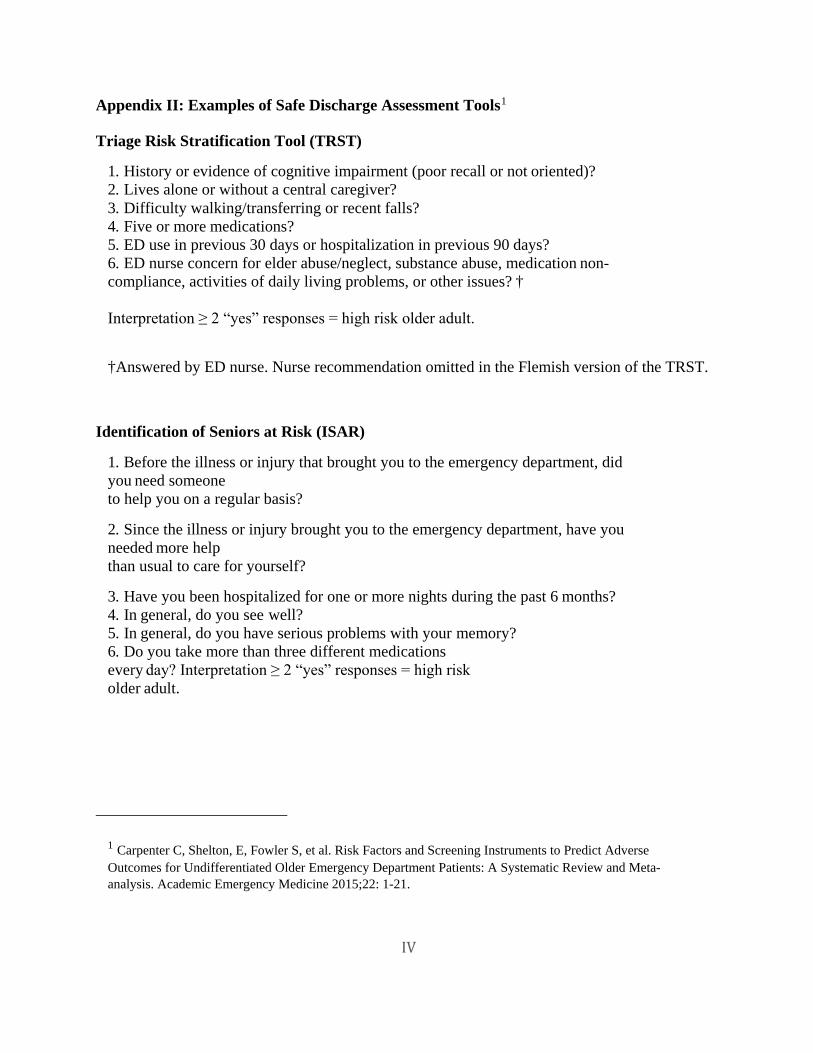
APPENDIX II: EXAMPLES OF SAFE DISCHARGE ASSESSMENT TOOLS ................ IV
TRIAGE RISK STRATIFICATION TOOL (TRST) ............................................................................ IV IDENTIFICATION OF SENIORS AT RISK (ISAR) ........................................................................... IV
APPENDIX III: QUALITY SCORING METHODOLOGY AND ALTERNATIVE QUALITY SCORING METHODOLOGY ............................................................................... V
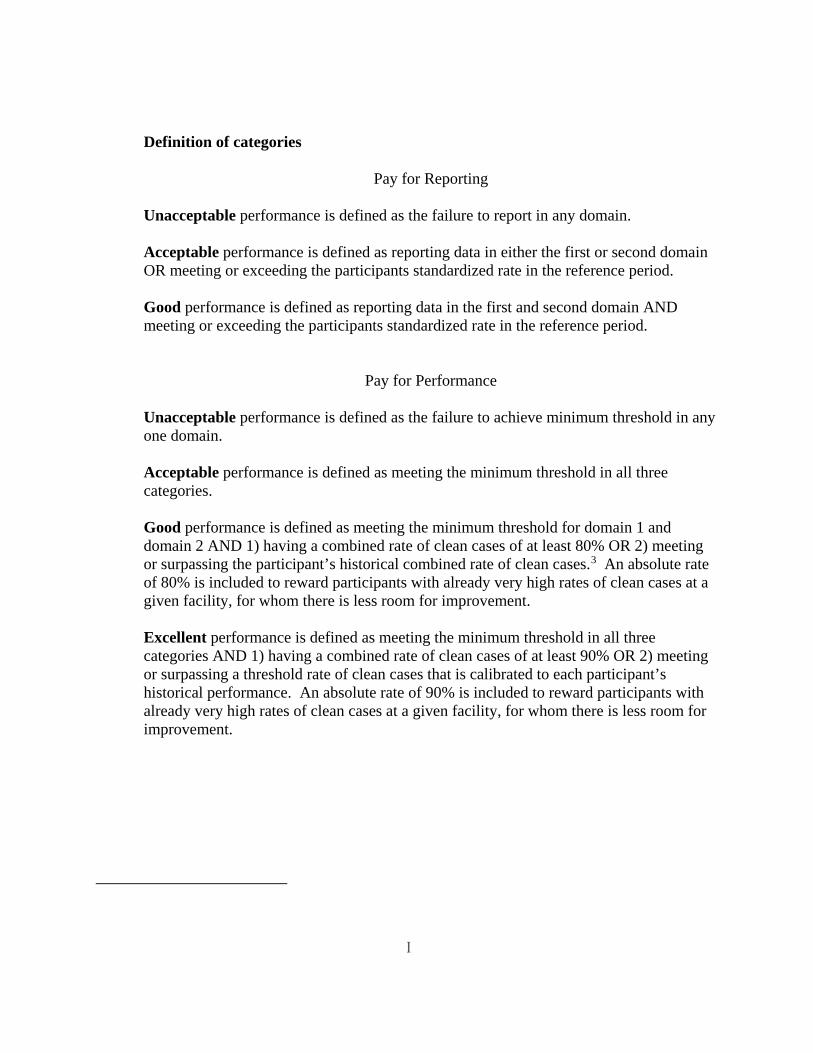
CATEGORIES OF PERFORMANCE AND IMPACT ON EFFECTIVE DISCOUNT RATE. ........................... VI DEFINITION OF CATEGORIES ....................................................................................................... VI CALCULATING THE COMBINED RATE OF CLEAN CASES .............................................................. VII DEFINITION OF THRESHOLDS ................................................................................................... VIII
APPENDIX IV: RISK SHARING OPTIONS .......................................................................... III
APPENDIX V: RISK-ADJUSTED DISPOSITION AND POST DISCHARGE EVENTS .. V
HCC SCORE RISK-ADJUSTMENT ................................................................................................. V CUSTOM RISK-ADJUSTMENT MODELS ........................................................................................ V
Population Restrictions for Model Development .................................................................. V Development of Predictive Models ........................................................................................ V
Models Predicting Discharge to Inpatient Setting or Observation ................................... VI Models Predicting Post discharge Admission to Inpatient Setting or Observation (7 days)........................................................................................................................................... VI Models Predicting Post discharge ED revisit (7 Days) ..................................................... VI Models Predicting Post discharge Mortality (7 Days) ...................................................... VI
Application of Predictive Models .......................................................................................... VI Calculation of Risk-Adjusted Post discharge Event Rates ................................................ VII Final FFS Model for Syncope Admissions to Observation or Inpatient ......................... VIII
APPENDIX VI: RESULTS OF THE APPLICATION OF RISK-ADJUSTMENT MODELS (2014 AND 2015) ....................................................................................................... IX
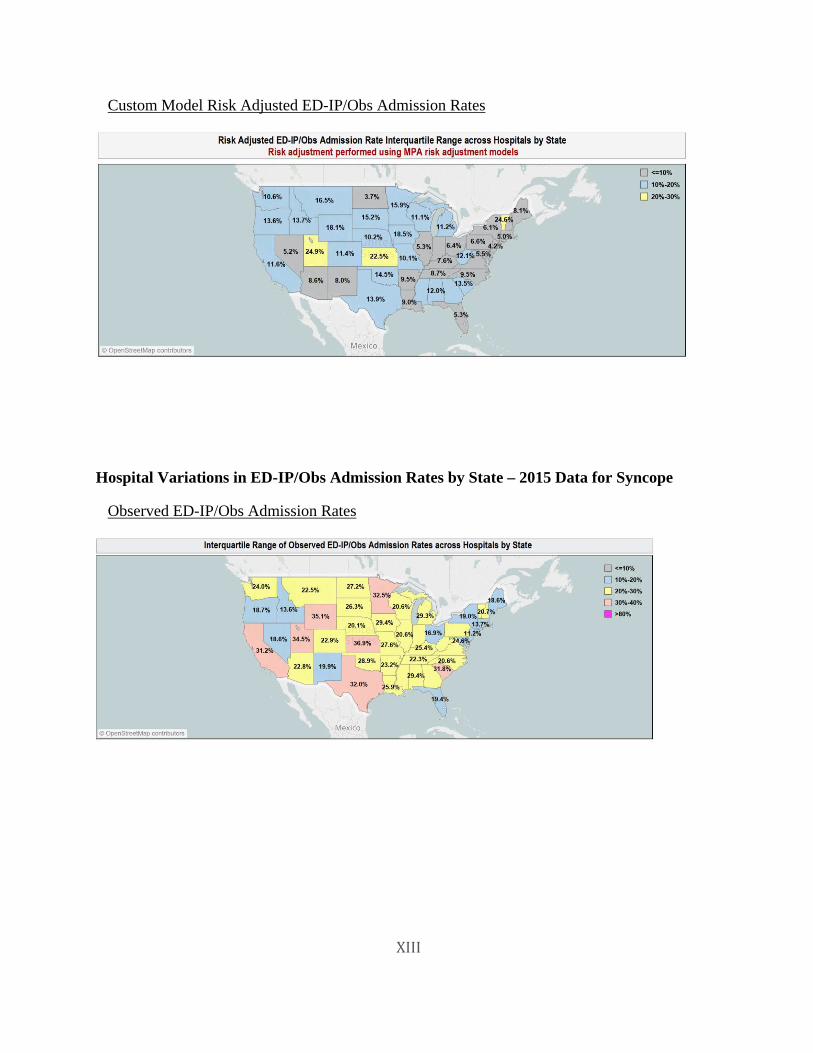
ED INDEX CASE INPATIENT STAY AND OBSERVATION ADMISSION RATE PERCENTILE STATISTICS– 2014 DATA ........................................................................................................... IX ED INDEX CASE INPATIENT STAY AND OBSERVATION ADMISSION RATE PERCENTILE STATISTICS– 2015 DATA ............................................................................................................ X HOSPITAL VARIATIONS IN ED-IP/OBS ADMISSION RATES BY STATE – 2014 DATA FOR SYNCOPE.................................................................................................................................................. XII HOSPITAL VARIATIONS IN ED-IP/OBS ADMISSION RATES BY STATE – 2015 DATA FOR SYNCOPE................................................................................................................................................ XIII
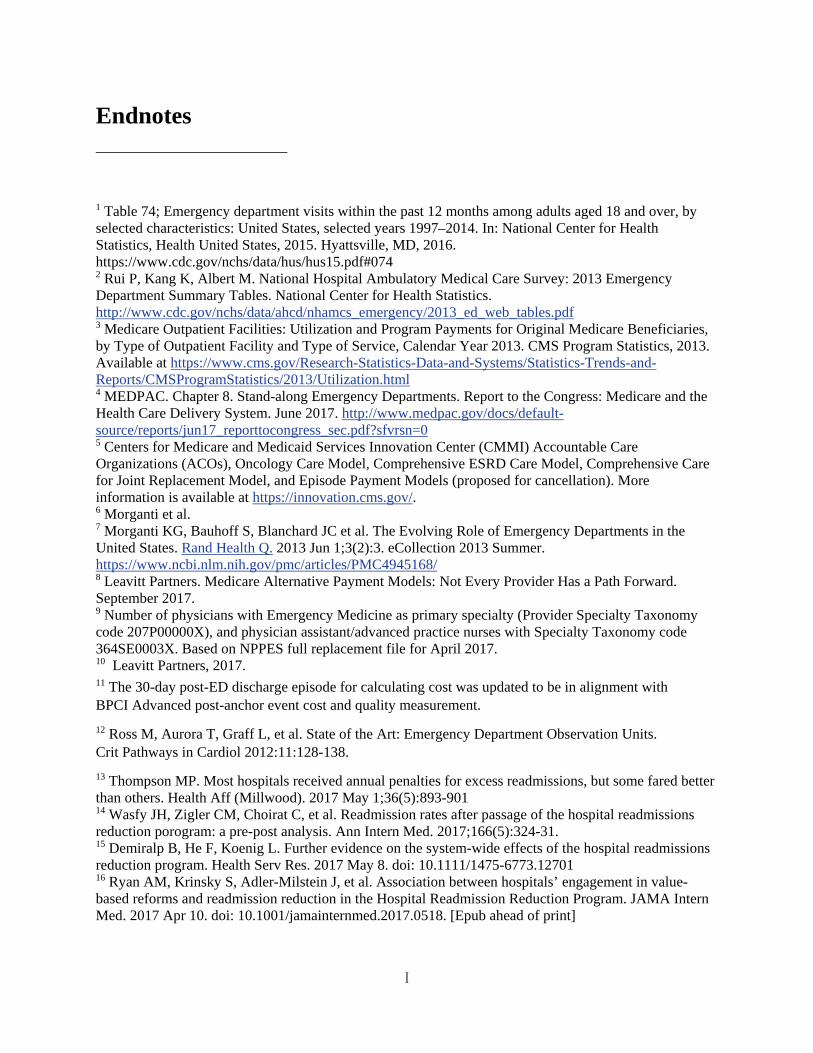
ENDNOTES.................................................................................................................................. II
v
Abstract The Physician-Focused Payment Model (PFPM) model, Acute Unscheduled Care Model (AUCM): Enhancing Appropriate Admissions, which has been proposed by the American College of Emergency Physicians (ACEP), will enable emergency physicians to participate in an Advanced Alternative Payment Model (AAPM) by accepting financial risk and quality-of-care risk that is directly attributable to the medical decision to discharge a patient from the emergency department, rather than admit them to the hospital.
Emergency department (ED) services for acute unscheduled care represent a segment of Medicare expenditures that has not yet received focused attention by the Centers for Medicare & Medicaid Services (CMS) as the agency attempts to drive payment models that reward physicians for providing value over volume. The model fills the gap as it provides incentives to safely discharge Medicare beneficiaries from the ED by facilitating and rewarding post discharge care coordination. It represents the next step beyond the Hospital Readmission Reduction program as it seeks to reward appropriate admission to the hospital for Medicare beneficiaries who present to the emergency department for acute unscheduled care. The model ensures that emergency physicians who make the decision to provide safe, efficient outpatient care have the necessary tools to support this transformation and are rewarded for their decision making.
A thorough analysis of Medicare claims data revealed a significant opportunity to reduce hospital admission rates and costs associated with unscheduled post-ED return visits and admissions. In a review of 6.9 million Medicare fee-for-service (FFS) ED visits in 2014, 35.8% resulted in admission, 7.3% resulted in observation stays, and 54.7% resulted in discharges to home or the community. Significant variation seen in risk-adjusted admission rates across states, facilities, and clinical categories confirmed the opportunity. In cases discharged home to the community, there was a post discharge event (i.e. death, repeat ED visits, inpatient admission, observation stay) rate of 8.8% at 7 days, and 19.9% of 30 days. At the same time, as many as 45% of ED patients discharged home received no other Medicare services within 7 days of discharge; at 30 days, this rate remained as high as 17% for some categories of discharge diagnoses. This analysis has identified significant variation in post-discharge care patterns as well.
The model is focused on rewarding clinicians for reducing costs in three ways. The first is by reducing hospital inpatient admissions or observation stays. The second is by enhancing the ability of emergency physicians to coordinate, manage and avoid unnecessary post discharge services, when appropriate. The third is by avoiding post-ED visit patient safety events and their associated costs. The proposed monitoring of post discharge events (death, repeat ED visits, inpatient admissions and observation stays) protects Medicare beneficiaries and will ensure that attempts to decrease the cost of care do not result in decreased quality. The model will honor patient preference to avoid hospitalization and observation stays (when appropriate) through provision of transitional follow-up care in the home environment.
The proposed payment methodology is an episode-based, bundled-payment model like the Bundled Payments for Care Improvement Advanced Model (BPCI Advanced). In the model, however, a qualified episode is triggered by the submission of a Medicare claim for an eligible
vi
visit by an ED physician. Medicare FFS claims for all items and services furnished during that clinical episode will continue to be processed under the relevant Medicare payment system rules. On an annual basis, Medicare FFS expenditures for the Clinical Episode will be subsequently reconciled against the final target price.
The model also includes payment waivers for ED acute care transition services, telehealth services, and post discharge home visits, which will provide emergency physicians with the necessary flexibility and tools to better coordinate care for their patients, and which will be necessary to promote better outcomes and better patient care quality and safety profiles. The model includes a robust set of outcome measures that can be calculated by CMS using claims and, electronic health record (EHR) data and a set of patient safety measures. When combined, these measures set a minimum (floor) for qualifying for reconciliation payments as well as to provide safeguards against inappropriate discharges that result in potential patient harm or additional cost.
For the first two to three years, the model focuses on episodes related to four high-volume ED conditions – abdominal pain, altered mental status, chest pain and syncope. Starting in year 3, the model will expand to include additional diagnoses (excluding those that result in greater than a 90% admission rates per condition) as well as qualifying visits by dual-eligible beneficiaries. To maximize participation from both large and small physician groups, the model will include three options for risk-sharing that enable emergency physicians to either take on downside risk immediately or ease into risk over time.
ACEP believes that the model has the opportunity to significantly reduce Medicare spending, while improving the quality of care that patients receive in the ED. The model guarantees savings for Medicare by building a discount into the target price for each episode and produces additional savings by reducing hospital admissions and other post-discharge costs associated with each episode. A conservative 3% decrease in admission rates for these conditions could reduce annual Medicare spending by $314 million. Over time, a national 8% decrease in admission rates for just the four initial high-volume ED conditions could save Medicare over $840 million annually.
ACEP anticipates that the evaluation of the model will demonstrate that when emergency physicians are rewarded for making the right disposition decisions for their patients in the ED and following up with them after the visit, not only will health care spending decrease, but patient outcomes will improve and both provider and patient satisfaction will increase as well.
1
I. Model Description
1. Background
The Acute Unscheduled Care Model (AUCM), proposed by the American College of Emergency Physicians (ACEP), is a physician-focused payment model (PFPM) that will drive value-based care in the emergency department (ED). Once the evaluation, diagnosis, and acute management of a patient’s condition is completed in the ED, there is a significant difference in both immediate and ultimate cost for various ED discharge disposition decisions (inpatient versus outpatient care). The model is not simply designed to reduce inpatient admissions but seeks to address the lack of tools available to emergency physicians to ensure that Medicare beneficiaries receive safe and high-quality care, while avoiding unnecessary costs during and following an ED visit. Thus, it is designed to facilitate and reward emergency physicians who choose the right care, for the right patient, in the right setting, with a desirable overall quality and cost profile.
Overall, nearly 20% of the US population visits the ED each year.1 There were over 25.5 million ED visits by Medicare beneficiaries in 2013,2 amounting to $3.5 billion3 in total program payments. By 2015, the number of ED visits by Medicare beneficiaries had grown to approximately 28 million.4 These episodes of unscheduled acute care provided by emergency physicians represents a segment of Medicare expenditures that has not yet received focused attention by the Centers for Medicare & Medicaid Services (CMS) as it attempts to drive new payment models that reward physicians for providing value over volume.
Currently, emergency care is only indirectly involved and contributory to the currently-recognized CMS Advanced Alternative Payment Models (AAPMs), such as: Accountable Care Organizations (ACO) models; specialty-based, disease-based, and surgery focused models; and medical and procedural care episodes.5 These latter models establish episodes that are primarily triggered by an inpatient admission (before which an ED encounter may or may not have occurred), and also penalize emergency care that occurs in the post-acute care period. To date, there is little recognition of the contribution by emergency physicians to the quality of care during the initial diagnosis, stabilization, and treatment prior to inpatient admission. In all, emergency physicians are pivotal decision makers, participating in half of all hospital admission decisions. Furthermore, the inpatient stays themselves account for nearly a third of healthcare costs.6 Emergency Departments play an essential and complementary role to a robust primary care system and result in appropriate management of complex Medicare beneficiaries with potentially severe medical problems.7
Thus, despite the pivotal role of emergency care in driving both quality of care and cost, and even though many emergency physicians are ready to accept the risk inherent in AAPMs, there simply are few opportunities to do so. Leavitt Partners, in their September 2017 report, explicitly called out emergency physicians as a provider category with “no avenues to participate in a Medicare APM,” defined by using consensus criteria of the Healthcare Learning and Action Network that was created by the Department of Health and Human Services (HHS) to advance the APM agenda. Fee-for-service, pay-for-reporting and pay-for-performance models are the only models widely available to emergency physicians.8
This model will fill the current, significant gap in available models for emergency physicians. ACEP estimates that approximately 48,000 emergency medicine physicians and advanced
2
practice professionals9 could participate. Furthermore, because of this model, an expanded number of Medicare beneficiaries will have access to acute unscheduled care that is focused on value and not volume and is focused on better utilization of the continuum of care, rather than focusing on hospital-based, acute care resources. Because commercial payers have not yet developed emergency specific payment models,10 the model also provides an important opportunity for CMS to provide crucial leadership in this area. Importantly, this model ensures that emergency physicians who make the decision regarding hospital or outpatient care have the necessary tools to support this transformation and are rewarded for their decision making.
2. Model Overview
The model will allow emergency physicians to accept quality-of-care and financial risk that is directly attributable to their discharge disposition decisions within qualifying episodes of acute unscheduled care. By doing so, the model will enable CMS to effectively engage emergency physicians in value-driven care, helping to: avoid initial hospital admissions; promote safe discharge of Medicare beneficiaries to the home environment; and foster care coordination regarding post discharge workups that will reduce post-ED patient safety events.
Figure 1. AUCM: Focus on ED Discharge Disposition
The goals of improving quality and decreasing costs in Medicare will be accomplished through the adoption of patient-centric care redesign that identifies patients at risk for post-discharge events and enhances their post-ED discharge care. This redesign will be quality-driven and is incentivized through Medicare payment waivers that are available in other Center for Medicare & Medicaid Innovation (CMMI) models. The model will reward clinicians who are able to reduce costs in three possible ways while continuing to provide high-quality care. The first is by reducing avoidable hospital inpatient admissions or observation stays. The second is by enhancing the ability of emergency physicians to coordinate and manage post-discharge services and, when appropriate, avoid them. The third is by avoiding post-discharge return ED visits, patient safety events, and their associated costs.
3
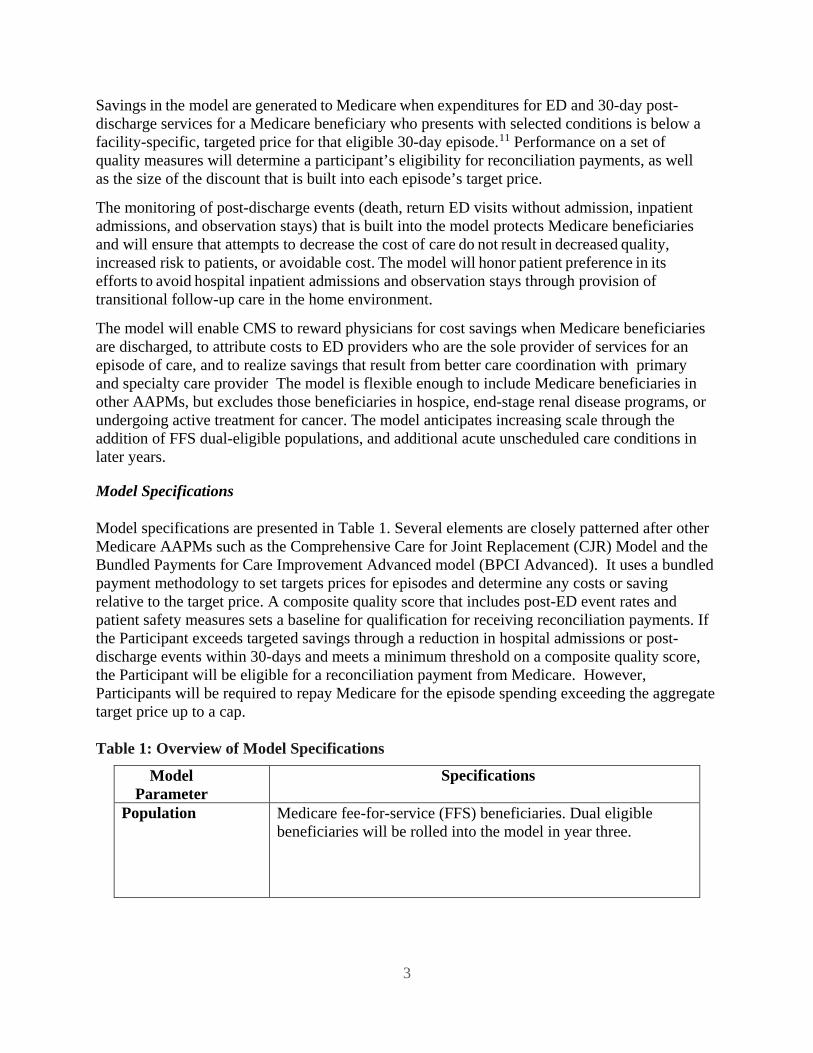
Savings in the model are generated to Medicare when expenditures for ED and 30-day post-discharge services for a Medicare beneficiary who presents with selected conditions is below a facility-specific, targeted price for that eligible 30-day episode.11 Performance on a set of quality measures will determine a participant’s eligibility for reconciliation payments, as well as the size of the discount that is built into each episode’s target price.
The monitoring of post-discharge events (death, return ED visits without admission, inpatient admissions, and observation stays) that is built into the model protects Medicare beneficiaries and will ensure that attempts to decrease the cost of care do not result in decreased quality, increased risk to patients, or avoidable cost. The model will honor patient preference in its efforts to avoid hospital inpatient admissions and observation stays through provision of transitional follow-up care in the home environment.
The model will enable CMS to reward physicians for cost savings when Medicare beneficiaries are discharged, to attribute costs to ED providers who are the sole provider of services for an episode of care, and to realize savings that result from better care coordination with primary and specialty care provider The model is flexible enough to include Medicare beneficiaries in other AAPMs, but excludes those beneficiaries in hospice, end-stage renal disease programs, or undergoing active treatment for cancer. The model anticipates increasing scale through the addition of FFS dual-eligible populations, and additional acute unscheduled care conditions in later years.
Model Specifications
Model specifications are presented in Table 1. Several elements are closely patterned after other Medicare AAPMs such as the Comprehensive Care for Joint Replacement (CJR) Model and the Bundled Payments for Care Improvement Advanced model (BPCI Advanced). It uses a bundled payment methodology to set targets prices for episodes and determine any costs or saving relative to the target price. A composite quality score that includes post-ED event rates and patient safety measures sets a baseline for qualification for receiving reconciliation payments. If the Participant exceeds targeted savings through a reduction in hospital admissions or post-discharge events within 30-days and meets a minimum threshold on a composite quality score, the Participant will be eligible for a reconciliation payment from Medicare. However, Participants will be required to repay Medicare for the episode spending exceeding the aggregate target price up to a cap.
Table 1: Overview of Model Specifications
Model Parameter
Specifications
Population Medicare fee-for-service (FFS) beneficiaries. Dual eligible beneficiaries will be rolled into the model in year three.
4
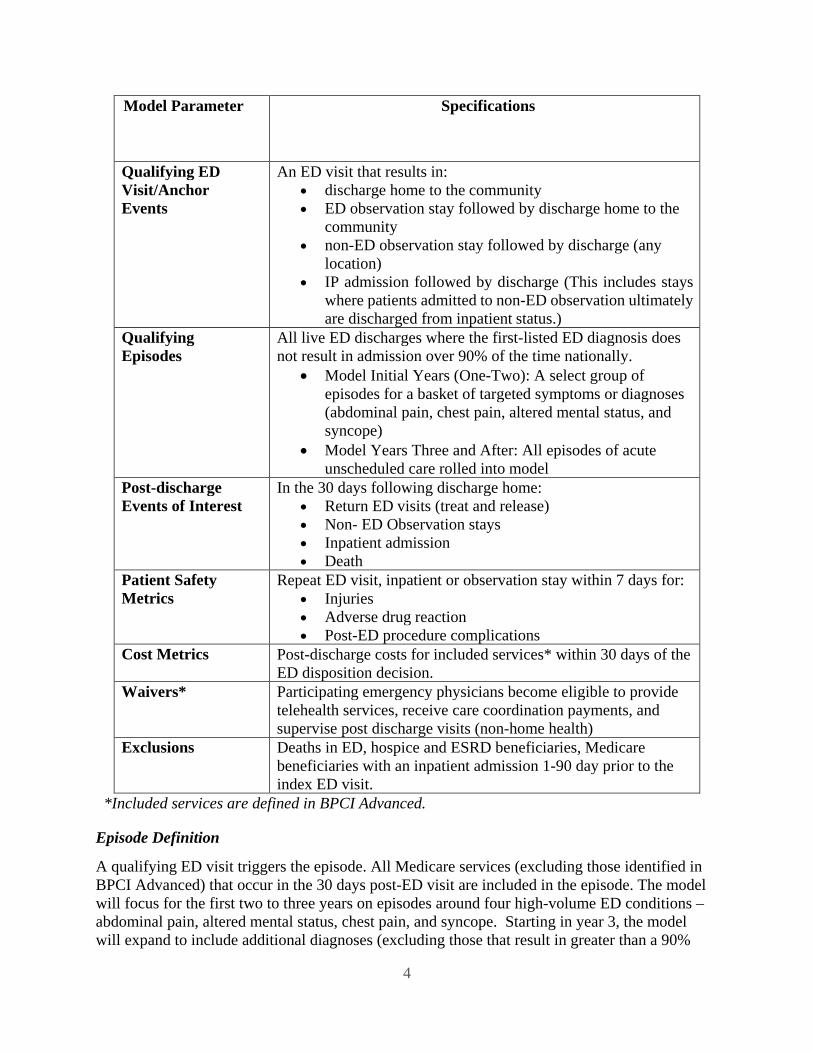
Model Parameter Specifications
Qualifying ED Visit/Anchor Events
An ED visit that results in: • discharge home to the community • ED observation stay followed by discharge home to the
community • non-ED observation stay followed by discharge (any
location) • IP admission followed by discharge (This includes stays
where patients admitted to non-ED observation ultimately are discharged from inpatient status.)
Qualifying Episodes
All live ED discharges where the first-listed ED diagnosis does not result in admission over 90% of the time nationally.
• Model Initial Years (One-Two): A select group of episodes for a basket of targeted symptoms or diagnoses (abdominal pain, chest pain, altered mental status, and syncope)
• Model Years Three and After: All episodes of acute unscheduled care rolled into model
Post-discharge Events of Interest
In the 30 days following discharge home: • Return ED visits (treat and release) • Non- ED Observation stays • Inpatient admission • Death
Patient Safety Metrics
Repeat ED visit, inpatient or observation stay within 7 days for: • Injuries • Adverse drug reaction • Post-ED procedure complications
Cost Metrics Post-discharge costs for included services* within 30 days of the ED disposition decision.
Waivers* Participating emergency physicians become eligible to provide telehealth services, receive care coordination payments, and supervise post discharge visits (non-home health)
Exclusions Deaths in ED, hospice and ESRD beneficiaries, Medicare beneficiaries with an inpatient admission 1-90 day prior to the index ED visit.
*Included services are defined in BPCI Advanced.
Episode Definition
A qualifying ED visit triggers the episode. All Medicare services (excluding those identified in BPCI Advanced) that occur in the 30 days post-ED visit are included in the episode. The model will focus for the first two to three years on episodes around four high-volume ED conditions – abdominal pain, altered mental status, chest pain, and syncope. Starting in year 3, the model will expand to include additional diagnoses (excluding those that result in greater than a 90%
5
admission rate) as well as qualifying visits by dual-eligible beneficiaries. The episode effectively ends at the beneficiary’s death or 30 days after the qualifying ED event. All unscheduled hospitalizations that result from a qualifying ED visit will be included in the calculation of admission rates beginning in year 3. See Appendix I for a list of ICD-10 codes associated with each episode, as well as a sample list of “topped out” diagnoses that could be excluded from the model since they have admission rates above 90%.
Qualifying ED Visit/Anchor Event As the model is focused on the ED disposition decision and attribution to an ED professional, qualifying visits include visits that result in discharge home (1.), AND visits in which observation services were provided in the ED (2.). In both these cases, the ultimate decision to discharge or admit the patient is either made by, or heavily influenced by, the emergency physician. ED observation has been shown to improve outcomes compared to inpatient care and in some studies to improve patient satisfaction.12 As such, the inclusion of observation services as directed by the emergency physician further supports an appropriate range of therapeutic dispositions for the patient (insuring optimal “fit” for their condition), and appropriately includes the cost of services in the model. Medicare beneficiaries treated in ED observation will be provided the same care coordination services and have the same option for discharge to the preferred home environment as those ED patients whom do not require observation prior to discharge.
In this model, observation stays that take place in the hospital in locations other than the ED (3.) are considered the equivalent to an inpatient admission (4.) for calculating the target price. This is justifiable since in both instances, there is a similarity in the care process because in many facilities, observation services are not provided in dedicated units but in traditional nursing units alongside inpatients. ACEP believes that this designation is also appropriate as the emergency physician has transitioned the patient’s care to a physician who will be responsible for further care and the ultimate discharge decision. Non-ED observation status (3.) is not dictated by the emergency physician. The hospital (through its utilization management function) often makes the ultimate decision as to the use status (observation or inpatient) for patients that are discharged from the emergency department to these services. These decisions are often dependent on widely available standards to determine if the patient’s condition meets the criteria for inpatient status.
Post-Discharge Events of Interest Unscheduled post-discharge events such as return ED visits, observation stays, and admissions contribute to episode cost, inconvenience patients and their families, and may reflect lapses in quality. ACEP chose these events as they are in alignment with the components of the CMS quality measure: Hospital-Level 30-Day Risk-Standardized Excess Days in Acute Care.
Quality Measures and Scoring Methodology The model directly ties payment to the quality of care delivered. It includes two quality scoring methodologies (one main methodology and one alternative) that are used both to set the target price and to determine eligibility for reconciliation payments. The quality score is composed of three measures in the domains of patient engagement (Safe Discharge Assessment), the process of care coordination (Shared Decision Making), and post-discharge outcomes (Event-free post-discharge rate). Performance on these three measures will be classified as unacceptable,
6
acceptable, good, and excellent, which will impact the size of the discount applied to the target price (see Target Price discussion below). Appendix III describes the two methodologies in greater detail.
Payment Methodology
The payment methodology is a bundled payment model with retrospective reconciliation. The model does not include a national or regional spending target. A Participant will be benchmarked against its own historical performance. This closely mirrors the methodology and intent of the Medicare Readmission Reduction Program, as well as many CMS APMs. If spending for eligible and attributed episodes is less than the target price, the Participant would be eligible for a positive reconciliation payment. If spending for attributed episodes exceeds the target, then the Participant will be required to reimburse CMS (subject to stop gain/stop loss requirements).
Target Price
A facility-based target price for each presenting condition is calculated by CMS based on three years of historical claims and a specified discount percentage for the initial ED visit plus all costs incurred for 30 days post discharge (including new services associated with waivers). The discount percentage will range from 1.5 percent to 3.0 percent depending on the Participant’s quality performance score. (See Table 2). The discount represents guaranteed savings to Medicare in the form of expected reductions in hospital admissions and post-discharge services. The target prices will be updated annually, and risk adjusted using the CMS-HCC methodology or other methodology as determined by CMS.
Table 2: Categories of Performance and Impact on Effective Discount Rate Quality
Performance Category
Effect on Discount Rate Eligibility for Reconciliation Payment
Unacceptable The effective discount is 3% Not eligible Acceptable The effective discount is 3% Meeting the minimum threshold in all three
categories Good The effective discount is 2% Meeting the minimum threshold in all three
categories AND 1) having a combined rate ED visits without post-discharge events of at least 80% OR 2) meeting or surpassing the Participant’s historical combined rate of clean cases* that is calibrated to each facility’s historical performance.
Excellent The effective discount is 1.5% Meeting the minimum threshold in all three categories AND 1) having a combined rate of clean cases of at least 90% OR 2) meeting or surpassing a threshold rate of clean cases that is calibrated to each facility’s historical performance.
*A Clean Case occurs when NO post-discharge event of interest occurs within 30 days of discharge during a clinical episode.
7
ACEP is proposing a 30-day episode window for attributing post-ED cost. The target price calculation includes Medicare expenditures that occur in the 30-days post-ED discharge period for patients admitted to the hospital or who receive non-ED observation services. This will allow for analysis of costs that are associated with an admission decision.
Risk-Sharing Options
Consistent with other AAPMs, the amount of savings and losses that Participants would either receive or be liable for will be capped at certain percentages. The model includes three options for risk-sharing that balance the needs of small groups who may not initially have the infrastructure to effect care redesign or the cash reserves to take on risk, with those of larger groups who would like accept downside risk immediately. Please see the Appendix IV for an overview for the risk sharing options that would be available for Participants in the model.
Risk Adjustment
Two different risk-adjustment models were utilized in predicting admission rates. The first method utilized the CMS Hierarchical Condition Category (HCC) methodology. In addition, custom risk-models were built by MPA Healthcare Solutions. The methodology for these models and outputs can be found in Appendix V.
Payment Waivers
The model includes proposed payments for ED acute care transition services, telehealth services, and post discharge home visits. The payment waivers are explained in the “Payment Methodology” section below.
3. Patient Experience of Care
Under this model, patients will receive better quality and more coordinated care. Found below is a care process model and a discussion that tracks the experience of the patient through an episode.
Figure 2. Care Process
8
A patient will arrive at the ED by ambulance or by another mode of transportation. In all cases, the individual will undergo screening and stabilization required by the federal law, the Emergency Medical Treatment and Active Labor Act (EMTALA). The triage process for all Medicare-beneficiaries will include identification regarding whether they are a hospice beneficiary, a dual-eligible beneficiary (for the first few years), have been hospitalized (inpatient or observation stay) in the prior 90 days, or had a treat-and-release ED visit within the prior 30 days. If the answer is yes to any of these questions, the visit is not eligible for this APM. If a hospital is participating in another APM, a check of the patient’s record for ACO attribution may also be done to avoid double attribution.
A clinician then evaluates the patient to determine if his/her presenting symptoms are associated with one of the targeted diagnostic categories. If the answer is yes, the case is then deemed to be eligible to participate in the model. Information regarding the APM will then be provided to the patient and family. Concurrent to clinical care, the patient will undergo a safe discharge assessment (SDA) to identify socio-economic factors and potential barriers to safe discharge, needs related to care coordination, and additional assistance that may be necessary. This interaction is designed to support patient and family engagement and to lay the groundwork for shared decision-making at the time of discharge. The physician will then participate in shared decision-making at the time of discharge and will provide discharge instructions to the patient and family.
If the emergency physician, in collaboration with the primary care physician or designated specialist, determines that the patient is a candidate for discharge, the information captured during the SDA will be used to generate unique patient discharge instructions including identifying symptoms that would require rapid reassessment and return to the ED. If a follow-up visit under the supervision of an emergency physician is appropriate, these arrangements will be made prior to discharge. If the patient cannot be safely discharged, they will be admitted to the hospital or non-ED observation status and all CMS mandated notifications will be provided.
After the initial ED visit, the patient can expect to receive excellent follow-up care from the ED physician, his or her primary care physician, and other specialists as needed. Both the telehealth and post-discharge home visit payment waivers will allow the patient to receive additional home-based services.
Another added benefit of the model from the patient’s perspective relates to observation stays. Medicare beneficiaries are often confused about the difference between observation and inpatient status and become dissatisfied when they receive bills for outpatient services they believed to be covered through Part A. In response to this issue, CMS now requires that Medicare beneficiaries who are in outpatient status for greater than 24 hours receive a Medicare Outpatient Observation Notice (MOON). As the model is designed to decrease admissions to observation status by empowering additional patient-centered alternatives, Medicare beneficiaries will find themselves in this situation less often.
4. Provider Experience
Participating Eligible Professionals ED clinicians will be empowered to make the right disposition decision for the right patient at the right time. In cases where socioeconomic or other factors might otherwise prevent a
9
physician from discharging the beneficiary home, the tools include care transition and telehealth services helps to ensure appropriate follow-up (and reduced risk for patients facing barriers to appropriate care). The physician is responsible for the final assessment of the safety and appropriateness of discharge of the patient at the time of disposition. This assessment will include information derived from the clinical care episode and the safe discharge assessment (SDA) that is done in parallel to the clinical evaluation and management. See Appendix II for examples of SDA tools that emergency physicians can use.
Participant- Risk bearing Entity Since this payment model is focused on physicians specifically, the risk bearing entity is the physician group, the faculty practice plan in academic settings, or the hospital in the case of employed physicians. Successful participation is based upon the entity’s ability to meet quality requirements and to achieve the targeted rate of reductions in admissions for qualifying ED visits at a given facility. The funds will therefore flow between CMS and the participating entity. In developing the model, ACEP adopted a model like that in physician-led ACO models, where credit for the avoidance of admissions and a portion of subsequent savings are directed to the physician-led entity.
ED Clinician The initial workflow for the ED clinician will be unchanged. If the preliminary assessment is that the patient is eligible (initially, abdominal pain, altered mental status, chest pain, or syncope), they will initiate the SDA and review the results at the time of discharge disposition. The clinician will participate in shared-decision making with patients and their families. As a part of the process, the clinician will speak with the primary care provider (PCP) or specialist (or their designee) who will be participating in the care of the patient. If requested by the PCP or on call physician who will be providing follow-up services, the ED Participant (risk-bearing entity) may arrange either in person or remote follow-up. Claims for these services will be reimbursed due to the established waivers included in the model.
The Patient’s Primary Care Provider (PCP) The model provides an opportunity for PCPs to obtain more timely information about their patients who receive acute care through direct outreach from an ED-based care coordinator. It requires emergency physicians to communicate with the physician or their designee who will provide follow-up care. This requirement is supported by our analysis of 2014 Medicare claims data. In the study, 45% of the patients discharged home received no other Medicare services within 7 days of discharge; at 30 days, this rate remained as high as 17% for some categories of discharge diagnoses. The care coordinator will assist scheduling any necessary specialist follow-up for patients as directed by the PCP. The model mandates contact with the PCP or their designee. This is designed to facilitate the handoff of the patient to the patient’s PCP, the specialist they request, or to another physician when the primary care physician or his designee is not available. This latter scenario may occur when Medicare beneficiaries are domiciled in another state for part of the year or when they seek acute care while traveling or if residing in another part of the country. If the primary care physician or their designee is not available, the ED physician will coordinate care with physicians providing services through the Medicare Conditions of Participation required hospital on-call list.
10
Hospital Experience A reduction in admissions has the potential to adversely impact hospital revenue. However, in a broader context of value-based reimbursement, there are several potential benefits. The model provides a mechanism through which the hospital can more effectively engage emergency physicians in improving outcomes and reducing costs within hospital-based APMs and health system ACOs. With the adoption of metrics and penalties for readmissions and other excess days in acute care, hospitals have the opportunity to improve their scores in other CMS programs and thus preserve revenue. The use of care coordination and telehealth services also have opportunity to positively impact patient satisfaction.
Alignment with BPCI Advanced would allow sharing arrangements with the hospital or a healthcare system. Such a provision may better align the hospital and ED group financial incentives as reducing admissions may directly impact hospital revenue.
ACEP does not believe that current contracting models between physician groups and hospitals pose any conflict with this model. ED groups and hospitals already share the clinical risk and responsibility for appropriate care, including the risk that poor discharge decisions might result in patient harm. This enhances this shared accountability as it focuses on improving patient transitions of care. It also adopts a similar process to post-hospitalization care coordination that has been found to reduce readmissions. Hospitals and ED groups will need to work closely together to optimize efficiency and effectiveness in this move to embrace outpatient disposition. ACEP recognizes that the model may initially increase staffing needs in the ED. We anticipate that successful implementation of the model will improve ED effectiveness by decreasing the volume of ED revisits and admissions, which will in turn improve ED efficiency as well. The Emergency Department Practice Management Association (EDPMA), which is the nation’s largest group representing large, medium-size, and small ED groups found no potential conflict with current contracting processes and has endorsed the model.
Other Post-ED-Care Providers Specialists will receive more timely and accurate information about the patient’s condition, treatment provided in the ED, and the urgency of follow-up care. This shifts the burden from the patient and will improve physician-physician care coordination especially when providers are out of network. For physicians taking ED call, it will limit the referral of patients who have a primary care provider and avoid un-necessary visits by beneficiaries. The model includes a mandated physician-physician communication when patients are discharged from the ED to determine when follow-up will occur and to identify consultants who will assume care for the patient. For admitted patients, emergency physicians contact a hospitalist or other physician who assumes responsibility when the patient is admitted or placed into observation status.
II. Response to Criterion
1. Scope (High Priority Criterion)
Since CMS implemented the Hospital Readmission Reduction Program, significant efforts have been focused on reducing readmissions.13,14,15 This approach is only one in a multi-faceted
11
strategy to increase value of health care provided to Medicare beneficiaries, with some evidence of success in reducing readmissions.16 However, CMS has identified that in some cases readmissions are being avoided by shifting potential readmissions towards another form of acute care.17 Recently, CMS has developed a new metric, Excess Days in Acute Care18, in recognition of a significant number of cases where an inpatient admission is avoided, while beneficiaries receive observation care as the alternative. The Excess Days measure set also tracks post discharge ED visits as part of this broader approach to monitoring utilization of acute care services.
Anecdotally, a limited number of emergency physicians participate indirectly in the landmark Medicare Shared Savings Program. However, there are broad swathes of the country where limited penetration of AAPM-qualified ACOs exist (see Figure 3). CMS has taken steps to recently expand access to AAPMs, such as through the BPCI Advanced Model. However, even BPCI Advanced does not include episodes that are focused on emergency services. The model will provide the only possible option for emergency physicians to directly participate in an AAPM and perhaps reach the threshold for being a Qualifying APM Participant (QP) and receiving a five percent Medicare payment bonus.
Figure 3. Proportion of hospital beds affiliated with an ACO19
It should also be acknowledged that simply including emergency physicians in many current AAPMs as they expand will not be sufficient. Provision of ED care is particularly sensitive to patient choice and geographic mobility. In a review of 23 million ED visits by 11.3 million Medicare beneficiaries in 2014, 7.5% of Medicare beneficiaries with ED visits had at least one out-of-state visit. Nationally, 5.8% of ED revisits occurred outside the patient’s home state.20 The unique nature of acute unscheduled care also means that Medicare beneficiaries and other Medicare beneficiaries often receive care at multiple facilities over time, due to ambulance diversion21,22 or the need for specialized trauma, stroke, or cardiac services available only at designated tertiary care centers, or simply due to patient choice in a geographic area with multiple hospitals.
A precedent exists for enabling better post-inpatient care coordination and services in other CMS AAPMs, such as CJR, Next Generation ACO, and BPCI Advanced. These models include sharing opportunities that reward physician commitment to quality projects and economic stewardship, supplemental fees for care coordination, waivers for telehealth services, and payment for post discharge visits by non- HHA providers. The use of such methods is not currently allowed or reimbursed by CMS following discharge from the ED.
12
The model complements or expands upon current Medicare value-based care models and methodologies. Examples of alignment appear in Table 3 below.
Table 3: Alignment of AUCM with other CMS programs and methodologies CURRENT CMS MODEL FOCUS AUCM FOCUS
Readmission Reduction Program Reduce acute care readmissions Reduce post-ED visit admissions
Transitional Care Payment Improve post-hospitalization care transitions
Improve post-ED care transitions
CJR and BPCI Advanced Incentivize telehealth and post-discharge visits by non- HHA
providers
Incentivize telehealth and post-discharge visits by non HHA
providers
MACRA Cost of Care Measures 30-day post-inpatient discharge costs
30-day post-ED discharge costs
There are nearly 48,000 physicians and advanced practice professionals for have self-identified as specializing in emergency medicine. In our analysis of ED visits in 2014 by a subset of 5.3 million Medicare FFS patients, we identified 178,571 distinct providers23 billing Part B claims for ED evaluation and management or observation services. We estimate that 25.8% of these ED providers would have an estimated AUCM case volume in this population that amounts to at least 25% of their total annual Medicare FFS ED case volume.24
As discussed above, the model will include four conditions in the first two years, and then add more conditions over time. ED conditions that result in a greater than 90 percent inpatient admission rate would be excluded. The initial four proposed conditions ( abdominal pain, altered mental status, chest pain and syncope) are high volume, high cost, symptom-driven diagnoses that were identified as showing marked variation in risk-adjusted readmission rates25. Researchers have found that many symptom-based diagnostic categories are also associated with an increased risk of death in the thirty days following discharge.26
2. Quality and Cost (High Priority Criterion)
The model focuses on improving quality of care provided to Medicare beneficiaries through a focus on:
• avoiding hospitalization in low-risk populations, • providing incentive for deployment of care models to enable intermediate-risk Medicare
beneficiaries to be discharged safely, and • avoiding post discharge events in high-risk populations that are not admitted.
Our preliminary analysis demonstrates opportunity for cost savings based on the risk-adjusted variation in admission/observation stays across hospitals at the national level for three high frequency, high cost diagnoses.
13
Figure 4. Hospital-level variation in observed and risk-adjusted rates of admission to inpatient or observation stay
This variation (of up to 15%) in admission rates for symptom-based ED discharge diagnoses, points to an estimated opportunity for reduction of 3% to 8%. From our clinical and practice-based experience, there is likely variation in readiness to coordinate care of patients who might safely be discharged, depending on whether appropriate services and/or follow-up care are available. A recent study27 determined that few facilities have resources currently in place to coordinate post-discharge care with emergency physicians. The implementation of transition of care programs, telehealth, and post-ED visit programs that are included in the proposed model and are designed to complement or supplement primary care and the patient’s own self-care following the ED visit.
Measures: Focus on patient-focused post discharge events
A strength of this model is that it focuses on post discharge outcomes, rather than process measures, of importance to patients. These outcomes can be measured at 30 days, using claims data, to ensure that quality of care is preserved as practice changes are implemented return to ED, post discharge death, admission for inpatient acute care hospital stay, and admission to observation status.
An important consideration is the relationship between the admission rate of the index ED visit and the subsequent post discharge event rates of beneficiaries that were discharged home. An argument can be made that hospitals with low admission rates should have admitted more beneficiaries and that they will have higher post discharge event rates. Similarly, high admission-rate hospitals may well make the case that they will have lower post discharge event rates as justification for more frequent admissions. We used linear regression to examine the relationship of admission rates to subsequent post discharge event rates at 30 days in syncope beneficiaries, and found no relationship (p = 0.68, R2=0.00005).28 Figure 5 illustrates this lack of relationships
14
between the initial ED admission rate and the 30-day post discharge event rate for syncope ED visits by Medicare beneficiaries.
Figure 5. There is no relationship between rate of ED admissions (to inpatient or observation) and 30-day post discharge event rates for ED visits discharged home
Quality As described above, the model greatly emphasizes improving care coordination and quality of care. It includes a quality scoring methodology that will be used to define successful participation and eligibility for reconciliation payments. It also includes an alternative option for quality scoring that would allow for a smoother transition for Participants, especially small groups who may need additional time to redesign care or who are inexperienced in taking on downside risk. This option allows for two years of pay-for-reporting before moving to pay-for-performance.
The proposed quality score is composed of three measures in the domains of patient engagement (Safe Discharge Assessment), the process of care coordination (Shared Decision Making), and post-discharge outcomes (Event-free Post-discharge rate). The Shared Discharge Assessment and Shared Decision-Making measures could be submitted through the use of certified electronic health record technology (CEHRT). The Event-free Post discharge measure computes the rate of qualifying cases that come into the ED, are discharged to home, and in the subsequent 30 days do not have an unscheduled return to the ED or admission to an acute care facility. This measure would be risk-adjusted and be determined by comparing the observed rate at a facility to its predicted rate. Performance on the three measures found below would be classified as unacceptable, acceptable, good, and excellent, based on the ability to meet, or surpass the minimum thresholds for each measure. For more details on the quality scoring methodology, please see Appendix III.
15
Table 4: Overview of Quality Measures
# Measure Domain Measure Minimum Threshold
1.
Patient Engagement/Experience
% of eligible cases in which shared- decision making about discharge plan occurred is reported
40%
2.
Process/Care Coordination
% of eligible cases in which a Shared Discharge Assessment was completed and reviewed by physician is reported
40%
3.
Outcomes
% of eligible cases where an unscheduled ED revisit, hospitalization, or death did not occur within 30 days compared to the prior reference period. (event-free post discharge period)
Calculated at Facility Level
The model does not include quality measures that are applicable to the post-hospital period. Patients who have been discharged from the ED and admitted to the hospital are managed by a hospitalist or other physician who is responsible for any further decision-making. Since these physicians are not participants in the model, the quality metrics that determine the eligibility for reconciliation payments do not apply to them. ACEP would be open to aligning performance measurement related to this population to help support CMS in implementing any future policies and/or models targeted at hospitalists.
Cost Savings Opportunity The model aims to reduce CMS expenditures through the following means:
• Driving post discharge cost savings in low-risk populations compared to in-patient observation or admission;
• Avoiding costs associated with inappropriate ED discharge; and • Leveraging known tools such as care coordination incentives, telehealth incentives and
patient visits by non-HHA providers to impact cost.
In our review of 6.9 million FFS Medicare visits in 2014, 35.8% resulted in admission, 7.3% in observation services, and 54.7% of Medicare beneficiaries were discharged to home. Based on the average allowed cost for MS-DRGs of inpatient stays in our analytic data set, admissions to the hospital represented an estimated $20.8 billion in facility costs. In aggregate, there was a post discharge event rate of 8.8% at 7 days, and 19.9% of 30 days.
The model will generate real cost savings for CMS and opportunities for reconciliation payments for emergency physicians. The model guarantees savings for Medicare by building a discount into the target price for each episode and will produce additional savings by reducing hospital admissions and other post-discharge costs associated with each episode. In Figure 6, we have provided a summary of potential cost savings for reducing admissions for certain high-frequency diagnoses on an ambulatory population. A 3% decrease in admission rates for these conditions
16
population could reduce Medicare spending by approximately $314 million in the first year. An 8% decrease in admission rates over the first three years of the model could save Medicare over $840 million annually. The savings will actually be greater when expenditures for ED-discharge services are reduced as a result of improved care coordination are factored into the savings.
Figure 6. Cost Savings Opportunity
The savings estimates provide a general assessment of opportunity, but the results are confounded by the lack of alignment between ED discharge diagnosis and inpatient MS-DRG.29
Examples of savings at the hospital-level appear in Figure 7. From syncope alone, Medicare savings from reduced expenditures (associated with admissions) could be over $147,000 for a single hospital.
17
Figure 7. Hospital-level facility cost savings scenarios, based on savings from reduced admissions for syncope.
3. Payment Methodology (High Priority Criterion)
As stated earlier, the model is a bundled payment model that includes a retrospective reconciliation, similar to that used in BPCI Advanced. A qualified episode is triggered by the submission of a claim for an eligible visit to Medicare by an emergency physician who has re-assigned their rights to receive Medicare payment to a Participant. Medicare FFS claims for all items and services furnished during that clinical episode will continue to be processed under the relevant Medicare payment system rules. On an annual basis, Medicare FFS expenditures for the Clinical Episode will be subsequently reconciled against the final target price. See Figure 8 for an overview of the entire payment methodology, from the calculation of the target price to the determination of reconciliation payments.
Figure 8. Overview of Payment Methodology
The reason that the model cannot be tested under current payment methodologies is that none specifically target acute unscheduled care that does not result in admissions. In the 2018 QPP Rule, CMS acknowledged the special circumstances of emergency physicians by introducing
18
new reporting options for hospital-based physicians that will be available in future years. However, as described above, emergency physicians still do not have any opportunities to directly participate in AAPMs and be rewarded for their contributions to improved quality and efficiency within care episodes.
Target Price
The hospital-based target price for each presenting condition is calculated by CMS based on three years of historical claims and a specified discount percentage for the initial ED visit plus all costs incurred for 30 days post discharge (including new services that are possible with waivers). The discount percentage will range from 1.5 percent to 3.0 percent depending on the Participant’s performance on quality (see Table 2 above). The target prices will be updated annually over a rolling three-year period. The calculation of the target price maybe revised in alignment with other CMS APM programs. For more information on risk adjustment, see Appendix VI.
ACEP is proposing a 30-day episode window for attributing post-ED cost. The target price calculation includes Medicare expenditures that occur in the 30-days post-ED discharge period for patients admitted to the hospital or who receive non-ED observation services. This will allow for a better comparison to costs that are associated with an admission decision. See Figure 9 for an overview of the target price calculation.
Figure 9. Target Price Calculation
19
Reconciliation Payments and Financial Risk As described above, Participants will receive either a positive or negative reconciliation payment depending on how actual spending for an episode compares to the episode’s target price. If actual spending equals the target price for an episode, the Participant will not receive a reconciliation payment.
In order to identify an appropriate level of risk, ACEP conducted an analysis of ED visits by Medicare FFS beneficiaries. The average total annual physician allowed charges was $12,902. The QPP has set 8% of Medicare Part B revenues as the “nominal risk” threshold to quality as an Advanced APM.30 While ACEP believes that some emergency physicians can take on more than this nominal amount, we also understand that some emergency physicians may be more risk-averse. Therefore, ACEP decided to include three options of risk in the model, allowing Participants to transition into the model. Overall, total risk ranges from 10% to 20%. For physicians whose case mix and volume is comparable to the national average, a maximum loss of $1,290 per year ($12,902 * .10) would represent the financial risk to the physician who does not meet the target. For Participants in option 3 (20% downside risk) a maximum loss of $2,580 would occur. Please see Appendix V for more details on the financial risk options.
Payment Waivers The model includes proposed payments for ED acute care transition services, telehealth services, and post discharge home visits (waivers described in Table 5). These payments would be included in the ED costs for each episode. These proposed waivers are in alignment with those implemented by CMS in BPCI Advanced and the Next Generation ACO Model. Service costs will be included in the overall spending calculation for determining cost of care savings.
Table 5: Proposed Medicare program policy waivers for AUCM
Telehealth Emergency physicians will be allowed to provide telehealth services into the beneficiary’s home or residence and to bill one of the in-home visits under the same waiver that was put in place in the Next Generation ACO Model and other APMs.
Post discharge Home Visit
Licensed clinical staff may provide home visits under the general supervision of an emergency physician to eligible Medicare beneficiaries. The providers may bill these services utilizing the same G-codes utilized in other APMs.
Transitional Care Management
Authorize emergency physicians to bill for a transitional care management code. This could be done utilizing the current CPT codes (99494 and 99496) or the ED specific Acute Care Transition codes submitted to the CPT Editorial panel in 2016.
The licensed clinical staff would include Medicare Part B eligible providers consisting of physician assistants, nurse practitioners, clinical nurse specialist, and clinical social workers. Post-discharge home visits furnished under this waiver would not be furnished to a beneficiary that is receiving home health services.
20
There is a great opportunity for emergency physicians to use telehealth to improve patient care. In one possible scenario, the patient had been transferred by an initial treating rural or small hospital to a tertiary care center for potential admission. Upon evaluation and treatment, it was determined that they did not require admission. In this case, the follow up visit might occur at a rural clinic or hospital that has telehealth capabilities. A second scenario might occur when patients are sent to assisted living facilities that may have telehealth capabilities in place.
It is important to note that a request to waive the 3-day skilled nursing facility (SNF) rule was not included in this proposal as the initial focus is on optimizing safe discharges to the home environment. ACEP does not believe that a waiver of the 3-day stay rule would be required in order for this proposed model to be successful.
4. Value over Volume
Our current model of emergency care completely focuses on the volume of services provided. There are no incentives to discharge a patient or to follow-up with the patient after the ED visit has been completed. Hospitalization is generally perceived as a more prudent choice that facilitates continuous treatment, results in an expeditious work up for new clinical problems, and limits physician liability related to post-discharge adverse outcomes in high risk populations.
The model is designed to increase the ED physician’s and patient’s comfort with a discharge disposition by including financial incentives that reward care coordination, enhance discharge planning, support patient and family engagement, and ensure follow-up care when barriers exist to rapid access to primary or specialty care. The model aligns the emergency physician with the patient’s financial interest in avoiding potential costs associated with observation stays and non-covered SNF costs.
Financial incentives and the ability to improve the transition to home after an acute unscheduled care visit will enable ED providers to impact post discharge events (death, inpatient admissions, observation stays and return ED visits). We anticipate decreased patient safety events, along with support for more standardized post discharge care. Potential cost savings from reduced hospitalizations are tightly tied with incentives to avoid adverse outcomes resulting from inappropriate care.
5. Flexibility
The model is designed to be modular; that is, it can stand alone or be integrated into other APMs. The model allows more than 48,000 providers (physicians, physician assistants and advanced practice nurses) specializing in emergency medicine31 to participate regardless of employment model (independent group, regional group, national group, employed physicians). Although designed for Inpatient Prospective Payment System (IPPS) hospitals, the model is amenable to deployment in rural hospitals and Critical Access Hospitals (CAH) in which a focus on appropriate transfers to other facilities would be emphasized.
It is also flexible enough to allow the full spectrum of emergency physicians to participate, should they so choose -- from those with dedicated infrastructure and experience with reporting and meeting quality metrics and taking downside risk, to smaller groups of physicians who do not have as much experience in these areas. Specifically, it will include an alternative quality
21
scoring methodology with easier standards, as well as three options for risk-sharing that enable emergency physicians to either take on downside risk immediately or ease into risk over time. Specific features of the model were also designed to maximize flexibility. These parameters include:
• Benchmarking Methodology: As performance will be benchmarked at the facility level,efforts to impact socioeconomic disparities, institutional culture, and to strengthenoutpatient follow up will be measurable and actionable.
• Risk Adjustment: Variation in the admission versus discharge practice can be measuredand risk-adjusted at the hospital level thus allowing the targets to be set that reflects localcommunity or population factors that impact the admission decision.
• Targeted Population. The model targets Medicare FFS beneficiaries. In the first twoyears, dual-eligible beneficiaries are excluded. Various populations can also be excluded(e.g., ESRD, hospice, BPCI participants). The exclusion of patients who have had ahospitalization in the 90 days prior to the ED, hospice beneficiaries or who wereMedicare-Medicaid dual eligible beneficiaries effectively eliminated those presenting tothe ED who would be likely to be receiving home health services or residing in an LTCor skilled nursing facility. The intent of the model is to only include patients dischargedhome to the community. Patients discharged to a skilled nursing facility were excludedfrom the analysis reported in our proposal. In addition, only a very small number of EDcases included in our originally analysis was discharged home to receive Medicare homehealth (0.08% of the total population), providing evidence supporting that the exclusionswe implemented effectively removed this population. That said, this population could beadded to the eligible population in the future.
6. Ability to be Evaluated
ACEP anticipates that the incremental nature of the model and administrative simplicity will allow robust evaluation. ACEP has chosen to align this model with BPCI Advanced, therefore, lessons learned by CMS in evaluating that model can be applied to the model. By proposing to start with only four high volume conditions, the scope of any evaluation will be limited initially and therefore will reduce administrative burden. We are confident that by the end of the model, CMMI and the CMS Office of the Actuary would have enough data to be able to determine whether or not the model met the cost and quality criteria for expansion outlined in Section 1115A(c) of the Social Security Act. An additional benefit is that the evaluation methodology will be similar to that which is used in other CMS APMs. Since all the episodes are based on MDCs ICD-CM classifications (see Figure 10), CMS will be able to compare spending for Participants to spending by non-Participants. ACEP’s Clinical Emergency Data Registry (CEDR) registry and other Qualified Clinical Data Registries (QCDRs) can support Participants as they utilize their data to define, implement, and measure quality improvement activities and care redesign to better performance in their departments. This will allow comparison with MIPS participating-professionals.
22
Figure 10. Advanced Payment Model Episode Eligibility Claims Process
7. Integration and Care Coordination
CMS has recognized that “[a]lthough an estimated 80% of overall health care costs are attributable to the decisions made by clinicians, these same clinicians are often not aware of how their care decisions influence the cost of care.”32 For emergency physicians, this also extends to the quality of care associated with those decisions. There is a critical need to develop models that enable safe, cost-effective outpatient post-ED care that supports care transitions.
This whole model is centered on care coordination from the time the decision is made to discharge the patient to the end of each 30-day episode. Major care-coordination activities include:
• Using care coordinators to facilitate appropriate discharge which has proven effective inthe inpatient to outpatient arena;
• Employing shared-decision making to ensure that patients understand their treatmentoptions;
• Enabling emergency physicians to partner with primary care and to manage unscheduledcare episodes by protocol;
• Enabling emergency physicians to arrange for a post-discharge home visit whenappropriate;
• Enabling use of telehealth to follow up with discharged beneficiaries; and• Incorporating payment for one post discharge follow up visit at home or an ED visit for
selected conditions when post discharge follow up is not available within 48 hours.
23
8. Patient Choice
The Institute of Medicine defines patient-centered care as “respectful of and responsive to individual patient preferences, needs, and values, and ensuring that patient values guide all clinical decisions.” The model meets these criteria by:
• Enabling emergency physicians to coordinate care with family members, supportingcontinuity through post discharge planning with providers, recognizing and managing thebarriers to post discharge follow-up in the local community (including those linked todisparities);
• Enabling Medicare beneficiaries to be treated at home, thus avoiding co-payments forobservation stays or other Part B costs;
• Providing follow-up care for one visit, for those Medicare beneficiaries who are seekingservices in another area of the country; and
• Supporting the use of decision tools that enable Medicare beneficiaries and families to becomfortable with discharge to home.
Participating emergency physicians will notify patients in qualifying episodes that they are included in the model and can discuss any changes to their care that may result. Medicare beneficiaries who do not feel comfortable participating may be allowed to opt-out, but since the goal of the model is to enhance patient care, ACEP does not project many will decided to do so.
9. Patient Safety
It is critical that any model providing financial incentives that are dependent on decreasing utilization of healthcare services includes the measurement of potential adverse outcomes. The choice of candidate measures in the model was driven by the fact that emergency physicians have long been concerned about the risk of death, the frequency of hospitalization and the likelihood of return to the ED after discharge. Unfortunately, they have rarely had access to complete data about these events which may occur at other facilities. The model assumes that CMS-generated performance and cost data, like that provided to other APMs, will be made available on an ongoing basis. This will give emergency physicians an accurate picture of their recent performance and help to identify any potentially troublesome trends that should be addressed long before the reconciliation process. The patient safety measures will provide a new focus on ED-related events such as post-discharge falls, adverse drug events, and post-procedural complications that are in alignment with the Agency for Healthcare Research and Quality (AHRQ) goals and patient safety indicators.33
ACEP was deliberate in choosing the post-discharge events that will be measured and linked to payment. They are in alignment with the movement to measure what matters and to focus on outcomes instead of processes of care. They are also aligned with physician’s professional, ethical, and medico-legal obligations to insure appropriate patient care decision-making. For example, a recent study by Obermeyer et al. exposed the continued risk of post-discharge death within 7 days of an ED visit.34 This justifies the inclusion of a 30-day Post-Discharge Mortality Measure in the model. ACEP also chose to align measurement efforts with other CMS programs and priorities. The inclusion of 30-day measures for return ED visits, inpatient admission or observation are components of the Hospital-Level 30-Day Risk-Standardized Excess Days in Acute Care Measurement methodology.
24
Traditional Patient Safety In our preliminary analysis, we found that in aggregate, there is a post discharge event rate (death, repeat ED visits, admission to the hospital) of 8.8% at 7 days, and 19.9% of 30 days. Inclusion of these metrics aligns with other CMS metrics and will provide ACEP members and hospitals an opportunity to improve post discharge care in a way that is meaningful to patients.
Additional quality and patient safety goals can be captured by ACEP’s QCDR CEDR or other registries such as repeat ED visit, inpatient or observation stay within 30 days for: injuries, adverse drug reaction, or post-ED procedural complications. In our preliminary analysis of Medicare FFS beneficiaries in 2014, of 554,112 return visits to the ED within 7 days of a discharge home from an ED, 8.6% of revisits (n=47,842) were for a patient safety event. 35 The inclusion of discreet patient safety events will provide the hospital and the physician with an opportunity to undertake MIPS- qualified practice improvement initiatives. A break-out by category is provided in Table 6.
Table 6: Patient safety-related ED revisits in a Medicare FFS population
Category of ED diagnosis % of ED revisits Injury 7.2%
Fracture 2.5% Sprain and strain 0.8% Head trauma 0.7% Laceration 3.2%
Adverse drug reaction 1.1% Post-procedure complication 0.4% Visits for other diagnoses 91.4%
ACEP has considered the possibility that avoidable inpatient admissions will have been fully avoided over time and participants are left with financial pressure not to admit patients who should be admitted as we recognized that this is a challenge in all APMs especially those built on an episode of care framework. The research cited in the submission identified significant variations in admission rates across the nation, regions, and hospitals at the diagnosis level Appendix I). The breadth of opportunity makes it unlikely that all facilities will reach this ideal state within the first few years of the program. Additionally, the model is designed to retire or exclude “topped out” diagnoses for which the admission rates at the national level exceed 90% (See Appendix I). In the very rare event where avoidable inpatient admissions have been fully avoided, the physician group will have the option to elect not to participate in the APM which is voluntary by nature.
10. Health Information Technology
The use of certified electronic health record technology (CEHRT) is extremely important for improving care coordination for patients in the model and is therefore an integral part of the model’s overall quality strategy.
We also propose to use the CEDR clinical registry or other registries to provide benchmarks and enable ED group participation in the model. This ACEP-sponsored registry has to date connected
25
with over 15,000 providers in over 1,200 EDs, which are utilizing 14 different EMR/EDIS systems. It currently captures 41 performance measures that are reportable to CMS under the QPP. In 2018, it contains records for over 25 million patient visits.
CEDR can be utilized to capture data on patient safety events. Importantly, it can also be used study the population that does not receive follow-up care in the 30-day post discharge period. This patient-focused effort should seek to determine reasons for the absence of follow-up care and differentiate between instances where the ED may have resolved the condition for which the ED service was rendered, the patient may have opted not to seek follow up care, or barriers may exist and persist in preventing timely care follow-up within the community. To support improvement efforts, we request that CMS provide claims data to participants, following the pattern of data sharing in other CMS AAPMs. CMS would need to adopt registry-based reporting for new post-discharge patient safety measures such as post-ED injuries, adverse drug reactions, or ED procedural complications.
I
APPENDICIES
Appendix I: Model Specifications
ICD-10 codes defining the targeted diagnostic groups
Symptom Group ICD-10 ICD-10 Description Syncope R55 Syncope and collapse Chest Pain R079 Chest pain, unspecified
R072 Precordial pain R0782 Intercostal pain R0789 Other chest pain
Abdominal Pain R109 Unspecified abdominal pain R100 Acute abdomen R1011 Right upper quadrant pain R1012 Left upper quadrant pain R1031 Right lower quadrant pain R1032 Left lower quadrant pain R1033 Periumbilical pain R1013 Epigastric pain R1084 Generalized abdominal pain R1010 Upper abdominal pain, unspecified R102 Pelvic and perineal pain R1030 Lower abdominal pain, unspecified R10829 Rebound abdominal tenderness, unspecified site R10819 Abdominal tenderness, unspecified site R10821 Right upper quadrant rebound abdominal tenderness R10811 Right upper quadrant abdominal tenderness R10812 Left upper quadrant abdominal tenderness R10822 Left upper quadrant rebound abdominal tenderness R10823 Right lower quadrant rebound abdominal tenderness R10813 Right lower quadrant abdominal tenderness R10824 Left lower quadrant rebound abdominal tenderness R10814 Left lower quadrant abdominal tenderness R10825 Periumbilic rebound abdominal tenderness R10815 Periumbilic abdominal tenderness R10826 Epigastric rebound abdominal tenderness R10816 Epigastric abdominal tenderness R10827 Generalized rebound abdominal tenderness R10817 Generalized abdominal tenderness
Altered Mental Status
R410 Disorientation, unspecified
R4182 Altered mental status, unspecified
II
Variations in admission rates at the ED diagnosis level
Derived from analysis of the 2014 Carrier/Part B claims that met the definition for inclusion in the Acute Unscheduled Care Model.
III
Sample “topped out” diagnoses excluded from the proposed APM due to >=90% admission rates.
Derived from analysis of the 2014 Carrier/Part B claims that met the definition for inclusion in the Acute Unscheduled Care Model.
IV
Appendix II: Examples of Safe Discharge Assessment Tools1
Triage Risk Stratification Tool (TRST)
1. History or evidence of cognitive impairment (poor recall or not oriented)? 2. Lives alone or without a central caregiver? 3. Difficulty walking/transferring or recent falls? 4. Five or more medications? 5. ED use in previous 30 days or hospitalization in previous 90 days? 6. ED nurse concern for elder abuse/neglect, substance abuse, medication non-compliance, activities of daily living problems, or other issues? †
Interpretation ≥ 2 “yes” responses = high risk older adult.
†Answered by ED nurse. Nurse recommendation omitted in the Flemish version of the TRST.
Identification of Seniors at Risk (ISAR)
1. Before the illness or injury that brought you to the emergency department, did you need someone to help you on a regular basis?
2. Since the illness or injury brought you to the emergency department, have you needed more help than usual to care for yourself?
3. Have you been hospitalized for one or more nights during the past 6 months? 4. In general, do you see well? 5. In general, do you have serious problems with your memory? 6. Do you take more than three different medications every day? Interpretation ≥ 2 “yes” responses = high risk older adult.
1 Carpenter C, Shelton, E, Fowler S, et al. Risk Factors and Screening Instruments to Predict Adverse Outcomes for Undifferentiated Older Emergency Department Patients: A Systematic Review and Meta-analysis. Academic Emergency Medicine 2015;22: 1-21.
V
Appendix III: Quality Scoring Methodology and Alternative Quality Scoring Methodology
Quality Scoring Methodology
# Measure Domain Measure Minimum Threshold
1.
Patient Engagement/Experience
% of eligible cases in which shared- decision making about discharge plan occurred is reported
40%
2.
Process/Care Coordination
% of eligible cases in which an SDA was completed and reviewed by physician is reported
40%
3.
Outcomes
% of eligible cases where an unscheduled ED revisit, hospitalization or death did not occur within 30 days compared to the prior reference period.
(See Below)
Performance Category
Effect on discount rate Eligibility for reconciliation payment
Unacceptable The effective discount is 3% Not meeting the minimum threshold in all three categories
Acceptable The effective discount is 3% Meeting the minimum threshold in all three categories
VI
Good The effective discount is 2% Meeting the minimum threshold in all three categories AND 1) having a combined rate of clean cases of at least 80% OR 2) meeting or surpassing the participant’s historical combined rate of clean cases that is calibrated to each facility’s historical performance.
Excellent The effective discount is 1.5%
meeting the minimum threshold in all three categories AND 1) having a combined rate of clean cases of at least 90% OR 2) meeting or surpassing a threshold rate of clean cases that is calibrated to each facility’s historical performance.
A clean case occurs when NO post-discharge event of interest occurs within 30 days of the qualifying ED visit.
Categories of performance and impact on effective discount rate.
Unacceptable. The effective discount is 3% and the participant is not eligible for a reconciliation payment.
Acceptable The effective discount is 3% and the participant is eligible for a reconciliation payment.
Good The effective discount is 2% and the participant is eligible for a reconciliation payment.
Excellent The effective discount is 1.5% and the participant is eligible for a reconciliation payment.
Definition of categories
Unacceptable performance is defined as the failure to achieve minimum threshold in any one domain.
Acceptable performance is defined as meeting the minimum threshold in all three categories.
Good performance is defined as meeting the minimum threshold for domain 1
VII
and domain 2 AND 1) having a combined rate of clean cases2 of at least 80% OR 2) meeting or surpassing the participant’s historical combined rate of clean cases. An absolute rate of 80% is included to reward participants with already very high rates of clean cases, for whom there is less room for improvement.
Excellent performance is defined as meeting the minimum threshold in all three categories AND 1) having a combined rate of clean cases of at least 90% OR 2) meeting or surpassing a threshold rate of clean cases that is calibrated to each participant’s historical performance. An absolute rate of 90% is included to reward participants with already very high rates of clean cases, for whom there is less room for improvement.
Calculating the combined rate of clean cases
The combined rate of clean cases is a weighted average rate of clean cases. However, it must be standardized to account for differences in case mix across the groups. If clean cases are more difficult to achieve in one group than another, lower rates of clean cases resulting from increased percentages of cases in the more challenging group should not be penalized. To compute weighted average rates of clean cases, the rate of clean cases for each group is multiplied by the percentage of the total qualifying cases in the corresponding group and the results are added together.
Three combined rates of clean cases are used in evaluating performance: a standardized national rate, a participant’s standardized rate in the reference period, and a participant’s rate in the current period. The national rate and the participant’s rate in the reference period are standardized to reflect the distribution of cases across the groups that the participant experienced in the current period. This allows equitable comparisons of performance, removing the influenced of any shifts in the mix of cases across groups.
A standardized national combined rate of clean cases for a participant is calculated by multiplying the national rate of clean cases in the reference period for each group by a participant’s percentage of total qualifying claims in the corresponding group for the current period. The results are then aggregated to arrive at the standardized national combined rate of clean cases.
A participant’s standardized rate in the reference period is computed by multiplying that participant’s rate of clean cases in the reference period for each
VIII
group by that participant’s percentage of total qualifying claims in the corresponding group for the current period. The results are then aggregated to arrive at the participant’s standardized combined rate of clean cases in the reference period.
While participants with fewer than 20 qualifying cases in the reference period (approximately 6.75% of facilities) would be excluded from participation in the program, it is possible that a participant may have a very low volume in one or more groups. The participant-specific rate in the reference period would, therefore, be unstable. To account for this, we propose the following blended rate approach:
<3 cases: apply the national rate of clean cases 3 to <6 cases: apply a rate calculated as (0.3*participant rate) + (0.7*national rate) 6 to <9 cases: apply a rate calculated as (0.7*participant rate) + (0.3*national rate) 9 or greater: apply the participant rate
Finally, a participant’s rate in the current period is calculated by multiplying that participant’s rate of clean cases in the current period for each group by that participant’s percentage of total qualifying claims in the corresponding group for the current period. The results are then aggregated to arrive at the participant’s combined rate of clean cases in the current period.
Definition of thresholds
Minimum threshold: The minimum threshold is designed to identify a cut point below which there is reason to believe that performance has deteriorated substantively and is not poorer purely due to random variation. The binomial standard deviation (SD), calculated as sqrt[n * p * (1-p)], is used to estimate the lower bound at the 99% confidence level. N is the total number of cases in the current period and p is the participant’s standardized combined rate of clean cases in the reference period. A significance threshold would then be calculated as p – (2.58 * SD).
However, since SD depends upon n, participants with very high volumes of cases may have unreasonably small standard deviations. Optically, it would be problematic to penalize a large volume participant because their combined rate of clean cases declined by a fraction of a percent. Therefore, the magnitude of the shift is also considered in establishing the threshold.
The national combined rate of clean cases, standardized to the participant, and an importance factor (we are proposing 10%) are used to compute an importance threshold. The standardized national combined rate of clean cases is multiplied by the importance factor and the result is subtracted from the participant’s
IX
standardized combined rate of clean cases in the reference period to arrive at an importance threshold.
The minimum threshold would be computed as the lower of the significance threshold and the importance threshold.
Good threshold: The good threshold is designed to identify where care has been maintained or improved. The participant’s performance in the reference period (the participant’s standardized combined rate of clean cases in the reference period) establishes this threshold.
Excellent threshold: The excellent threshold is designed to identify a cut point above which there is reason to believe that performance has improved substantively and is also not better purely due to random variation. This threshold is similar to the Minimum threshold calculation in that it has both a significance threshold and an importance threshold (again, it would be optically challenging to reward a large volume participant as excellent when the combined rate of clean cases increased only a fraction of a percent).
The binomial distribution is used as in the calculation of the Minimum threshold, and a significance threshold is computed as p + (1.96 * SD). To calculate an importance threshold, the national combined rate of clean cases, standardized to the participant, is multiplied by the importance factor. The result is added to the participant’s standardized combined rate of clean case from the reference period to arrive at the importance threshold. The Excellent threshold is then the higher value of the significance threshold and the importance threshold.
Alternative Quality Scoring Methodology
Year 1-2- Pay for Reporting
# Measure Domain Measure Minimum Threshold
1.
Patient Engagement/Experience
% of eligible cases in which shared-decision making about discharge plan occurred is reported
Submission of
data
2.
Process/Care Coordination
% of eligible cases in which an SDA was completed and reviewed by physician is reported
Submission of
data
3.
Outcomes
% of eligible cases where an unscheduled ED revisit, hospitalization or death did not occur within 30 days compared to the prior reference period.
Meets or exceeds
standardized historical rate
Year 3-5- Pay for Performance
# Measure Domain Measure Minimum Threshold
1.
Patient Engagement/Experience
% of eligible cases in which shared-decision making about discharge plan occurred is reported
40%
2.
Process/Care Coordination
% of eligible cases in which an SDA was completed and reviewed by physician is reported
40%
3.
Outcomes
% of eligible cases where an unscheduled ED revisit, hospitalization or death did not occur within 30 days compared to the prior reference period.
(See Formula)
I
Definition of categories
Pay for Reporting
Unacceptable performance is defined as the failure to report in any domain. Acceptable performance is defined as reporting data in either the first or second domain OR meeting or exceeding the participants standardized rate in the reference period. Good performance is defined as reporting data in the first and second domain AND meeting or exceeding the participants standardized rate in the reference period.
Pay for Performance Unacceptable performance is defined as the failure to achieve minimum threshold in any one domain. Acceptable performance is defined as meeting the minimum threshold in all three categories. Good performance is defined as meeting the minimum threshold for domain 1 and domain 2 AND 1) having a combined rate of clean cases of at least 80% OR 2) meeting or surpassing the participant’s historical combined rate of clean cases.3 An absolute rate of 80% is included to reward participants with already very high rates of clean cases at a given facility, for whom there is less room for improvement. Excellent performance is defined as meeting the minimum threshold in all three categories AND 1) having a combined rate of clean cases of at least 90% OR 2) meeting or surpassing a threshold rate of clean cases that is calibrated to each participant’s historical performance. An absolute rate of 90% is included to reward participants with already very high rates of clean cases at a given facility, for whom there is less room for improvement.
II
Categories of performance and impact on effective discount rate
Option 1 Year 1-2 (Pay for reporting option)
Performance Category
Effect on discount rate Eligibility for reconciliation payments
Unacceptable The effective discount is 3%
Not eligible
Acceptable The effective discount is 3%
Submits data in Domain (1) OR Domain (2) OR meets or surpasses a threshold rate of clean cases that is calibrated to the facility’s historical performance.
Good The effective discount is 1.5%
Submits data in Domain (1) and Domain (2) AND meets or surpasses a threshold rate of clean cases that is calibrated to the facility’s historical performance.
Years 3-5 (Pay for performance) Performance Category
Effect on discount rate Eligibility for reconciliation payment
Unacceptable The effective discount is 3% Not eligible Acceptable The effective discount is 3% Meeting the minimum threshold in
all three categories Good The effective discount is 2% Meeting the minimum threshold in
all three categories AND 1) having a combined rate of clean cases of at least 80% OR 2) meeting or surpassing the participant’s historical combined rate of clean cases that is calibrated to each facility’s historical performance.
Excellent The effective discount is 1.5%
meeting the minimum threshold in all three categories AND 1) having a combined rate of clean cases of at least 90% OR 2) meeting or surpassing a threshold rate of clean cases that is calibrated to each facility’s historical performance.
III
Appendix IV: Risk Sharing Options
Option One (Pay for Reporting Transitioning to Pay for Performance)
Measure frequency of post-ED patient safety events
3
All FFS Excluding dual eligibles
All*
Yes
10%/ 10%
Adopt additional outcome measures
Set benchmark national rates
4-5
All FFS
All*
Yes
20%/ 20%
Maintain outcome measures
Integrated into quality score
V
Appendix V: Risk-adjusted Disposition and Post Discharge Events
HCC Score Risk-Adjustment
The HCC community scores were generated for all observations in the diagnosis cohorts using the software for the appropriate year. A logistic regression was then run to fit the HCC score against the binary dependent variable (discharged to inpatient or observation setting or discharged home) within each diagnosis cohort. Facilities with less than 10 episodes were dropped from the model. The model was then re-standardized to the entire study population, so the total observed rate of inpatient/observation admission equaled the total predicted. A facility’s risk adjusted rate of inpatient/observation admission was computed as
𝑘𝑘 =𝑦𝑦ℎ𝑜𝑜𝑜𝑜𝑜𝑜𝑜𝑜𝑜𝑜𝑜𝑜𝑜𝑜𝑦𝑦�ℎ𝑜𝑜𝑜𝑜𝑜𝑜𝑜𝑜𝑜𝑜𝑜𝑜𝑜𝑜
𝑠𝑠 =𝑦𝑦�𝑛𝑛𝑜𝑜𝑜𝑜𝑜𝑜𝑜𝑜𝑛𝑛
1 − 𝑦𝑦�𝑛𝑛𝑜𝑜𝑜𝑜𝑜𝑜𝑜𝑜𝑛𝑛
𝑜𝑜𝑜𝑜𝑜𝑜𝑠𝑠 = 𝑘𝑘 ∗ 𝑠𝑠
𝑟𝑟𝑟𝑟𝑠𝑠𝑘𝑘 𝑎𝑎𝑜𝑜𝑎𝑎𝑎𝑎𝑠𝑠𝑎𝑎𝑎𝑎𝑜𝑜 𝑟𝑟𝑎𝑎𝑎𝑎𝑎𝑎 =𝑜𝑜𝑜𝑜𝑜𝑜𝑠𝑠
1 + 𝑜𝑜𝑜𝑜𝑜𝑜𝑠𝑠
where 𝑦𝑦� is the observed rate of inpatient/observation discharge and 𝑦𝑦�� is the mean probability of an inpatient/observation admission.
Custom Risk-Adjustment Models
Population Restrictions for Model Development
Cases were excluded from all models if any of the following criteria were met.
• Inpatient admission within 90 days prior to index ED visit • ED visit within 30 days prior to index ED visit • Patient died in ED during index visit • Patient was admitted to ED from hospice, skilled nursing facility, or long term acute
care facility • Patient was discharged to somewhere other than inpatient setting, observation,
home, or home health agency (HHA) based on discharge disposition on index ED visit
Development of Predictive Models
For each study group, predictive models were built using one year of data (2014) from CMS
VI
RIF data. Stepwise logistic regression was used to develop models to predict outcomes of all study groups accounting for influences by general risk factors, including diagnosis, age, gender, and year risk factors. Hospital dummies were created for all models and added to the model prior to offering other risk factors. Cases discharged in the last 7 days of the study data were excluded from all models predicting post discharge outcomes due to lack of complete information on their post discharge events.
Models Predicting Discharge to Inpatient Setting or Observation
Models predicting a patient’s discharge to the inpatient setting or observation were built using all qualifying index ED visits. The total number of cases used to build the models, the number and percentage of cases with discharges to the inpatient setting or observation, and the c-statistic for the final model for ED-diagnosed syncope (with hospital removed) is reported below.
Models Predicting Post discharge Admission to Inpatient Setting or Observation (7 days)
Models predicting a 7-day post discharge admission to the inpatient setting or observation were developed using a subset of data containing only cases that were discharged to either home or an HHA, did not die before admission, and did not have an ED visit over 24 hours prior to admission.
Models Predicting Post discharge ED revisit (7 Days)
Models predicting a 7-day post discharge ED revisit were developed using a subset of data containing only cases that were discharged to either home or an HHA, did not die before ED revisit, and did not have a preceding admission to the inpatient setting or observation or within 24 hours of admission to ED.
Models Predicting Post discharge Mortality (7 Days)
Models predicting a 7-day post discharge mortality were developed using a subset of data containing only cases that were discharged to either home or an HHA, did not have an admission to inpatient setting or observation within 7 days, and did not have an ED revisit within 7 days.
Application of Predictive Models
Upon completion of the model development, final derived predictive models were applied to one year of data (2014) to compute the predicted post discharge event rates for each of the cases. Four predicted rates were generated for cases in each of the study groups using the models developed.
A. Probability of a case to be discharged to inpatient setting or observation B. Probability of a case discharged to either home or HHA to have a post discharge
VII
admission to the inpatient setting or observation C. Probability of a case discharged to either home or HHA to have a post discharge ED revisit without preceding admission to inpatient setting or observation D. Probability of a case discharged to either home or HHA to have a post discharge mortality without preceding admission to inpatient setting, observation, or ED.
Predicted rates B, C, and D were calculated using a set of conditional probabilities. For example, condition B above was computed as:
(probability of a case to be discharged to home or HHA) X (probability of a case to have a post discharge admission to the inpatient setting or observation given a discharge home or to HHA)
Before the predicted rates were computed, each conditional probability was standardized to the corresponding modeling population so that the sum of the predicted probabilities equals the sum of the observed probabilities for all cases used to develop the specific model. Once the four predicted rates described above were computed, they were used to further generate the probability of any post discharge event occurring for a case that was discharged home or to an HHA. This was computed as:
P(post discharge event for home or HHA discharge) = B + C + D
Calculation of Risk-Adjusted Post discharge Event Rates
After computation of predictions, risk-adjusted post discharge event rates were computed for all hospitals in each study group using one year of data (2014). Five risk-adjusted rates were generated for hospitals in each of the study groups using the computed predictions.
A. Risk-adjusted rate of discharge to inpatient setting or observation B. Risk-adjusted rate of post discharge admissions to the inpatient setting or observation for discharges to home or an HHA C. Risk-adjusted rate of post discharge ED visits without admission to inpatient setting or observation for discharges to home or an HHA D. Risk-adjusted rate of post discharge mortalities without admission to inpatient setting, observation, or ED for discharges to home or an HHA. E. Risk-adjusted rate of post discharge events for discharges to home or an HHA.
To compute the risk-adjusted rates, predicted values are standardized to cases at hospitals that have at least 8 observed post discharge events or 4.5 predicted post discharge events. Predicted and observed rates were then aggregated by hospital and the observed-to-predicted ratio (OE ratio) was computed for each hospital. Each hospital’s OE ratio was applied to the national average to get its risk-adjusted rate. The risk-adjusted rate was then tested for significance against the national average.
VIII
Final FFS Model for Syncope Admissions to Observation or Inpatient
Overview of syncope admissions model
N = 143,249
N admitted = 88,341
% admitted = 61.7%
c-statistic (hospital removed) =
0.665
Table 2: Risk factors that stepped into syncope admissions model for Medicare FFS patients
Appendix VI: Results of the application of risk-adjustment models (2014 and 2015)
ED Index Case Inpatient Stay and Observation Admission Rate Percentile Statistics– 2014 Data
Observed ED-IP/Obs Admission Rates
HCC Model Risk Adjusted ED-IP/Obs Admission Rates
X
Custom Model Risk Adjusted ED-IP/Obs Admission Rates
ED Index Case Inpatient Stay and Observation Admission Rate Percentile Statistics– 2015 Data
Observed ED-IP/Obs Admission Rates
XI
HCC Model Risk Adjusted ED-IP/Obs Admission Rates
Custom Model Risk Adjusted ED-IP/Obs Admission Rates
XII
Hospital Variations in ED-IP/Obs Admission Rates by State – 2014 Data for Syncope
Observed ED-IP/Obs Admission Rates
HCC Model Risk Adjusted ED-IP/Obs Admission Rates
XIII
Custom Model Risk Adjusted ED-IP/Obs Admission Rates
Hospital Variations in ED-IP/Obs Admission Rates by State – 2015 Data for Syncope
Observed ED-IP/Obs Admission Rates
XIV
HCC Model Risk Adjusted ED-IP/Obs Admission Rates
Custom Model Risk Adjusted ED-IP/Obs Admission Rate
I
Endnotes
1 Table 74; Emergency department visits within the past 12 months among adults aged 18 and over, by selected characteristics: United States, selected years 1997–2014. In: National Center for Health Statistics, Health United States, 2015. Hyattsville, MD, 2016. https://www.cdc.gov/nchs/data/hus/hus15.pdf#074 2 Rui P, Kang K, Albert M. National Hospital Ambulatory Medical Care Survey: 2013 Emergency Department Summary Tables. National Center for Health Statistics. http://www.cdc.gov/nchs/data/ahcd/nhamcs_emergency/2013_ed_web_tables.pdf 3 Medicare Outpatient Facilities: Utilization and Program Payments for Original Medicare Beneficiaries, by Type of Outpatient Facility and Type of Service, Calendar Year 2013. CMS Program Statistics, 2013. Available at https://www.cms.gov/Research-Statistics-Data-and-Systems/Statistics-Trends-and-Reports/CMSProgramStatistics/2013/Utilization.html 4 MEDPAC. Chapter 8. Stand-along Emergency Departments. Report to the Congress: Medicare and the Health Care Delivery System. June 2017. http://www.medpac.gov/docs/default-source/reports/jun17_reporttocongress_sec.pdf?sfvrsn=0 5 Centers for Medicare and Medicaid Services Innovation Center (CMMI) Accountable Care Organizations (ACOs), Oncology Care Model, Comprehensive ESRD Care Model, Comprehensive Care for Joint Replacement Model, and Episode Payment Models (proposed for cancellation). More information is available at https://innovation.cms.gov/. 6 Morganti et al. 7 Morganti KG, Bauhoff S, Blanchard JC et al. The Evolving Role of Emergency Departments in the United States. Rand Health Q. 2013 Jun 1;3(2):3. eCollection 2013 Summer. https://www.ncbi.nlm.nih.gov/pmc/articles/PMC4945168/ 8 Leavitt Partners. Medicare Alternative Payment Models: Not Every Provider Has a Path Forward. September 2017. 9 Number of physicians with Emergency Medicine as primary specialty (Provider Specialty Taxonomy code 207P00000X), and physician assistant/advanced practice nurses with Specialty Taxonomy code 364SE0003X. Based on NPPES full replacement file for April 2017. 10 Leavitt Partners, 2017. 11 The 30-day post-ED discharge episode for calculating cost was updated to be in alignment with BPCI Advanced post-anchor event cost and quality measurement. 12 Ross M, Aurora T, Graff L, et al. State of the Art: Emergency Department Observation Units. Crit Pathways in Cardiol 2012:11:128-138. 13 Thompson MP. Most hospitals received annual penalties for excess readmissions, but some fared better than others. Health Aff (Millwood). 2017 May 1;36(5):893-901 14 Wasfy JH, Zigler CM, Choirat C, et al. Readmission rates after passage of the hospital readmissions reduction porogram: a pre-post analysis. Ann Intern Med. 2017;166(5):324-31. 15 Demiralp B, He F, Koenig L. Further evidence on the system-wide effects of the hospital readmissions reduction program. Health Serv Res. 2017 May 8. doi: 10.1111/1475-6773.12701 16 Ryan AM, Krinsky S, Adler-Milstein J, et al. Association between hospitals’ engagement in value-based reforms and readmission reduction in the Hospital Readmission Reduction Program. JAMA Intern Med. 2017 Apr 10. doi: 10.1001/jamainternmed.2017.0518. [Epub ahead of print]
17 The Lewin Group. CMS Bundled Payments for Care Improvement (BPCI) Iniatitive Models 2-4: Year 1 Evaluation & Monitoring Annual Report. February 2015. https://innovation.cms.gov/Files/reports/BPCI-EvalRpt1.pdf 18 CMMI. “Quality and the Pay-for-Performance Methodology.” Acute Myocardial Infarction (AMI) Model. https://innovation.cms.gov/initiatives/ami-model/ 19 Leavitt Partners. Impact of Accountable Care: Origins and Future of Accountable Care Organizations. May 2015. https://www.brookings.edu/wp-content/uploads/2016/06/Impact-of-Accountable-CareOrigins-052015.pdf. 20 MPA Healthcare Solutions analysis of the CMS Limited Data Set (LDS) for 2014. ED visits were identified using a physician claim for ED services. 21 Hsia RY, Asch SM, Weiss RE, et al. California hospials serving large minority populations were more likely than others to employ ambulance diversion. Health Aff. 2012;31(8):1767-76. 22 Burt CW, McCaig LF, Valverde RH. Analysis of ambulance transports and diversions among US emergency departments. Ann Emerg Med. 2006;47(4):317-26. 23 Providers are defined as the number of unique National Provider Identifiers (NPIs) on the Part B claim for ED services. This total is not filtered by specialty. 24 Our analysis includes a floor of 11 FFS cases for each provider, due to data use restrictions. 25 See Appendix A. Opportunity Analysis 26 Obermeyer Z, Cohn B, Wilson M, Jena AB, Cutler DM. Early death after discharge from emergency departments: analysis of national US insurance claims data. BMJ. 2017;356:j239. 27 Kocher K. An Assessment of Needs and Resources Related to Developing Alternatives to Hospitalization: A Statewide Survey of Michigan Emergency Departments. Presented at the 2017 meeting of the Society of Academic Emergency Medicine. 28 Supporting scatterplot is not shown, in adherence to CMS data privacy requirements that require suppression of cells with an N of < 11. 29 In this analysis, ED visits for syncope were discharged with 209 different MS-DRGs. 30 Merit-Based Incentive Payment System (MIPS) and Alternative Payment Model (APM) Incentive Under the Physician Fee Schedule, and Criteria for Physician-Focused Payment Models. 81 FR 77008. This threshold has also been proposed by CMS to continue for the 2018 performance year (82 FR 30010). 31 There may be even larger numbers of clinicians who do not self-identify as emergency physicians but provide related care, as in our preliminary analysis we identified over 100,000 unique NPIs associated with claims for ED and ED-based observation care. 32 CMS. Evidence-Based Cost Measure Development for the Quality Payment Program. December 23, 2016. 33 AHRQ Patient Safety Indicators. http://www.qualityindicators.ahrq.gov/modules/PSI_TechSpec.aspx 34 Obermeyer Z, Cohn B, Wilson M, Jena AB, Cutler DM. Early death after discharge from emergency departments: analysis of national US insurance claims data. BMJ. 2017;356:j239. 35 This analysis counts only the first postdischarge event and not all return visits.