AD-A126 962 USING SMAL APERTURE INTERFEROMETR 0O DETECT PLANETS 1/5 IN NEARBY BINARY STAR SYSTEMS(U) AIR FORCE GEOPHYSICS LAB HANSCOM AFB MA 0 G CURRIE ET AL 06 APR 83 U SSIFIED AFGL- R -83- 0067 FI 1/ EhhEAmo hmmhEomhEEEl EEEEEmhhEEEE.E EEDEEIUOEEEEE! Erol~omm~ OFI:C
Transcript
AD-A126 962 USING SMAL APERTURE INTERFEROMETR 0O DETECT PLANETS 1/5IN NEARBY BINARY STAR SYSTEMS(U) AIR FORCE GEOPHYSICSLAB HANSCOM AFB MA 0 G CURRIE ET AL 06 APR 83
Unclassified* 4 SECURITY CLASSIFICATION OF THIS PAGE 'Whe Do.. Enlred) ,REPORT DOCUMENTATION PAGE [ E READ NMSTRUCTOS
_____________________________________ BE7ORE COMPL -TItNG FORM
REPORT NUMBER GoVT ACCE SION NO. 3. RECIPIENTS CATelOR , OG R ER
AFGL-TR-83-0087 1o./4~4. TITLE (and Subtitle) S. TYPE OF REPOR COVERED
Using Small Aperture Interferometry to Detect REPRINT
Planets in Nearby Binary Star Systems REPRINT
6. PERFORMING O1G. REPORT NUMBER
7. U, TsHOy(a) I. CONTRACT OR GRANT NUMBER(s)
Vouglas G. Currie* Simon P. Worden
Harold A. McAlister**Timothy J. Schneeberger
9. PERFORMING ORGANIZATION NAME AND ADDRESS 10. PROGRAM ELEMENT. PROJECT. TASK
Air Force Geophysics Laboratory (PHS) AREA & WORK UNIT NUMBERS
Hanscom AFB 61102F
Massachusetts 01731 2311G308
II, CONTROLLING OFFICE NAME AND ADDRESS 12. REPORT DATE
Air Force Geophysics Laboratory (PHS) 6 April 1983Hanscom AFB 13. NUMBER OF PAGES
Massachusetts 01731 5314. MONITORING AGENCY NAME & ADDRESS(II different from Controlling Office) IS. SECURITY CLASS. (of this report)
Unclassified
ISa. DECL ASSI FICATION DOWN GRADINGSCHEDULE
16. DISTRIBUTION STATEMENT (of this Report)
Approved for public release; distribution unlimited. -T IC
17. DISTRIBUTION STATEMENT (of the abstract entered in Block 20, If different from Report)
LA
IS. SUPPLEMENTARY NOTES*Dept of Physics & Astronomy, University of Maryland, College Park, MD 20742**Dept of Physics, Georgia State University,_)University Plaza, Atlanta, GA 30
Reprinted from NASA Conference Publicaona124, pp 1-53, March 1980
IS. KEY WORDS (Continue on reverse side If necessary and Identify by block number)
InterferometryExtra-Solar Planets
20. ABSTRACT (Continue on reverse side It necessary md Identify by block number) If suitably accurate binary
star orbits can be observed, the effects of planets in the binary star system mayCDe detectable in the reflex motion of the component binary stars. We show that(-7 interferometric measurements of binary star systems will provide this information.LU e discuss the effects of the atmosphere on degrading images and how interferometLj ill remove these effects to provide very accurate binary star positions relative
o the other components in the binary system. Two systems, amplitude interferomettnd speckle interferometry, can accomplish this using existing telescopes andt echniques. With these methods. -nrlv accuracies of 2 x 10- arc second areDO Fi 1473 EDITION OF I NOV em5S OBSOLETE UnclassifiedRm Unclassifie
88 04 18 063 SECURITY CLASSIFICATION OF THIS PAGE (W-en Date RA10--0
, - ' _ , ,
Unclassified:ecumTY CLASSIFICATION OP TNIS PAOE(ft. L t$ ,M,,0,0
possible for binaries of I arc second separation and 10- 4 arc second for a
5 arc second binary. These accuracies are more than enough to detect planetsin orbits like Jupiter's out to over 20 pc. There are 188 observable systemswithin 20 pc, in most of which it is possible to have stable planetary orbitssimilar to solar system orbits. With advanced data recording systems it ispossible to observe binary systems where the components are as faint as +16stellar magnitudes. A dedicated 2-meter interferometric telescope tomonitor binary stars could be built for about 1.4 million dollars.
Unclassified
S.Cuf."T. CLASSIPICATICS OF TWO PACt.. . Dos n -feb
Ll ~
FGL-TR -83- 00 87PAPER 1
USING SMALL APERTURE INTERFEROMETRY TO DETECT PLANETSIN NEARBY BINARY STAR SYSTEMS
Douglas G. CurrieDept. of Physics and Astronomy
The University of Maryland, College Park, MD 20742
Harold A. McAlisterDept. of Physics
Georgia State University, University Plaza, Atlanta, GA 30303
Timothy J. Schneeberger and Simon P. WordenAir Force Geophysics Laboratory
Sacramento Peak Observatory, Sunspot, NM 88349
ABSTRACT
If suitably accurate binary star orbits can be observed, the effects of
planets in the binary star system may be detectable in the reflex motion of
the component binary stars. We show that interferometric measurements of
binary star systems will provide this information. We discuss the effects of
the atmosphere on degrading images and how interferometry will remove these
effects to provide very accurate binary star positions relative to the other
components in the binary system. Two systems, amplitude interferometry and
speckle interferometry, can accomplish this using existing telescopes and
techniques. With these methods, ,mearly accuracies of 2 x 10⁻⁵ arc second are
possible for binaries of 1 arc second separation and 10-4 arc second for a
5 arc second binary. These accuracies are more than enough to detect planets
in orbits like Jupiter's out to over 20 pc. There are 188 observable systems
within 20 pc, in most of which it is possible to have stable planetary orbits
similar to solar system orbits. With advanced data recording systems it is
possible to observe binary systems where the components are as faint as +16
stellar magnitudes. A dedicated 2-meter interferometric telescope to monitor
binary stars could be built for about 1.4 million dollars.
/
-]
I
I. INTRODUCTION
Low mass and non-luminous companions of nearby stars may be detected
in several ways. Among the most promising methods are indirect methods;
that is detecting the effects of an invisible object on its visible
companion. Spectroscopic methods may be used to observe radial velocity
fluctuations in the visible star caused by the orbital reflex motion
relative to the invisible companion. Astrometric detection involves
observing the positional perturbation caused by the orbit of the unseen
object. Astrometry therefore requires establishing the position of the
center of light in a stellar image and referencing this center to a fixed
frame.
Astrometry is limited by the ability to establish the center of a star
image and uncertainties in the reference frame. Star images, perturbed by
seeing, are roughly gaussian. The accuracy for finding the center of the
gaussian is obviously dependent on the stability of the gaussian profile.
Long exposures are therefore used to: 1) collect enough photons to accur-
ately define the center of each star image and 2) to average out seeing for
image motion. The reference frame of these measurements may in principle
be established by the centers of three or more other star images. Since
the proper motions of these stars may influence the coordinate frame, the
reference stars are chosen to be distant background stars. The Earth's
atmosphere can also distort the reference frame as a function of atmos-
pheric conditions and colors of the reference stars. These uncertainties
may be reduced by using a relatively large number of reference
stars in conjunction with sophisticated mathematical error
2A ______________ _________
V g
analysis schemes. In spite of such difficulties conventional astrometry
may now reach positional accuracies of ± ".05 for a single exposure,
this may be improved to better than ± ".001 (Gatewood, 1976) for the
results of one year's observation.
Astrometric accuracy could be improved by getting smaller star
images. The problem of finding a star image center is clearly easier
the smaller the image is. If images were improved to the diffraction
limit the increase is substantial. The task of finding the center
of a 2 meter telescope diffraction limited spot of ".05 may be done
with much higher precision than finding the center of a 1 arc-second
seeing disk with the same number of photons. We can also increase accuracy
by removing the atmospheric effects on the reference frame. Both things
are possible using some form of interferometry.
Stellar interferometry, first demonstrated by Michelson (1920),
makes it possible to approach the full theoretical (diffraction limited)
resolving power of large optical systems. Large baseline (hundreds of
meters) instruments like the intensity interferometer (Hanbury-Brown
1968) have been demonstrated. Smaller scale instruments have recently
been perfected to adapt existing telescopes into diffraction limited
systems using techniques known as Amplitude Interferometry (Currie, 1967;
Currier et al., 1974) and Speckle Interferometry (Gezari et al., 1972).
These techniques were extensively reviewed by Dainty (1974), Worden (1977)
and Labeyrie (1978). Long baseline interferoneters have been proposed
which would convert the image scale to the full diffraction limit and
remove atmospheric effects on the reference frame. Such systems are
ideal for detecting small scale astrometric perturbations due to planetary
3
- ~ ~Lai
mass objects. However these instruments are costly and have yet to be
completely demonstrated in the field. On the other hand, Amplitude and
Speckle Interferometry have already demonstrated the ability to make
conventional telescopes diffraction limited.
Both Amplitude and Speckle Interferometry are limited by the so-
called isoplanatic problem. This is shown schematically in Figure 1.
To remove atmospheric effects using these interferometry methods it is
necessary that light from all objects to be studied pass through the same
column of turbulent atmosphere. Thus a program star and its reference
star must lie within an angle known as the isoplanatic angle so that the
light from both passes through essentially the same atmosphere. The
precise value of the isoplanatic angle depends upon conditions in the
atmosphere, the definition, and the observing instrument, but is probably
less than 10 arc-seconds (Hubbard et al., 1979).
Binary stars are suitable candidates for planetary searches. McAlister
(1978) has used speckle interferometry in a systematic program to deter-
mine binary star separations to accuracies of a few thousands of an arc-
second, using relatively simple detectors and calibration methods. If
a planet orbits one component of a binary star system, then the orbit of
that component about the other star will "wobble". For the nearby stars
this may be a modulation of up to ".01 for Jovian type planets. Harrington
(1977) has shown that most binary star systems have stable planetary
orbits. Interferometric searches for planetary perturbations of binary
star orbits aretherefore important. Indeed, interfergmetric searches of
small separation binaries is almost the only way to search these systems.
4
Binary star interferometry is therefore important to assure a complete
search for low mass stellar companions through all nearby stars and all
types of stellar systems.
In this document we discuss interferometric methods to search binary
star systems for planets. This suggestion was presented in some detail
by McAlister (1977). We briefly discuss the physics behind atmospheric
degradation of images and the interferometric instruments and techniques
to remove this degradation. We address the accuracies and limitations
of these techniques. A discussion of the sample of nearby binary star
systems follows. Finally we provide information on the costs and features
of possible dedicated telescopes for an interferometric binary star
search.
- -I _ , . . . .. . . -1
II. ATMOSPHERIC IMAGE DEGRADATION
Small scale temperature inhomogeneities in the Earth's atmosphere
produce index of refraction changes. These refractive index changes cause
phase delays along an incoming plane wave, which may be light from a
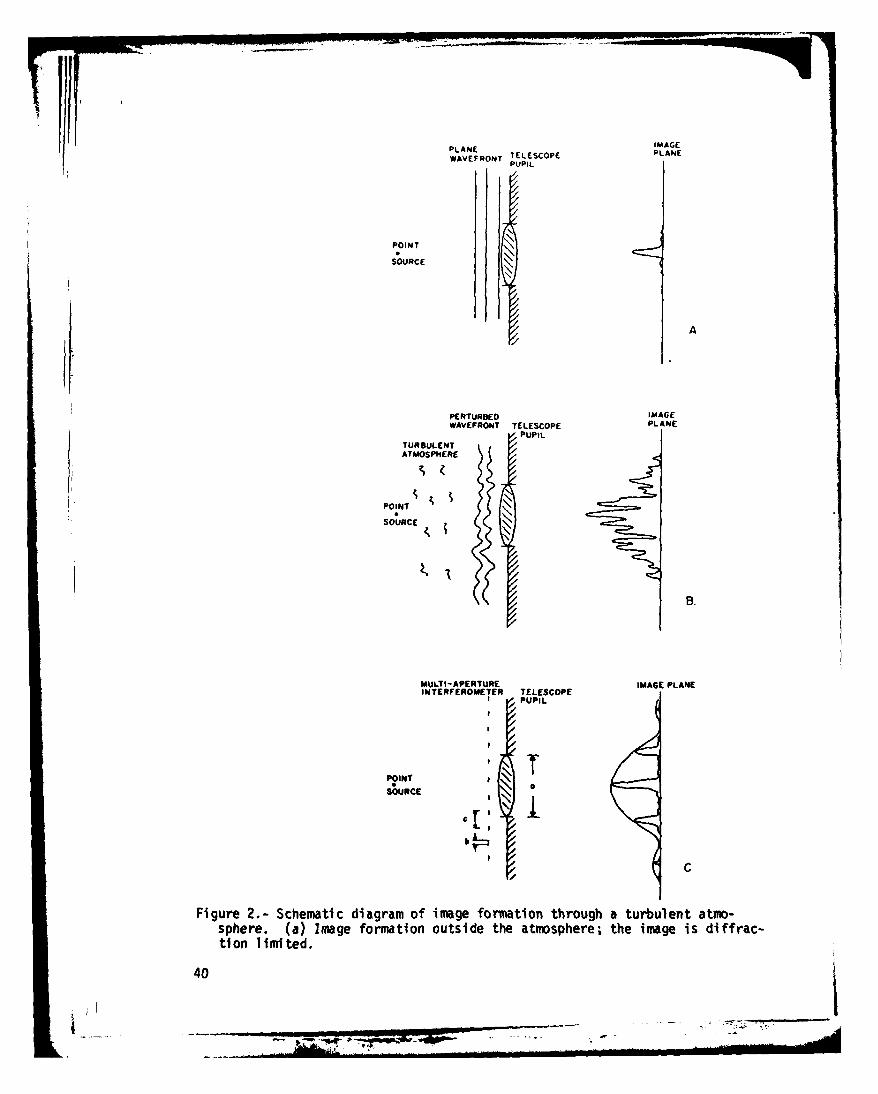
stellar point source. This is represented schematically in Figure 2.
Without the phase errors optical systems produce the image in Figure 2a
which is said to be "diffraction limited", where a point source image is
the classical Airy disc for a circular telescope aperture. The size of
this image is inversely proportional to the telescope diameter. With
any phase errors, telescope resolution is degraded to that appropriate for
an optical system only as large as the scale over which some phase coherence
(i.ethe phase is the same) exists. Since the atmosphere breaks an incoming
plane wave into about 10 cm fragments, all telescopes produce images with
resolution no better than a 10 cm telescope, namely one arc-second. This
process is shown in Figure 2b.
In 1970, Labeyrie (1970) proposed a method to recover some information
down to large telescope diffraction limits. He pointed out that short
exposure (A T .01 sec) photographs "freeze" the turbulence in the atmosphere.
Although the phase coherence size in this "frozen" system is still only
10 cm there will be some 10 cm patches scattered over the entire aperture
which are at the same phase. These portions act in concert as a form of "mul-
tiple aperture interferometer which provides some information down to the
6
'4[--
diffraction limit of the entire telescope aperture. As shown in Figure
2c, the image of a point source seen through a multiple aperture inter-
ferometer is a series of nearly diffraction limited images modulated
by a one arc-second seeing disk. This process is known as speckle inter-
ferometry since the short exposure photos, shown in Figure 3, look like
laser speckle photos.
*As alternate approach to steller interferometry, suggested by Currie
(1967) Currie et al. (1974), is similar to Michelson's interferometry.
Known as Amplitude Interferometry, this technique uses a device like that
shown in Figure 4. The individual collection apertures are smaller
than the 10 cm coherence length along a stellar wavefront in order to
reduce the correction due to atmospheric degradation to a negligible level.
As the atmosphere modulates the relative phase shifts between these two
apertures, the coherence properties ( and thus angular size) of the object
as it appears outside the atmosphere can be learned. To obtain complete
two-dimensional size and shape information the observer varies the separ-
ation and position angle for the two apertures. Currie has proposed
and built a multiple aperture amplitude interferometer system, so that
the full telescope aperture maybe covered simultaneously and all Fourier
components sampled simultaneously. The efficiency of such a system
should be comparable to a speckle interferometry system.
7
III. INTERFEROMETRIC INSTRUMENTS AND DATA REDUCTION
In this section we describe interferometric data recording systems
and data reduction techniques.
A diagram of the Kitt Peak photographic speckle interferometer is
shown in Figure 5. There are about six similar systems in use at the
present time. The Kitt Peak camera was designed by Lynds (Lynds et al.,
1975; Breckinridge et al., 1978). As shown in the figure light from the
telescope passes through a shutter and focuses at the telescope image
plane. The shutter is necessary to insure exposures shorter than the
atmospheric change time, typically 20 milli-seconds. The telescope image is
relayed and magnified by a microscope objective. The magnification is set
to provide a pixel resolution oversampling the telescope diffraction spot
size by at least a factor of 4. For the Kitt Peak 4-meter telescope this
orovides a final image scale of .2 arc-sec/mm Atmospheric dispersion
blurs speckle image pattern in the sense that the "red" portion of an image
focuses at a slightly different portion than the "blue" portion. Sincea
this may be significant for even 200 A bandpass photos a set of rotating
atmospheric compensating prisms are included to counteract the dispersion.
Since there are about 20 orders of optical interference across a narrow
band (A A ̂ 200 A), an interference filter is used to preserve coherence across
the entire speckle photo. If this were not included the "speckles" near
the edge of the photos would be elongated. A three stage image tube
8
If
intensifies the image enough to allow photographic data recording. A
transfer lens relays the intensified image to a data recording system,
in this case a 35 mm film camera.
The speckle photos in Figure 3 were taken with the Kitt Peak System.
The different character of these photos is readily apparent. This is
understandable from the analogy to a multiple aperture interferometer.
Each speckle should be a diffraction limited image of the object. Indeed,
the binary star (a Aur) speckles are double, the point source speckles
roughly diffraction spots, and the resolved star (a Ori) speckles somewhat
larger. This aspect led Lynds et al (1975) to a direct speckle image
reconstruction scheme whereby individual speckles were identified and
co-added to produce a nearly diffraction limited image for the special case
of stars like a Ori.
A number of methods exist to reduce speckle interferometry data.
Labeyrie's original method is widely used;in particular for binary star
measurements. Individual speckle photos are Fourier transformed either
optically or digitally and the Fourier modulus computed. If the speckle
image is represented in one dimension as i(x), and its transform as I(s)
this process is mathematically represented by:
I(s) = 0 i(x)e- 2niXSdx (1)
9
The modulus or power spectrum, II(s)l2of this transform contains the
diffraction limited information in an easily extractable form. Examples of
the mean power spectra for several binary star systems are shown in Figure 6.
In the case of the binaries, power spectra show banding which represents
the binary separation, the wider the bands are apart, the closer the binary
separation. The orientation of these bands represents the position angle
of the binary system. Superimposed in this signal is a background attri-
butable to the residual effects of seeing. For stars brighter than about
+7 visual magnitudes about fifty individual speckle snapshots are transformed
to produce a mean power spectrum. A least square fit to the spacing and
orientation angle of the bands in this power spectrum yield the binary
separation and position angle; All accomplished from less than I second
actual exposure time at the telescope!
The residual effects of the seeing must be removed to yield the
maximum accuracy. Even though the bands (fringes) are readily visible in
raw speckle power spectra, their spacing is effected by the residual seeing
effects. Labeyrie's method uses observation of point source stars to determine
these seeing effects and remove them. If PW(x) are point source speckle
photos with a mean power spectrum <IP(s)12>, and <1I(s)12 > the mean power
spectrum of the object speckle photos ii(x) then the diffraction limited
;)ower spectrum of the object is given by:
10
L .... I
iO(s)l2 0<I(s) 2> (2)<IP(s)1 2>
Point source data is usually derived from speckle observations of point
source starssituated near on the sky to'the program objects. Since these
point source objects are not in general observed within the same isoplanatic
angle and not at the same time their power spectrum can only represent the
residual seeing effects in a statistical sence. Worden et al. (1977) have
developed a method to calibrate for residual seeing effects using the same
set of speckle photos as used to study the program objects.
We illustrate the Worden et al. (1977) method in Figure 7. The method
proceeds as follows: the mean autocorrelation function of a series of
speckle, ii(x) photos is computed.
<AC(Ax)> < i.(x) -i(x-Ax)dx>
< i (x) * ii (x)> (3)
(The autocorrelation is the Fourier transform of the power spectrum - see
Bracewell 1965 for details). As we see in Figure 7,the mean autocorrelations
are dominated by the seeing background. This background may be accurately
removed by computing and subtracting the mean cross-correlation between
consecutive speckle photos of the same set of data used to compute the auto-
11I
.th ith
correlation. The cross calculation between the i- and i-+ 1 speckle
photo is given by
<XC(Ax>= i(x) 1 (x-Ax)dx >
= i (x) * i i + l(x)> (4)
Welter and Worden (1978) showed that the resulting subtraction in the object
autocorrelation as it would appear with virtually all seeing effects removed.
Current photographic speckle cameras are generally limited to objects
brighter than +7. Thus the photographic recording systems are being replaced
with high quantum efficiency digital recording systems. These systems record
individual photon events. The University of Arizona speckle camera uses a
CID (Charge Injected Device) television system to record photon arrivals.
This system simply replaces the photographic emulsion and it can record
data for objects faint enough so that only a few photons arrive in a 20 milli
sec exposure. In Figure 8 we show data from this system for Saturn's moon
Rhea which is a 10 - magnitude object. For faint objects like this only
the few hundred photon locations are recorded, rather than the entire frame.
This allows such systems to run at the maximum speckle data rate of one speckle
frame every 20 ms. This form of data is ideal for the correlation data
reduction method described above, since the correlation functions are simply
12
* .- *~~- I
the sum of vector differences between photon locations. Consequently a
direct computer interface may compute the results in real time at the
telescope. The limiting requirement for this method is that at least
two photons arrive in a 20 ms exposure. This translates to about a +16
stellar magnitude limit. Although angular diameters are more difficult to
derive than binary separations, we have used this system to derive angular
thdiameters for 13- magnitude objects accurate to ± 5% with less than 5
minutes total observing time.
The Amplitude Interferometer obtains the high angular resolution
information in a somewhat different fashion than the Speckle Interferometer.
In this case, the light is sampled at the entrance aperture of the tele-
scope where the effect of the atmosphere has been to introduce only an
error in the phase delay. The light from two separate apertures on opposite
sides of the telescope is then interferometrically combined. Such a
combination is illustrated in Figure 9.
By appropriate choice of the size of the interferometric aperture,
one component of the atmospheric correction becomes negligible. The
magnitude of the combined coherence function appears as the magnitude of
the fringes in the combination of the interferometer two beams. In the
case of high coherence one gets a varying signal as indicated in Figure 10.
The fluctuations in this signal are caused by the motion of the wind.
These fluctuations, or, more precisely, the autocorrelations and cross
correlations of individual photo-electrons are used to elevate the fringe
visibility.
13
The currently operatinq Amplitude Interferometer is illustrated
in Figure 4. The liqht from the telescope issampled for two apertures
which have a diameter of 4 centimeters. This has been used in a regular
program to measure star diameters down to about 6th maqnitude (Currie
et al., 1974, Currie et al., 1976, Braunstein, 1977). Although some
work has been done on binary stars (Braunstein, 1978) most of the work
has been on stellar diameters. In order to illustrate the current
performance of the Amplitude Interferometer on the telescope we consider
Figure 11, which shows a typical set of data for a resolved star and for
an unresolved star which is used as a reference or check. This shows the
visability of the fringes. From this measure, thediameterof the star
is derived.
Taking successive measurements on different nights, we have
seen a high degree of stability, even though there have been
significant changes in the atmosphere. This illustrates the general
validity of the atmospheric model and amplitude interferometric para-
meters in assuring independence of atmospheric fluctuations.
In order to permit the observation of fainter objects, we wish to
simultaneously use all the light entering the telescope aperture, i.e.
the data from many thousands of pairs of apertures. (i.e. a Multiple
Aperture Amplitude Interferometer or MAAI). This may be done by
replacing each of the two photomultipliers with a "television camera"
in which each resolution element acts as a separate channel interferometer.
14
The light then operates as shown in Fiqure 12. When an array detector
is used, an invertinq prism is required which causes every separation
to be sampled. The overall desiqn of this instrument is indicated
in Figure 13.
The description of such an instrument, as might be used on a space
telescope, has been given by Currie (1974) while a more detailed
discussion of certain aspects appears in (Braunstein, 1978). A photo-
graph of the MAAI is shown in Figure 14.
15
IV. ACCURACY
McAlister has had a substantial speckle program to derive binary star
parameters underway at Kitt Peak for the last several years. This program's
results provide preliminary information with which to estimate the precision
possible with speckle interferometry (McAlister 1978).
Internal errors in speckle interferometry are divided into the basic
uncertainty in the data itself, and the error due to uncertain calibration of
the image scale. Based on 46 pairs of binary star observations for 5 stars,
each pair separated in time by one day to one month, McAlister has computed
errors. One observation is defined as the result from a single fifty frame
set of speckle photos. For this data(with binary separations of 0.2" to
3".25)McAlister concludes that the error due to basic uncertainty in the
data is ± .3% in separation and ± O?2 in position angle for each fifty frame
data set. If the calibration errors are included the angular separation
measurement reduces to ± .6%.
Calibrations of image scale and position angle are made by placing a
double slit with known slit separations over the telescope aperture. Since
the telescope is then effectively a two-slit interferometer the fringe spacing
and position angle in power spectra of data taken through this slit provides
accurate calibrations of angular separations and position angles. Calibrations
are generally made only several times per night. If a set of built-in
16
calibration double slits were used to calibrate each star after every
observation, calibration errors could be reduced to much less than the
inherent error in the data. For binaries with separations less than
i", accuracies of ± ".002 are already obtainable and accuracies of
± ".I are obainable for stars of 5" separation, in single observations.
A similar level of accuracy has been obtained using the Amplitude
Interferometer for the measurement of stellar diameters (Currie, 1976).
Although such measurements are not identical to the binary measurements
this does provide an evaluation of the general ability of the amplitude
interferometer to obtain high accuracy. The reproductivity in angular
diameters from one year to the next on the stable stars is of the order
of one to two milliarcseconds. Most of this error may be related to
aspects of the current Amplitude Interferometer with a single pair of
apertures and would not occur in the Multi-Aperture Amplitude Interferometer
(MAAI). The MAAI has been used to resolve of stellar diameters as
small as 10 milliarcseconds, and is expected to provide 5 milliarcseconds
on the 5-meter telescope or 33 milliarcseconds on a 60-inch telescope.
McAlister ahs computed possible external errors in his results by
comparing binary orbits he has derived from speckle interferometry with
high quality published orbits. He concludes that speckle orbits match
the published orbits to within the accuracies of these orbits, this re-
sult precludes large systematic errors in speckle binary star measurements.
The above analysis for speckle interferometry is based on photographic
data recording systems. An advanced photoelectric data acquisition system
17
A ~ ~ .-Olo
has several advantages. Since the new systems run at essentially tele-
vision rates (60 frames per second), a single fifty frame sample takes less
than 1 second to obtain! McAlister observes about 150 stars per night
with several minutes spent on each star. We might expect that fifty
observations of five minutes duration would be possible in an observing session
with a dedicated telescope. If we assume errors may be reduced as the
square root of observing time then the over 1O4 fifty frame data sets obtained
per year would refine the accuracies a factor of 102 over the McAlister's
values. This corresponds to 2 x 10- arc second per year on binaries with
separations smaller than 1 arc second and 10-4 arc second per year on a binary
with five arc seconds separation. The higher quantum efficiency and linearity
of the digital system should indicate that these numbers apply to stars
brighter than about +9, as compared to McAlister's limit of +7. The
accuracies on binaries near the faint limit at +14 would probably be a
factor of ten worse for the same observing time.
The isoplanatic angle is another limitation. Conventional wisdom,
not based on many real observations, places the isoplanatic angle at
about 3 arc-seconds, meaning interferometry of binary stars with separations
much larger than this would be impossible. However, recent measurements
by McAlister (1979) and Hubbard et al (1979) of binary stars with larger
separations places this angle closer to 6 arc-seconds and perhaps as
large as 10 arc-seconds. It may therefore be possible to use as a refer-
ence star an unrelated background star rather than the other binary
component. This may extend interferometric position determinations to
wider binaries and some single stars.
18
Photographic speckle systems have been limited to binary stars where
the two components are within five magnitudes of each other. Photoelectric
systems may extend this limit to 7 or 8 magnitudes. However, the require-
ment of two photons in each exposure may practically limit one to systems
where both stars are brighter than + 16 magnitudes.
The maximum size of the detector array is another possible limitation.
Since we desire to oversample the telescope diffraction spot size by at
least a factor of four and to cover 10" on the sky we would need a
700 x 700 element array for a 2 meter aperture telescope (diffraction
limit ".06). However, 800 x 800 element arrays are to become available
soon, so detector size should not limit speckle interferometry.
19
V. SUITABLE TARGET BINARY SYSTEMS
In this section we examine a set of possible program binary systems
and discuss detection probability. As a data source we have used Gliese's
Catalogue of Nearby Stars (1969) which includes all stars with known
parallaxes equal to, or greater than ".045, plus borderline cases.
There is some conjecture that binary star formation inhibits
planet formation. However, definitive models for planetary formation
are not available. At present, there is absolutely no reason to,
a priori, dismiss binary systems as possible planetary systems. It
is of particular interest to study the frequency of these occurances
and mass distribution of companions in order to further illuminate
the physical processes of star formation and of planetary system
formation. Moreover, the extensive satellite systems of Jupiter
and Saturn point strongly to the hiarchial formation of such systems.
There are, however, dynamical constraints on possible planetary orbits
in binary systems. Harrington (1977) has examined dynamical stability
of a planetary third body in a binary system in terms of the restricted
three body problem. He concludes that stable planetary orbits are
possible in two classes of binary systems: Those in which the planetary
orbit is large compared to the binary orbit, and those in which it is
small. In both cases the planetary orbit must be a factor of three to
four larger (or smaller) than the maximum (or minimum) binary separation.
Since there are no detectable effects of a planet in the case where the
20
,~ - ., r
binary separation is small compared to the planetary orbit we restrict
our discussion to the opposite case. If we use Jupiter's orbit at
approximately 5 AU radius as a benchmark we can examine which binaries
may have a stable Jovian orbit. Table I lists the separations for a
stable Jovian orbit as a function of parallax.
Table I
Angular Size of Binary Orbits for a Stable Jovian Orbit
Parallax Size of Jovian Minimum Binary Orbit Size
(") Orbit (') for Stable Jovian Orbit ("1
.2 1.000 4.000
.1 .500 2.00
.075 .375 1.500
.050 .250 1.00
Table II shows the effects of a Jovian planet (m = 10-3M0 ) in a Jovian
orbit (5 AU) and a large terestrial planet (m = 10-5M0 = 3M,) at 1 AU.
These effects are shown as a function of the reflex motion on a solar
type primary (I Me) and a late type M dwarf (.15 M0 ).
At the Cassegrain/Nasmyth foci, 90% of the light from (TBD)
cm diameter shall fall within a circle of 0'.6 in diameter at
a wavelength of 0.5 t for zenith angles less than 60o
Neglecting diffraction and obscuration, 99.5% of the light shall
fall within a circle of diameter 1'0. For a zenith angle of
800, image quality shall not degrade to more than twice the
above specifications.
B. Sky Coverage0
1. No structure shall vignette the telescope above 10 from the
horizontal in any direction.
2. Azimuth rotation of +2700 from the south shall be allowed for.
3. Electrical limit switches and mechanical stops shall be
provided as necessary for telescope protection.
C. Absolute Pointing Accuracy
The absolute pointing error goal shall be 0.5 rms for zenith
angles less than 600. The 24-hour repeatability shall be better
than 1"
o. Tracki ng
The goal shall be tracking an object to within 0.l rms for
periods of time up to 2 hours for zenith angles less than 600.
37
E. Motions
1. The slowing speeds shall be at least 20/second.
2. Tracking speeds shall be at least O?5/second.
3. Setups on a new object within 900 should be possible
within a time of 2 minutes.
F. Cone of Avoidance at the Zenith
The telscope shall operate as specified to within 5' of the zenith.
G. Chopping Secondary Characteristics
1. Chopping direction: Remotely adjustable 270' from
the center position and should include the capability for
automatic field rotation compensation.
2. Amplitude: Remotely adjustable continuously from zero to 3'.
3. Frequency: 0 to 40 Hz.
4. Performance: For a chopping amplitude of 20". the 10-90%
rise time will be < 3 msec with < 1% overshoot.
H. Nasmyth Platforms
Size (TBD, at least 5 feet long beyond focus, 8 feet is
preferable); instrument weight limits (TBD); location of best
focus (TBD, at least 18 inches beyond bearing); instrumentation,
electrical, vacuum, displays, controls, and other needs (TBD).
38
- -EI. r 4j
STAR I STAR 2
/
//
I /I /
/
I /
0 0 o 00C 0 : fC- 0 D TURBULENCEa
I //
I //
~ISOPLANATIC ANGLE
TELESCOPE
I
Figure I.- The isoplanatic angle -the maximum angle separating two objects sothat light from the two objects passes through the same column of turbulentatmosphere.
Figure 2.- Schematic diagram of image formation through a turbulent atmo-sphere. (a) Image formation outside the atmosphere; the image is diffrac-tion limited,
40
_I-C)4 Cn
C) C) C
C)0
o C)nC
00C)-
041'
VI-Ji
~LC)
cS.
0 D,
0 cc
0 :
C.)w 0
cS.-
I_ i
w UU
0.0
42
aN Uiz
Eu'>
o 4-)CE0 EE, Zr)L
0
n- NI-4 00u
0O (n 0
°S-
-
0 E0
u° ~2U '. a.":~1 o C7, E
E 4'%.. E _o ,-
0
43
.IT.
CL
CL
5-,
I
44-
VESTA ORIONIS ORIONIS
A
SPECKLE
AUTOCORRELATION
C
CROSS-CORRELATIN
D
DIFFERENCEBETWEEN8 AND C
Figure 7.- Schematic representation of Worden et al. (1977) method for reduc-ing the effects of seeing in final speckle interferometry results.
45
w %,.w .
i ju ro 8. - Speck 1 e d ata s how in y ndi v i dw1 1) ho t orl!; t or sa tuH rn noon1 R fl'a(M, 10 ) taken wi th Ui ver , i f y o t Ai- i ona C 1) sv~k ea(
RI_________SPECTRAL
FILTER
MASK BA
L
-'-SPEC TRA LTITEFigure 9.- Combination of the starlight from the separate apertures for an
Amplitude Interferometer.
47
PHOTO PHOTOCURRENT CURRENT
No. 1 No. 2
TIME TIME
UNRESOLVED OBJECT
TIME TIME
FULLY RESOLVED OBJECT
Figure 10.- Variation of photomultiplier outputs for a bright source with highcoherency and i6w coherency in a two-beam Amplitude Interferometer.
48
___________.. ....______,__
1.0
a Orib £ Reference Star
0.7
. 0.5
ti.04-.Q
0.2
0.1-
0 50 100 150 200Aperture Separotion (cm)
Figure I1.- Amplitude Interferometer outputs for a resolved star (x Orionis)and an unresolved star.
49
,MULTI -ELEMENT
PHOTO DETECTOR
KOSTER PRISM-,," ~ COL LIMATED BEAMS
Z-LEAVING KOSTER PRISM
COL L IMA TEDBEAM FROM <TEL ESCOPE lo4'
Figure 12.- Multi-element detector scheme for a Multiple Aperture AmplitudeInterferometer.


![0o+==o[Berbagai Kumpulan Makalah]+==o0o==](https://static.documents.pub/doc/80x56/55cf9730550346d033902a14/0ooberbagai-kumpulan-makalaho0o.jpg)


