CV) o J.III, ,/JJ AD INACTIVATION OF HEPATITIS A VIRUS (HAV) BY CHLORINE AND IODINE IN WATER ANNUAL REPORT by Mark D. Sobsey, Ph.D. November, 1986 Supported by U.S. ARMY MEDICAL RESEARCH AND DEVELOPMENT COMMAND Fort Detrick, Frederick, Maryland 21701-5102 Contract No. DAMDI7-86-C-6053 University of North Carolina at Chapel Hill Chapel Hill, North Carolina 27514 Approved for public release; distribution unlimited The findings in this report are not to be construed as an official Department of the Army Position unless so designated by other authorized documents. DTIC 788 8 30 ,,. TI...
Transcript
CV) o J.III, ,/JJ
AD
INACTIVATION OF HEPATITIS A VIRUS (HAV)BY CHLORINE AND IODINE IN WATER
ANNUAL REPORT
by
Mark D. Sobsey, Ph.D.
November, 1986
Supported by
U.S. ARMY MEDICAL RESEARCH AND DEVELOPMENT COMMANDFort Detrick, Frederick, Maryland 21701-5102
Contract No. DAMDI7-86-C-6053
University of North Carolina at Chapel HillChapel Hill, North Carolina 27514
Approved for public release; distribution unlimited
The findings in this report are not to be construed as anofficial Department of the Army Position unless so designated byother authorized documents.
DTIC
788 8 30 ,,.
TI...
SUMMARY
Studies were done in a batch reaction system to determine thekinetics and extent of inactivation of aggregated preparationsof hepatitis A virus (HAV), strain HM175, poliovirus type 1,strain LSc, and echovirus type 1, strain V239, by 1 mg/l freechlorine and one tablet per quart Army iodine in halogen demand-free water 8uffered at pH 4.5, 7.0 and 9.5 and at temperatures
V of 5 and 25 C. The results obtained so far indicate that HAV israpidly inactivated by 1 mg/l free chlorine under theseconditions, ith times for 99.99% inactivation (T99.99) of <10minutes at 5 C and <15 minutes at 25 C. Polio 1 and echo 1 alsowere inactivated rapidly under most of these same conditions.The exception was pH 9.5, where times for 99.99% inactivation ofp8lio 1 and echo 1 were 65 and 147 minutes, respectively, at~ 5C.
In experiments done so far, HAV was inactivated rapidly by onetablet per quart iodine in buffered, halogen demand-free waterat pH 7.0 and 9.5, with T99.99 values of <1 minute. Incontrast, polio 1 and echo I were not inactivated rapidly bythis concentration of iodine at pH 4.5 and 7.0.
* The results obtained so far indicate that the HM175 strain ofHAV is inactivated rapidly by free chlorine and Army iodine.However, further studies must be done in order to determine thesensitivity of HAV to these halogens in the presence of
*. appreciable halogen demand and other potential interferences.In addition, studies must be done with other strains of HAV inorder to determine if their sensitivity to chlorine and iodineis similar to or different from that of the HM175 strain of HAV.
a'' Aooession For
WTIS GRA&IDTIC TABUnannounced []Justif iati-
Distribution/
Availability Codes'Avai'1 and/or
Dist Special
'-a
I
TABLE OF CONTENTS
I. Introduction and BackgroundA. Importance and Epidemiology of Hepatitis A Virus
in Water .............................................. 1B. Previous Studies on Disinfection of Hepatitis A
Virus in Water ........................................ 2C. Military Need for Virus Disinfection of Water ......... 2
II. Statement of the Problem and ObjectivesA. Statement of the Problem .............................. 4B. Specific Objectives ................................... 4
III. Methods and MaterialsA. Viruses, Cell Cultures and Virus Purification ......... 5
B. Glassware and Halogen Reagents ........................ 8C. Halogen Analysis ...................................... 9D. Protocols for Disinfection Experiments ............... 10
IV. Results and DiscussionA. Disinfection by Free Chlorine in Buffered Halogen
Demand-free Wate .................................... 121. Results at 5 ............. ... 122 . Results at 25 C...................13
B. Disinfection by Iodine in Buffered HalogenDemand-free Water .................................... 14
V. Summary and Conclusions .................................. 16
VI. References .............................................. 17
TABLES
Table 1. Time (Minutes) for 99.99% Inactivation of HAV,Polio 1 and Echo 1 by 1 mg/i Free Chlorine inBuffered Halogen Demand-free Water at pH 4.5, 7.0and 9.5, and 5 C ............. ........... . .. . .... 20
Table 2. Time (Minutes) for 99.99% Inactivation of HAV,Polio 1 and Echo 1 by 1 mg/l Free Chlorine in
* Buffered Ha~ogen Demand-free Water at pH 4.5 and7.0, and 25-C .............................. 20
Table 3. Time (Minutes) for 99.99% Inactivation of HAV,Polio 1 and Echo 1 by 1 Tablet/Quart Iodine inBuffered Halogen Demand-free Water at pH 4.5, 7.0and 9.5, and 5C . ......................... .. .... 2
" ii
FIGURES
Figure 1. Flow Diagram of Protocol for HalogenDisinfection Experiments ............................ 11
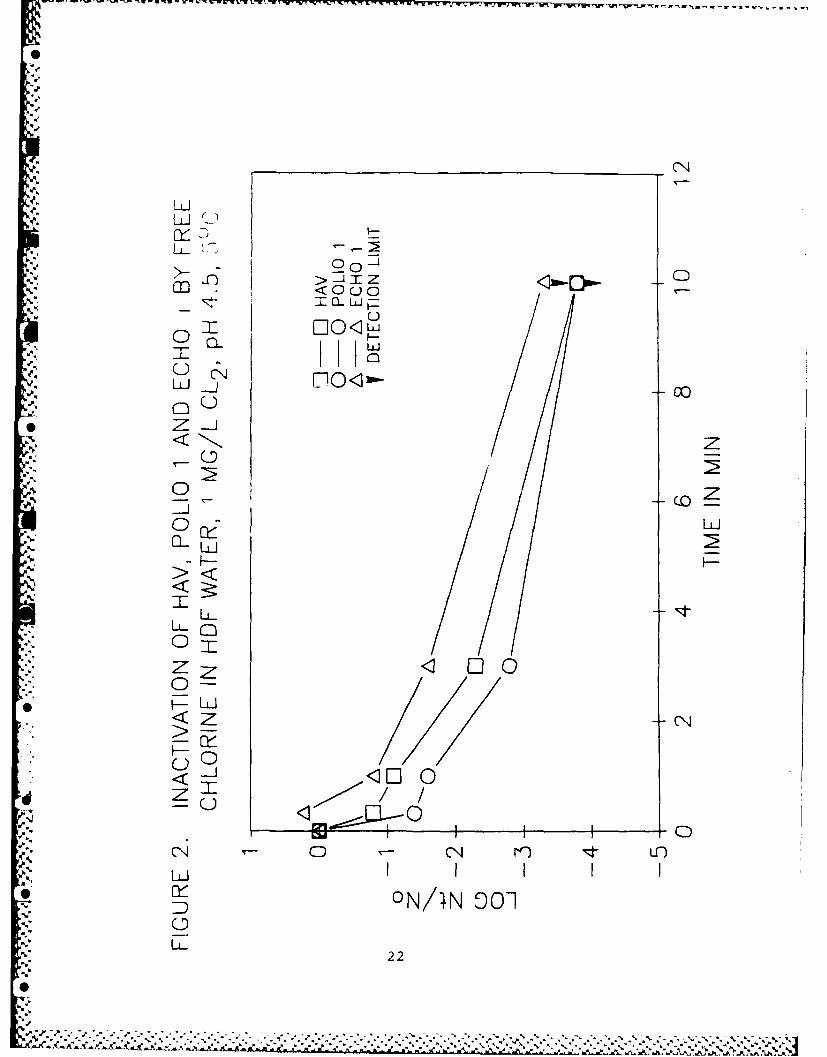
Figure 2. Inactivation of HAV, Polio 1 and Echo 1 by F~ee2: Chlorine in HDF Water, 1 mg/i C12, pH 4.5, 5 C ...... 22
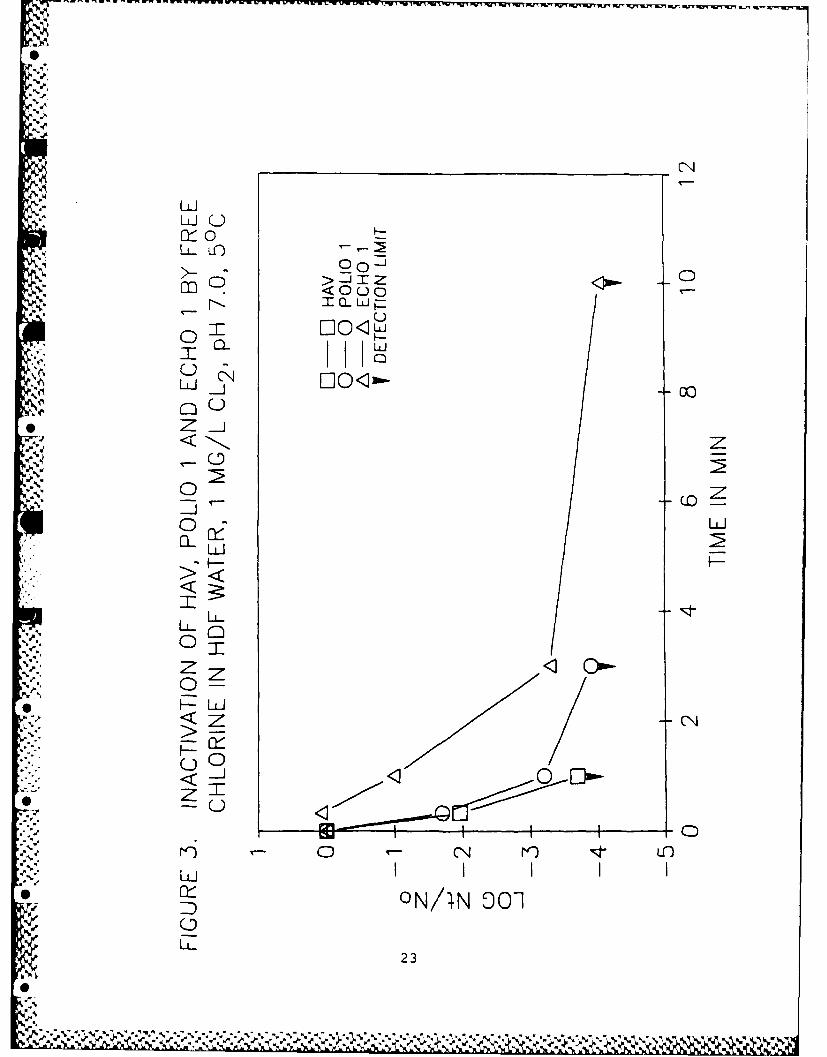
Figure 3. Inactivation of HAV, Polio 1 and Echo 1 by F~eeChlorine in HDF Water, 1 mg/i Cl2, pH 7.0, 5 C ...... 23
\ Figure 4. Inactivation of HAV, Polio 1 and Echo 1 by FgeeChlorine in HDF Water, 1 mg/i Cl2, pH 9.5, 5 C ...... 24
Figure 5. Inactivation of HAV, Polio 1 and Echo 1 by Fr~eChlorine in HDF Water, 1 mg/l C12, pH 4.5, 25C ..... 25
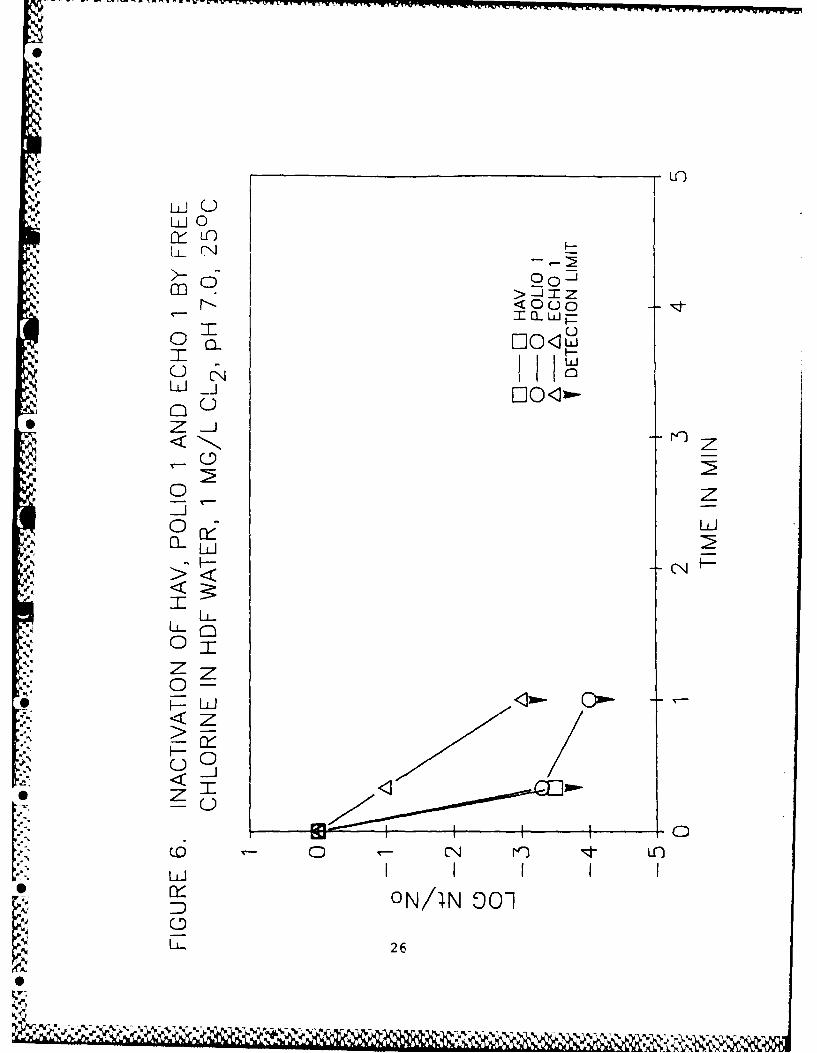
Figure 6. Inactivation of HAV, Polio 1 and Echo 1 by FrseChlorine in HDF Water, 1 mg/i C12, pH 7.0, 25-C ..... 26
Figure 7. Inactivation of HAV, Polio 1 and Echo 1 by Iodinein HDF Water, 1 Tablet/Quart, pH 4.5, 5°C ........... 27
Figure 8. Inactivation of HAV, Polio 1 and Echo 1 by Iodinein HDF Water, 1 Tablet/Quart, pH 7.0, 50C ........... 28
Figure 9. Inactivation of HAV, Polio 1 and Echo 1 by Iodine
in HDF Water, 1 Tablet/Quart, pH 9.5, 50C ........... 29
APPENDIX TABLES
Table Al. Inactivation of HAV, Polio 1 and Echo 1by 1 mg/1 Free Chlorine at pH 4.5 and 5C ........... 30
Table A2. Inactivation of HAV, Polio 1 and Echo 10by 1 mg/i Free Chlorine at pH 7.0 and 5C ........... 31
Table A3. Inactivation of HAV, Polio 1 and Echo 1by 1 mg/i Free Chlorine at pH 9.5 and SC ........... 32
Table A4. Inactivation of HAV, Polio 1 and Echo 1by 1 mg/i Free Chlorine at pH 4.5 and 25°C .......... 33
Table AS. Inactivation of HAV, Polio 1 and Echo 1by 1 mg/l Free Chlorine at pH 7.0 and 25C .......... 34
Table A6. Inactivation of HAV, Polio 1 and Echo 1
by 1 Tablet/Quart Iodine at pH 4.5 and 5C .......... 350
I0
- iii
.'
t. Table A7. Inactivation of HAV, polio 1 and Echo 1,, ~~by 1 Tablet/Quart Iodine at PH 7.0 and 5°C.. .. ..3
~Table A8. inactivation of HAV, polio 1 and Echo 1oby 1 Tablet/Quart Iodine at pH 9.5 and 5 C........... 37
I
-.
'I
.
I
-~ -t b1' .Sh--------MT M M W-d *
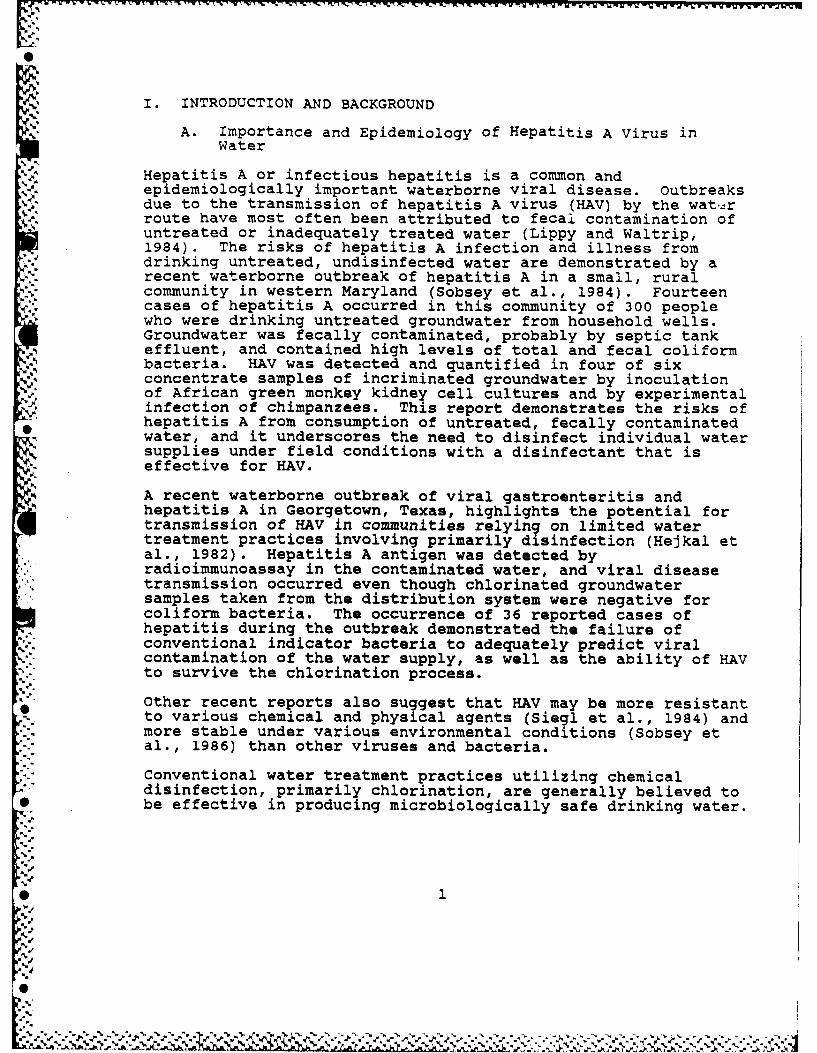
I.~ INTRODUCTION AND BACKGROUND
A. Importance and Epidemiology of Hepatitis A Virus inWater
Hepatitis A or infectious hepatitis is a common andepidemiologically important waterborne viral disease. Outbreaksdue to the transmission of hepatitis A virus (HAV) by the wat.zrroute have most often been attributed to fecal contamination ofuntreated or inadequately treated water (Lippy and Waltrip,
-1984). The risks of hepatitis A infection and illness from- ~ drinking untreated, undisinfected water are demonstrated by a
recent waterborne outbreak of hepatitis A in a small, ruralcommunity in western Maryland (Sobsey et al., 1984). Fourteencases of hepatitis A occurred in this community of 300 peoplewho were drinking untreated groundwater from household wells.Groundwater was fecally contaminated, probably by septic tankeffluent, and contained high levels of total and fecal coliformbacteria. HAV was detected and quantified in four of sixconcentrate samples of incriminated groundwater by inoculationof African green monkey kidney cell cultures and by experimentalinfection of chimpanzees. This report demonstrates the risks ofhepatitis A from consumption of untreated, fecally contaminatedwater, and it underscores the need to disinfect individual watersupplies under field conditions with a disinfectant that iseffective for HAV.
A recent waterborne outbreak of viral gastroenteritis andhepatitis A in Georgetown, Texas, highlights the potential fortransmission of HAV in communities relying on limited watertreatment practices involving primarily disinfection (Hejkal et
*al., 1982). Hepatitis A antigen was detected byradioimmunoassay in the contaminated water, and viral disease
*" transmission occurred even though chlorinated groundwatersamples taken from the distribution system were negative forcoliform bacteria. The occurrence of 36 reported cases ofhepatitis during the outbreak demonstrated the failure ofconventional indicator bacteria to adequately predict viralcontamination of the water supply, as well as the ability of HAVto survive the chlorination process.
Other recent reports also suggest that HAV may be more resistantS to various chemical and physical agents (Siegl et al., 1984) and
more stable under various environmental conditions (Sobsey etal., 1986) than other viruses and bacteria.
Conventional water treatment practices utilizing chemicaldisinfection, primarily chlorination, are generally believed to
* be effective in producing microbiologically safe drinking water.
S.-i
However, the growing number of reports on the isolation ofviruses from treated drinking water (Bitton et al., 1986)suggest that viruses may survive treatment under certainconditions. The establishment of reliable water treatmentpractices and water quality standards to insure the virologicalsafety of water supplies can be achieved only by fully
*' understanding the response of HAV to water disinfectants such aschlorine and iodine.
B. Previous Studies on Disinfection of HAV in Water.
Despite the need to determine the kinetics and extent of HAVinactivation by water disinfectants, the few investigationsreported to date on HAV inactivation by chlorine have beeninadequate due to technical limitations. Early studies by Neefeet al. (1945, 1947) provided indirect evidence that HAV isinsensitive to combined chlorine. Using human volunteers forvirus infectivity assay, Neefe and co-workers found that a totalchlorine residual of 1 mg/i did not completely inactivate HAV indilute fecal suspensions after a contact time of 30 minutes.The addition of sufficient chlorine to produce total and freechlorine concentrations of 1.1 and 0.4 mg/l, respectively, inpurified effluent was required to prevent clinicalmanifestations of infectious hepatitis in the volunteers. Morerecently, Peterson et al. (1983) used marmosets to assay for HAVinfectivity after chlorination of a partially purifiedpreparation of HAV. The infectivity of the preparation, whichcontained about 1500 infectious units/ml, was only partiallyreduced by treatment with up to 1.5 mg/1 of free residualchlorine at neutral pH for 30 minutes. These results, alongwith observations made during the outbreak of hepatitis inGeorgetown, Texas (HeJkal et al., 1982), suggest that HAV ismore resistant to conventional water chlorination processes thanother enteroviruses and indicator bacteria. In contrast,results of studies by Grabow et al. (1983) indicated that HAVmay be more sensitive to free chlorine than previous studies andepidemiological evidence have suggested. Using serologicaltechniques for assay of HAV infectivity in cell culture, Grabowand co-workers found that HAV was very sensitive to low levelsof free chlorine relative to selected indicator viruses andbacteria. However, other studies by this group indicated thatHAV was relatively resistant to combined forms of chlorine
*(Grabow et al., 1984).
C. Military Need for Virus Disinfection of Water.
In the military there is a special need for disinfectants thatwill be effective in destroying waterborne pathogens underadverse or emergency conditions, particularly when the quality
.-"
4-
I'
4.
of the water available for consumption is poor. Since World WarII, the Armed Forces of this country have relied primarily onglobaline tablets, an iodine-based disinfectant, fordisinfection of canteen water and other small-volume field watersupplies (O'Conner and Kapoor, 1970). Relatively little isknown about the adequacy of this disinfectant in preventing thetransmission of viral pathogens such as HAV in waters withvaried physical and chemical characteristics. Outbreaks ofinfectious hepatitis associated with military activities havecontinued to occur since the development of globaline (Bancroftand Lemon, 1984). Although the effectiveness of globaline andother forms of iodine against HAV has not been evaluated,disinfection studies on their effectiveness for other enteric
24, viruses, enteric bacteria and protozoan cysts have been reported(Safe Drinking Water Committee, 1980). However, considering thesubstantial differences in the response of different entericviruses to chlorine (Liu et al., 1971), it is impossible topredict the effectiveness of globaline or other disinfectantsfor inactivation of HAV in water.
In view of the limited data on HAV disinfection in general andthe inconsistent findings of the few studies on HAV disinfectionby chlorine, a critical evaluation of HAV inactivation by freeand combined forms of chlorine and by iodine (globaline) isclearly warranted. Water quality variables, such as thepresence of suspended inorganic particulates and soluble andcolloidal organic matter, are important factors that need to beevaluated for their effect on the efficiency of disinfection ofHAV. The adsorption of viruses to particulate matter in waterhas been well documented (Goyal and Gerba, 1979; Hurst et al.,1980; Schaub and Sagik, 1975; Sobsey et al., 1980).Particulates may protect viruses in the aqueous environment bysheltering viruses from disinfectant exposure or by consuming orchemically changing the disinfectant. Naturally-occurringsoluble and colloidal organic matter (such as humic and fulvicacids) in natural waters, finished waters and wastewaters mayalso be a factor in reducing the efficacy of the disinfection
.-~process by consuming or changing the active species of thechemical agent. The effects of suspended matter and soluble andcolloidal organic matter on HAV disinfection by chlorine andiodine have not been adequately addressed in the recent studiesreported in the literature.
The study of HAV inactivation kinetics by chlorine and iodine isnow feasible with the utilization of new methodologies for thecultivation and enumeration of HAV in cell cultures (Daemer etal., 1981; Frosner et al., 1979; Lemon et al., 1983; Provost andHilleman, 1979). The focus of this proposed project is to
* examine the kinetics and extent of HAV inactivation by chlorine
3
. °.
and iodine, with special emphasis on determining the influenceof important water quality variables on chlorine and iodineinactivation of HAV and, for comparison, selected model viruses.
II. STATEMENT OF THE PROBLEM AND OBJECTIVES
A. Statement of the Problem
The problem to be studied is the efficiency (kinetics andextent) of disinfection (inactivation) of hepatitis A virus bychlorine (calcium hypochlorite) and Army iodine (globaline) inwaters of different quality. In some experiments, theinactivation of other viruses or of different strains of HAVwill be compared, and in other experiments the inactivation of:iAV will be compared to the inactivation of Escherichia coli.
B. Specific Ojectives
The specific objectives of this study are to determine thekinetics and extent of HAV inactivation by free (hypochloriteion/hypochlorous acid) and combined (monochloramine) forms ofchlorine and by iodine (globaline tablets) in waters ofdifferent quality. As an alternative to using highly purified,monodispersed virus preparations, disinfection experiments willutilize partially purified, aggregated preparations in order tobetter model the physical state of the viruses in naturalaquatic environments.
The water quality variables to be studied are water source(buffered halogen demand-free water and untreated groundwater),particulates (in the form of bentonite clay at a turbidity of 5NTU), soluble and colloidal organics (in the form of 1:1mixtures of humic and fulvic acids at a concentration of 10mg~l), pH level (pH 4.5, 7.0 and 9.5) and temperature (5 and25 C). Virus inactivation kinetics will be determined in modelwaters having a range of physical and chemical qualities, andwill include studies in demand-free, buffered systems and inwater of poor quality (worst case). Worst case water isgroundwater at pH 9.5 and 5 C that contains 10 mg/l humic andfulvic acids (1:1 mixture) and 5 NTU bentonite clay turbidity.
Waters are seeded with a mixed virus preparation containingsufficient quantities of HAV, poliovirus 1, echovirus 1 and MS2bacteriophage to follow the inactivation of each virus over at1: least 4 logn units (99.99%). The latter three viruses areincluded in 8rder to compare HAV sensitivity to halogendisinfectants to that of other viruses which have beenpreviously studied in this regard.
4
%
III. METHODS AND MATERIALS
A. Viruses, Cell Cultures and Virus Purification
1. HAV. The HM175 (NIH prototype) strain of HAV,originally isolated from feces of an infected human in Australia(Daemer et al., 1981; Lemon et al., 1983; Gust et al., 1985) w~sproduced in persistently nfected BS-C-l cells grown in 850 cmroller bottles sr 6000 cm , ten-tiered cell factories (NUNC)incubated at 37 C. Prior to persistent infection, the virus hadbeen serially passaged 6 times in marmosets, 10 times in primaryAfrican green monkey kidney (AGMK) cells and 7 times in BS-C-lcells.
HAV infectivity was assayed by the radioimmunofocus assay (RIFA)in BS-C-l cells as previously described (Lemon et al., 1983;Sobsey et al., 1985), except the incubation period was reducedto one week. The RIFA is an enumerative assay analogous to aplaque assay, except that non-cytopathic, focal areas ofinfected cells are visualized by an immune autoradiographic[2 method.
Persistently infected cells were passaged every two to fourweeks by trypsinization and then resuspension of some of thecells in growth medium at a concentration of about 1 x 10cells/ml for re-inoculation into culture vessels. At eachpassage, some of the persistently infected cells and all of theculture fluids were harvested as crude virus stock. Harvestedinfected cells were centrifuged at low speed (about 3000 x q),resuspended in small volumes of phosphate-buffered saline (PBS),pH 7.5, and extracted with an equal volume of chloroform. TheHAV-containing PBS was recovered by low speed centrifugation toremove cell debris and chloroform. The cell debris andchloroform was extracted four to six more times with equalvolumes of PBS to obtain additional virus, and all PBS extractswere pooled as virus stock. HAV in culture fluids wasconcentrated by precipitation with polyethylene glycol (PEG)6000 (12% w/v, pH 7.2) overnight at 4 C. Resulting precipitateswere recovered by low speed centrifugation, resuspended in asmall volume of PBS and extracted with a volume of chloroformequal to the PBS volume in order to remove excess PEG. The PBSextracts were cleared of chloroform and PEG by low speedcentrifugation.
PBS extracts of cells and PEG concentrates from culture fluidswere pooled, and HAV was pelleted by ultr 8centrifugation at30,000 RPM (105,000 x q) for 4 hours at 5 C. Resulting pelletswere resuspended in small volumes of 0.05M phosphate-buffered4 distilled water (PBDW) and supplemented with CsCl to give a
5
.
density of 1.33 g/ml. These samples were ultracentrifuged toequilibrium in self-generated gradients at 25,000 RPM (90,000 xg) and 5 C for 3 days using the SW27 rotor ((BeckmanInstruments). Gradients were harvested in fractions from thebottcms of the tubes and assayed for HAV infectivity by RIFA.Fractions with the peak of HAV infectivity were desalted byuntrafiltration and washing with PBDW using Centricon 30 tubes(Amicon Inc). Desalted fractions were layered onto 10-30%sucrose gradients in phosphate buffered halogen demand-free
*water, pH 7.5, (PBHDFW) and ultrscentrifuged in the SW27 rotorat 25,000 RPM (90,000 x _) and 5 C for 5.5 hours. Under theseconditions, single virions should sediment about 2/3rds of thedistance from the top to the bottom of the gradient. Gradientfractions were harvested from the top of the tube and assayedfor HAV infectivity by RIFA. Gradient fractions werecharacterized as containing single virions or small, medium orlarge aggregates of HAV according to their position in thegradient. HAV gradient fractions were then pooled and mixedwith appropriate amounts of gradient fractions of the other testviruses such that the total amount of each virus consisted ofabout 8% single virions, 19% small aggregates, 39% mediumaggregates and 34% large aggregates. The numbers of virions inaggregates of fractions having small, medium and largeaggregates has not yet been 8determined. The titer of each virus
-N in the mixture was 1-5 x 10 infectious units/ml. Virusmixtures were further diluted 1:5 in halogen demand-free waterfor use in disinfection experiments in order to reduce halogendemand.
4 2. Echovirus 1 and Poliovirus 1. Echovirus 1 (strainV239) and poliovirus 1 (strain LSc) were grown and assayed bythe plaque technique in BGM (African green monkey kidney-derived) and MA104 (rhesus monkey kidney-derived) continuouscell lines, respectively, as previously described (Sobsey et al,1978). In order to assay each animal virus type (HAV,poliovirus and echovirus) in samples containing all threeviruses, the other two viruses were neutralized by addingantibodies (antisera) against them to the virus diluent. Forexample, poliovirus was assayed by neutralizing echovirus type 1using antiserum against echovirus type 1 in the poliovirusdiluent. HAV did not have to be neutralized in assays forpoliovirus or echovirus because it was non-cytopathic, grewslowly and did not interfere with the assays for these other twoviruses (unpublished results).
Poliovirus and echovirus were first plaque-purified 2-3 timesand then grown in large quantities under either one-step growthconditions (>5 PFU/cell) or at low multiplicity of infection
* (MOI; 0.01-0.1 PFU per cell). Crude virus stocks were harvested
r 6
N
iA.°
from infected cells at 5-7 hours post-infection under one-stepgrowth conditions or from infected cell lysates several dayspost-infection at low MOI when cytopathic effects were 4+.Virus was liberated from cells and cell debris by freezing andthawing, and then cell debris was removed by centrifugation atlow speed (10,000 x q for 15-30 minutes). Viruses in resultingsuper~atants were pelleted by ultracentrifugation (105,000 x gand 5 C for 4 hours). Resulting virus pellets were resuspendedin buffered HDFW, homogenized 1 minute, and in some casescentrifuged at 10,000 x q and 5°C for 20 minutes to removeadditional debris. After supplementing the sample with CsCl togive a density of 1.33 g/ml, viruses were banded to equilibriumas for HAV. Gradient fractions were harvested and assayed for
V. virus infectivity, and virus peak fractions were desalted usingCentricon 30 ultrafiltration units. These fractions were pooledand subjected to rate-zonal centrifugation in 5% (or 10%) to 30%sucrose gradients as for HAV. Gradient fractions were harvestedand assayed for virus infectivity and appropriate amounts cfvirus fractions were added to HAV samples to give the desireddistribution and virus titers of single virions as well assmall, medium and large aggregates.
3. Bacterionhages. Bacteriophages MS2 (ATCC[ 15597-BI) and OX174 (ATCC 13706-BI) were grown and assayed by
the top agar plaque technique (Adams, 1959) in . coli C3000(ATCC 15597) and E. coli C (ATCC 13706) hosts, respectively,
' using nutrient agar #2 (nutrient agar with 0.5% NaCl) medium.Crude virus was harvested from the top agar of plaque assayplates having confluent lysis by scraping into small volumes(3-5 ml/plate) of PBS. Harvests were frozen and thawed,homogenized or vortex mixed 1-2 minutes, and then centrifuged at10,000 x q for 15-20 minutes to remove cell debris and agar.Viruses in the resulting supernatant were pelleted b "
ultracentrifugation for 4 hours at 105,000 x q and 5 C. Pelletswere resuspended in PBHDFW, supplemented with CsCl to give adensity of 1.44-1.45 g/ml and the viruses were banded toequilibrium in s8lf-generating CsCl gradients for 3 days at25,000 RPM and 5 C usinq the SW27 rotor. Gradient fractionswere assayed for virus infectivity, and virus peak fractionswere desalted using Centricon 30 ultrafilters. Desaltedf-actions were layered onto 10-30% Sucrose gradients in PBHIFWaid centrifuged at 36,000 RPM and 5 C for 4.5 hours MS2) in the
[* SW41 rotor (Beckman Instruments) or 25,000 RPM and 5 C for 10hours (MS2) or 7 hours ($X174) in the SW27 rotor. Gradientfractions were collected from the top of the tubes and assayedfor virus infectivity to determine the location of virus peaks.
It was found that both MS2 and OX174 from sucrose gradients wereunstable after sucrose exposure and rapidly lost infectivity
7
.,
k ,5
titer when stored at 4 C or other storage temperatures.Attempts to preserve virus infectivity by dilution of thesucrose gradient fractions or by other means were unsuccessful.Subsequent experiments in which these phages were simply placedin sucrose solutions confirmed that exposure to sucrose causedvirus instability. For this reason, MS2 or other bacteriophagescould not be included in disinfection studies. Although virusstocks could be prepared without using sucrose densitygradients, such stocks could not be prepared by a method thatwould give specific proportions of viruses aggregated todifferent extents. Therefore, the bacteriophage stocks couldnot be prepared with a known and controlled amount of virusaggregation as was done for the animal viruses and could not beevaluated under the same protocol.
B. Glassware and Halogen Reagents.
All glassware for disinfection experiments and preparation ofhalogen demand-free (HDF) virus stocks was soaked at least 4hours in a strong chlorine (10-50 mg/i) solution and then rinsedthoroughly with halogen demand-free water (HDFW) prior to use.HDFW and buffer solutions for disinfection experiments were
* prepared from glass-distilled, deionized water by addingchlorine to approximately 10 mg/l. After storage at roomtemperature for at least 1/2 day, water or buffers weredechlorinated by exposure to a submersible ultraviolet light.HDF, phosphate-based buffers, 0.01M, were used to prepare
chlorine test solutions and buffered water for disinfectionexperiments.
Reagent grade calcium hypochlorite was used to prepare solutionsof hypochlorous acid (HOCI) at pH 4.5, hypochlorite ion (OCl-)at pH 9.5, and mixtures of these free chlorine species at pH7.0. Hypochlorite stock solutions of about 100 mg/i wereprepared by lissolving about 0.2 g of Ca(OCl) in 1 liter ofHDFW. Stock solution was then diluted in tesi water (halogendemand-free, 0.01M phosphate buffer, pH 4.5, 7.0 or 9.5 ininitial experiments) to give the target chlorine concentration.Target chlorine concentration was verified by chemical analysis.Iodine solutions were prepared from globaline tablets whichcontain tetraglycine hydroperiodide as the active ingredient and
* disodium dihydrogen pyrophosphate as a buffer. Globalineconcentrations to be tested are the molar equivalent of 1 mg/lchlorine (3.6 mg/l iodine) as well as two concentrations basedupon recommended Army field use (1 to 2 tablets per quart,giving concentrations of about 8 and 16 mg of titratable iodineper liter, respectively). Iodine solutions were prepared by
* dissolving 1 or 2 globaline tablets in about 900 ml of HDFW andadjusting to pH 4.5, 7.0 or 9.5 with NaOH or H2 SO4. For
!2.
*48
experiments testing disinfection efficiency of one or twotablets per quart, these samples were brought to a volume of 927
Vml with HDFW and iodine concentration was measured. The volumeof iodine solution was such that addition of 1 part of testvirus mixture to 9 parts of iodine solution would dilute theiodine to the target concentration. In experiments, sampleswith I or 2 tablets per quart had to have initial measurediodine concentrations of >7.5 and >15 mg/l, respectively. Foriodine solutions that were to be the molar equivalent of 1 mg/lchlorine, the iodine concentration of a solution containing 1tablet per quart was adjusted to 3.6 mg/1 by dilution with HDFW.Overall, the iodine concentrations obtained in this study weregenerally consistent with those of previous studies. Forexample, Farrah (1986) used one or two globaline tablets perquart in studies on the inactivation of three enteroviruses andbacteriophage MS2. At one tablet per quart, his initial iodineconcentrations at pH 5.0 ranged from 6.7 to 7.2 mg/l, and after60 minutes they ranged from 7.0-7.1 mg/l. In this present studyinitial iodine residuals ranged from 8.8 to 9.0 mg/l, and after60 minutes they were 7.7 to 3.9 mg/l. The greatest iodinelosses were at pH 9.5 where HOI, the hydrolysis product of Idecomposes to iodate and iodide, as previously observed (Chang,1958). Although the Army specifications and test protocol for
*e iodine tablets indicate somewhat higher iodine concentrationsthan reported here, there are differences in test protocols andanalytical methods. Furthermore, this study was done using a
F> single lot of Army approved globaline tablets. These tabletscould have been somewhat deficient in potency or they could havelost potency during continued storage and use. Since thetablets had not reached their expiration or re-test date, theywere considered representative of tablets in field use.
C. Halogen Analysis.
Iodine and chlorine concentrations were measured by DPDcolorimetric methods as described in Standard Methods for theExamination of Water and Wastewater, 16th edition (AmericanPublic Health Association, 1985). Standardization of proceduresfor chlorine measurement was by the DPD ferrous titrationmethod, and for iodine measurement by using potassium bi-iodateas a primary standard. These methods were judged to be morereliable than amperometric titration for at least two reasons.
[* First, amperometric titration would have required substantialfuther dilution of test samples due to the volume requirementsof the instrument. Such dilution could lead to futheranalytical errors and would have been near the lower detectionlimit of the amperometric titrator. Second, the amperometric
* -* titration method for iodine requires acidification of the sample[* to pH 4.0, which could alter the proportions of iodine species
present, create or destroy other oxidants, and thereby giveerroneous measurements of active iodine concentrations.
9F ji|iaS .
0
- D. Protocols for Disinfection Experiments.
Initial experiments on HAV disinfection by free chlorine or Armyiodine in buffered HDFW, pH 4.5, 7.0 and 9.5, were doneaccording to the flow diagram shown in Figure 1. Samples werein 16 mm diameter x 100 mm long test tubeg placed in a waterbath to maintain a temperature of 5 or 25 C. For initialexperiments with free chlorine at a concentration of 1 mg/i oriodine at a concentration of >7.5 mg/i (1 tablet/quart), 0.85 mlof purified virus stock mixture (HAV, polio and echo), diluted1:5 in HDFW, was added to 7.65 ml of a chlorine solutioncontaining 1.1 mg/l free chlorine or >7.5 mg/i iodine andbriefly mixed. A second test tube containing only chlorine oriodine solution served as a halogen control. A third tubecontaining a 1:10 dilution of stock virus in buffered HDFWserved as a virus control. Samples of 0.7 ml were withdrawnfrom the reaction tube (halogen solution plus added virus) forviral analysis at 0.33, 1.0, 3.0, 10, 30 and 60 minutes after
. virus addition. These samples were diluted two-fold immediatelyin virus diluent (2X Eagle's MEM) containing 1% Na Afurther five-fold dilution (10-fold overall) follo ed y serial
10-fold dilutions were made in a separat8 diluent for eachvirus. These dilutions were stored at 4 C for subsequent virusassay. After the 60 minute reaction period, the remainingreaction mixture (halogen plus added virus) and the chlorine oriodine control sample (halogen only) were re-analyzed "or freeand combined chlorine or iodine. Samples from the virus controltube (virus plus buffered HDFW) were diluted serially 10-fold atthe beginning and the end of the 60 minute reaction period forsubsequent virus assay.
-0
tt, ,
- ~~ ~ -~ ~ ~~ ~ ~ X '!w T Wu Ww W-. Tv wvwIW. g!r--'vv. *W- '
FIGURE 1. FLOW DIAGRAM OF PROTOCOL FOR HALOGEN DISINFECTIONEXPERIMENTS
N N1.,
IV. RESULTS AND DISCUSSION
A. Disinfection by Free Chlorine in Buffered HDFW.
1. Results at 5°C. The results of initial experimentsoB inactivation of HAV, polio 1 and echo 1 in buffered HDFW at5 Cand pH 4.5, 7.0 and 9.5, by 1 mg/l free chlorine aresummarized in Figures 2, 3 and 4 and in Table 1 as estimatedtimes for 99.99% inactivation of the initial viruses. These arethe mean results of duplicate experiments. Data for virusconcentrations of samples of individual experiments are given inAppendix Tables Al-A3. Times for 99.99% inactivation of theinitial virus (T99.99) were estimated from the graphs (Figures2-4) of log N I/N versus contact time, t, in minutes, where Nt= virus con~ntfatlon remaining at time t and N = the initialvirus concentration. These results show that al thrse viruseswere inactivated rapidly by 1 mg/l free chlorine at 5 C and pH4.5 and 7.0 and that HAV was also inactivated rapidly at pH 9.5.In all cases the T99.99 values were <.12.5 minutes., In contrast,
4.' inactivation of polio 1 and echo 1 at pH 9.5 and 5 C wasconsiderably slower, with T99.99 values of 65 and 147 minutes,
V respectively.
These results for polio 1 and echo 1 are generally consistentwith those of previous studies in which there is greater virusinactivation at acid and neutral pH levels than at alkaline pHlevels. The basis for this pH-dependent difference in freechlorine inactivation of viruses is believed to be the greatervirucidal activity of HOCI, which predominates at acid pHlevels, over OCi , which predominates at alkaline pH levels.The finding that virus inactivation rates at pH 7.0 were greaterthan or similar to those at pH 4.5 is difficult to explain,because the concentration of HOCl at pH 7.0 should be only about73% of the concentration at pH 4.5, with the balance of the freechlorine at pH 7.0 (about 23%) in the form of the less virucidalOCI . However, other factors besides the relative amounts ofHOCI versus OCl may be involved.
%A factor that could influence the relative rates of virusinactivation at different pH levels is the stability andpersistence of the free chlorine present in the reaction
* mixtures. In these experiments the initial concentration offree chlorine was about 1.0 mg/l after the addition of viruses.However, after 60 minutes of contact, some of the free chlorinein the reaction mixtures disappeared. Free chlorine residualsafter 60 minutes of contact in reaction mixtures at pH 9.5, 7.0and 4.5 were 0.54, 0.32 and 0.54 mg/l, respectively. These free
- -chlorine residuals at the different pH levels do not account for- the observed differences in virus inactivation rates, because
12
4.
virus inactivation rates were greatest at pH 7.0, where the freechlorine residual was lowest after 60 minutes. It is importantto note that at pH 4.5 and 7.0, inactivation of all three testviruses was extensive (>99.99%) within 15 minutes and when it islikely that residual chlorine concentrations were closer to theinitial level of 1 mg/l.
Another factor that may influence virus inactivation rates atdifferent pH levels is the degree of virus aggregation at eachpH level. The degree of virus aggregation was controlled in thepreparation of viruses, with a specific distribution of singlevirions and small, medium and large aggregates. However, theaddition of virus stocks to reaction mixtures at pH 4.5 may havecaused further aggregation of viruses, resulting in slowerinactivation kinetics due to greater protection of more and/orlarger aggregates. Results of previous studies have shown thatacid pH levels can induce virus aggregation and decrease therate of virus inactivation (Young and Sharp, 1985).
.. Yet another factor that may influence the rate of virusinactivation at different pH levels is a difference in theconformational form of the virus at each pH. One form of thevirus existing at one pH may be more resistant to disinfection
* and/or less infectious than another form existing at another pH.Both poliovirus type 1 and echovirus type 1 can exist in atleast two different, pH-dependent conformational forms (Youngand Sharp, 1985). The existence of different conformationalforms of HAV has not been fully established. However,preliminary evidence from this laboratory indicates theexistence of possibly two conformational forms of the HM175strain of HAV (unpublished results).
2. Results at 250 C. The results of initialexperiments on inactivation of HAV, polio 1 and echo 1 inbuffered HDFW at 25 C and pH 4.5 and 7.0 by 1 mg/l free chlorineare summarized in Figures 5 and 6 and Table 2 as estimated timesfor 99.99% inactivation of the initial viruses. Data for virusconcentrations in individual experiments are given in AppendixTables A4 and A5. The results for only one questionableexperiment at pH 4.5 are reported. Results for additionalexperiments at pH 4.5 and 9.5 were not available for inclusionin this report due to the long time required to complete HAV
* assays.
The experiment at pH 4.5 was compromised because the stock virusmixture was accidentally adjusted to pH 3.8 instead of pH 4.5.Although the virus mixture was readjusted to pH 4.5 before
.A -kstarting the experiment, it is possible that irreversible virus* aggregation occurred at pH 3.8, thereby altering the response of. the viruses to free chlorine.
13
0"
Another factor which must be considered in the results of thesingle experiment at pH 4.5 and both experiments at pH 7.0 isthe loss of free chlorine from the test samples during the 60minute reaction period. In the case of the experiment at pH 4.5the free chlorine residual dropped to 0 at 60 minutes, while inthe two experiments at pH 7.0, the free chlorine residual haddropped to 0.09 and 0.14 mg/l in0the duplicate experiments.This loss of free chlorine at 25 C is not unusual at this highertemperature in a batch system held for 60 minutes. Indeed,there was an approximate loss of 50% of the initial 1 mg/l offree 8 hlorine after 60 minutes in the chlorine control samplesat 25 C. The even greater free chlorine loss in the testsamples was probably due to some chlorine demand from the virusmixture. These experiments will be repeated later in theproject in order to achieve target chlorine residuals.
The results of the two experiments at pH 7.0 and 250C show thatdespite the considerable loss of free chlorine during the 60minute contact period, all three viruses were rapidlyinactivated, with T99.99 values of <1.2 minutes. In addition,HAV was inactivated somewhat more rapidly than polio and echo,with an estimated T99.99 of 0.4 minutes. Fog each virus0 the
* inactivation rate at pH 7.0 is shorter at 25 C than at 5 C,which is consistent with previous studies on virus inactivationby chemical disinfectants such as free chlorine.
* As observed in the experiments at 5 C, the rates of virusinactivation at pH 7.0 are similar to or shorter than the ratesat pH 4.5, although the rates for poliovirus inactivation arequite rapid at b8 th pH levels. In contrast to the results ofexperiments at 5 C, HAV was more resistant to inactivation bychlorine at pH 4.5 than was poliovirus. Furthermore, the ratesof0 HAV and ech8virus inactivation at pH 4.5 were not greater at
-'! 25 C than at 5 C. As previously stated, however, the data forvirus inactivation at pH 4.5 and 25 C are from only onequestionable experiment in which the chlorine residual droppedto zero at some time during the 60 minute reaction period.
4 Therefore, the experiments at pH 4.5 must be repeated in orderto obtain more reliable results. Despite the problems with theexperiment at pH 4.5 and 25 C, all three viruses wereinactivated by >99.99% in <15 minutes.
B. Disinfection by Iodine in Buffered HDFW
The results of initial experiments on inactivation of HAV, polio1 and echo 1 in buffered HDFW at 5 C and pH 4.5, 7.0 and 9.5 by1 globaline tablet per quart are summarized in Figures 7, 8 and9 and Table 3 and indicate the estimated time for 99.99%inactivation of the initial viruses. These results are for
* 14
I .. L. .
single trials of each experimental condition tested. In someexperiments there are no data for one of the three test virusesdue to virus assay problems. Additional experiments have beendone, but the results were not available for inclusion in thisreport. Data for virus concentrations in samples of individualexperiments are given in Appendix Tables A6 to A8.
The results obtained so far indicate that at pH 7.0 HAV is moresensitive to inactivation by Army iodine than are polio 1 andecho 1. At pH 7.0, for example, the T99.99 for HAV is <1.0minutes, while for polio 1 and echo 1 it is >60 and 29 minutes,respectively. T99.99 values for polio 1 and echo 1 are alsolong (>60 minutes) at pH 4.5, but HAV data for this pH are notyet available. At pH 9.5, both HAV and echo 1 are inactivatedrapidly, with T99.99 values of <0.33 and <0.96 minutes,respectively. Data for polio 1 inactivation at the samecondition are not available due to virus assay problems.
Data on iodine levels in test samples (see Figures 7 to 9)indicate that the initial target concentration of >7.5 mg/l wasmet in all experiments. However, iodine concentrations declinedduring the 60 minute contact time, with 60 minute residuals of3.9 to 7.7 mg/l. Some of this loss of iodine i' due to demandfrom the virus preparation because losses were not as great iniodine control samples held at the same temperature for 60minutes.
The results obtained so far indicate that HAV is rapidlyinactivated by one tablet of iodine per quart of buffered HDFW.In contrast, polio 1 and echo 1 are not rapidly inactivated bythis concentration of iodine at pH 4.5 or 7.0. At pH 9.0,however, at least echo 1 is rapidly inactivated by thisconcentration of iodine. These experiments must be repeated toverify the results and to obtain additional data for each virusat each test condition being studied. In addition, data must beobtained for experiments at 25 C.
The finding so far that HAV is less resistant or similar in% resistance to iodine inactivation than are the other two test
viruses is generally consistent with the results obtained so far- using free chlorine. However, some differences can be noted
between chlorine and iodine. At pH 9.5, both HAV and echo 1 are0 rapidly inactivated by one tablet of iodine per quart. In
contrast, HAV is inactivated relatively rapidly at pH 9.5 by 1mg/i free chlorine (T99.99 - 10 minutes), but polio 1 and echo 1are inactivated quite slowly (T99.99 - 65 and 147 minutes,respectively). At pH 7.0, 1 mg/1 free chlorine rapidlyinactivates all three viruses (T99.99 <11 minutes), but onetablet of iodine per quart rapidly inactivates only HAV. These
-- i
V..
-', 150
.
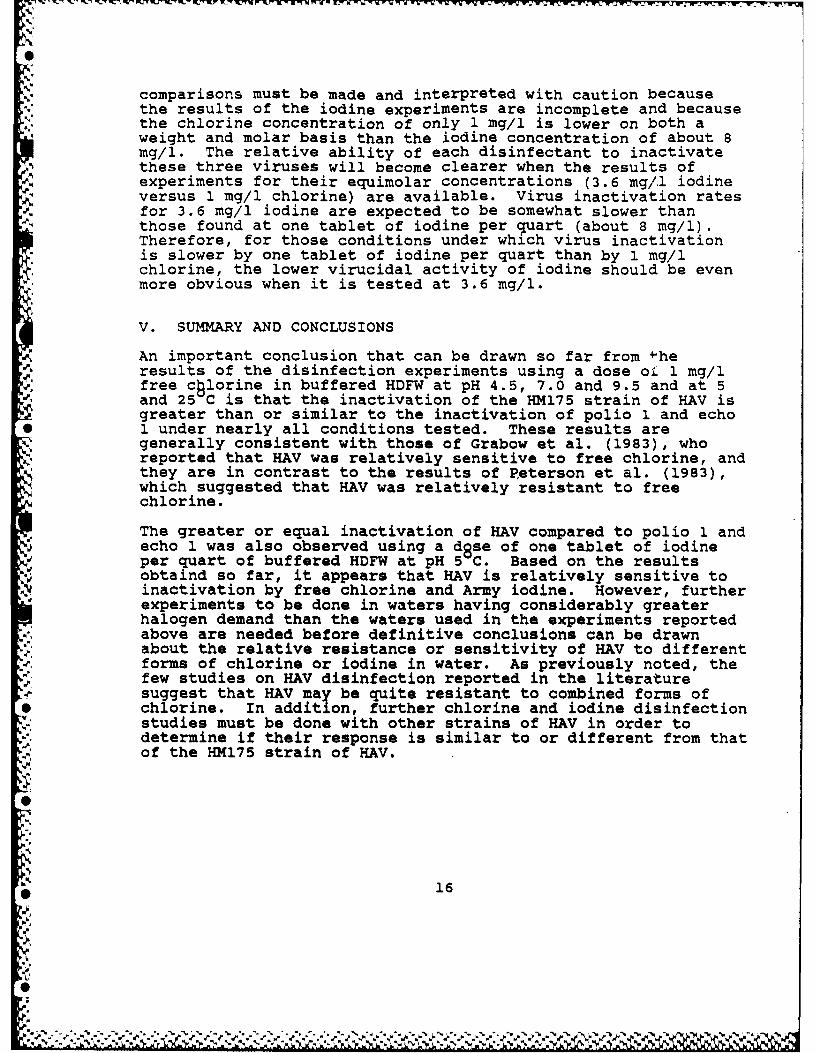
comparisons must be made and interpreted with caution becausethe results of the iodine experiments are incomplete and becausethe chlorine concentration of only 1 mg/l is lower on both a
* weight and molar basis than the iodine concentration of about 8mg/l. The relative ability of each disinfectant to inactivatethese three viruses will become clearer when the results ofexperiments for their equimolar concentrations (3.6 mg/1 iodineversus 1 mg/l chlorine) are available. Virus inactivation rates
4for 3.6 mg/l iodine are expected to be somewhat slower thanthose found at one tablet of iodine per quart (about 8 mg/i).Therefore, for those conditions under which virus inactivationis slower by one tablet of iodine per quart than by 1 mg/lchlorine, the lower virucidal activity of iodine should be evenmore obvious when it is tested at 3.6 mg/1.
V. SUMMARY AND CONCLUSIONS
An important conclusion that can be drawn so far from *heresults of the disinfection experiments using a dose o. 1 mg/lfree chlorine in buffered HDFW at pH 4.5, 7.0 and 9.5 and at 5and 25 C is that the inactivation of the HM175 strain of HAV isgreater than or similar to the inactivation of polio 1 and echo1 under nearly all conditions tested. These results aregenerally consistent with those of Grabow et al. (1983), whoreported that HAV was relatively sensitive to free chlorine, andthey are in contrast to the results of Peterson et al. (1983),which suggested that HAy was relatively resistant to freechlorine.
The greater or equal inactivation of HAV compared to polio 1 andecho 1 was also observed using a d8 se of one tablet of iodineper quart of buffered HDFW at pH 5 C. Based on the resultsobtaind so far, it appears that HAV is relatively sensitive toinactivation by free chlorine and Army iodine. However, furtherexperiments to be done in waters having considerably greaterhalogen demand than the waters used in the experiments reportedabove are needed before definitive conclusions can be drawnabout the relative resistance or sensitivity of HAV to differentforms of chlorine or iodine in water. As previously noted, the
.J few studies on HAV disinfection reported in the literaturesuggest that HAV may be quite resistant to combined forms of
* chlorine. In addition, further chlorine and iodine disinfectionstudies must be done with other strains of HAV in order todetermine if their response is similar to or different from thatof the HM175 strain of HAV.
16
VI. REFERENCES
Adams, M.H. (1959) Bacteriophapes, Interscience, New York.
American Public Health Association (1985) Section 408, pp.294-325 and Section 415, pp. 369-372, Standard Methods for theExamination of Water and Wastewater, 16th edition, AmericanPublic Health Association, Washington, D.C.
Bancroft, W.W and S.M. Lemon (1984) Hepatitis I from the militaryperspective, pp. 81-100, in R.J. Gerity (ed.) hepatitis A,Academic Press, Orlando.
Bitton, G., S.R. Farrah, C.L. Montague and E.W. Akin (1986)Viruses in drinking water, Environ. Sci. Technol., 20:216-222.
Chang, S.L. (1958) The use of active iodine as a waterdisinfectant, J. Am. Pharm. Assoc., 47:417-423.
%Daemer, R.J., S.M. Feinstone, I.D. Gust and R.H. Purcell (1981)Propagation of human hepatitis A virus in African green monkeykidney cell cultures: primary isolation and serial passage,Infect. Immun., 32:388-393.Farrah, S.R. (1986) Report of Test on Inactivation of Viruses byIodine, Report No. 6, Contract DAAK60-83-D-0002, U.S. Army NatickResearch and Development Center, Natick, Mass.
Frosner, G.G., F. Deinhardt, R. Scheid, V. Gauss-Muller, N.Holmes, V. Messelberger, G. Siegl and J.J. Alexander (1979)Propagation of human hepatitis A virus in a hepatoma cell line,Infection, 7:1-3.
Goyal, S.M. and C.P. Gerba (1979) Comparative adsorption of humanenteroviruses, simian rotavirus, and selected bacteriophages tosoils, ADD1. Environ. Microbiol., 38:241-247.
*. Grabow, W.O.K., V. Gauss-Muller, O.W. Prozesky and F. Deinhardt(1983) Inactivation of hepatitis A virus and indicator organismsin water by free chlorine residuals, ADDl. Environ. Microbiol.,46:619-624.
* Grabow, W.O.K., P. Coubrough, C. Hilner and B.W. Bateman (1984)Inactivation of hepatitis A virus, other enteric viruses andindicator organisms in water by chlorine, Wat. Sci. Tech., 17,Amsterdam, 657-664.
. Gust, I.D., N.I. Lehmann, S. Crowe, M. McCrone, S.A. Locarnini* and C.R. Lucas (1985) The origin of the HM175 strain of hepatitis
A virus, J. Infect, Dis., 151:365-367.
* 17
' 0%
. - -- ., . - , ,, .. ,sr,. urn n f wr,-v wv, r. W W ll ,t , * rJ fi m., .1 y WrY f r Y W-a r a'- , i r ; v - w w- w
Hejkal, T.W., B. Keswick, R.L. LaBelle, C.P. Gerba, Y. Sanchez,G. Dreesman, B. Hafkin and J.L. Melnick (1982) Viruses in acommunity water supply associated with an outbreak ofgastroenteritis and infectious hepatitis, J. Am. Water WorksAssoc., 74:318-321.
Hurst, C.J., C.P. Gerba and 1. Cech (1980) Effects ofenvironmental variables and soil characteristics on virussurvival in soil, Appl. Environ. Microbiol., 40:1067-1079.
Lemon, S.M., L.N. Binn and R.H. Marchwicki (1983)Radioimmunofocus assay for quantitation of hepatitis A virus incell cultures, J. Clin. Microbiol., 17:834-839.
Lippy, E.C. and S.C. Waltrip (1984) Waterborne disease outbreaks- 1946-1980: a thirty-five year perspective, J. Am. Water WorksAssoc., 76:60-67.
Liu, O.C., H.R. Seraichekas, E.W. Akin, D.A. Brashear, E.L. Katzand W.J. Hill, Jr. (1971) Relative resistance of twenty human
.1z enteric viruses to free chlorine in Potomac water, pp. 171-195,'V in: Viruses and Water Quality: Occurrence and Control,*0 ProceedinQs of the 13th Water Quality Conference, Department of
Civil Engineering, University of Illinois at Champaign-Urbana,Urbana.
Neefe, J.R., J. Stokes, J.B. Baty and J.G. Reinhold (1945)Disinfection of water containing a causative agent of infectioushepatitis, J.A.M.A., 128:1076.
Neefe, J.R., J.B. Baty, J.G. Reinhold and J. Stokes (1947)Inactivation of the virus of infectious hepatitis in drinking
lo water, Am. J. Pub. Health, 37:365-372.
O,Conner, J.T. and S.K. Kapoor (1970) Small quantity fielddisinfection. J. Amer, Water Works Assoc., 62:80-84.
Peterson, D.A., T.R. Hurley, J.C. Hoff and L.G. Wolfe (1983)Effect of chlorine treatment on infectivity of hepatitis A virus,Appl. Environ. Microbiol., 45:223-227.
* Provost, P.J. and M.R. Hilleman (1979) Propagation of humanhepatitis A virus in cell culture in vitro, Proc. Soc. EXR. Biol.Med., 160:213-221.
Safe Drinking Water Committee (1980) The disinfection of drinkingwater, pp. 5-137, in: Drinking Water and Health, National AcademyPress, Washington, D.C.
Schaub, S.A. and B.P. Sagik (1975) Association of enteroviruseswith natural and artificially introduced colloidal solids inwater and infectivity of solids-associated virions, Appl.Microbiol., 30:212-222.
Siegl, G., M. Weitz and G. Kronauer (1984) Stability of hepatitisA virus, Intervirology, 22:218-226.
Sobsey, M.D., H.R. Jensen and R.J. Carrick (1978) Improvedmethods for detecting enteric viruses in oysters, Appl. Environ.Microbiol., 36:121-128.
Sobsey, M.D., C.H. Dean, M.E. Knuckles and R.A. Wagner (1980)Interactions and survival of enteric viruses in soil materials,Appl. Environ. Microbiol., 40:92-101.
Sobsey, M.D., S.E. Oglesbee, D.A. Wait and A.I. Cuenca (1984)Detection of hepatitis A virus (HAV) in water, Wat. Sci. Tech.,17, Bilthoven:23-38.
Sobsey, M.D., S.E. Oglesbee and D.A. Wait (1985) Evaluation ofmethods for concentrating hepatitis A virus from drinking water,Appl. Environ. Microbiol., 50:1457-1463.
Sobsey, M.D., P.A. Shields, F.H. Hauchman, R.L. Hazard and L.W.Caton, III (1986) Survival and transport of hepatitis A virus insoils, groundwater and wastewater, Wat. Sci. Tech., 18:97-106.
Young, D.C. and D.G. Sharp (1985) Virion conformational forms andthe complex inactivation kinetics of echovirus by chlorine inwater, App1. Environ. Microbiol., 49:359-364.
I
I
19
I.4
-. ~ ~ ~ ~ W - -. q N W. I w E k W~ tf T. WW lrWL T t'1 X 3f' wi W-1 ZYMW r rE' ~ r P. E "r Er W
C.
TABLE 1
Time (Minutes) for 99.99% Inactivation of HAV, Polio 1 & Echo 1by 1 mg/l Free Chlorine in0BWffered Halogen Demand-free Water atpH 4.5, 7.0 and 9.5, and 5 C
Virus Time (Minutes) for 99.99% Inactivation at:pH 4.5 pH 7.0 pH 9.5
HAV 9.9 1.0 10.0
Polio 1 12.0 2.6 65.0
Echo 1 12.5 11.0 147.0
Times for 99.99% inactivation estimated from graphsof log0 virus survival versus contact time; based onaveragl results of duplicate experiments.
TABLE 2
Time (Minutes) for 99.99% Inactivation of HAV, Polio 1 & Echo 1by 1 mg/l Free Chloring In Buffered Halogen Demand-free Water atpH 4.5 and 7.0, and 25 C
Virus Time (Minutes) ;9r 99.99% Inactivation at:pH 4.5 pH 7.0
HAV 15.0 0.4
Polio 1 0.8 0.6
4 Echo 1 13.0 1.2V
Times for 99.99% inactivation estimated from graphsof log virus survival versus contact time; based on, veragloresults of duplicate experiments at pH 7.0.4Results of only one questionable experiment; see textfor details.
20
TABLE 3
Time (Minutes) for 99.99% Inactivationl of HAy, Polio 1. and Echo Iby about 8 mg/i Iodine in Dgfered Halogen Demand-free Water atpH 4.5, 7.0 and 9.5, and 5wC
Time (Minutes) for 99.99% Inacti"-ation at:Virus pH 4.5 pH 7.0 pH 9.5
HAV no data <1.0 <0.33
Polio 1 >60 >60 no data
Echo 1 >60 29 <0.96
Times for 99.99% inactivation estimated from graphsof log,10 virus survival versus contact time; based onresults of only single experiments for each condition.
SS
< CD )
T- LC)m.L
oN~
'T
-~ 0
T-
0
z CN
ZC)
ry ON/4N 001CD
22
CN
LUI
- ~ 2 0 CD-M 0 > -~ Z:Z
m000
LL1' (N LO~m--0
<a-.,
0zLLLU
>42N
(-)0 D
LCu
ON/, 00:DN
CD~
23 I-
1~~~'Li
LL- Lfl
Lf > 2:zCuo
EO<) u)C U -
0 00 wL
0- LL0LiN
*oz
10 LJJ
0 0
WD 0N N .14- I
C) 24
LLJOw 0Op- Lf
<0 0u C
Q_ 00L
u-
~Lij
El 0 0
a_ Lf
< 3w
0U- 25J
011
p- LflifM
isL LLI (
T CN
II0j EO<nQ
*L
is'L
0
<IC)1
ry ONb4N 001
LL- 26
0 Q
--I-
p.-C OLLI
0 0K<
00 I -
OLf
zQ z< < 0 LLJ
0 <
LL LUJ
0-
* H~LLJV
< <
z ~0<
LI I II* 0N/;N O0M
LL- 27
Q00 0C
Imi C)
D 0 C
--
zz
0 ::0:1-0 UJ
o - 0
00
0 0i= <~
<L 0 I-I>
-C)
CZ
0_
28
I--
ILLJ P
LLJ < -,
m Ln
u zLLuJ
I> 0
0~ 1 Ir
<
0 CNJ M)Lf
0-
LL 29
- - PN
TABLE Al
Inactivation of HAy, Polio 1 and Echoby 1 mg/1 Free Chlorine at pH 4.5 and 5 C
Sample and Infectious Units/mlTime (Min.) Hepatitis A Poliovirus Echovirus
Experiment 1Test Sample
40.33 2.8 x 10³ 1.68 xl 1.78 x 1031.0 4.67 x 10_2 8.4 x 10- 2.71 x 13.0 4.67 x 10 <9.3 8.4 x 10
10 <9.3** <9.3 <9.330 ND ND ND60 ND ND NDVirus Control 4 440 8.4 x 10⁴ 3.74 x 10⁴ 1.77 x 10⁴
60 2.8 x 10 5.51 x 10 4.11 x 10
Experiment 2Test Sample 3 3 40.33 9.33 x 19 1.12 x 10² 2.24 x 10 31.0 2.8 x 10⁻² 6.53 x 101 1.77 x 1023.0 1.02 x 10 6.53 x 101 3.73 x 10
10 <9.3 <9.3 <9.330 ND ND ND60 ND ND NDVirus Control0 4.11 x 10⁴ 2.6 x 10⁴ 747 x 74 4
60 2.99 x 10⁴ 1.68 x 10⁴ 8.4 X 10-
Means of Experiments 1 and 2Test Sample 3 3 40.33 6.10 x 19 1.4 x 10 2 2.00 x 10 31.0 3.7 X 10 747 x 101 2.24 x 1023.0 2.85 x 10- 3.27 x 10 2.29 x 10²
*Detection limit for viruses based on 0 (<1) PFU/1.07ml at 1:10 dilution of reaction mixture.
**ND = no viruses detected at this dilution.
03
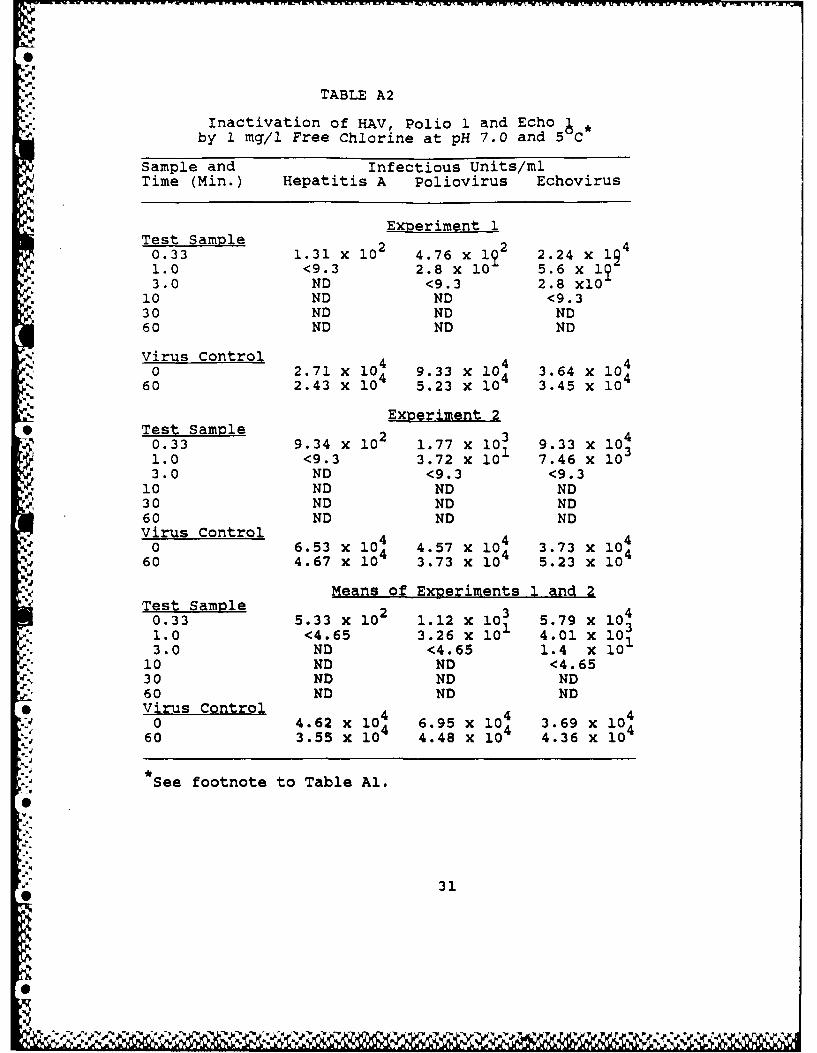
TABLE A2
Inactivation of HAV, Polio 1 and Echo ,by 1 mg/i Free Chlorine at pH 7.0 and 5 C
Sample and Infectious Units/mlTime (Min.) Hepatitis A Poliovirus Echovirus
Experiment 1Test Sample 2 40.33 1.31 x 10² 4.76 x 1 2.24 x 191.0 <9.3 2.8 x 10 5.6 x3.0 ND <9.3 2.8 xl0
10 ND ND <9.330 ND ND ND60 ND ND ND
Virus Control 4 4 40 2.71 x 10 9.33 x 10 3.64 x 10 460 2.43 x 10 5.23 x 10 3.45 x 10
Experiment 2* Test Sample
0.33 9.34 x 1O 1.77 x 101 9.33 x l01.0 <9.3 3.72 x 101 7.46 x 103.0 ND <9.3 <9.310 ND ND ND30 ND ND ND60 ND ND NDVirus Control 4 40 6.53 x 10 4 4.57 x 10⁴ 3.73 x 10 460 4.67 x 10 3.73 x 10 5.23 x 10
Means of Experiments 1 and 2Test Sample 2 40.33 5.33 x 10 1.12 x 10: 5.79 x 10 31.0 <4.65 3.26 x 101 4.01 x 10 13.0 ND <4.65 1.4 x 10¹⁰ ND ND <4.6530 ND ND ND60 ND ND ND
* Virus Control 4 4 40 4.62 x 10⁴ 6.95 x 10⁴ 3.69 x 10⁴
60 3.55 x 10 4.48 x 10 4.36 x 10
See footnote to Table Al.
'4
.44 31
%%K
TABLE A3
Inactivation of HAV, Polio 1 and Echo . ,by 1 mg/l Free Chlorine at pH 9.5 and 5 C
Sample and Infectious Units/mlTime (Min., Hepatitis A Poliovirus Echovirus
Experiment 1Test Sample 4 40.33 1.21 x 10³ 1.68 x 10⁴ 1.12 x 1051.0 1.87 x 10² 1.96 x 10⁴ 1.12 x 10 53.0 3.73 x 10 1.03 x 10³ 1.87 x 10
10 <9.3 1.59 x 101 no data30 ND 3.73 x 10 1.86 x 10460 ND <9.3 1.12 x 10
Virus Control 4 4 40 3.73 x 10⁴ 2.05 x 10⁴ 7.47 x 12
60 5.98 x 10 2.15 x 10⁴ 5.6 x 10
Experiment 2* Test Sample 4 4
0.33 2.89 x 1O4 2.33 x 10⁴ 1.87 x 1 4
1.0 1.87 x 10 1.59 x 10⁴ 1.4 x 10-53.0 1.21 x 10- 1.31 x 19 2.15 x 19
10 <9.3 5.6 x 10 2 1.6 x 10 530 ND 2.61 x 10 1.03 x 1260 ND <9.3 5.6 x 10Virus Control 4 4 40 3.64 x 10⁴ 1.96 x 12 9.33 x 10⁴
60 2.61 x 10 2.8 x 10 4.30 x 10
Means of Experiments 1 and 2Test Sample 4 40.33 2.05 x 10⁴ 2.0 x 10⁴ 6.54 x 1O_
1.0 1.03 X 10² 1.78 X 10⁴ 1.26 X 10 -
3.0 7.92 x 10 1.17 x 19 2.19 x ig10 <4.65 3.6 x 10 2 1.6 x 1030 ND 1.49 x 10² 6.08 x 10460 ND <4.65 3.36 x 10⁴Virus Control0 3.69 x 10⁴ 2.0 x 10⁴ 4.20 x 10⁴
60 4.30 x 10⁴ 2.48 x 10⁴ 4.95 x 10⁴
See footnote to Table Al.0
* 32
%
TABLE A4
Inactivation of HAV, Polio 1 and Echo 10by 1 mg/l Free Chlorine at pH 4.5 and 25°C
Sample and Infectious Units/mlTime (Min.) Hepatitis A Poliovirus Echovirus
Ile Experiment 1Test Sample0.33 1.02 x 10 2 3.64 x 10 1 2.04 x 1011.0 7.47 X 101 3.36 x 10 1.68 X 103.0 1.87 x 01 <9.3 <9.3
10 <9.3 ND ND30 ND ND ND60 ND ND ND
Virus Control0 5.5 x 10⁴ 4.2 x 10 s 3.64 x 1
60 2.8 x 10 4.06 x 10 .4 x 10
See footnote to Table Al; Results of only a singleexperiment available so far.
-33
'-,
S
/
[,•
1
.13
0o
"p-.
-6IM - - -W -V ' -7 _ - v ,. -- - - -
TABLE A5
Inactivation of HAy, polio 1 and Echo 1~by 1 mg/l Free Chlorine at pH 7.0 and 25 C
Sample and Infectious Units/mlTime (Min.) Hepatitis A Poliovirus Echovirus
Experiment 1Test Sample120.33 <9.33 2.8 x 101 2.8 x 1021.0 ND <9.3 <9.33.0 ND ND ND
10 ND ND ND30 ND ND ND60 ND ND ND
Virus Control 4 4 40 3.64 x 10 4 5.6 x 10 4 2.34 x i
60 4.67 x10 1.59 x10 4:2 x10
* Experiment 2Test Sample220.33 <9.3 1.68 x 10² 7.0 x 1021.0 ND <9.3 <9.33.0 ND ND ND
10 ND ND ND30 ND ND ND60 ND ND NDvirus Control 4530 1.49 x 10' 5.46 x 10~ 3.36 x 1034 5360 1.12 x 10 5.49 x 10 3.64 x 10
Means of-Experiments 1 and 2Test Sample120.33 <4.65 9.8 x 101 4.9 x 1021.0 ND <4.65 <4.65
4,3.0 ND ND ND10 ND ND ND30 ND ND ND
*60 ND ND NDVirus Control440 2.57 x 10 4 3.05 x 10 5 1.34 x 10 4
60 2.90 x 10 4 2.82 x 10 5 2.11 x 10⁵
* See footnote to Table Al.
34
N6dN
TABLE A6
Inactivation of HAV, Polio 1 and Echo ,by 1 Tablet/Quart Iodine at pH 4.5 and 5 C
Sample and Infectious Units per mlTime (Min.) Hepatitis A Poliovirus Echovirus
Test Sample 30.33 no data 5.1 x 10³ 2.0 x 1031.0 5.7 x 03 2.0 x 10 3
-, 3.0 7.3 x 10 3 6.0 x 10l410 3.7 x 10³ 2.2 x 10 430 3.1 x 10³ 2.6 x 10260 1.7 x 10 2.2 x 10
Virus Control0 I 6.7 x 10³ 1.3 x 10⁴
60 6.1 x 10 2.4 x 10
See footnote to Table Al.
p.
TABLE A7
Inactivation of HAV, Polio 1 and Echo ,by 1 Tablet/Quart Iodine at pH 7.0 and 5 C
Sample and Infectious Units Vjr mlTime (Min.) Hepatitis A Poliovirus Echovirus
Test Sample 3 20.33 2.5 x 10 2.2 x 10³ 3.4 x 1021.0 <9.3 2.4 x 10⁻³ 8.6 x 10 43.0 ND 1.6 x 10³ 1.0 x 10.
10 ND 1.6 x 10² 3.0 x 101
30 ND 1.8 x 10 <9.360 ND <9.3 ND
Virus Control 4 3a.0 5.9 x10 4 2.6 x10 3 8.8 x10 460 2.4 x 10 1.4 x 10 1.2 x 10
*,ee footnote to Table Al.Results from poor quality plaque assay.
* 35
.
.. M... .,. .~. ... a A ~ - -. ..% .. ~.% ..
TABLE A8
Inactivation of HAV, Polio 1 and Echo ,by 1 Tablet/Quart Iodine at pH 9.5 and 5 C
4 Sample and Infectious Units per ml
Time (Min.) Hepatitis A Poliovirus Echovirus
Test Sample0.33 <9.3 no data 2.2 x 1031.0 ND no data <9.33.0 ND no data ND
i0 ND no data ND30 ND no data ND60 ND no data ND
Virus Control 4 n0 1.4 x 10 4 no data 1.24 x 10 4
60 1.6 x 10 no data 1.17 x 10
* See footnote to Table Al.
.36
• 36
DISTRIBUTION LIST
23 copies CommanderU.S. Army Medical Bioengineering Research and
Development Laboratory,. ATTN: SGRD-UBG-' Fort Detrick, Frederick, MD 21701-5010
2 copies commander
U.S. Army Medical Bioengineering Research andDevelopment Laboratory
1 copy CommanderU.S. Army Medical Research and Development CommandATTN: SGRD-RMI-SFort Detrick, Frederick, MD 21701-5012
12 copies Defense Technical Information Center (DTIC)ATTN: DTIC-DDACCameron StationAlexandria, VA 22304-6145
1 copy DeanSchool of MedicineUniformed Services University of the
Health Sciences4301 Jones Bridge RoadBethesda, MD 20814-4799
1 copy CommandantAcademy of Health Sciences, U.S. ArmyATTN: AHS-CDM
* Fort Sam Houston, TX 78234-6100
1 copy CommanderU.S. Army Medical Bioengineering Research and
and Development LaboratoryATTN: SGRD-UBZ-T/LibrarianFort Detrick, Frederick, MD 21701-5010
I2L
* SECORITY CLASSIFICATiON OF 7 -S PAGE M179/ "76-0~3Form Approved
REPORT DOCUMENTATION PAGE OMB No. 0704-0188
% la REPORT SECURITY CIASSiF.CATION lb RESTRICTIVE MARKINGS" : Unclassified- 2a. SECURITY CLASSIFICATIC1. AUTHORITY 3 DISTRIBUTION /AVAILABILITY OF REPORT
Approved for public release;2b DECLASSIFICATION /DOWNGRADING SCHEDULE distribution unlimited
4 PERFORMING ORGANIZAT!ON REPORT NUMBER(S) S. MONITORING ORGANIZATION REPORT NUMBER(S)
6a. NAME OF PERFORMING ORGANIZATION 6b. OFFICE SYMBOL 7a. NAME OF MONITORING ORGANIZATIONUniversity of North (If applicable)
%, Carolina-Chapel Hill I6c. ADDRESS (City, State, and ZIP Code) 7b. ADDRESS (City, State, and ZIP Code)C GB 7400 Rosenau Fort Detrick, Frederick, MD
, Chapel Hill, NC 27599 21701-5010
8a. NAME OF FUNDING, SPONSORING 8b. OFFICE SYMBOL 9. PROCUREMENT INSTRUMENT IDENTIFICATION NUMBERORGANIZATION US Army Medical (if applicable)
. Research & Development I DAMD7-86-C-6053, Command I, 8c. ADDRESS (City, State, and ZIP Code) 10. SOURCE OF FUNDING NUMBERS
Fort Detrick, Frederick, MD 21701-5012 PROGRAM PROJECT TASK WORK UNITELEMENT NO. NO3E16277- NO. ACCESSION NO.
i2777A 7A878 CA 29311. TITLE (Include Security Classficaion)
- (U) Inactivation of Hepatitis A Virus (HAV) by Chlorine & Iodine in Water
12. PERSONAL AUTHOR(S)Mark D. Sobsey
13a. TYPE OF REPORTn a 13b. TIME COVERED 114. DATE OF REPORT (Year, Month, Day) 115 PAGE COUNTI.Annual FROM _NLJ518TO,I1 861 November 1986 41
16. SUPPLEMENTARY NOTATION
17. COSATI CODES 18. SUBJECT TERMS (Continue on reverse if necessary and identify by block number)- FIELD GROUP SUB-GROUP Hepatitis A Virus, Water, Disinfection,
" 06 10 Chlorine, Iodine, Inactivation.'..06 09
19. ABSTRACT (Continue on reverse if necessary and identify by block number)
- & ,Batchblaboratory btudies were done on the inactivation of HAV, poliovirus I*f and echovirus 1 by 1 mg/l free chlorine and ca. 8 mg/1 Army iodine in halo-
gen demand-free water at pH 4.5, 7.0 and 9.5 and 5 and 25 0C. HAV wasrapidly inactivated by both halogens under the conditions tested so far,with times for 99.99% inactivation of less than 15 minutes. In contrast,polio 1 and echo 1 were not rapidly inactivated under some conditions,notably pH 9.5 for chlorine and pH 4.5 and 7.0 for iodine. Further studiesare in progress to determine the sensitivity of these viruses to chlorineand iodine in the presence of appreciable halogen demand and other potentiaiinterferences.
6L
20. DISTRIBUTION/AVAILABILITY OF ABSTRACT 21 . ABSTRACT SECURITY CLASSIFICATIONMUNCLASSIFIED/UNLIMITED [ SAME AS RPT ,3 DTIC USERS Unclassified
22a. NAME OF RESPONSIBLE INDIVIDUAL 22b. TELEPHONE (Include Area Code) 22c. OFFICE SYMBOLMrs. Judy Pawlus 01 663-7325 SGRD-RM1-S
DO Form 1473, JUN 86 Previous editions ore obsolete. SECURITY CLASSIFICATION OF THIS PAGE