Adaptable Visualization Service: through Uniformity towards Sustainability Tom´ aˇ s Dym´ aˇ cek 1 and Petra Hocov´ a 2 and Miroslav Kintr 3 1 Mycroft Mind a.s., Lidicka 28, 602 Brno, Czech Republic 2 Knowledge and Information Robots Laboratory,Faculty of Informatics, Masaryk University, Botanicka 68a, 602 00 Brno, Czech Republic 3 Institute of Computer Science, Masaryk University, Botanicka 68a, 602 00 Brno, Czech Republic [email protected],[email protected],[email protected]http://kirlab.fi.muni.cz/en:homepage Abstract. This paper presents a design of Adaptable Visualization Ser- vice which supports automatic generation of visualizations and GUIs. Adaptable Visualization Service is able to perform a wide range of visu- alization tasks. The advantage of presented service lays in its ability to combine various visualization methods and easiness of adding new ones. When adding a new visualization method the degree of changes made in Adaptable Visualization Service itself needs to be minimized. We as- sert that the desired minimization of changes can be reached thanks to uniformity of the proposed solution, adoption and extension of Model- View-Controller pattern, language independency of solution and division of service into three separate layers: language layer, visualization meth- ods layer and transformation layer. Then the necessary changes can be limited to a small and isolated part of the visualization methods layer. We state that current solutions dealing with automatic GUI generation are difficult and costly to extend. Key words: model-based user interface development, conceptual model, GUI design, Model-View-Controller 1 Introduction Nowadays the information society suffers from information overload. Users look- ing for their answers in information systems can easily get lost, confused and disoriented. There are various kinds of information and these can be found in various data sources. After users input their queries into any information system there are usually two phases to be proceeded; the data retrieval and the data visualization, i. e. first appropriate data need to be searched out and obtained by the information system and second results of the search need to be visualized in a such way to be easily readable and understandable by the user. Every visual- ization method brings its own added value in expressing the information within the data. For given set of data the adequacy of used visualization method differs
Transcript
Adaptable Visualization Service: throughUniformity towards Sustainability
Tomas Dymacek1 and Petra Hocova2 and Miroslav Kintr3
1 Mycroft Mind a.s., Lidicka 28, 602 Brno, Czech Republic2 Knowledge and Information Robots Laboratory,Faculty of Informatics, Masaryk
University, Botanicka 68a, 602 00 Brno, Czech Republic3 Institute of Computer Science, Masaryk University, Botanicka 68a, 602 00 Brno,
Abstract. This paper presents a design of Adaptable Visualization Ser-vice which supports automatic generation of visualizations and GUIs.Adaptable Visualization Service is able to perform a wide range of visu-alization tasks. The advantage of presented service lays in its ability tocombine various visualization methods and easiness of adding new ones.When adding a new visualization method the degree of changes madein Adaptable Visualization Service itself needs to be minimized. We as-sert that the desired minimization of changes can be reached thanks touniformity of the proposed solution, adoption and extension of Model-View-Controller pattern, language independency of solution and divisionof service into three separate layers: language layer, visualization meth-ods layer and transformation layer. Then the necessary changes can belimited to a small and isolated part of the visualization methods layer.We state that current solutions dealing with automatic GUI generationare difficult and costly to extend.
Key words: model-based user interface development, conceptual model,GUI design, Model-View-Controller
1 Introduction
Nowadays the information society suffers from information overload. Users look-ing for their answers in information systems can easily get lost, confused anddisoriented. There are various kinds of information and these can be found invarious data sources. After users input their queries into any information systemthere are usually two phases to be proceeded; the data retrieval and the datavisualization, i. e. first appropriate data need to be searched out and obtained bythe information system and second results of the search need to be visualized ina such way to be easily readable and understandable by the user. Every visual-ization method brings its own added value in expressing the information withinthe data. For given set of data the adequacy of used visualization method differs
60 Proceedings of MDISIS 2008
within the scope of effective presentation. In some cases visualizing informationas a list could be more appropriate than in the graph representation and viceversa. Described situation is more or less the same in most of the domains (i.e.information overload, need of effective visualization).
To explain it more properly some examples from the network security fieldfollows. The domain of the network security field was chosen because of authorswork in development of a system which provides support in this domain (e.g.[16]). The WhoIs information (information about internet domain details) mightbe visualized in a form because of its simple structure and its qualitative char-acteristics. A topology of a guarded network would be preferably visualized asa graph. Another example here is information about particular flows (i.e. recordof network communication between two IP addresses). It is a quantitative infor-mation and could be visualized either as a list or a statistical diagram.
What particular visualization method for displaying certain kind of infor-mation is going to be used in real situation is specified in cooperation with a(potential) user. Every professional working above the data from the networksecurity domain need to see the data in different visualization structure. Withinthe data on one hand security managers are looking for attacks done in/towardsthe guarded network and on the other hand network administrators are moreinterested in amount of transferred data. Every profession requires different high-lighting of information at the first look.
Also requirements on the visualization service were evolving through timeand more visualization methods were demanded to satisfy a system operator(i.e. security manager or network administrator) needs. The operator prefer-ences were changing–a wider set of information needed to be computed from thenetwork traffic data (process of data retrieval) and therefore a visualization ofthe new set had to be adjusted to the new kind of content. E.g. WhoIs infor-mation should be visualized together with information from databases of knownattacks and the information about the physical location of devices.
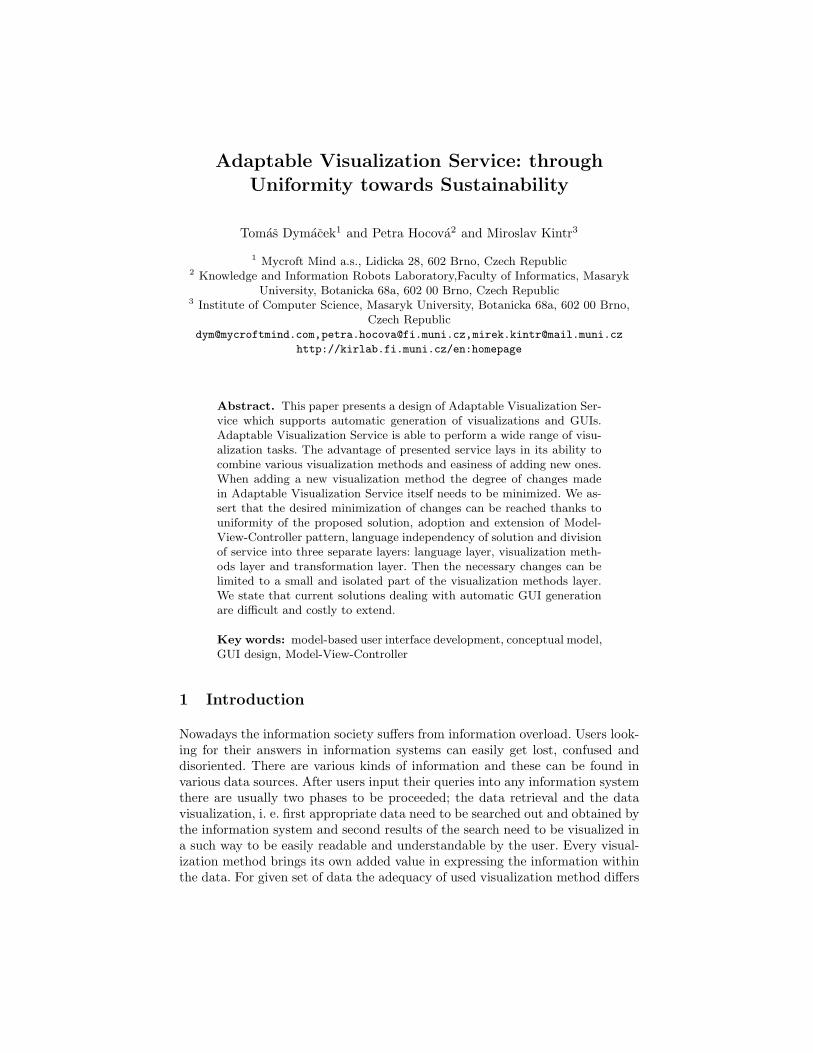
To be able to visualize the all complexity of incoming information into thevisualization service of the information system a new visualization technique so-called Nested Visualization was developed. The Nested Visualization approachis based on the principle of combining various visualization techniques. Is meansthat any of implemented visualization methods (a table, a mind map, a form)can be inserted into any element of implemented visualization method (a cell ofthe table, a node of the mind map, a cell of the form). Precisely, this approachallows to display the information within the whole complexity, in one windowand by adequate visualization method. It also means that visualization of theresult of some query can be adapted to the content of the result itself. Thesample of such output can be seen the figure 1, where the mind map techniqueand the form visualization is combined in one workspace.
Moreover, to fulfill continuously changing requirements on the visualizationservice of the system and to be able easily handle the Nested Visualizationapproach a new architecture for the visualization service was developed andimplemented, it is so-called Adaptable Visualization Service (AVS). The core of
Proceedings of MDISIS 2008 61
Fig. 1. The sample Nested Visualization, an output of AVS
the AVS serves as a platform into which desired visualization techniques can beplugged and then combined in by the Nested Visualization approach. This paperfocus on important aspects of conceptual design and architecture of the AVS.
The regular job of a common visualization service is to render visualizationof data according to a description, the description is prepared by other partsof the system (in process of data retrieval). Every visualization service acceptsinput in some defined input format, then it transforms this input into a GUIinstance assembled from components provided by the visualization service. Whenadding a new visualization method the visualization service itself has to usuallybe reprogrammed. The phase of implementation of a new visualization methodinto existing visualization service must be performed quickly. The delay betweenidentifying new requirements and their satisfaction must be as short as possible.Unfortunately, reprogramming the service and implementing new methods into itis very time consuming. Ideal situation for such task would be when the changesnecessary for adding a new visualization method would be well defined, isolatedand small. And the changes made within the visualization service because ofadding new method would not propagate through the whole visualization service.
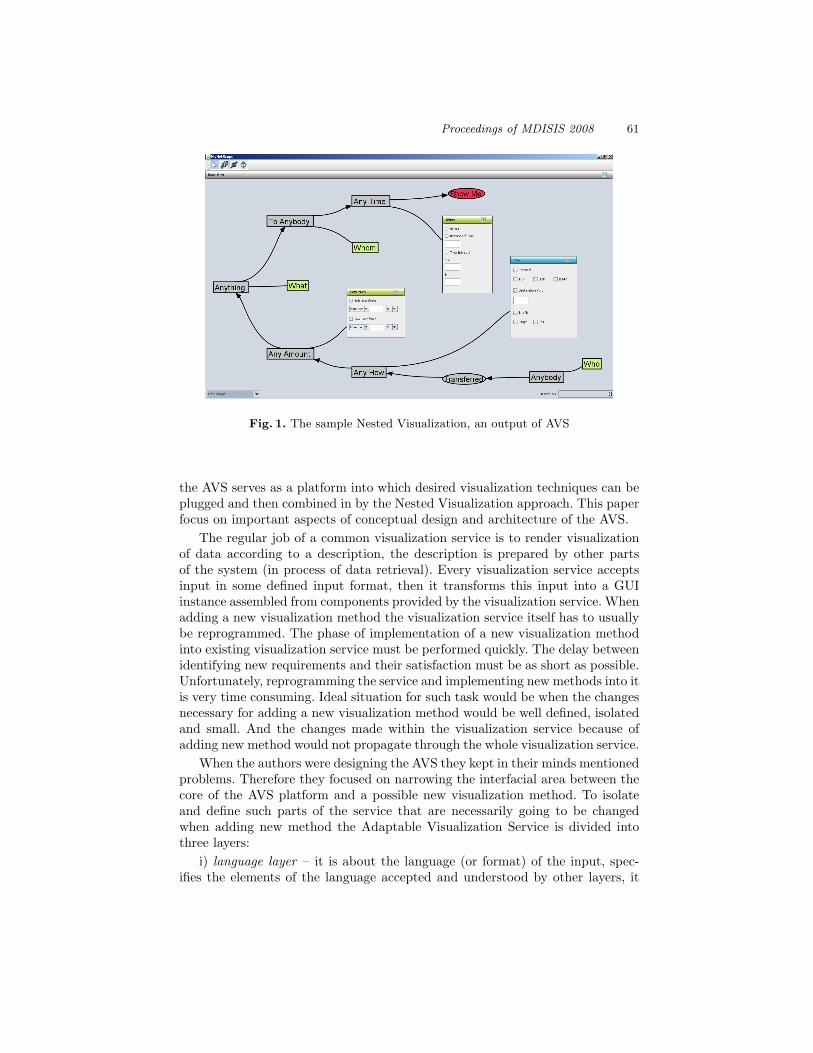
When the authors were designing the AVS they kept in their minds mentionedproblems. Therefore they focused on narrowing the interfacial area between thecore of the AVS platform and a possible new visualization method. To isolateand define such parts of the service that are necessarily going to be changedwhen adding new method the Adaptable Visualization Service is divided intothree layers:
i) language layer – it is about the language (or format) of the input, spec-ifies the elements of the language accepted and understood by other layers, it
62 Proceedings of MDISIS 2008
contains and is built upon the conceptual model of abstract entities of NestedVisualization and other entities of the AVS, existence of this layer is importantfor the ability of the AVS to generate the GUI automatically from formalizeddescription (language) (see section 2);ii) visualization methods layer – the set of components implementing the vi-sualization methods from which the resulting GUI can be built (these are ei-ther components or libraries of third parties or components implemented by ourteam); this layer also contains some more abstract entities, their role is to serveas uniform interface to the transformation layer;iii) transformation layer – the engine for creating the GUI from the availablecomponents (from visualization methods layer) according to given input (comingfrom the language layer), this layer can be seen as a core of the visualizationplatform, but of course both other layers embody some elements of the platformtoo.
Fig. 2. The three layers of the AVS
The scheme of the layers is shown on the figure 2. The visualization methodslayer offers the uniform interface across all implemented visualization meth-ods to the transformation layer and transformation layer works with absence ofknowledge above what visualization method is actually working. It means whenimplementing (adding) new visualization method into the AVS, it is necessary towork only within the visualization methods layer. The new visualization methodis wrapped to fit with the interface of transformation layer properly. In a re-sult such decomposition of the visualization service brings saving of time forimplementation and limit the percentage of new bugs.
The duration of the implementation phase is shortened even more. It comesfrom the following concept. A set of methods implementing every particularvisualization component (in sense of component itself, not the implementationinto the visualization service) can be divided into three categories: i) data layer
Proceedings of MDISIS 2008 63
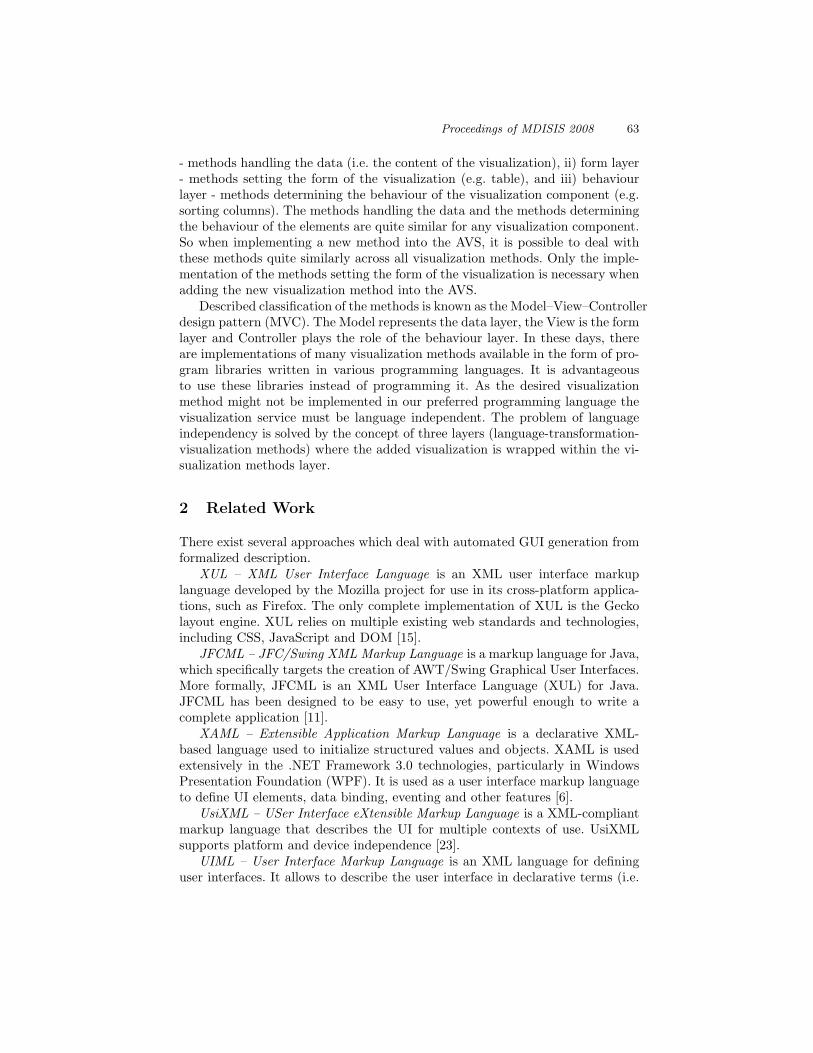
- methods handling the data (i.e. the content of the visualization), ii) form layer- methods setting the form of the visualization (e.g. table), and iii) behaviourlayer - methods determining the behaviour of the visualization component (e.g.sorting columns). The methods handling the data and the methods determiningthe behaviour of the elements are quite similar for any visualization component.So when implementing a new method into the AVS, it is possible to deal withthese methods quite similarly across all visualization methods. Only the imple-mentation of the methods setting the form of the visualization is necessary whenadding the new visualization method into the AVS.
Described classification of the methods is known as the Model–View–Controllerdesign pattern (MVC). The Model represents the data layer, the View is the formlayer and Controller plays the role of the behaviour layer. In these days, thereare implementations of many visualization methods available in the form of pro-gram libraries written in various programming languages. It is advantageousto use these libraries instead of programming it. As the desired visualizationmethod might not be implemented in our preferred programming language thevisualization service must be language independent. The problem of languageindependency is solved by the concept of three layers (language-transformation-visualization methods) where the added visualization is wrapped within the vi-sualization methods layer.
2 Related Work
There exist several approaches which deal with automated GUI generation fromformalized description.
XUL – XML User Interface Language is an XML user interface markuplanguage developed by the Mozilla project for use in its cross-platform applica-tions, such as Firefox. The only complete implementation of XUL is the Geckolayout engine. XUL relies on multiple existing web standards and technologies,including CSS, JavaScript and DOM [15].
JFCML – JFC/Swing XML Markup Language is a markup language for Java,which specifically targets the creation of AWT/Swing Graphical User Interfaces.More formally, JFCML is an XML User Interface Language (XUL) for Java.JFCML has been designed to be easy to use, yet powerful enough to write acomplete application [11].
XAML – Extensible Application Markup Language is a declarative XML-based language used to initialize structured values and objects. XAML is usedextensively in the .NET Framework 3.0 technologies, particularly in WindowsPresentation Foundation (WPF). It is used as a user interface markup languageto define UI elements, data binding, eventing and other features [6].
UsiXML – USer Interface eXtensible Markup Language is a XML-compliantmarkup language that describes the UI for multiple contexts of use. UsiXMLsupports platform and device independence [23].
UIML – User Interface Markup Language is an XML language for defininguser interfaces. It allows to describe the user interface in declarative terms (i.e.
64 Proceedings of MDISIS 2008
as text) and abstract it. Abstraction means that it is not necessary to specifyexactly how the user interface is going to look but what elements are going tobe displayed and their behaviour [18].
Let us have a look at how these approaches are prepared for extension by newvisualization methods.The problem of solutions built on XUL, XAML, JFCMLand UsiXML lies in their non-uniformity. Each GUI element described by itsXML definition has its own XML tag in these solutions. To add a new GUIelement into existing solution requires: i) to add a new tag description to theirDTD – i.e. modification of the language layer, ii) to adapt the interpreter – i.e.transformation layer. Especially point i) is a problem for sustainability and latercompatibility (e.g. when local user defines his own extension of DTD).
UIML is the most promising solution from our point of view. But its drawbacklies in its lack of support for the MVC pattern. Using this approach would requireto implement the whole visualization method from scratch without the possibilityto reuse models and controllers from other visualization methods.
As none of the approaches known to us suits the requirement of easy exten-sionability AVS has been developed.
3 AVS – The Adaptable Visualization Service
AVS is an implementation of a visualization service which meets the requirementof extensibility.
3.1 Architecture
AVS consists of three layers: i) language layer, ii) visualization methods layer iii)transformation layer. The language layer provides an apparatus for a conceptualdescription of GUI, the visualization methods layer provides components fromwhich a GUI can be built and the transformation layer can transform given input(GUI instance description) into the output (instance of GUI).
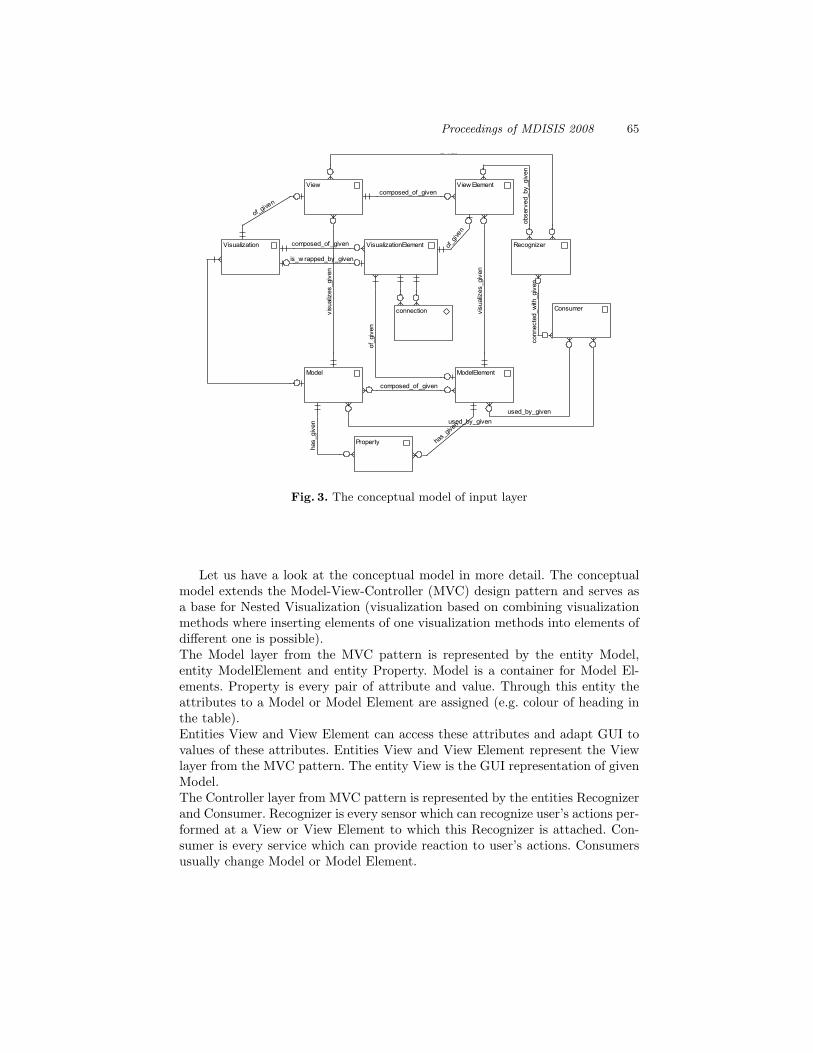
Language Layer: The language layer plays the role of the conceptual back-ground of the whole AVS and it is described by the conceptual model (see Fig. 3- in a Entity-Relationship diagram notation). The entities from the conceptualmodel are also elements of the description language. As it is visible from themodel, they are all on quite high level of abstraction.
This helps to the transformation layer works uniformly with any visualiza-tion method without knowing unnecessary details about it. From this approachthe main advantage of the language layer results- it is not necessary to changethe conceptual model if one wants to add a new visualization method imple-mentation, only a new instance of the existing model entity called Visualizationhas to be inserted (from the viewpoint of the mention layer). This solution issustainable because the structure of the language layer does not change overtime.
Proceedings of MDISIS 2008 65
conn
ecte
d_w
ith_g
iven
has_
given
has_
give
n
of_g
iven
is_w rapped_by_given
used_by_given used_by_given
of_g
iven
obse
rved
_by_
give
n
observed_by_given
of_giv
en
composed_of_given
visu
aliz
es_g
iven
composed_of_given
visu
aliz
es_g
iven
composed_of_given
of_given
connection
Property
Consumer
RecognizerVisualizationElement
ModelElement
View Element
Model
View
Visualization
Fig. 3. The conceptual model of input layer
Let us have a look at the conceptual model in more detail. The conceptualmodel extends the Model-View-Controller (MVC) design pattern and serves asa base for Nested Visualization (visualization based on combining visualizationmethods where inserting elements of one visualization methods into elements ofdifferent one is possible).The Model layer from the MVC pattern is represented by the entity Model,entity ModelElement and entity Property. Model is a container for Model El-ements. Property is every pair of attribute and value. Through this entity theattributes to a Model or Model Element are assigned (e.g. colour of heading inthe table).Entities View and View Element can access these attributes and adapt GUI tovalues of these attributes. Entities View and View Element represent the Viewlayer from the MVC pattern. The entity View is the GUI representation of givenModel.The Controller layer from MVC pattern is represented by the entities Recognizerand Consumer. Recognizer is every sensor which can recognize user’s actions per-formed at a View or View Element to which this Recognizer is attached. Con-sumer is every service which can provide reaction to user’s actions. Consumersusually change Model or Model Element.
66 Proceedings of MDISIS 2008
The extension of the MVC pattern lays in entities Visualization, Visualiza-tionElement, Connection and their relationships. Any visualization consists ofthe elements (e.g. the form contains labels and cells) and in the conceptual modelreader can see the relationship between entities Visualization and VisualizationElement with semantics: Visualization is composed of given Visualisation Ele-ments. But even more important is the relationship between these two entitieswith semantics: Visualization is wrapped by given Visualization Element. Thispart of the model brings the ability of the AVS to visualize by Nested Visualiza-tion approach. Any visualization has to have its model and view. These facts arealso mirrored in the conceptual model too. There can be created various con-nections between Visualization Elements (for example like connection betweengraph edge and its source and target nodes, between table row and its cells).
Visualization Methods Layer: Visualization methods layer is a set of com-ponents that implements various visualization methods.
Every implementation of any visualization method consist of components(Visualization Method, Model, View, Visualization Method Element, etc.) Thesehave their counterparts in entities of the conceptual model in the languagelayer. By the implementation of the visualization method (adding a new vi-sualization method) there also has to be implemented a simple interface. Thisinterface provides functionality used for GUI building and controlling by thetransformation layer. This functionality provides dynamics to the static struc-ture which is expressed in the conceptual model of the language layer. All thefunctionality does not have to be described here but we can present an ex-ample: every implementation of any visualization method has its VisualizationMethod component and this must implement addVisualizationMethodElementand removeVisualizationMethodElement functions. These functions providethe ability to change the set of Visualization Method Elements in given Visu-alization Method. Thus the content of the output can be changed dynamicallyand can be adapted to actual demands.
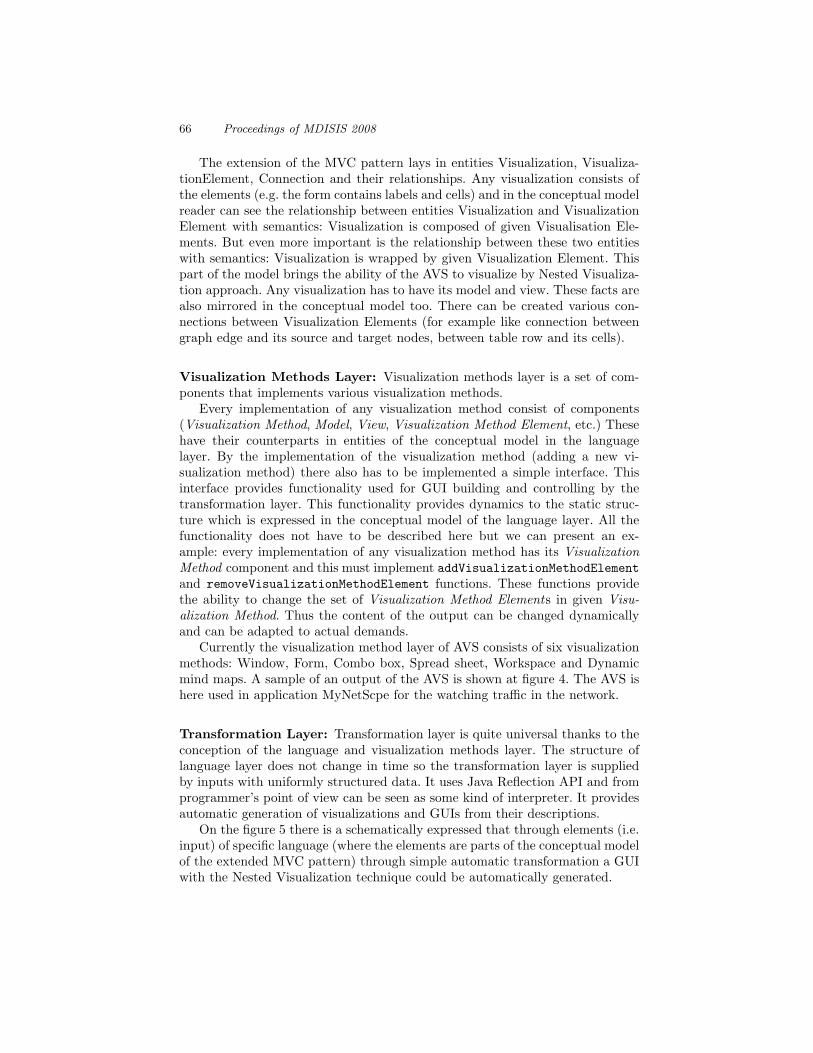
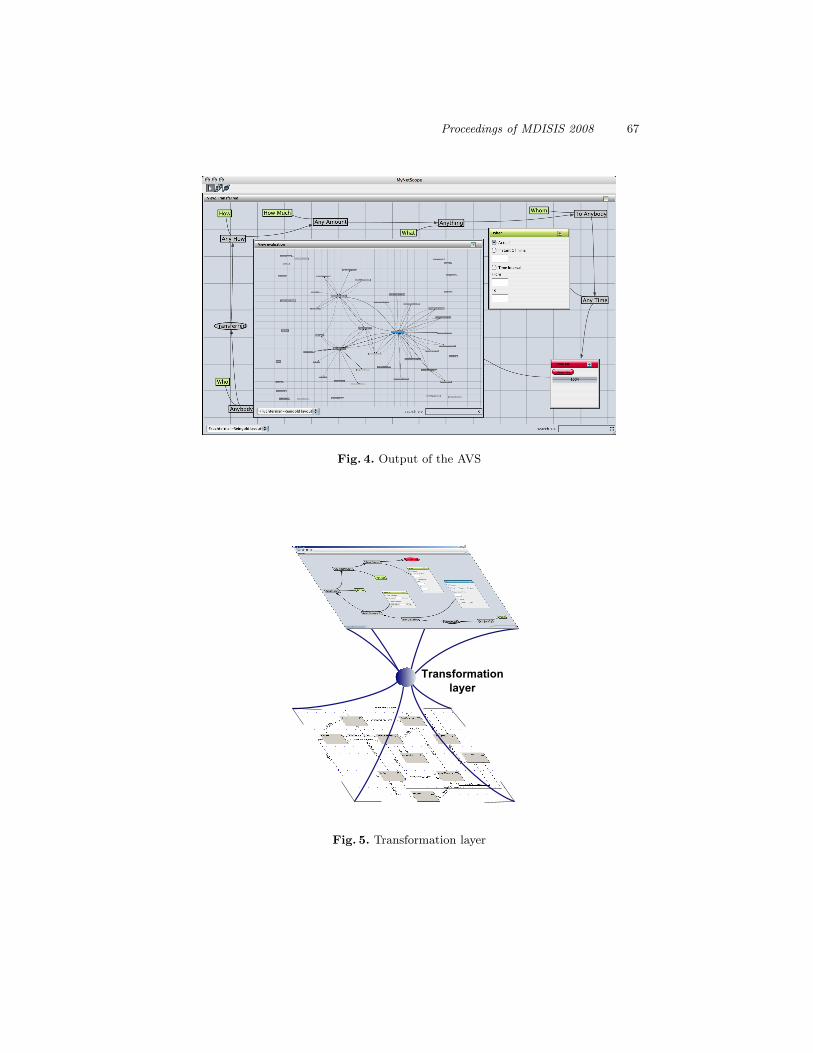
Currently the visualization method layer of AVS consists of six visualizationmethods: Window, Form, Combo box, Spread sheet, Workspace and Dynamicmind maps. A sample of an output of the AVS is shown at figure 4. The AVS ishere used in application MyNetScpe for the watching traffic in the network.
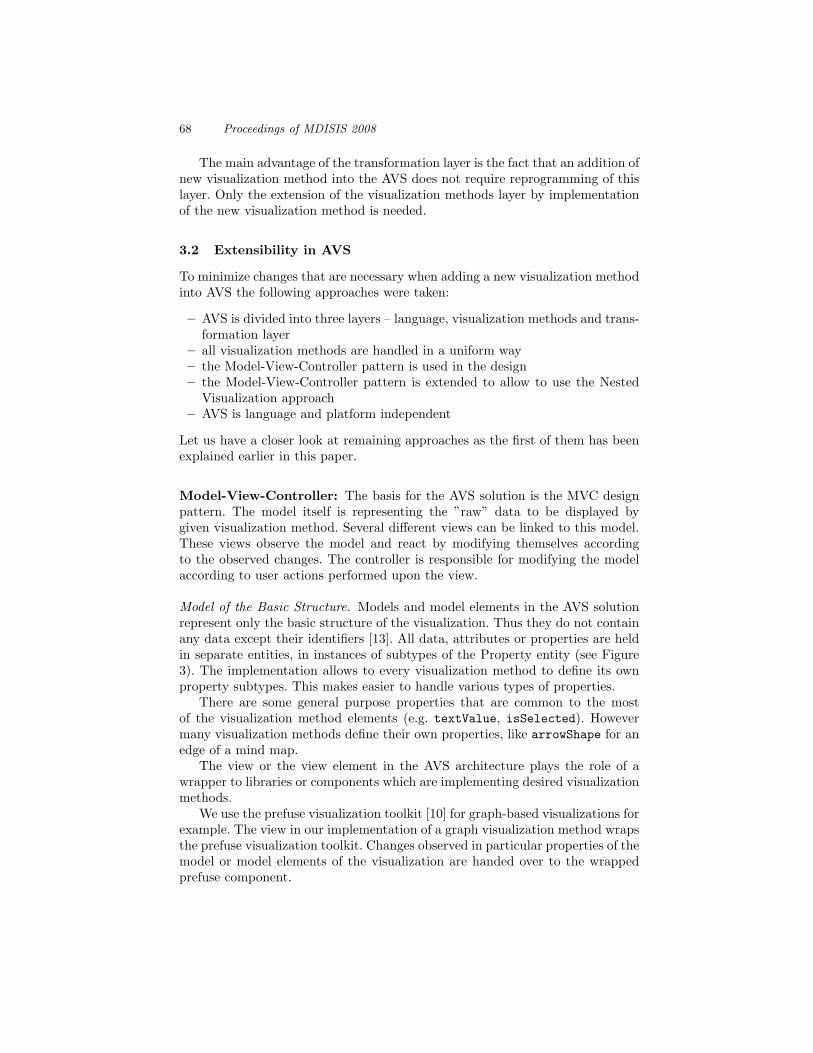
Transformation Layer: Transformation layer is quite universal thanks to theconception of the language and visualization methods layer. The structure oflanguage layer does not change in time so the transformation layer is suppliedby inputs with uniformly structured data. It uses Java Reflection API and fromprogrammer’s point of view can be seen as some kind of interpreter. It providesautomatic generation of visualizations and GUIs from their descriptions.
On the figure 5 there is a schematically expressed that through elements (i.e.input) of specific language (where the elements are parts of the conceptual modelof the extended MVC pattern) through simple automatic transformation a GUIwith the Nested Visualization technique could be automatically generated.
Proceedings of MDISIS 2008 67
Fig. 4. Output of the AVS
Fig. 5. Transformation layer
68 Proceedings of MDISIS 2008
The main advantage of the transformation layer is the fact that an addition ofnew visualization method into the AVS does not require reprogramming of thislayer. Only the extension of the visualization methods layer by implementationof the new visualization method is needed.
3.2 Extensibility in AVS
To minimize changes that are necessary when adding a new visualization methodinto AVS the following approaches were taken:
– AVS is divided into three layers – language, visualization methods and trans-formation layer
– all visualization methods are handled in a uniform way– the Model-View-Controller pattern is used in the design– the Model-View-Controller pattern is extended to allow to use the Nested
Visualization approach– AVS is language and platform independent
Let us have a closer look at remaining approaches as the first of them has beenexplained earlier in this paper.
Model-View-Controller: The basis for the AVS solution is the MVC designpattern. The model itself is representing the ”raw” data to be displayed bygiven visualization method. Several different views can be linked to this model.These views observe the model and react by modifying themselves accordingto the observed changes. The controller is responsible for modifying the modelaccording to user actions performed upon the view.
Model of the Basic Structure. Models and model elements in the AVS solutionrepresent only the basic structure of the visualization. Thus they do not containany data except their identifiers [13]. All data, attributes or properties are heldin separate entities, in instances of subtypes of the Property entity (see Figure3). The implementation allows to every visualization method to define its ownproperty subtypes. This makes easier to handle various types of properties.
There are some general purpose properties that are common to the mostof the visualization method elements (e.g. textValue, isSelected). Howevermany visualization methods define their own properties, like arrowShape for anedge of a mind map.
The view or the view element in the AVS architecture plays the role of awrapper to libraries or components which are implementing desired visualizationmethods.
We use the prefuse visualization toolkit [10] for graph-based visualizations forexample. The view in our implementation of a graph visualization method wrapsthe prefuse visualization toolkit. Changes observed in particular properties of themodel or model elements of the visualization are handed over to the wrappedprefuse component.
Proceedings of MDISIS 2008 69
Adjustable View. A major criticism of the MVC design pattern aims at itsinability to influence the view. There is no way how to set the properties of theview (e.g. colour, shape, etc.) by the model. One of the modifications of theMVC pattern that deals with this problem is the model-view-presenter (MVP)design pattern. It allows the presenter layer to modify just those properties ofthe view that the synchronization between model and view can not satisfy [9].
Our approach uses the concept of model or model element properties andtheir subtypes to tackle the problem of mentioning and changing the view. Ev-ery property of the visualization method that we wish to mention, i.e. allow thecaller of our visualization service to modify it, has to be declared as a property(subtype) of the model or model element of the visualization method. An exam-ple could be the colour or width of an edge representing data flow in our networksecurity monitoring application.
Thus we use the concept of model or model element properties to store dataof the model as well as details about the visualization.
Controller – Recognizers and Consumers. We have extended the concept of thecontroller in several aspects. In classical MVC the controller is called as a reactionto events from the UI controls. The action to be performed is then hard-codedin the the controller code. The reaction to a UI event (mouse click, key hit)is hard-wired with firing the demanded application logic event. To change suchbehaviour means to rewrite the code of the controller.
AVS solution separates these categories of events. Recognizers implementlisteners to low-level UI events – mouse clicks, keyboard shortcuts. They produceapplication logic events that are handed over to consumers registered to consumethe kind of events produced by the recognizers they are registered with. Onlyconsumers are allowed to change the properties of the underlying model or modelelements. A recognizer can listen to several UI (low-level) event producers. Aconsumer can listen to several recognizers and one recognizer can supply severalconsumers with application logic (high-level) events. A consumer can modifyseveral models or model elements properties.
This separation allows us to have a set of recognizers which can be rehangto different UI event sources without modifying a single line of code. Similarlyconsumers can be reconnected to alternate recognizers upon a command fromthe server. Supposed the required and necessary recognizers and consumers areimplemented, we can change the behaviour of the user interface programmati-cally.
One of the situations that can be handled by this solution is the adjustmentof the UI to user preferences for example. There can be several recognizers of anapplication-level action each one of them reacting to different UI actions. Oneof the recognizers listens to mouse clicks another one to keyboard shortcuts etc.So user preferences can be saved simply by storing only the connections betweenappropriate view (elements), recognizers and consumers. And by altering justthese connections of the mention form preferences can be modified.
70 Proceedings of MDISIS 2008
Uniformity: The possibility of uniform handling of visualizations and theirindividual elements makes AVS open to new visualization methods which will berequired in future. Although it is easy to implement a new visualization methodor its elements into AVS (similarly with removing). For each visualization a setof methods is implemented which is the same for every single visualization. Themethods have the same interface across different visualizations. It makes theAVS modular and that is why services of AVS can be provided with differentcomplexity depending on requirements of a user.
Language Independency: The transformation layer is written in Java. Asit was mentioned in Section 3.2 the view or the view element plays the role ofa wrapper. This wrapper can use the Java Native Interface to provide accessto non-Java components. These wrappers encapsulate individual visualizationmethods or libraries. Thus using a concept of such wrappers makes the AVSlanguage independent.
4 Conclusions and Future Work
Our work presents the Adaptable Visualization Service (AVS). The AVS is a partof a system that provides support in the field of network security. Requirementson such a system change very dynamically and particularly on its visualizationservice. First the type of information to be visualized is changing. Second alsorequirements on the visualization methods used to render given type of informa-tion can change in time. To minimize changes that are necessary when addinga new visualization method into AVS the following steps were taken: AVS isdivided into three layers – language, visualization methods and transformationlayer. All visualization methods are handled in a uniform way. The Model-View-Controller pattern is extended and used in the design. AVS is language andplatform independent.
At the time of this writing, the first preliminary version of the completesystem is being integrated and the whole system is still under development.The data used for system testing are acquired on Masaryk University network,connected to the Czech national educational network (CESNET). In our futurework we will extend the set of provided visualization method implementations.Another direction of development is to extend the architecture by a rendererlayer providing many visual features independently on particular visualizationmethod implementation. These visual features will make the whole visualizationmore effective. The work is a part of a stream going to modelable and executableservice systems with elements of artificial intelligence which is called Knowledgeand Information Robots [20] based on principles of universal modelling and soft-ware construction [19].
References
1. Baxley, B.: Universal model of a user interface. In: DUX ’03 Conference on Designingfor user experiences, pp. 1–14. ACM, New York, NY, USA (2003)
Proceedings of MDISIS 2008 71
2. Burkhard, R.A.: Towards a framework and a model for knowledge visualization:Synergies between information and knowledge visualization. Knowledge and Infor-mation Visualization 3426, 238–255 (2005)
3. Eppler, M.J., Burkhard, R.A.: A framework for the visual representation of knowl-edge. In: Multi-Conference Wirtschaftsinformatik, Passau, Germany (2006)
5. Lengler, R., Eppler, M.: Towards a periodic table of visualization methods formanagement. In: IASTED Conference on Graphics and Visualization in Engineer-ing (GVE 2007), Clearwater, Florida, USA (2007)
6. MacDonald, M.: Pro WPF. Apress, (2007)7. Molina P.J.: User interface generation with olivanova model execution system. In:
IUI ’04 9th international conference on Intelligent user interfaces, pp. 358–359. ACM,New York, NY, USA (2004)
8. Ruby on Rails, http://www.rubyonrails.org/9. Fowler, M.: GUI Architectures, http://martinfowler.com/eaaDev/uiArchs.html10. The Prefuse Visualization Toolkit, http://www.prefuse.org11. JFCML - JFC/Swing XML Markup Language, http://jfcml.sourceforge.net/12. Oskera, M.: Alternativnı zpusob reprezentace dat k objektovemu prıstupu. Mas-
ter’s thesis, Masarykova univerzita, Brno (2006)13. Oskera, M.: Vztahove orientovane uloziste. In: DATAKON 2006, Brno (2006)14. Pettersson, M.: Designing the user interface on top of a conceptual model. In: CAiSe
’95 7th International Conference on Advanced Information Systems Engineering, pp.231–242. Springer-Verlag, London, UK (1995)
15. Quiroz, J.C., Louis, S.J., Dascalu, S.M.: Interactive evolution of xul user interfaces.In: GECCO ’07 the 9th annual conference on Genetic and evolutionary computation,pp. 2151–2158. ACM, New York, NY, USA (2007)
16. Rehak, M., Pechoucek, M., Celeda, P., Krmıcek, V., Moninec, J., Dymacek, T.,Medvigy, D.: High-performance agent system for intrusion detection in backbonenetworks. Cooperative Information Agents XI 4676, 134–148 (2007)
17. Santini, S.: Notes for the conceptual design of interfaces. Conceptual Modelling –ER 2006 4215, 413–423 (2006)
18. Phanouriou, C.: Uiml: a device-independent user interface markup language. PhDthesis, Virginia Polytechnic Institute and State University (2000)
19. Stanıcek, Z.: Univerzalnı modelovanı a konstrukce IS. PhD thesis, Masaryk Uni-versity, Brno (2003)
20. Prochazka, F.: Universal Information Robots a way to the effective utilisation ofcyberspace. PhD thesis, Masaryk University, Brno (2006)
21. Terwilliger, J.F., Delcambre, L.M.L., Logan, J.: The user interface is the conceptualmodel. Conceptual Modelling – ER 2006 4215, 424–436 (2006)
22. Veit, M., Herrmann, S.: Model-view-controller and object teams: a perfect matchof paradigms. In: AOSD ’03 2nd international conference on Aspect-oriented softwaredevelopment, pp. 140–149. ACM, New York, NY, USA (2003)
23. Masso, J.P.M., Vanderdonckt, J., Simarro, F.M., Lopez, P.G.: Towards virtualiza-tion of user interfaces based on UsiXML. In: Web3D ’05 10th international conferenceon 3D Web technology, pp. 169–178. ACM, New York, NY, USA (2005)