Page 1
Adaptive Control of Virtualized Resources in Utility Computing Environments
HP Labs: Xiaoyun Zhu, Mustafa Uysal, Zhikui Wang, Sharad Singhal University of Waterloo: Kenneth Salem
Pradeep Padala, Kang G. ShinUniversity of Michigan
Page 2
2
A typical scenario in data centers
Customer A
Shared Data Center
Run auction site Run news site
Customer B
Requirements
Response time < 2s
Throughput > 100 rq/sec
Pay 100$
Requirements
Response time < 5s
Throughput > 50 rq/sec
Pay 50$
Page 3
3
Hosting applications
Data Center
E-mail serverLinux
Web serverLinux
Database serverLinux
Common idiom: One-to-one mapping of applications to nodes
Page 4
4
0
1
2
3
4
5
Time
Num
ber
of CPU
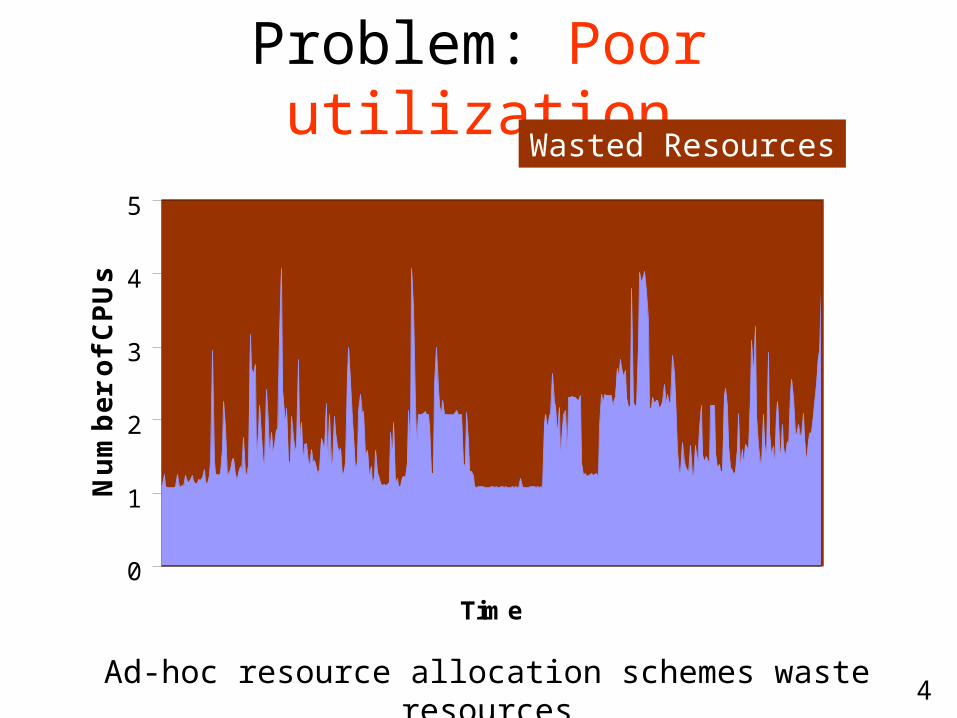
sProblem: Poor utilization
Wasted Resources
Ad-hoc resource allocation schemes waste resources
Page 5
5
Solution: Virtual data center
Consolidate
E-mail serverLinux
Web serverLinux
Database serverLinux
Virtualization
(Xen, OpenVZ, VMware)
E-mail serverLinux
Web serverLinux
Database serverLinux
Improved utilization using consolidation
Page 6
6
0
1
2
3
4
5
Time
Num
ber
of CPU
sProblem: Provisioning
Average
Peak
Wasted ResourcesBursty Load Bad response time
Provisioning for dynamic workloads is hard!
Solution: Adaptive controller
Page 7
7
Goals
• Good utilization
• Good performance
• QoS differentiation
Average CPU utilization = 80%
Average response time = 100ms
Gold vs. Silver customers
2:1 resources
Page 8
8
Outline
• Motivation
• Background
• Modeling
• Design
• Evaluation
• Conclusion
Page 9
9
How do we provision the customers ?
Virtualized Server I Virtualized Server II
VM I
VM II
VM III
VM IV
Web Server I
DB Server I
Web Server II
DB Server II
Auction Client
News Client
Customer A
Customer B
Page 10
10
What are we controlling ?
Xen scheduler
VM I
VM II
ControllerCPU Usage ?
Goals• Good performance• Good utilization• QoS differentiation
Goals met ? NO
Virtualized Server
MechanismPolicy
50%
50%
80%
20%
Set CPU shares
Page 11
11
Related work
• Existing research– Cluster management – Load balancing– Resource allocation & scheduling– QoS differentiation
• Our contribution: Adaptive resource control – Quantitative model of system behavior– Fine-grained, adaptive control
• No wastage of resources• High throughput, low response time• QoS differentiation
Page 12
12
How do we design an adaptive resource controller?
Model
Design
Experiment
Evaluate
Understand system variables
Input Output
Design controller
PI, PID, I controller …
Stress the controller
Goals met ?
A control theoretic approach to systems
Page 13
13
Outline
• Motivation
• Background
• Modeling
• Design
• Evaluation
• Conclusion
Page 14
14
QoS differentiation
Modeling a virtual data center
VM Shares
Workload
Virtualized Server I Virtualized Server II
Web server I
DB server I
Web server II
DB server
II
How to differentiate between two multi-tiered systems ?
VM utilization
Response time
Throughput
Page 15
15
0
10
20
30
40
50
60
70
80
90
30 40 50 60 70
WWW I share
Rati
o
Response time ratio Loss ratio
Modeling two multi-tiered systemsQoS metric
Linear
Response time ratio is more controllable than loss ratio
Non-Linear
Page 16
16
Outline
• Motivation
• Background
• Modeling
• Design
• Evaluation
• Conclusion
Page 17
17
Utilization controller: an example
Solution: Self-tuning integral controller
Set to 40%
Using 20%
Controller
Utilization 20/40*100 = 50%
Utilization
goal = 80%
Set to 25%
New Utilization 20/25*100 = 80%
• Problems– Utilization is variable– Delays and errors in sensing & setting– Stability concerns
VM
Page 18
18
• Adjusts to varying demand• Maintains goal utilization• Knobs to control aggression (Kp)• Proven stable [Wang DSOM’05]
Utilization controller
)1()()1()( kekKkuku i
System
Utilization goal
Self-tuning controller
--
Workload
Error in utilization
e(k-1)
Measuredutilization u(k-1)
CPU allocation u(k)
Page 19
19
Let there be controllers
Container
consumptions Problem: All controllers independent
Want 40%
Want 70%
110% Can’t fit
(Saturation)
Solution: Arbiter controller enforcing QoS differentiation
UtilControl for WS I
Virtualized Server I
UtilControl for WS II
UtilControl for DB I
Virtualized Server II
UtilControl for DB II
Page 20
20
Final controller
Arbiter Controller
Requested CPU shares
Desired response time ratio
Final CPU
shares
UtilControl for WS I
Virtualized Server I
UtilControl for WS II
UtilControl for DB I
Virtualized Server II
UtilControl for DB II
Container
consumptions
Page 21
21
Outline
• Motivation
• Background
• Modeling
• Design
• Evaluation
• Conclusion
Page 22
22
Evaluation
• Multi-tiered systems– 2 HP Proliant servers– Apache + MySQL– Xen 3.0 with SEDF scheduler
• Clients– RUBiS: auction client– 2 RUBiS clients: 500 … 1000 threads
• Can we maintain 70% QoS ratio ?
Page 23
23
Varying load - throughput
0
40
80
120
160
200
0 20 40 60 80 100
Sample point (every 10secs)
Th
rou
gh
pu
t (r
eq
s/s
ec
) Client I Client II
500 threads
1000 threads
Page 24
24
0
10
20
30
40
50
60
70
6 26
Sample point (every 10 secs)
% o
f C
PU
Web I consumption Web I share
SaturationWeb I share
0
10
20
30
40
50
60
70
80
90
6 26Sample point (every 10 secs)
% o
f C
PU
Web II consumption Web II share
Web II share
Saturation
0
10
20
30
40
50
60
70
80
90
0 20 40 60 80 100
Sample point (every 10 secs)
% o
f C
PU
Web I consumption Web I shareWeb II consumption Web II share
Varying load - control
Buffer to maintain good performance
Penalized to maintain QoS ratio
Saturation
Page 25
25
0102030405060708090
0 20 40 60 80Sample point (10 secs)
Res
pons
e tim
e ra
tio
Controller No Controller
Varying load – QoS ratio
Goal
Goal ratio of 70% maintained!
Page 26
26
Conclusion• Adaptive control of virtual data center
– Good application performance• High throughput• Low response time
– Good utilization• Maintain goal CPU utilization
– QoS differentiation• Maintain goal QoS ratio
• Project page: http://kabru.eecs.umich.edu/twiki/bin/view/Main/DynamicControl
• E-mail: [email protected]
• Questions ?
Page 27
27
Backup and old slides
Page 28
28
Enterprise data centers
• Large data centers – 100s/1000s of nodes– Shared infrastructure– Run critical applications– Should meet service levels
• Problems– Power costs– Management costs– Poor utilization– Unmet service levels
Page 29
29
Solution: Consolidate !
Page 30
30
Virtualized Server IIVirtualized Server I
Customer B
Hosting two multi-tiered systems
Web Server I
Web Server II
DB Server I
DB Server II
Customer A
Auction Client
News Client
Web Server I
Web Server II
DB Server I
DB Server II
Page 31
31
Varying load
Time
Workload II
Workload I
500 clients
1000 clients
Page 32
32
0
10
20
30
40
50
60
70
6 26
Sample point (every 10 secs)
% o
f C
PU
Web I consumption Web I share
SaturationWeb I share
Page 33
33
0
10
20
30
40
50
60
70
80
90
6 26Sample point (every 10 secs)
% o
f C
PU
Web II consumption Web II share
Web II share
Saturation
Page 34
34
0
50
100
150
200
250
20 30 40 50 60 70
Web share
Thro
ughput (r
eqs/sec)
Offeredload (500)
Realthroughput(500)Offeredload (1100)
Realthroughput(1100)
Modeling results - throughputDom0 effect
Saturation causes Real throughput < Offered throughput
Web share Throughput
Page 35
35
Arbiter controller features
• Is an integral controller
• Decides final shares based on QoS differentiation goals
• Integral gain: knobs for aggression
• Stable – gain value based on model
Page 36
36
Modeling a multi-tiered system
Workload
Web share
DB share
Web usage
DB usage
QoS metrics
• Stress the system in various scenarios• Observe all variables
Web server
DB server
Virtual Server
Page 37
37
Modeling results – response time
0
1000
2000
3000
4000
5000
6000
20 30 40 50 60 70
Web share
Re
sp
ns
e t
ime
(m
s)
500 Clients 1100 Clients
Dom0 effect
Web share Response time