35
Adaptive seamless phase II/III study in gastric cancer (orphan condition) 25-June-2015

Adaptive seamless phase II/III study in gastric cancer (orphan condition)
25-June-2015
2
Acknowledgement
• The GATSBY seamless phase II/III study been initiated and guided by Dr. Michael Budde from the Biostatistics Department at F. Hoffmann-La Roche
• Maximo Carreras (F. Hoffmann-La Roche) been the statistician involved with the study planning (including extensive data simulations) to write his PhD in collaboration with Prof. Dr. Werner Brannath from the University of Bremen

3
Control Control
Data Planning Group 1 analysis Phase III Group 1
Group 2
Phase II End of Phase III
Traditional Phase II + Phase III trials
Development Time
Control
Group 1
Group 2
Phase II End of Phase III
Seamless Adaptive Phase II/III trials
Seamless Adaptive Phase II/III
4
GATSBY Study
• Patients with locally advanced or metastatic HER2-positive gastric cancer, second-line treatment
• Patients randomized 2:2:1 ratio to Trastuzumab emtansine3.6 mg/kg (q3w), Trastuzumab emtansine 2.4 mg/kg (qw) or control
• Primary endpoint: Overall Survival
• Median time to OS assumed 6 months in control and 9 months in both treatment groups (HR=0.67)

5
Population:2L HER2+ AGCPrior chemo ±prior HER2 txPS 0-1
Total n=412(Stage 1 + 2)
* Regimen selection based on PK, efficacy and safety**Stage 1 (Stage 2) patients consist of all patients recruited before (after) the regimen selection decision
Randomization:Stage 1: 3 Arm; 2:2:1 ratioStage 2: 2 Arm; 2:1 ratio
Stage 1**
n ≈ 70
iDMC Interim Regimen Selection Analysis
X
T-DM13.6 mg/kg q3 wk
T-DM12.4 mg/kg/wk
Chemotherapy (Physician’s Choice)
Paclitaxel 80 mg/m2/wk orDocetaxel 75 mg/m2 q3 wk
Stage 2**
T-DM1selected regimen*
n ≈ 158
n ≈ 79
GATSBY Study
n ≈ 70
n ≈ 35

6
GATSBY Study
• Clinical cut-off for dose selection by an iDMC, after 100 patients across all three arms treated for a minimum of 12 weeks
• Accrual continues into all 3 treatment arms until dose selection. All patients randomized before the selection considered “stage 1 patients”
• After the selection remaining patients recruited into the selected T-DM1 arm and the control in a 2:1 ratio
• Case of delay for group selection -> more patients in stage 1 and less in stage 2
7
GATSBY Study
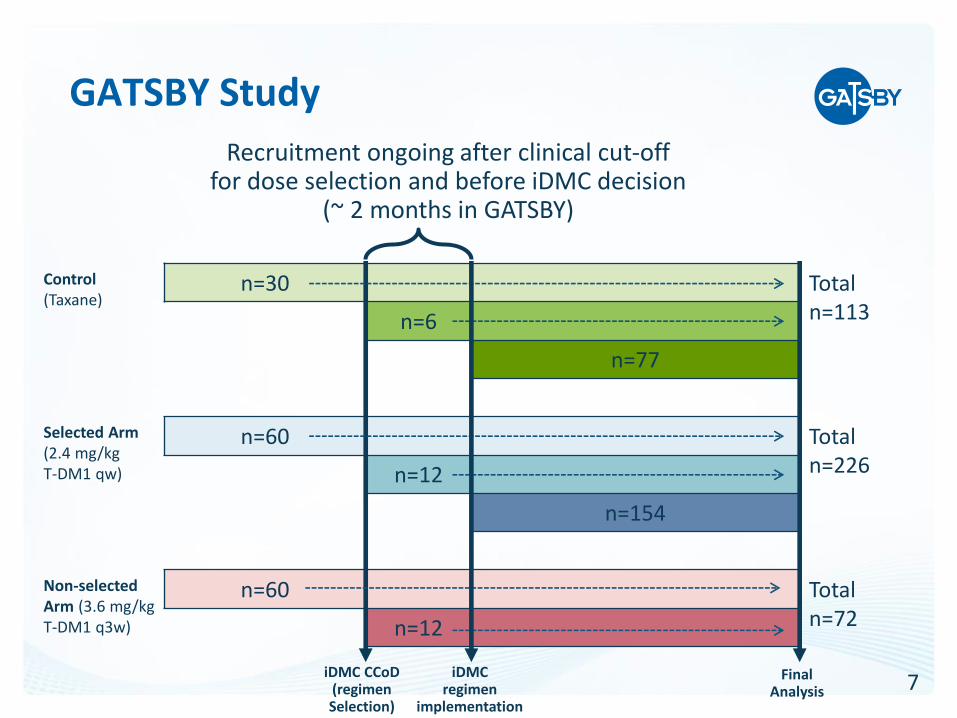
Recruitment ongoing after clinical cut-off for dose selection and before iDMC decision
(~ 2 months in GATSBY)
Control(Taxane)
n=30 Totaln=113n=6
n=77
Selected Arm(2.4 mg/kgT-DM1 qw)
n=60 Total n=226n=12
n=154
Non-selectedArm (3.6 mg/kgT-DM1 q3w)
n=60 Total n=72n=12
iDMCregimen
implementation
Final Analysis
iDMC CCoD(regimenSelection)

8
GATSBY Study Timelines
2012Q3
Clinical cut-offMain efficacy
analysis
100 patients randomized +
12 weeks follow-up
Regimen selectiondecision
for stage 2
2013Q4
Stage 2 patient enrollment
started
2015
~9 months ~5 months
2014Q1
Clinical cut-off Futility Analysis
(After ~ 68events)
x months
* Recruitment continues during this period
2013Q3
~2 Months*
FPI Stage 1

9
Dose Selection by iDMC
• Guidance needed within the iDMC charter to be elaborated enough so that iDMC can make appropriate recommendations (decision to some extent with iDMC and not the sponsor)
• In GATSBY all available safety, PK, and efficacy data were provided to be used by the iDMC to make their recommendation on which trastuzumab emtansineregimen should be selected
• For sample size calculations a simulated regimen selection analysis was performed based on cut-off values for specific safety, PK and efficacy parameters (considered as good surrogates for the totality of the data)

10
Dose Selection by iDMC

11
Operational Aspects
• Sites selected with high recruitment at start of stage 1 (need of sufficient data within short time)
• SMT to provide clean data within short timelines (#patients recruited after clinical cut-off but before iDMC decision to be as small as possible)
• Change in randomization to be set-up and performed right after dose selection
• After dose selection, all patients to continue treatment/ follow-up as before (including non-selected arm)
• Needed understanding by investigators and health authorities about staying blinded to the interim data the dose decision is based on

12
FDA draft Guidance for Industry (2010)
• FDA definition of adaptive design clinical study: “a study that includes a prospectively planned opportunity for modification of one or more specified aspects of the study design and hypotheses based on analysis of data (usually interim data) from subjects in the study”
• Chief concerns “are control of the study-wide Type I error rate, minimization of the impact of any adaptation-associated statistical or operational bias on the estimates of treatment effects, and the interpretability of trial results”
• “less well understood”* design/methods “are primarily intended for circumstances where the primary study objective(s) cannot be achieved by other study designs”
* Any design involving interim review of unblinded efficacy data, beside group sequential analyses

13
Statistical Method Controls Type I ErrorStage 1 Part
• Stage 1 consists of patients recruited before dose selection (two arms and control group)
• For final analysis, after pre-specified number events, in a first step p-value calculated for stage 1 patients
• Although interest in testing selected arm to control – as per Health Authorities main concern on type I error, here we need to account for multiplicity!
• Due to available and valid follow-up of patients in the non-selected arm – this data can be used for inclusion to the final testing procedure
14
Patients in Non-selected Arm
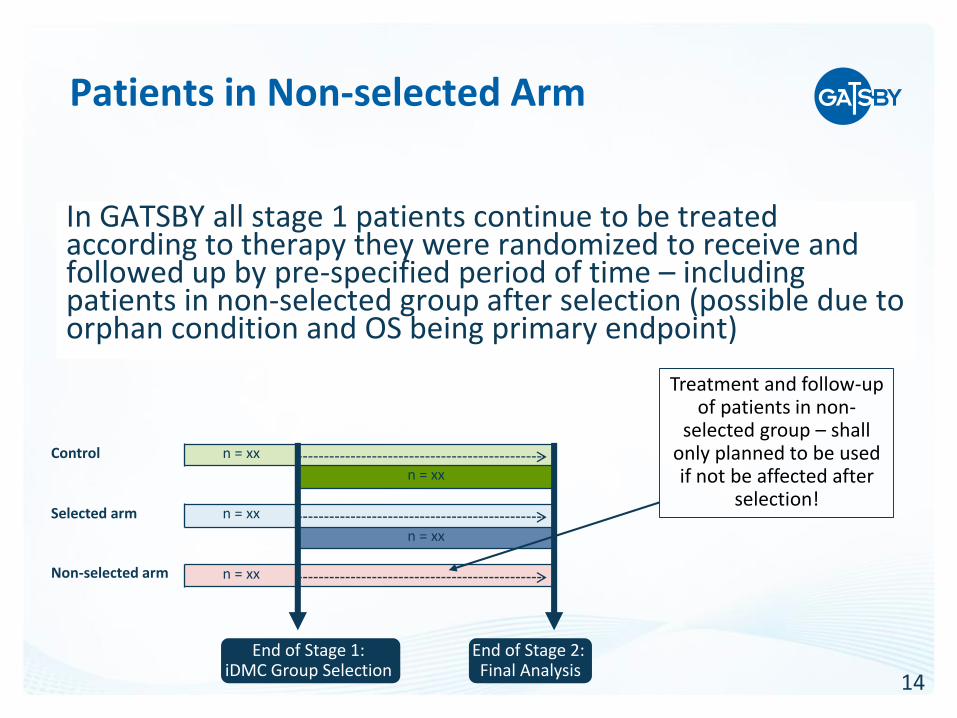
Treatment and follow-up of patients in non-
selected group – shall only planned to be used if not be affected after
selection!
In GATSBY all stage 1 patients continue to be treated according to therapy they were randomized to receive and followed up by pre-specified period of time – including patients in non-selected group after selection (possible due to orphan condition and OS being primary endpoint)
Control n = xx
n = xx
Selected arm n = xx
n = xx
Non-selected arm n = xx
End of Stage 1: iDMC Group Selection
End of Stage 2: Final Analysis

15
Statistical Method Controls Type I ErrorStage 1 Part (Hochberg Correction)
Selected arm p-value > Non-selected arm p-value?
Stage 1 p-value =Max(2*non-selected arm p-value,
selected arm p-value)
Stage 1 p-value =2*selected arm
p-value
Stage 1 p-value =Non-selected arm
p-value
Yes
No
2*selected arm p-value > Non-selected arm p-value?
No Yes

16
Statistical Method Controls Type I ErrorP-value derivation: Stage 1 and 2
• Stage 2 consists of patients recruited after dose selection (only selected arm and control group)
• P-value for stage 2 patients is calculated and combined with stage 1 p-value - similar to combination of p-values in meta analysis
• Basic Assumption: Test statistics of stage 1 and stage 2 are independent (p-values uniformaly distributed under null hypothesis)
• Regards the basic assumption (Jenkins et al, 2011): It is not permissible for stage 1 follow-up to be affected by the stage 2 design
17
Statistical Method Controls Type I ErrorP-value derivation: Stage 1 and 2
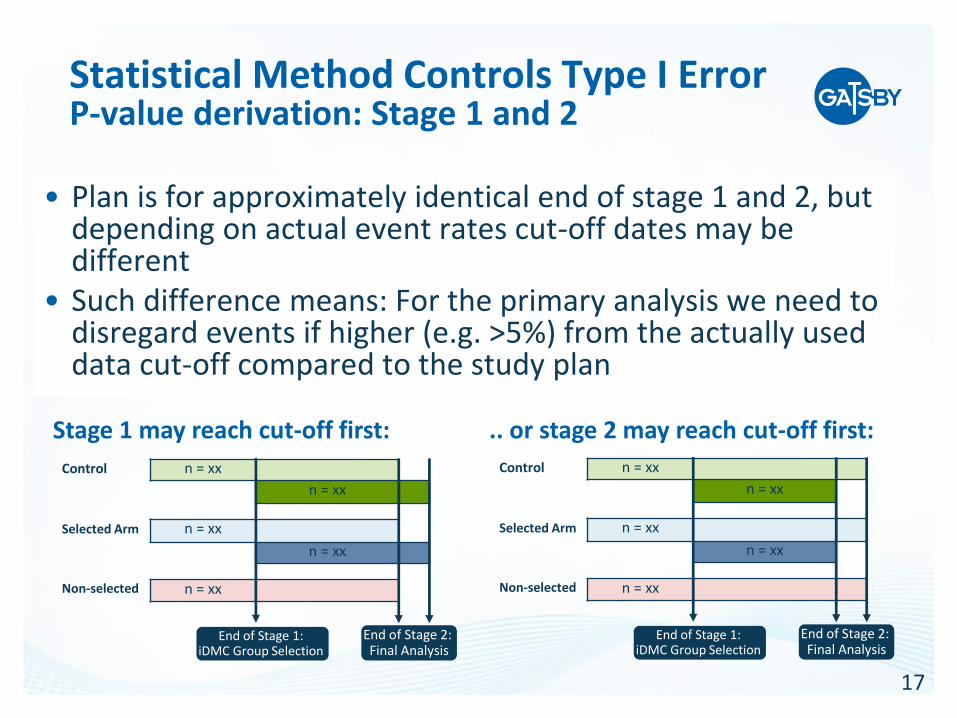
• Plan is for approximately identical end of stage 1 and 2, but depending on actual event rates cut-off dates may be different
• Such difference means: For the primary analysis we need to disregard events if higher (e.g. >5%) from the actually used data cut-off compared to the study plan
.. or stage 2 may reach cut-off first: Stage 1 may reach cut-off first:
Control n = xx
n = xx
Selected Arm n = xx
n = xx
Non-selected n = xx
End of Stage 1: iDMC Group Selection
End of Stage 2: Final Analysis
Control n = xx
n = xx
Selected Arm n = xx
n = xx
Non-selected n = xx
End of Stage 1: iDMC Group Selection
End of Stage 2: Final Analysis
18
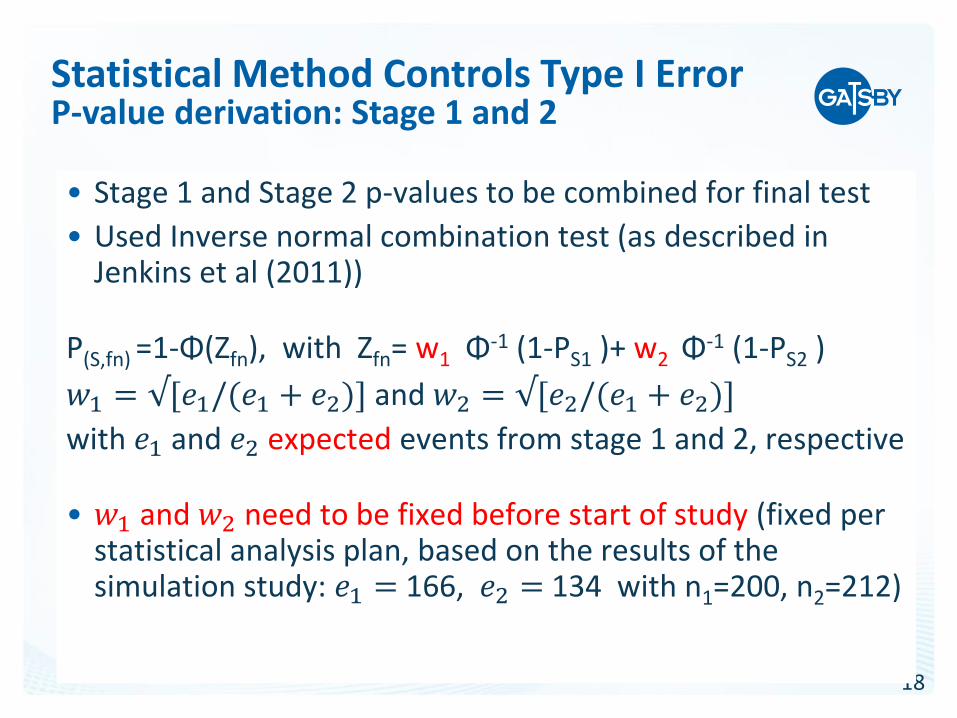
• Stage 1 and Stage 2 p-values to be combined for final test
• Used Inverse normal combination test (as described in Jenkins et al (2011))
P(S,fn) =1-Φ(Zfn), with Zfn= w1 Φ-1 (1-PS1 )+ w2 Φ-1 (1-PS2 )
𝑤1 = √[𝑒1/(𝑒1 + 𝑒2)] and 𝑤2 = √[𝑒2/(𝑒1 + 𝑒2)]
with 𝑒1 and 𝑒2 expected events from stage 1 and 2, respective
• 𝑤1 and 𝑤2 need to be fixed before start of study (fixed per statistical analysis plan, based on the results of the simulation study: 𝑒1 = 166, 𝑒2 = 134 with n1=200, n2=212)
Statistical Method Controls Type I ErrorP-value derivation: Stage 1 and 2
19
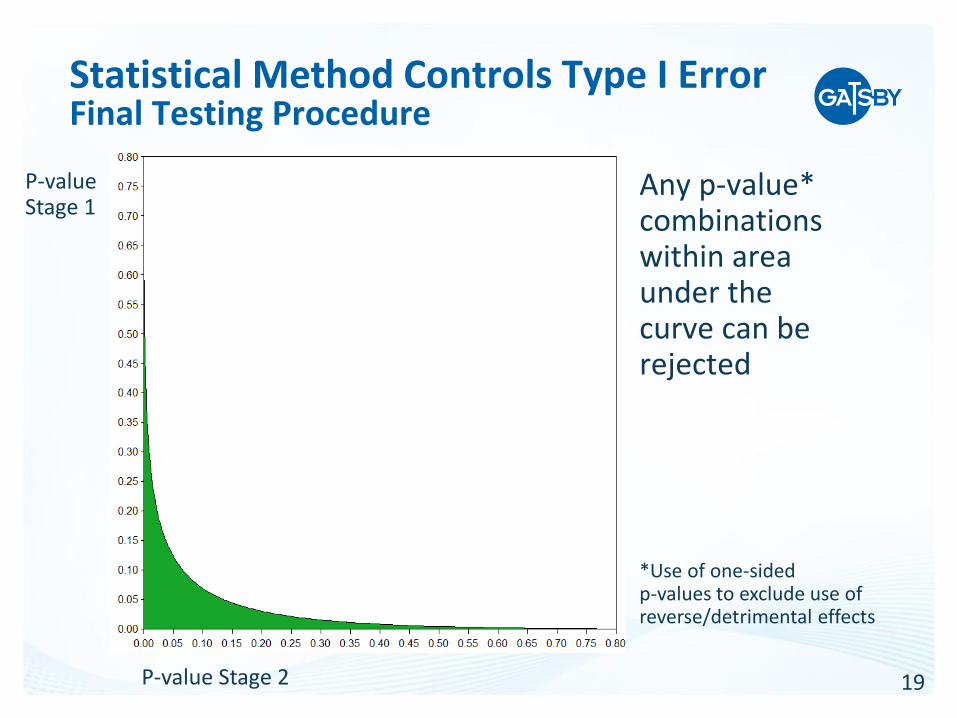
Statistical Method Controls Type I ErrorFinal Testing Procedure
Any p-value* combinations within area under the curve can be rejected
P-value Stage 2
P-value Stage 1
*Use of one-sided p-values to exclude use of reverse/detrimental effects
20
HA Further Concern: Bias in Estimates
• Investigation of bias by means of simulations encouraged by CHMP and bias in worst-case analysis shall be performed to provide upper bound
• Worst case assumption: Same treatment effect in both regimens and selecting study arm with larger effect size with already knowing the «future» final outcome (due to review of surrogate endpoints) – unrealistic perfect surrogate, but can be simulated

21
Bias in Estimates
Hazard Ratio
Median time to event, selected arm
(months)
Mean Bias SE 95% CI Mean Bias SE 95% CI
-.014 .00012
-.01424,
-.01376 .257 .00124
.25457,
.25943
Worst case assumption bias (regards selected arm) at the planned final analysis cut-off with simulated median time to event for both treatment arms 9 months and control 6 months
Based on 500 000 study simulations
Investigation of bias in estimates resulting in only small deviation. An observed HR of 0.67 may be corrected to HR of 0.684, and median time to OS subtracting one week

22
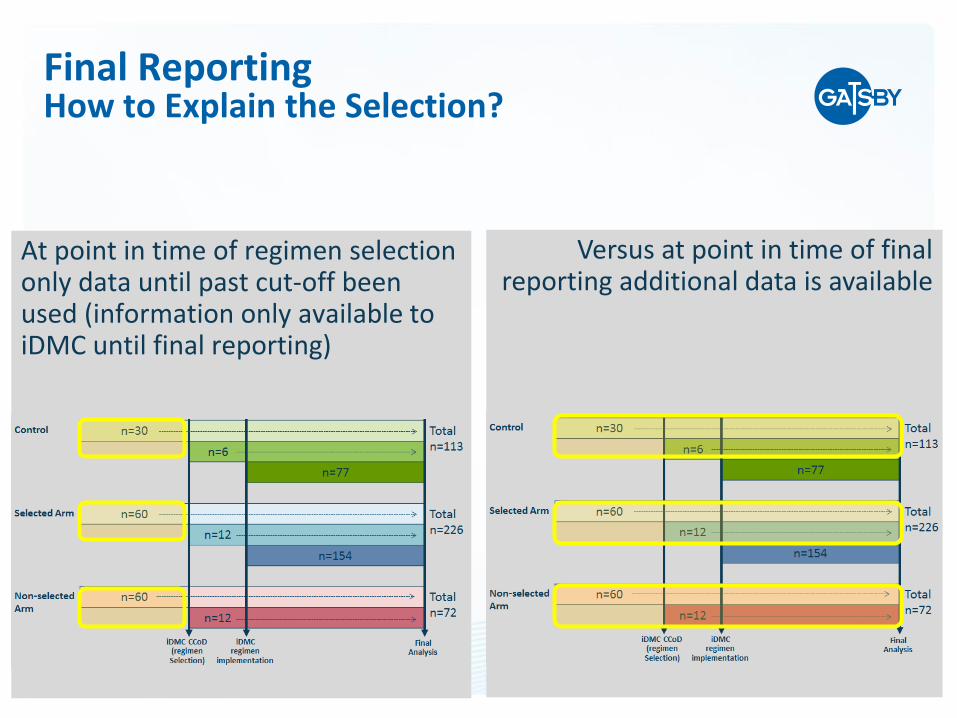
Versus for the statistical testing a derivation is needed based on stage 1
and stage 2 patients separately and with including the non-selected arm
The Study Estimates are derived similar to a usual phase III study –using all data within selected arm and control
Final ReportingStatistical Testing and Study Estimates
23
Versus at point in time of final reporting additional data is available
At point in time of regimen selection only data until past cut-off been used (information only available to iDMC until final reporting)
Final ReportingHow to Explain the Selection?
24
Reporting in GATSBY
Phase II
Phase III
Control n=30 Totaln=113n=6
n=77
Selected Arm n=60 Total n=226n=12
n=154
Non-selectedArm
n=60 Total n=72n=12
iDMC CCoD iDMC selection
Stage 1 Stage 2
Final Analysis

25
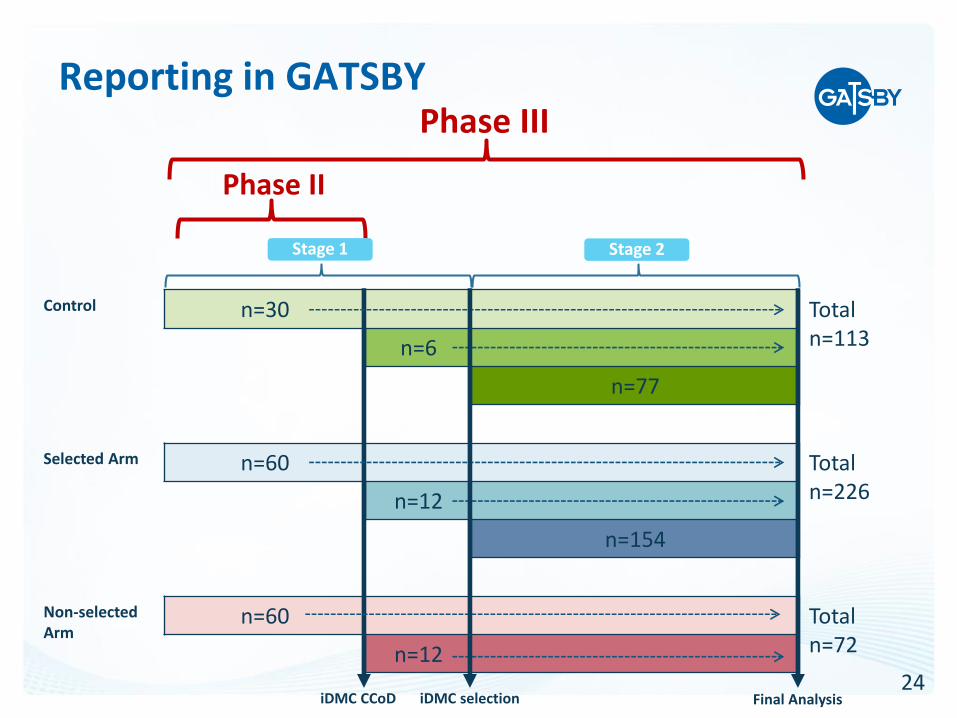
Reporting in GATSBY
• Phase II: Data from Stage 1 patients up to clinical cut-off used for IDMC regimen selection
• Phase III: Combined Stage 1 and Stage 2 data for the confirmatory portion of the study up to final cut-off. Control arm and the selected arm presented in two-column, side-by-side tables. The non-selected arm presented separately.
• OS endpoint analysis incorporates p-values from both study stages. OS and demography from all patients enrolled in Stage 1 will be shown in three-column, side-by-side fashion.

26
Interim Analysis
• An interim analysis to allow stopping for futility is possible
• Interim efficacy analysis problematic, due to the complex final testing procedure
1. Scenario stopping: Due to 2 study stages the planned final testing not applied at interim –> treatment effect to be very overwhelming to account for this lack in control of study-wide type I error rate (GATSBY: HR < 0.357 in 68 events)
2. Scenario not stopping: The used alpha at interim need to be split (instead use of nominal alpha) -> possibly higher loss of alpha (GATSBY: alpha spent=0.00003 with expected 68 events)

27
GATSBY Design Pros and Cons
Pros ConsTime/cost saving (Phase II/III inone study)
Operationally higher challenge and complex simulations for design/power evaluations
Using all data for dose selection with alpha fully controlled
Non-selected group to continue with the pre-planned treatment
Only small bias in estimates Bias needs to be investigated/reported
Dose selection by iDMC*: Roche independent expertise
- iDMC: Challenging «black box» with risk- Great time gap between decison and reporting
Phase II/III in only one reporting Non-selected arm vs control and/or by stage reporting (selected arm) may get HA request
Interim stop for futility possible Interim stop for efficacy not straight forward
* Essential for adaptive study design - to keep the sponsor blinded

28
Summary
• GATSBY is first Roche oncology study to apply this type of design
• It is an experimental study design («less well understood» design by FDA), but it is cost and time saving with type one error fully controlled
• The design used in GATSBY is not generalizable: Specifically the early group selection by an iDMC and continued treatment in the non-selected arm after the selection may not always be possible (primary endpoint in GATSBY is overall survival in patients with no promising other treatment options)

29
References
U.S. Food and Drug Administration: Draft Guidance for Industry: adaptive design clinical trials for drugs and biologics. http://www.fda.gov/downloads/DrugsGuidanceComplianceRegulatoryInformation/Guidances/UCM201790.pdf
Jenkins M, Stone A, Jennison C. An adaptive seamless phase II/III design for oncology trials with subpopulation selection using correlated survival endpoints. Pharm Stat 2011;10:347−56.
Bretz F, Schmidli H, König F, Racine A, Maurer W. Confirmatory Seamless Phase II/III Clinical Trials with Hypothesis Selection at Interim: General Concepts. Biometrical Journal 2006; 48 (4), 623–634
Schmidli H, Bretz F, Racine A, Maurer W. Confirmatory Seamless Phase II/III Clinical Trials with Hypothesis Selection at Interim: Applications and Practical Considerations. Biometrical Journal 2006; 48 (4), 635–643
König F., Brannath W., Bretz F. and Posch M. Adaptive Dunnett tests for treatment selection. Statistics in Medicine 2008; 27 : 1612-1625

30
Back-up

31
Simulation: Dose Exclusion Criteria
Safety: Drop a T-DM1 arm if• Treatment related mortality (TRM) rate ≥ 5% than
control arm
• TRM > 10% regardless of comparison to control arm TRM rate
PK: Drop a T-DM1 arm if• Cycle 1 AUC is < 65% of historical control observed for
the same schedule in mBC
Efficacy: Drop a T-DM1 arm if• HR for OS > 1.5 vs. control arm
Both T-DM1 arms may be dropped if they both meet any of the above criteria

32
Simulation: Dose Selection Criteria
Comparison is done if neither T-DM1 arm is dropped based on pre-defined criteria (previous slide):• PK: If one dose shows 50% or higher dose-intensity adjusted
cycle 1 AUC, select that dose. Otherwise efficacy and safety should be considered
• Efficacy: Dose with lower HR for OS (vs. control) should be selected
• Safety: Dose with lower TRM rate and treatment-related AEs should be selected. In addition, dose intensity may be considered in overall treatment safety assessment. Dose schedule with higher dose intensity is preferred
Note: Dose-intensity adjustment and treatment related AEs not used in simulations
33
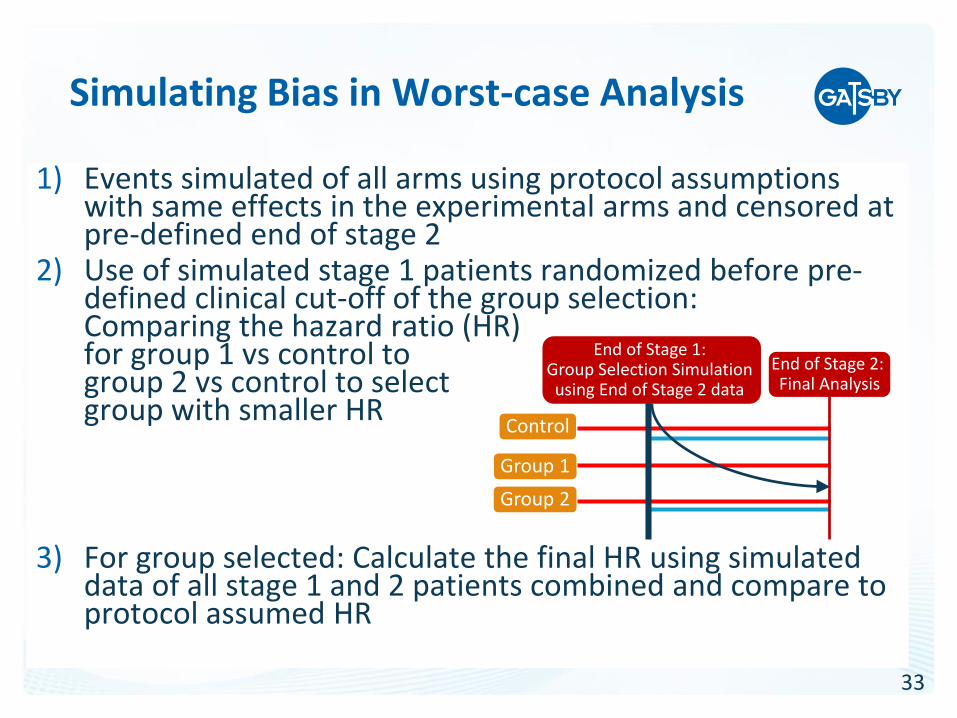
Simulating Bias in Worst-case Analysis
1) Events simulated of all arms using protocol assumptions with same effects in the experimental arms and censored at pre-defined end of stage 2
2) Use of simulated stage 1 patients randomized before pre-defined clinical cut-off of the group selection: Comparing the hazard ratio (HR) for group 1 vs control to group 2 vs control to select group with smaller HR
3) For group selected: Calculate the final HR using simulated data of all stage 1 and 2 patients combined and compare to protocol assumed HR
Control
Group 1
Group 2
End of Stage 1: Group Selection Simulation using End of Stage 2 data
End of Stage 2: Final Analysis

34
• The family-wise error rate (FWER) can be inflated when testing primary and secondary endpoints
• Specifically testing an endpoint used for regimen selection and scenario of only one arm with OS effect (1 + (2 need to be controlled:
1) Probability arm with no OS effect get selected (worst assumption: surrogate independent to primary) and primary testing wrongly rejected (may approach “cost” of full alpha due to inclusion of the possibly very small p-value of the non-selected arm with effect)
2) Probability treatment arm with effect get selected and secondary endpoint wrongly rejected
• An adaption of the more conservative Dunnett testing procedure1 as described in König et al (2008) prevents «cost» of full alpha from scenario above point 1 (if used for the primary analysis) due to setting the z-statistic for the deselected treatment to infinity (using this test for the final analysis -> the non-selected arm does not need to be followed up)
Testing Secondary Endpoints
1) Requires overall number of events to be pre-fixed (can not be changed at interim)

35
Futility Analysis Operational Aspect
• Futility analysis to be performed after approximately 68 events within selected arm and control
• Sponsor shall be blinded to calculations by arm, therefore only number of events over all 3 arms can be investigated
• Theoretical assumptions from study start need to be used for timeline projections (assumption on identical event rates between experimental arms)
• For GATSBY the projection for futulity analysis timeline been presented to the iDMC during the regular safety reviews


