77

Additional Information Deccan Remedies Limited
Pridhvi Envirotech (P) Limited. 1
Additional Information on Baseline data of May 2017,
modelling and revised CSR Plan
of
Deccan Remedies Limited
Sy.No.75(A), Kothur Village, Bidar Road,
Zaheerabad Mandal, Sangareddy (D) (Formerly Medak (D))
Telangana State
Studies and documentation by:
M/s. Pridhvi Envirotech private Limited,
NABET Accreditation S.no 122, Rev.55 dated 5th July2017
Plot No.184/C, Lawn House,
4th Floor, Vengal Rao Nagar,
Hyderabad- 500038
Submitted to :
Expert Appraisal Committee (Industry-II)
Ministry of Environment Forests and climate change,
Indira paryavaran Bhawan
Jorbagh, New Delhi

CONTENTS
S.No Description Page No.
Introduction 2
1.0 Baseline environmental status report 3
1.1 Air environment 3
1.1.1 Climatic conditions of the region 3
1.1.2 Micrometeorological data 4
1.1.3 Ambient air quality survey 7
1.2 Prediction of impact on air quality 14
1.2.1 Meteorological data 14
1.2.2 Plant emissions 15
1.2.3 Air quality prediction 16
1.3 Noise environment 29
1.3.1 Noise observations for the month of May 2017 31
1.4 Water environment 31
1.4.1 Water Observations of May 2017 40
1.4.2 Observations of the study period October 2015
to December 2015
40
1.5 Land environment 41
1.5.1 Observations of soil quality data for may 2017 44
1.5.2 Observations of soil quality data for study period
October 2015 to December 2015
44
2.0 Corporate social responsibility (CSR)Plan 45
2.1 Revised CSR Plan 45
2.2 Plan for regular testing of groundwater 46
Annexure I Minutes of EAC Meeting
Annexure II Micrometeorological data of Month of May 2017 47
Annexure III Ambient air quality data 66

Additional Information Deccan Remedies Limited
Pridhvi Envirotech (P) Limited. 2
INTRODUCTION
M/s. Deccan Remedies Limited is an existing sick unit located at
Sy.No.75(A), Kothur Village, Bidar Road, Zaheerabad Mandal, Sangareddy
District ( Formerly Medak District) in Telangana State. The Plant became
sick before it started any production activity. Only civil structures are in
existence. The unit is taken over by the current management in 2005.
As now current management proposed to revive the unit, this proposal is
submitted for getting EC with a capacity of 2400 TPA within the existing
premises by adding the infrastructure facilities.
The Expert Appraisal Committee (Industry-2) considered the project in
the meeting held during 18th – 19th January, 2016 and issued the ‘TORs’
vide letter No. F.N J-11011/276/2015-IA.II (I) dated 5.3.2016.
Accordingly, the study was carried out in and around 10KM radius area
around the project site as per the approved TOR during October 2015 to
January 2016 and the EIA study report is prepared based on the primary
base line data generated during the study and secondary data collected
from various sources and project proponents.
Public hearing was held on 14.12.2016 at 11.00 AM at Sy. No 75 (A),
Bidar Road, Kothur (V), Zaheerabad (M), Sangareddy District. By
Telangana State Pollution Control Board.
Final EIA Report is submitted to the Expert appraisal committee for
consideration. Expert Appraisal committee (industry-2) considered the
project in the 21st EAC Meeting held on 29th March 2017. Minutes of the
EAC Meeting are enclosed as Annexure I
The EAC Recommended to submit the following information
� The committee noted that the baseline data has been conducted
before the award of TOR. The EAC desired to have another one
month baseline data to be collected and to submit the result after
the modeling study.
� EAC also asked the PP to submit revised CSR plan (2.5 % of the project cost) with implementation period of five years having
provision of :
1. Drinking water facility with RO plant, solar lights on village
streets in nearby three villages bearing the maintenance cost.

Additional Information Deccan Remedies Limited
Pridhvi Envirotech (P) Limited. 3
2. Planting of 1000 perennial native trees per year till five years in
the surroundings and nearby selected three villages.
3. Plan for regular testing of ground water through lab accredited
by the Ministry for ensuring decontaminated agricultural water supply.
Based on the recommendations of the Expert Appraisal committee
the present report is prepared and submitted for kind
consideration.
1.0 BASELINE ENVIRONMENTAL STATUS REPORT
Baseline Environmental status in and around the proposed bulk drug unit
depicts the existing quality of Air, Noise, Water and Soil environment.
The baseline environmental study was carried out for the month of May
2017. The baseline environmental data pertaining to May 2017 and the
study period October to December 2015 are detailed below.
1.1 Air Environment
1.1.1 Climatic Conditions of the Region
The climate of the project area is humid and tropical. It is characterized
by a hot summer from March to May, a south-west monsoon or rainy
season from June to September, a pleasant Post – monsoon or retreating
monsoon from October to November and a cool Winter from December to
February. Therefore, climatologically four seasons viz., summer,
monsoon, post-monsoon and winter could be observed comprising the
following months.
Summer : March, April, May
Monsoon : June, July, August,
September
Post-Monsoon : October, November
Winter : December, January, February

Additional Information Deccan Remedies Limited
Pridhvi Envirotech (P) Limited. 4
1.1.2. Micrometeorological Data
The meteorological data recorded during the monitoring period is very
useful for proper interpretation of the baseline information as well as for
air quality prediction models. Historical data on meteorological
parameters will also play an important role in identifying the general
meteorological regime of the region.
Wind Speed and Wind Direction
Micro meteorological data within the project area was monitored
throughout May-2017 by setting up an automatic weather monitoring
station at project site. Wind speed, wind direction, temperature and
relative humidity were recorded in the met-station and rainfall was
recorded by rain gauge.
Wind Speed, Wind Direction, Temperature and Relative Humidity were
recorded on hourly basis for the May 2017. Wind roses on sixteen-sector
basis (N, NNE, NE, ENE, E, ESE, SE, SSE, S, SSW, SW, WSW, W, WNW,
NW, and NNW) have been drawn for 24 hours. The meteorological data
was recorded on hourly basis. The details of the wind pattern along with
the wind speeds for the study period are presented in the following
sections.
Hourly average, maximum and minimum values were recorded
continuously for 24 hours duration. The site specific micro meteorological
data provided in Annexure –I. The data generated is computed to obtain
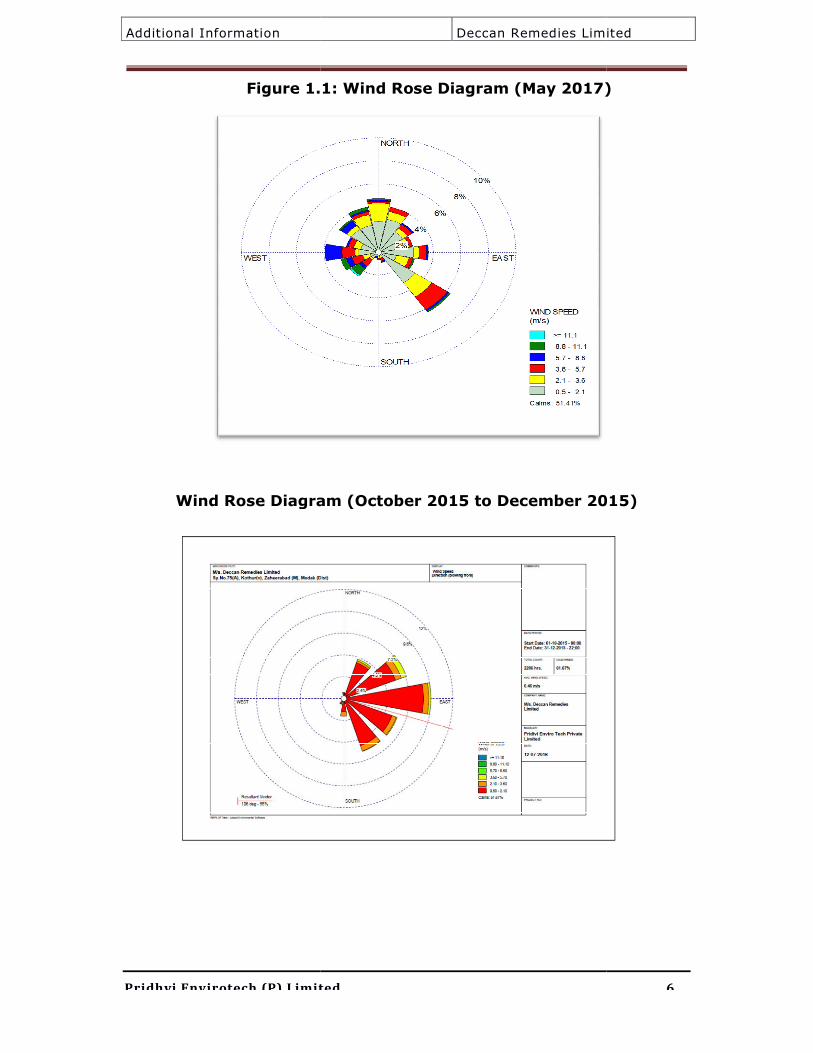
wind roses of the area. The plotted wind rose diagram representing 16
directions is depicted in Fig-1.1
Summary of meteorological data observed is presented in Table 1.1

Additional Information Deccan Remedies Limited
Pridhvi Envirotech (P) Limited. 5
Table 1.1
Summary of Meteorological Data observed at site
S.no Parameters May 2017 October to December 2015
1 Max. Temperature (0C) 44.3 34.3
2 Min. Temperature (0C) 24.1 11.0
3 Max. Relative Humidity (%) 77.3 99.5
4 Min. Relative Humidity (%) 6.8 8.5
5 Pre-dominant wind direction SE East
Additional Information
Pridhvi Envirotech (P) Limited
Figure 1.1
Wind Rose Diagram
Deccan Remedies Limit
ited.
.1: Wind Rose Diagram (May 2017)
gram (October 2015 to December 201
imited
6
17)
2015)

Additional Information Deccan Remedies Limited
Pridhvi Envirotech (P) Limited. 7
1.1.3 Ambient Air Quality Survey
Ambient Air Quality Monitoring
The design of monitoring network in the air quality surveillance program
was based on the following considerations.
• Topography / Terrain of the study area
• Human Settlements
• Wind pattern
• Representation of Regional Background levels
• Accessibility of monitoring site
Pre-calibrated Fine Particulate Samplers & R.D. Samplers have been used
for monitoring the existing AAQ status.
Maximum, Minimum, Average and Percentile values have been computed
from the raw data collected at all individual sampling stations to represent
the Ambient Air Quality Status.
The Ambient Air Quality studies were carried out for May-2017. The
significant parameters viz., PM10, PM2.5, SO2, NOx, NH3, CO and
VOC at ground level were monitored in the proposed project site and
study area.
Table –1.1 AAQ Sampling Location Details
S.
NO
Locati
on
Code
Location Dire
ctio
n
Dista
nce-
Km
Frequen
cy
Latitude Longitude
1. AAQ1 Project
site
- - - N 170 43’40.4” E 78035’12.3”
2. AAQ2 Buridhipha
d
W 2.2 Down
wind
N170 43’40.2” E 77033’ 48.8”
3. AAQ3 Kashimpur ESE 7.5 Up wind N170 40’27.6” E 77032’37.0”
4. AAQ4 Zahirabad SSE 6.3 Cross wind
N170 39’57.4” E 77036’20.6”
5. AAQ5 Kotthuru
(B)
NE 1.5 Upwind N170 44’10.4” E77035’41.3”
6. AAQ6 Rejaital NNE 4.8 Upwind N170 45’59.5” E77036’34.6”
7. AAQ7 Barur SE 4.3 Cross
wind
N170 45’06.1” E77033’22.0”
8. AAQ8 Gangwar NNW 5.10 Down
wind
N170 46’30.4” E77034’46.7”

Additional Information Deccan Remedies Limited
Pridhvi Envirotech (P) Limited. 8
Fig. 1.2 Ambient Air Quality Monitoring Locations
1. Plant Site
The air quality station was fixed on the top of an administration building
at a height of about 3.5 m above the ground ensuring the free flow of
winds.
Observation for May-2017
The monitoring results of the station shows that the PM10 and PM2.5
values range between 58.3 – 66.4 µg/m3 and 18.5 – 27.4 µg/m3 . The
SO2 and NOX levels vary between 9.3 – 16.3 µg/m3 and 14.7 – 21.6
µg/m3. NH3 Levels are between 16.2 – 20.3 µg/m3 and CO levels are
between 1.7 – 2.2 µg/m3 and VOC levels are between 1.0 – 1.6 µg/m3.
Observation for the study period October –December-2015
The monitoring results of the station shows that the PM10 and PM2.5
values range between 46.1 – 85.0 µg/m3 and 20.4 – 35.3 µg/m3 the
mean values are 73.5 µg/m3 and 29.6 µg/m3. The SO2 and NOX levels
vary between 7.3 – 16.6 µg/m3 and 13.0 – 19.4 µg/m3 and the mean
values 13.3 µg/m3 and 16.7 µg/m3.NH3 Levels are between 14.3 – 34.5
Additional Information Deccan Remedies Limited
Pridhvi Envirotech (P) Limited. 9
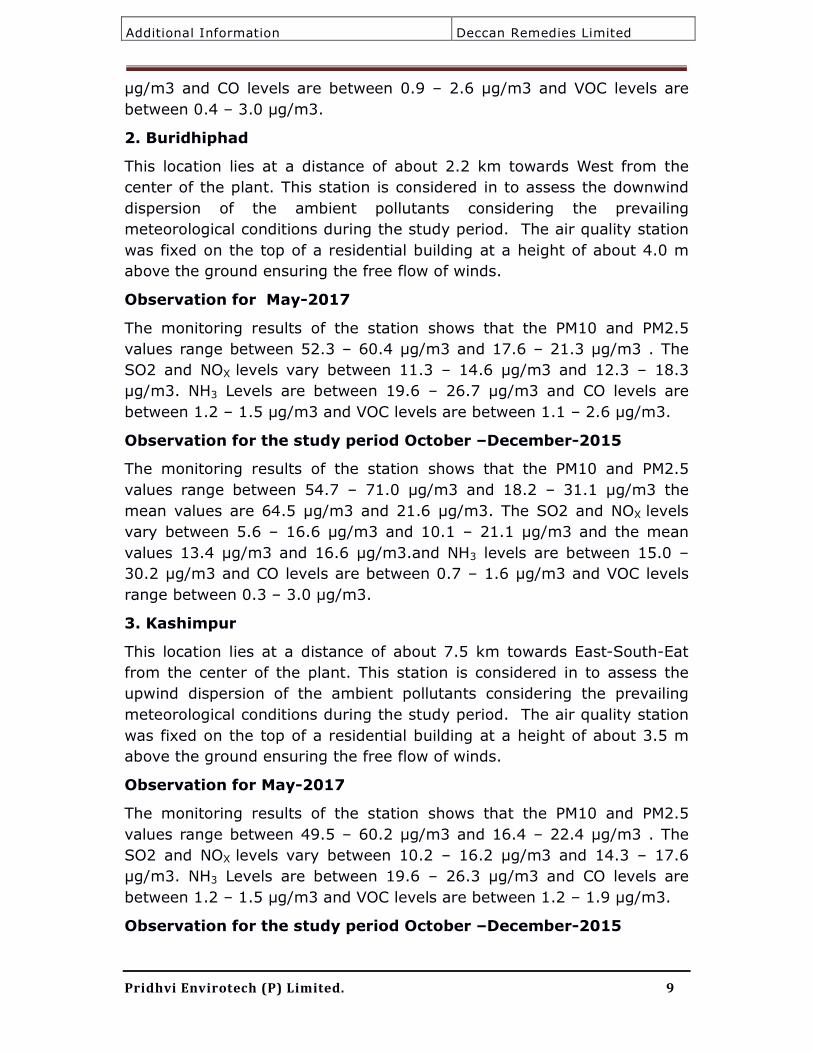
µg/m3 and CO levels are between 0.9 – 2.6 µg/m3 and VOC levels are
between 0.4 – 3.0 µg/m3.
2. Buridhiphad
This location lies at a distance of about 2.2 km towards West from the
center of the plant. This station is considered in to assess the downwind
dispersion of the ambient pollutants considering the prevailing
meteorological conditions during the study period. The air quality station
was fixed on the top of a residential building at a height of about 4.0 m
above the ground ensuring the free flow of winds.
Observation for May-2017
The monitoring results of the station shows that the PM10 and PM2.5
values range between 52.3 – 60.4 µg/m3 and 17.6 – 21.3 µg/m3 . The
SO2 and NOX levels vary between 11.3 – 14.6 µg/m3 and 12.3 – 18.3
µg/m3. NH3 Levels are between 19.6 – 26.7 µg/m3 and CO levels are
between 1.2 – 1.5 µg/m3 and VOC levels are between 1.1 – 2.6 µg/m3.
Observation for the study period October –December-2015
The monitoring results of the station shows that the PM10 and PM2.5
values range between 54.7 – 71.0 µg/m3 and 18.2 – 31.1 µg/m3 the
mean values are 64.5 µg/m3 and 21.6 µg/m3. The SO2 and NOX levels
vary between 5.6 – 16.6 µg/m3 and 10.1 – 21.1 µg/m3 and the mean
values 13.4 µg/m3 and 16.6 µg/m3.and NH3 levels are between 15.0 –
30.2 µg/m3 and CO levels are between 0.7 – 1.6 µg/m3 and VOC levels
range between 0.3 – 3.0 µg/m3.
3. Kashimpur
This location lies at a distance of about 7.5 km towards East-South-Eat
from the center of the plant. This station is considered in to assess the
upwind dispersion of the ambient pollutants considering the prevailing
meteorological conditions during the study period. The air quality station
was fixed on the top of a residential building at a height of about 3.5 m
above the ground ensuring the free flow of winds.
Observation for May-2017
The monitoring results of the station shows that the PM10 and PM2.5
values range between 49.5 – 60.2 µg/m3 and 16.4 – 22.4 µg/m3 . The
SO2 and NOX levels vary between 10.2 – 16.2 µg/m3 and 14.3 – 17.6
µg/m3. NH3 Levels are between 19.6 – 26.3 µg/m3 and CO levels are
between 1.2 – 1.5 µg/m3 and VOC levels are between 1.2 – 1.9 µg/m3.
Observation for the study period October –December-2015

Additional Information Deccan Remedies Limited
Pridhvi Envirotech (P) Limited. 10
The monitoring results of the station shows that the PM10 and PM2.5
values range between 45.2 – 64.0 µg/m3 and 17.4– 25.5 µg/m3 the
mean values are 57.6 µg/m3 and 19.6 µg/m3. The SO2 and NOX levels
vary between 7.5 – 13.9 µg/m3 and 11.2 – 17.6 µg/m3 and the mean
values 10.5 µg/m3 and 14.3 µg/m3.and NH3 levels are between 16.2 –
25.6 µg/m3 and CO levels are between 0.5 – 1.2 µg/m3 and VOC levels
range between 0.5 – 2.0 µg/m3.
4. Zahirabad
This location lies at a distance of about 6.3 km towards South-South- East
from the center of the plant. This station is considered in to assess the
crosswind dispersion of the ambient pollutants considering the prevailing
meteorological conditions during the study period. The air quality station
was fixed on the top of a residential building at a height of about 3.0 m
above the ground ensuring the free flow of winds.
Observation for May-2017
The monitoring results of the station shows that the PM10 and PM2.5
values range between 53.7 – 66.3 µg/m3 and 20.3 – 31.5 µg/m3 . The
SO2 and NOX levels vary between 9.8 – 14.6 µg/m3 and 12.3 – 17.3
µg/m3. NH3 Levels are between 20.7 – 28.3 µg/m3 and CO levels are
between 1.2 – 1.6 µg/m3 and VOC levels are between 1.2 – 1.7 µg/m3.
Observation for the study period October –December-2015
The monitoring results of the station shows that the PM10 and PM2.5
values range between 65.6 – 90.0 µg/m3 and 28.3– 40.6 µg/m3 the
mean values are 76.4 µg/m3 and 33.7 µg/m3. The SO2 and NOX levels
vary between 8.8 – 18.8 µg/m3 and 10.9– 23.8 µg/m3 and the mean
values 15.1 µg/m3 and 17.3 µg/m3.and NH3 levels are between 19.3 –
33.2 µg/m3 and CO levels are between 1.0 – 2.5 µg/m3 and VOC levels
range between 0.9 – 3.0 µg/m3.
5. Kothuru
This location lies at a distance of about 1.5 km towards Northeast from
the center of the plant. This station is considered in to assess the upwind
dispersion of the ambient pollutants considering the prevailing
meteorological conditions during the study period. The air quality station
was fixed on the top of a residential building at a height of about 3.5 m
above the ground ensuring the free flow of winds.

Additional Information Deccan Remedies Limited
Pridhvi Envirotech (P) Limited. 11
Observation for May-2017
The monitoring results of the station shows that the PM10 and PM2.5
values range between 45.6 – 70.5 µg/m3 and 19.5 – 24.2 µg/m3. The
SO2 and NOX levels vary between 12.3 – 14.3 µg/m3 and 14.2 – 18.3
µg/m3. NH3 Levels are between 18.7 – 23.2 µg/m3 and CO levels are
between 1.1 – 1.7 µg/m3 and VOC levels are between 1.2 – 1.6 µg/m3.
Observation for the study period October –December-2015
The monitoring results of the station shows that the PM10 and PM2.5
values range between 58.0 – 70.0 µg/m3 and 17.2– 32.1 µg/m3 the
mean values are 64.8 µg/m3 and 22.0 µg/m3. The SO2 and NOX levels
vary between 6.2 – 14.8 µg/m3 and 11.8– 20.0 µg/m3 and the mean
values 12.1 µg/m3 and 15.2 µg/m3.and NH3 levels are between 21.4 –
32.3 µg/m3 and CO levels are between 0.9 – 2.0 µg/m3 and VOC levels
range between 0.7 – 3.0 µg/m3.
6. Renjantal
This location lies at a distance of about 4.8 km towards North-North-East
from the center of the plant. This station is considered in to assess the
crosswind dispersion of the ambient pollutants considering the prevailing
meteorological conditions during the study period. The air quality station
was fixed on the top of a residential building at a height of about 3.8 m
above the ground ensuring the free flow of winds.
Observation for May-2017
The monitoring results of the station shows that the PM10 and PM2.5
values range between 49.2 – 61.4 µg/m3 and 21.2 – 26.2 µg/m3 . The
SO2 and NOX levels vary between 11.5 – 14.2 µg/m3 and 12.7 – 15.6
µg/m3. NH3 Levels are between 18.7 – 25.3 µg/m3 and CO levels are
between 1.0 – 1.5 µg/m3 and VOC levels are between 1.2 – 1.8 µg/m3.
Observation for the study period October –December-2015
The monitoring results of the station shows that the PM10 and PM2.5
values range between 53.5 – 69.0 µg/m3 and 18.2– 35.6 µg/m3 the
mean values are 62.0 µg/m3 and 22.5 µg/m3. The SO2 and NOX levels
vary between 7.8 – 14.1µg/m3 and 11.3– 19.8 µg/m3 and the mean
values 10.9 µg/m3 and 17.3 µg/m3.and NH3 levels are between 18.6 –
26.4 µg/m3 and CO levels are between 0.8 – 1.3 µg/m3 and VOC levels
range between 0.3 – 5.0 µg/m3.
7. Barur

Additional Information Deccan Remedies Limited
Pridhvi Envirotech (P) Limited. 12
This location lies at a distance of about 4.3 km towards South East from
the center of the plant. This station is considered in to assess the
crosswind dispersion of the ambient pollutants considering the prevailing
meteorological conditions during the study period. The air quality station
was fixed on the top of a residential building at a height of about 3.5 m
above the ground ensuring the free flow of winds.
Observation for May-2017
The monitoring results of the station shows that the PM10 and PM2.5
values range between 46.5 – 67.2 µg/m3 and 18.2 – 22.3 µg/m3 . The
SO2 and NOX levels vary between 10.3 – 15.6 µg/m3 and 16.7 – 21.5
µg/m3. NH3 Levels are between 16.7 – 21.5 µg/m3 and CO levels are
between 1.2 – 1.5 µg/m3 and VOC levels are between 1.2 – 2.6 µg/m3.
Observation for the study period October –December-2015
The monitoring results of the station shows that the PM10 and PM2.5
values range between 52.0 – 67.0 µg/m3 and 16.2– 33.5 µg/m3 the
mean values are 60.9 µg/m3 and 21.3 µg/m3. The SO2 and NOX levels
vary between 6.4 – 17.0µg/m3 and 9.6– 19.7 µg/m3 and the mean
values 13.0 µg/m3 and 16.5 µg/m3.and NH3 levels are between 10.6 –
32.1 µg/m3 and CO levels are between 0.7 – 1.3 µg/m3 and VOC levels
range between 0.4 – 7.0 µg/m3.
8. Gangwar
This location lies at a distance of about 5.1 km towards North-North-West
from the center of the plant. This station is considered in to assess the
downwind dispersion of the ambient pollutants considering the prevailing
meteorological conditions during the study period. The air quality station
was fixed on the top of a residential building at a height of about 3.5 m
above the ground ensuring the free flow of winds.
Observation for May-2017
The monitoring results of the station shows that the PM10 and PM2.5
values range between 49.8 – 56.2 µg/m3 and 17.4 – 26.5 µg/m3 . The
SO2 and NOX levels vary between 10.3 – 13.2 µg/m3 and 11.9 – 19.6
µg/m3. NH3 Levels are between 18.4 – 26.4 µg/m3 and CO levels are
between 1.0 – 1.6 µg/m3 and VOC levels are between 1.0 – 2.1 µg/m3.
Observation for the study period October –December-2015
The monitoring results of the station shows that the PM10 and PM2.5
values range between 50.0 – 65.0 µg/m3 and 18.4– 36.6 µg/m3 the
mean values are 58.2 µg/m3 and 22.0 µg/m3. The SO2 and NOX levels

Additional Information Deccan Remedies Limited
Pridhvi Envirotech (P) Limited. 13
vary between 7.2 – 15.8µg/m3 and 12.0– 19.9 µg/m3 and the mean
values 13.2 µg/m3 and 17.0 µg/m3.and NH3 levels are between 16.0 –
31.3 µg/m3 and CO levels are between 0.8 – 1.6 µg/m3 and VOC levels
range between 0.2 – 4.0 µg/m3.
Table –1.2
Ambient Air Quality data for May 2017 and Oct to Dec 2015 (µg/m3)
Pollutant May-2017 October 2015 to December 2015
Maximum Minimum Mean Minimum Maximum Mean
AAQ-1) Location: Project Site
PM10 66.4 58.3 61.6 46.1 85.0 73.5
PM2.5 27.4 18.5 22.7 36.3 20.4 29.6
SO2 16.3 9.3 13.5 16.6 7.3 13.3
NOx 21.6 14.7 18.3 19.4 13 16.7
NH3 20.3 16.2 17.9 34.5 14.3 27.5
CO 2.2 1.7 2.0 2.6 0.9 1.4
VOC 1.6 1.0 1.3 3.0 0.4 1.1
AAQ-2) Location: Buridhiphad
PM10 60.4 52.3 56.1 54.7 71.0 64.5
PM2.5 21.3 17.6 19.6 18.2 31.1 21.6
SO2 14.6 11.3 13.4 5.6 16.6 13.4
NOx 18.3 12.3 15.1 10.1 21.1 16.6
NH3 26.7 19.6 23.0 15.0 30.2 21.6
CO 1.5 1.2 1.3 0.7 1.6 1.1
VOC 2.6 1.1 1.7 0.3 3.0 0.7
AAQ-3) Location: Kashimpir
PM10 60.2 49.5 54.2 45.2 64.0 57.6
PM2.5 22.4 16.4 19.3 17.4 25.5 19.6
SO2 16.2 10.2 13.7 7.5 13.9 10.5
NOx 17.6 14.3 15.8 11.2 17.6 14.3
NH3 26.3 19.6 23.0 16.2 25.6 19.0
CO 1.5 1.2 1.4 0.7 1.2 1.0
VOC 1.9 1.2 1.5 0.5 2.0 0.9
AAQ-4) Location:Zahirabad
PM10 66.3 53.7 61.8 65.6 90.0 76.4
PM2.5 31.5 20.3 24.1 28.3 40.6 33.7
SO2 14.6 9.8 12.6 8.8 18.8 15.1
NOx 17.3 12.3 14.8 10.9 23.8 17.3
NH3 28.3 20.7 24.2 19.2 33.2 26.1
CO 1.6 1.2 1.4 1.0 2.5 1.2
VOC 1.7 1.2 1.4 0.9 3.0 1.3
AAQ-5) Location: Kothuru
PM10 70.5 45.6 56.4 58.0 70.0 64.8
PM2.5 24.2 19.5 21.9 17.2 32.1 22.0
SO2 14.3 12.3 13.2 6.2 14.8 12.1
NOx 18.3 14.2 15.3 11.5 20.0 15.2
NH3 23.2 18.7 20.8 21.4 32.3 27.6
CO 1.7 1.1 1.4 0.9 2.0 1.2
VOC 1.6 1.2 1.4 0.7 3.0 1.2
AAQ-6) Location: Renjantal
PM10 61.4 49.2 55.5 53.5 69.0 62.0
PM2.5 26.2 21.2 24.3 18.2 35.6 22.5
SO2 14.2 11.5 12.8 7.8 14.1 10.9

Additional Information Deccan Remedies Limited
Pridhvi Envirotech (P) Limited. 14
NOx 15.6 12.7 14.3 11.3 19.8 17.3
NH3 25.3 18.7 21.6 18.6 26.4 21.4
CO 1.5 1.0 1.3 0.8 1.3 1.1
VOC 1.8 1.2 1.4 0.3 5.0 1.2
AAQ-7) Location: Barur
PM10 67.2 46.5 54.8 52.0 67.0 60.9
PM2.5 22.3 18.2 20.4 16.2 33.5 21.3
SO2 12.3 10.3 11.6 6.4 17.0 13.0
NOx 15.6 12.4 14.2 9.6 19.7 16.5
NH3 21.5 16.7 19.8 1.06 32.1 22.3
CO 1.5 1.2 1.3 0.7 1.3 1.0
VOC 2.6 1.2 1.5 0.4 7.0 1.1
AAQ-8) Location: Gangwar
PM10 56.2 49.8 53.1 50 65.0 58.2
PM2.5 26.5 17.4 21.1 18.4 36.6 22.0
SO2 13.2 10.3 12.0 7.2 15.8 13.2
NOx 19.6 11.9 14.9 12.0 19.8 17.0
NH3 26.4 18.4 21.3 16.0 31.3 26.4
CO 1.6 1.0 1.3 0.8 1.6 1.0
VOC 2.1 1.0 1.7 0.2 4.0 0.9
1.2 Prediction of Impact on Air Quality
1.2.1 Meteorological Data
Data recorded by the weather monitoring station at site on wind speed,
direction, solar insolation, temperature and cloud cover at one hourly
interval for one month has been used for computations. Hourly
atmospheric stability determined based on the technique suggested by
Turner. Visual observations were made on for the solar insolation and
cloud cover during study period. The methodology adopted for
establishing the hourly stability class is given in Table 1.3.
Table 1.3 Atmospheric Stability Classification
Wind Speed
(m/sec)
Insolation (Day time) Night time
Strong Moderate Slight Thin over cast or >4/8 low
cloud
<3/8 Cloud
<2 A A-B B - -
2-3 A-B B C E F
3-5 B B-C C D E
5-6 C C-D D D D
>6 C D D D D
Additional Information Deccan Remedies Limited
Pridhvi Envirotech (P) Limited. 15
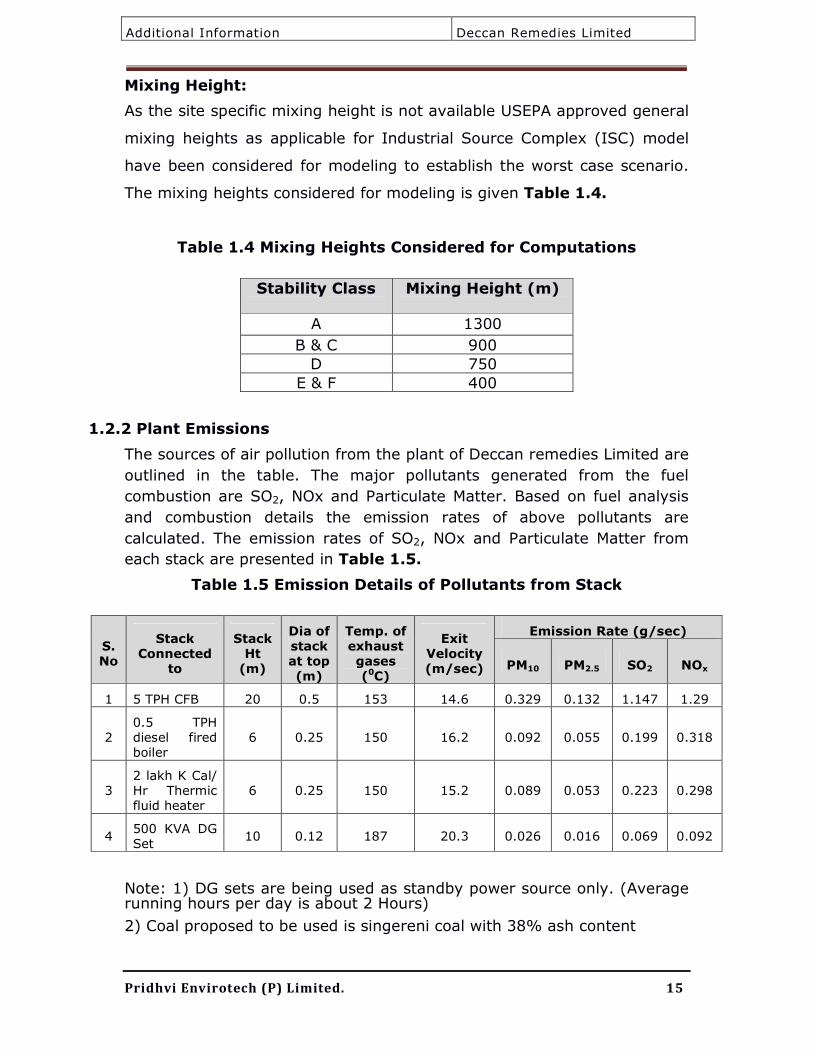
Mixing Height:
As the site specific mixing height is not available USEPA approved general
mixing heights as applicable for Industrial Source Complex (ISC) model
have been considered for modeling to establish the worst case scenario.
The mixing heights considered for modeling is given Table 1.4.
Table 1.4 Mixing Heights Considered for Computations
Stability Class Mixing Height (m)
A 1300
B & C 900
D 750
E & F 400
1.2.2 Plant Emissions
The sources of air pollution from the plant of Deccan remedies Limited are
outlined in the table. The major pollutants generated from the fuel
combustion are SO2, NOx and Particulate Matter. Based on fuel analysis
and combustion details the emission rates of above pollutants are
calculated. The emission rates of SO2, NOx and Particulate Matter from
each stack are presented in Table 1.5.
Table 1.5 Emission Details of Pollutants from Stack
S. No
Stack Connected
to
Stack Ht
(m)
Dia of stack at top (m)
Temp. of exhaust gases (0C)
Exit Velocity (m/sec)
Emission Rate (g/sec)
PM10 PM2.5 SO2 NOx
1 5 TPH CFB 20 0.5 153 14.6 0.329 0.132 1.147 1.29
2 0.5 TPH diesel fired boiler
6 0.25 150 16.2 0.092 0.055 0.199 0.318
3 2 lakh K Cal/ Hr Thermic fluid heater
6 0.25 150 15.2 0.089 0.053 0.223 0.298
4 500 KVA DG Set
10 0.12 187 20.3 0.026 0.016 0.069 0.092
Note: 1) DG sets are being used as standby power source only. (Average running hours per day is about 2 Hours)
2) Coal proposed to be used is singereni coal with 38% ash content

Additional Information Deccan Remedies Limited
Pridhvi Envirotech (P) Limited. 16
1.2.3 Air Quality Predictions
Predictions of ground level concentrations of the pollutants were carried
out based on site meteorological data collected during the period of May
2017 and the study period October to December 2015. For calculation of
ground level concentrations a grid of 20 km X 20 km with a receptor
interval of 500 meters is considered.
The composition of particulate matter was obtained from USEPA AIRCHIEF
AP-42 and the same was considered in determining the source
concentration of PM10 for prediction purpose. The predicted maximum 24
hourly ground level concentrations of PM10, PM2.5, SO2 and NOx and
distance of occurrence during different seasons of study period are
presented in Table 1.6.
It may be observed that the annual predicted maximum 24 hourly GLC’s
of May 2017 are PM10, PM2.5, SO2 and NOx are 1.003, 0.602, 2.429 and
3.438 µg/m3respectively and the maximum values are observed at a
distance of 1.5 km from the center of plant site in North east direction.
However it may be noted that the predicted values of the SO2 and NOx
are based on the assumption that the DG sets are used constantly, where
as the DG set usage is only during load shut down from TSSPDL.
It may be observed that the annual predicted maximum 24 hourly GLC’s
of October to December 2015 are PM10, PM2.5, SO2 and NOx are 0.816,
0.457, 2.097 and 2.484 µg/m3respectively and the maximum values are
observed at a distance of 2.2 km from the center of plant site in West
direction. However it may be noted that the predicted values of the SO2
and NOx are based on the assumption that the DG sets are used
constantly, where as the DG set usage is only during load shut down from
TSSPDL.
The GLC’s are also predicted at air quality monitoring locations and the
predicted GLC’s are presented in Tables 1.7 and the cumulative
concentrations at various villages are tabulated in Table 1.8. It may be
observed from the Table that the predicted results show that the

Additional Information Deccan Remedies Limited
Pridhvi Envirotech (P) Limited. 17
incremental rise over existing base line status of ambient air quality is
within the limits prescribed by CPCB for residential and rural areas.
Hence the control measures and height of stack is sufficient to disperse
the pollutants into the atmosphere and keeping the baseline levels within
the prescribed limits. The predicted ground level concentrations are
graphically displayed for PM10, PM2.5, SO2, and NOx respectively in Figure
5.7 – 5.10.
Table 1.6
Maximum Predicted 24 hourly GLC’s for the Study period May 2017
S.No Parameter Predicted
GLC (µg/m3) Distance
(KM) Direction
1 PM10 1.003 1.5 North East
2 PM2.5 0.602 1.5 West
3 SO2 2.429 1.5 West
4 NOX 3.438 1.5 West
Maximum Predicted 24 hourly GLC’s for the Study period October
to December 2015
S.No Parameter
Predicted GLC (µg/m3)
Distance (KM)
Direction
1 PM10 0.816 2.2 West
2 PM2.5 0.457 2.2 West
3 SO2 2.097 2.2 West
4 NOX 2.848 2.2 West

Addit
ional
info
rmati
on
Deccan R
em
edie
s L
imit
ed
Pr
idh
vi
En
vir
ote
ch
(P
) L
imit
ed
.
1
8
Tab
le 1
.7
Pred
icte
d G
LC
’s a
t M
on
ito
rin
g L
ocati
on
s &
Reserve f
orests
S.
No
Mo
nit
orin
g
Lo
cati
on
D
irecti
on
D
ista
nc
e (
Km
)
Pred
icte
d G
LC
(µ
g/
m3) o
f M
ay
20
17
P
red
icte
d G
LC
(µ
g/
m3) o
f O
cto
ber t
o D
ecem
ber 2
01
5
PM
10
PM
2.5
S
O2
NO
x
PM
10
PM
2.5
S
O2
NO
x
1
Pro
ject
site
- -
0.0
00
0.0
00
0.0
00
0.0
00
0.0
00
0.0
00
0.0
00
0.0
00
2
Burd
hip
had
W
2.2
0.1
47
0.0
88
0.3
77
0.5
12
0.8
16
0.4
57
2.0
97
2.8
48
3
Kashim
pur
ESE
7.5
0.3
63
0.2
18
0.8
76
1.2
44
0.7
18
0.4
30
1.7
38
2.4
61
4
Zahirabad
SSE
6.3
0.4
12
0.2
47
0.9
85
1.4
11
0.0
38
0.0
22
0.0
97
0.1
34
5
Kott
huru
(B)
NE
1.5
1.0
03
0.6
02
2.4
29
3.4
38
0.1
72
0.0
94
0.4
71
0.6
18
6
Reja
ital
NN
E
4.8
0.2
06
0.1
24
0.5
02
0.7
06
0.0
32
0.0
15
0.1
00
0.1
21
7
Baru
r SE
4.3
0.1
84
0.1
10
0.4
49
0.6
30
0.2
78
0.1
68
0.6
67
0.9
53
8
Gangw
ar
NN
W
5.1
0
0.0
25
0.0
11
0.0
77
0.0
93
0.1
72
0.1
05
0.4
09
0.5
90
Reserve f
orests
1
Did
gi R.F
. W
3.5
1.3
45
0.8
07
3.2
23
4.6
07
0.8
46
0.5
18
2.0
07
2.8
97
2
Zahirabad
S
1.0
1.0
86
0.6
54
2.6
73
3.7
28
0.4
23
0.2
41
1.0
58
1.4
56
3
Gopanapalii R.F
SSW
9.7
0.3
83
0.2
29
0.9
03
1.3
08
0.7
52
0.4
59
1.7
87
2.5
74
4
Kalb
em
l R.F
N
W
9.0
0.1
49
0.0
89
0.3
59
0.5
11
0.2
44
0.1
47
0.5
89
0.8
37
5
Adnur
R.F
N
NE
8.3
0.1
98
0.1
18
0.4
75
0.6
78
0.3
35
0.2
05
0.7
95
1.1
47
6
Shekharp
urR
.F
SSE
10
0.3
19
0.1
91
0.7
56
1.0
91
0.0
30
0.0
18
0.0
76
0.1
06

Addit
ional
info
rmati
on
Deccan R
em
edie
s L
imit
ed
Pr
idh
vi
En
vir
ote
ch
(P
) L
imit
ed
.
1
9
Tab
le 1
.8
Cu
mu
lati
ve C
on
cen
trati
on
s a
t V
ario
us V
illa
ges f
or t
he s
tud
y p
erio
d M
ay 2
01
7
Sta
tio
n
Baselin
e
Gro
un
d L
evel
Cu
mu
lati
ve
PM
10
P
M2
.5
SO
2
No
x
PM
10
P
M2
.5
SO
2
No
x
PM
10
P
M2
.5
SO
2
No
x
Pro
ject
site
66.4
27.4
16.3
21.6
0.0
00
0.0
00
0.0
00
0.0
00
66.4
00
27.4
00
16.3
00
21.6
00
Burd
hip
had
60.4
21.3
14.6
18.3
0.1
47
0.0
88
0.3
77
0.5
12
60.5
47
21.3
88
14.9
77
18.8
12
Kashim
pur
60.2
22.4
16.2
17.6
0.3
63
0.2
18
0.8
76
1.2
44
60.5
63
22.6
18
17.0
76
18.8
44
Zahirabad
66.3
31.5
14.6
17.3
0.4
12
0.2
47
0.9
85
1.4
11
66.7
12
31.7
47
15.5
85
18.7
11
Kott
huru
(B)
70.5
24.2
14.3
18.3
1.0
03
0.6
02
2.4
29
3.4
38
71.5
03
24.8
02
16.7
29
21.7
38
Reja
ital
61.4
26.2
14.2
15.6
0.2
06
0.1
24
0.5
02
0.7
06
61.6
06
26.3
24
14.7
02
16.3
06
Baru
r 67.2
22.3
12.3
15.6
0.1
84
0.1
10
0.4
49
0.6
30
67.3
84
22.4
10
12.7
49
16.2
30
Gangw
ar
56.2
26.5
13.2
19.6
0.0
25
0.0
11
0.0
77
0.0
93
56.2
25
26.5
11
13.2
77
19.6
93

Addit
ional
info
rmati
on
Deccan R
em
edie
s L
imit
ed
Pr
idh
vi
En
vir
ote
ch
(P
) L
imit
ed
.
2
0
Cu
mu
lati
ve C
on
cen
trati
on
s a
t V
ario
us V
illa
ges f
or t
he s
tud
y p
erio
d O
cto
ber t
o D
ecem
ber 2
01
5
Sta
tion
D
irecti
on
Dis
tan
ce
(K
m)
Baselin
e C
on
cen
trati
on
(µg
/m
3)
Pred
icte
d G
LC
(µg
/m
3)
Cu
mu
lati
ve C
on
cen
trati
on
(µg
/m
3)
PM
10
PM
2.5
S
O2
NO
x
PM
10
PM
2.5
S
O2
NO
x
PM
10
PM
2.5
S
O2
NO
x
Buridhip
had
W
2.2
71.0
31.1
16.6
21.1
0.8
16 0.4
57 2.0
97
2.8
48 71.8
16 3
1.5
57 18.6
64 23.9
48
Kashim
pur
ESE
7.5
64.0
25.5
13.9
17.6
0.7
18 0.4
30 1.7
38
2.4
61 64.7
18 2
5.9
30 15.6
38 20.0
95
Zahirabad
SSE
6.3
90.0
40.6
18.8
23.8
0.0
38 0.0
22 0.0
97
0.1
34 90.0
38 4
0.6
22 18.9
31 23.9
67
Koth
uru
(B)
NE
1.5
70.0
32.1
14.8
20.0
0.1
72 0.0
94 0.4
71
0.6
18 70.1
72 3
2.1
94 15.3
05 20.6
51
Reja
ital
NN
E
4.8
69.0
35.6
14.1
19.8
0.0
32 0.0
15 0.1
00
0.1
21 69.0
32 3
5.6
15 14.2
00 19.9
54
Baru
r SE
4.3
67.0
33.5
17.0
19.7
0.2
78 0.1
68 0.6
67
0.9
53 67.2
78 3
3.6
68 17.6
67 20.6
86
Gangw
ar
NN
W
5.1
0
65.0
36.6
15.8
19.8
0.1
72 0.1
05 0.4
09
0.5
90 65.1
72 3
6.7
05 16.2
43 20.4
23

Additional information Deccan Remedies Limited
Pridhvi Envirotech (P) Limited. 21
Figure1.3 Isopleths Showing 24 Hourly GLC’s of PM10 for the
study period May 2017

Additional information Deccan Remedies Limited
Pridhvi Envirotech (P) Limited. 22
Isopleths Showing 24 Hourly GLC’s of PM10 for the study period
October to December 2015

Additional information Deccan Remedies Limited
Pridhvi Envirotech (P) Limited. 23
Figure 1.4 Isopleths Showing 24 Hourly GLC’s of PM2.5 for the study period May 2017

Additional information Deccan Remedies Limited
Pridhvi Envirotech (P) Limited. 24
Isopleths Showing 24 Hourly GLC’s of PM2.5 for the study period October to December 2015

Additional information Deccan Remedies Limited
Pridhvi Envirotech (P) Limited. 25
Figure 1.5 Isopleths Showing 24 Hourly GLC’s of SO2 for the Study period May 2017

Additional information Deccan Remedies Limited
Pridhvi Envirotech (P) Limited. 26
Figure 1.6 Isopleths Showing 24 Hourly GLC’s of SO2 for the Study period October to December 2015

Additional information Deccan Remedies Limited
Pridhvi Envirotech (P) Limited. 27
Figure 1.7 Isopleths Showing 24 Hourly GLC’s of NOX for study period May 2017

Additional Information Deccan Remedies Limited
Pridhvi Envirotech (P) Limited. 28
Figure 1.8 Isopleths Showing 24 Hourly GLC’s of NOX for study period October to December 2015
Additional Information Deccan Remedies Limited
Pridhvi Envirotech (P) Limited. 29
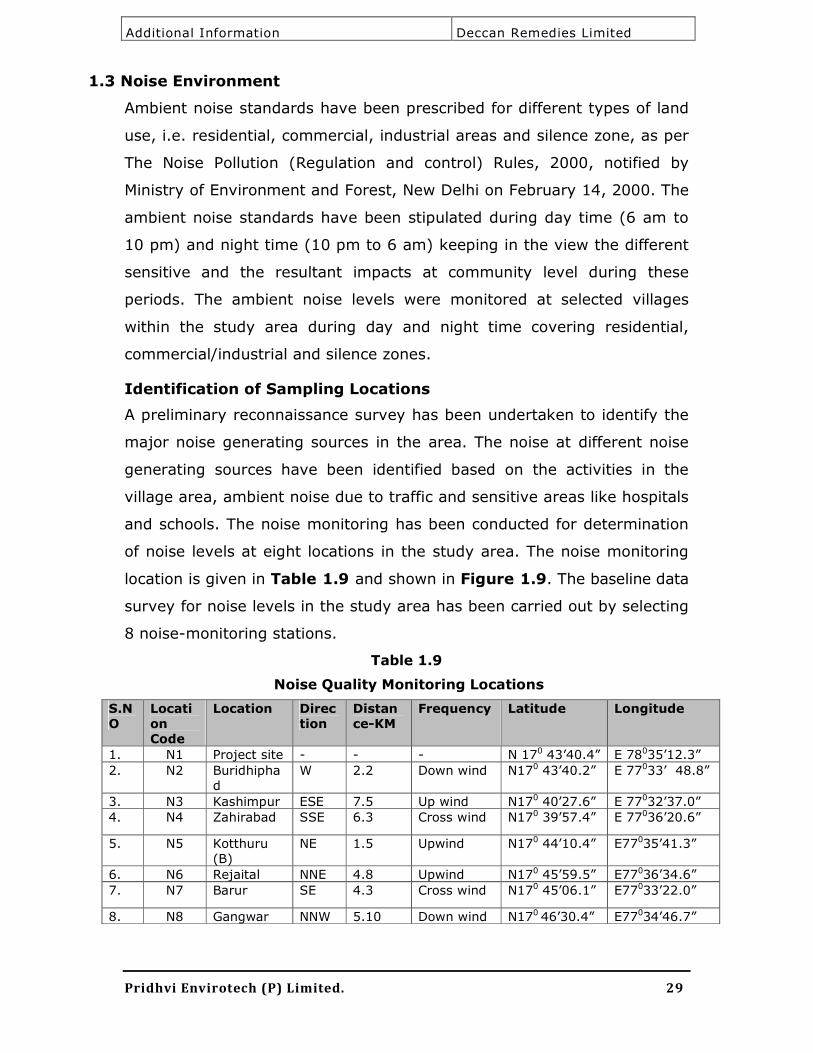
1.3 Noise Environment
Ambient noise standards have been prescribed for different types of land
use, i.e. residential, commercial, industrial areas and silence zone, as per
The Noise Pollution (Regulation and control) Rules, 2000, notified by
Ministry of Environment and Forest, New Delhi on February 14, 2000. The
ambient noise standards have been stipulated during day time (6 am to
10 pm) and night time (10 pm to 6 am) keeping in the view the different
sensitive and the resultant impacts at community level during these
periods. The ambient noise levels were monitored at selected villages
within the study area during day and night time covering residential,
commercial/industrial and silence zones.
Identification of Sampling Locations
A preliminary reconnaissance survey has been undertaken to identify the
major noise generating sources in the area. The noise at different noise
generating sources have been identified based on the activities in the
village area, ambient noise due to traffic and sensitive areas like hospitals
and schools. The noise monitoring has been conducted for determination
of noise levels at eight locations in the study area. The noise monitoring
location is given in Table 1.9 and shown in Figure 1.9. The baseline data
survey for noise levels in the study area has been carried out by selecting
8 noise-monitoring stations.
Table 1.9
Noise Quality Monitoring Locations
S.N
O
Locati
on
Code
Location Direc
tion
Distan
ce-KM
Frequency Latitude Longitude
1. N1 Project site - - - N 170 43’40.4” E 78035’12.3”
2. N2 Buridhipha
d
W 2.2 Down wind N170 43’40.2” E 77033’ 48.8”
3. N3 Kashimpur ESE 7.5 Up wind N170 40’27.6” E 77032’37.0”
4. N4 Zahirabad SSE 6.3 Cross wind N170 39’57.4” E 77036’20.6”
5. N5 Kotthuru
(B)
NE 1.5 Upwind N170 44’10.4” E77035’41.3”
6. N6 Rejaital NNE 4.8 Upwind N170 45’59.5” E77036’34.6”
7. N7 Barur SE 4.3 Cross wind N170 45’06.1” E77033’22.0”
8. N8 Gangwar NNW 5.10 Down wind N170 46’30.4” E77034’46.7”

Additional Information Deccan Remedies Limited
Pridhvi Envirotech (P) Limited. 30
Baseline noise levels have been monitored at different points within the
study area of 10 km radius with the proposed power plant site using a
spot noise measurement device.
The hourly noise levels under the daytime and night time were processed
to arrive at equivalent values. The day levels of noise have been
monitored during 6 AM to 10 PM and the night levels during 10 PM to 6
AM. The Noise levels are given in following Table 1.10.
Fig. 1.9 Noise Sampling Locations

Additional Information Deccan Remedies Limited
Pridhvi Envirotech (P) Limited. 31
Table 1.10
Equivalent Noise levels in the Study Area
S.No. Location
Equivalent Noise Levels dB(A)
May 2017 October 2015 to December 2015
Leq day Leq day Leq day Leq day
1. Project site 49.7 49.7 64.4 60.5
2. Buridhiphad 49.7 49.7 53.4 42.3
3. Kashimpur 49.3 49.3 54.2 41.4
4. Zahirabad 56.2 56.2 62.1 55.6
5. Kotthuru (B) 48.4 48.4 52.8 42.5
6. Rejaital 49.7 49.7 50.6 44.2
7. Barur 49.2 49.2 53.2 43.7
8 Gangwar 49.9 49.9 51.7 42.6
1.3.1 Observations for the month of May 2017
The noise data reveals that the values were well within the standards. In
the study area maximum value 64.3 dB (A) was observed at Zaherabad
minimum value 38.2 dB (A) was observed at Barur village. All remaining
stations are under residential category and all the noise levels are well
within the CPCB prescribed standards as shown in Table 1.11.
Table 1.11
Ambient Noise Standards
Area
Code
Category of
Area/Zone
Limits in dB(A) Leq*
Day Time Night Time
A Industrial Area 75 70
B Commercial Area 65 55
C Residential Area 55 45
D Silence Zone 50 40
1.4 Water Environment
The impacts on water environment form part of proposed bulk drug unit
i.e. stress on water resources as (continuous drawl of water). These
impacts may be related to either or both; surface and groundwater
resources in the project area depending on the specific situation. To
address these issues it is necessary to take a stock of available water
resources in project area with respect to their existing quality as well as
their supportive capacity to represent the baseline status of water

Additional Information Deccan Remedies Limited
Pridhvi Envirotech (P) Limited. 32
environment as part of impact assessment study for a proposed Bulk
drug unit.
The existing water resources, both surface and groundwater are identified
through reconnaissance within the study area (10 km radial distance)
around project site. These locations are selected to assess the existing
status of water quantity of impact zone. Water sample analysis with
respect to physico-chemical and bacteriological parameters having
relevance to public health and aesthetic significance are selected to
assess the water quantity status.
Baseline Data
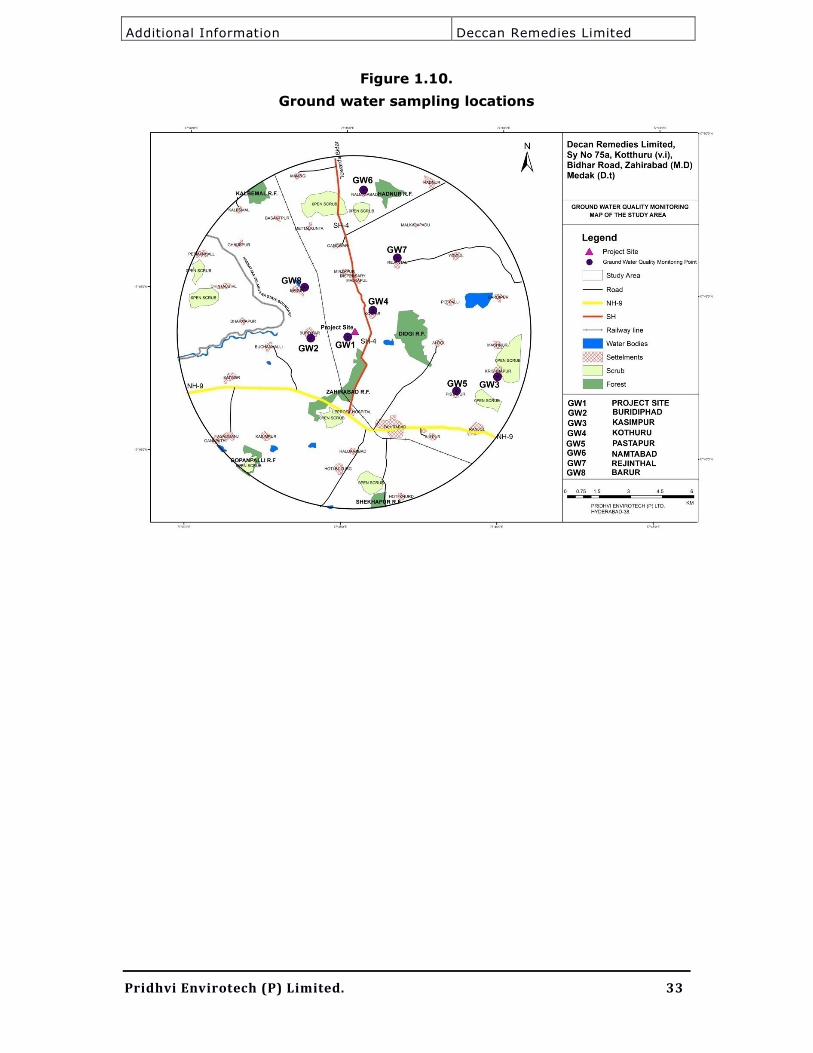
Hand pumps and open dug wells are the major sources of drinking water
in the study area. Nine ground water samples and five surface water
samples were collected and subjected to detailed analysis. Water
sampling locations are shown in Figure 1.10. The details of the locations
and distances from the study area are presented in the Table 1.12. The
water quality of the study area is presented in Table 1.13 to Table
1.16.
Table 1.12 Ground Water sampling locations
S.no Locatio
n Code Location Name
Directio
n
w.r.t.
Plant
Sample Source
1 GW1 Project Site - Ground water
2 GW2
Buridipadu W Ground water
3 GW3
Kasimpur ESE Ground water
4 GW4
Kothuru NE Ground water
5 GW5
Pastapur Ground water
6 GW6
Namatabad Ground water
7 GW7
Rejinthal NNE Ground water
8 GW8
Barur SE Ground water
Surface Water Sampling Stations
1 SW1 Narinja Vagu near Kothuru(B)
Additional Information Deccan Remedies Limited
Pridhvi Envirotech (P) Limited. 33
Figure 1.10.
Ground water sampling locations

Addit
ional
Info
rmati
on
Deccan R
em
edie
s L
imit
ed
Pr
idh
vi
En
vir
ote
ch
(P
) L
imit
ed
.
3
4
Tab
le –
1.1
3 S
um
mary o
f G
rou
nd
Wate
r Q
uality
An
aly
sis
Resu
lts f
or t
he M
on
th o
f M
ay 2
01
7
S.N
o.
PA
RA
ME
TER
Pro
ject
Sit
e
Kasim
pu
r
Pasta
pu
r N
an
tab
ad
Bu
rid
ipah
ad
Reji
nth
al
Baru
r K
oth
uru
(B
)
Accep
tab
le
lim
it a
s p
er
IS
:10
50
0 -
20
12
1
Colo
r (
Hazen u
nits)
<
01
02
<01
<01
<01
<01
<01
<01
5 m
ax
2
Odour
agre
eable
agre
eable
agre
eable
agre
eable
agre
eable
agre
eable
agre
eable
agre
eable
Agre
eable
3
Turb
idity (
NTU
)
0.8
0
1.3
0
0.4
0
0.1
0
0.2
0
<0.1
0
0.1
0
0.1
1 m
ax
4
pH
7.2
8.4
5
8.9
0
7.8
6
9.0
6
7.8
1
7.9
4
7.7
6.5
0 -
8.5
0
5
Taste
agre
eable
agre
eable
agre
eable
agre
eable
agre
eable
agre
eable
agre
eable
agre
eable
Agre
eable
6
E.C
(m
icro
mhos/c
m)
476
352
314
490
381
436
451
437
--
7
Tota
l dis
solv
ed s
olids
297
205
180
316
236
274
283
274
500 m
ax
8
Phenolp
thale
ne
alk
alinity a
s C
aCo3
Nil
11
30
Nil
22
Nil
Nil
Nil
--
9
Meth
ylo
range
alk
alinity a
s C
aCo3
118
75
48
121
72
108
111
107
---
10
Tota
l alk
alinity a
s
CaCo3
118
86
78
121
94
108
111
107
200 m
ax
11
Tota
l hard
ness a
s
CaCo3
113
55
49
77
90
69
71
68
200
max
12
Calc
ium
as C
a
32
13
15
14
26
17
20
19
75 m
ax
13
Magnesiu
m
as
Mg
8.0
3
5.4
7
2.8
0
10.2
6.0
8
6.4
5
5.1
0
4.9
30 m
ax
14
Sodiu
m
as N
a
57
53.9
47
75
46
67
69
66.9
--
15
Pota
ssiu
m
as K
2.1
3
2.9
4
2.6
2
4.1
1.7
0
3.6
5
3.7
7
3.6
5
--
16
Copper
as C
u
<0.0
1
0.0
3
0.0
25
0.0
51
<0.0
1
0.0
7
0.0
3
0.0
3
0.0
5 m
ax
17
Iro
n
as F
e
0.1
5
0.2
8
0.4
0.3
2
0.2
4
0.4
0.5
6
0.5
4
0.3
max
18
Manganese
as M
n
<0.0
1
<0.0
1
<0.0
1
<0.0
1
<0.0
1
<0.0
1
<0.0
1
<0.0
1
0.1
max
19
Chlo
rides a
s C
l 48
36
32
50
39
45
46
44.6
250 m
ax
20
Sulp
hate
s
as S
O4
37
28
24
38.0
0
30
34
35
33.9
200 m
ax
21
Nitra
tes
as N
O3
15.7
11.5
0
10.3
5
16.1
5
12.6
14.4
0
14.9
0
14.4
45 m
ax
22
Flo
urides a
s F
0.5
8
0.8
1
0.9
6
1.0
4
0.7
1
0.9
3
1.2
1.1
1.0
max
23
Phenolic
com
pounds
as C
6H
5O
H
<0.0
1
<0.0
1
<0.0
1
<0.0
1
<0.0
1
<0.0
1
<0.0
1
<0.0
1
0.0
01 m
ax

Addit
ional
Info
rmati
on
Deccan R
em
edie
s L
imit
ed
Pr
idh
vi
En
vir
ote
ch
(P
) L
imit
ed
.
3
5
24
Merc
ury
as H
g
<0.0
01
<0.0
01
0.0
02
<0.0
01
<0.0
01
<0.0
01
<0.0
01
<0.0
01
0.0
01 m
ax
25
Cadm
ium
a
s C
d
<0.0
1
<0.0
1
0.0
4
<0.0
1
<0.0
1
<0.0
1
<0.0
1
<0.0
1
1 m
ax
26
Alu
min
um
as A
I <
0.0
1
<0.0
1
0.0
6
<0.0
1
<0.0
1
<0.0
1
<0.0
1
<0.0
1
0.0
03 m
ax
27
Barium
as B
a
<0.0
1
<0.0
1
0.0
3
<0.0
1
<0.0
1
<0.0
1
<0.0
1
<0.0
1
0.7
0 m
ax
28
Boro
n a
s B
0.7
4
0.6
2
0.5
0
0.8
6
0.4
0.9
3
0.7
2
0.6
9
0.5
max
29
Sele
niu
m as S
e
<0.0
1
<0.0
1
0.0
1
<0.0
1
<0.0
1
<0.0
1
<0.0
1
<0.0
1
0.0
1 m
ax
30
Cyanid
e as C
N
N
D
ND
N
D
ND
N
D
ND
N
D
ND
0.0
5 m
ax
31
Lead as P
b
<0.0
1
<0.0
1
<0.0
1
<0.0
1
<0.0
1
<0.0
1
<0.0
1
<0.0
1
0.0
1 m
ax
32
Zin
c
as Z
n
0.0
5
0.0
2
0.0
16
0.1
3
0.0
3
0.1
7
0.2
1
0.2
1
5.0
max
33
Anio
nic
Dete
rgents
as M
BAS
ND
N
D
ND
N
D
ND
N
D
ND
N
D
0.2
max
34
Fre
e R
esid
ual Chlo
rine
Nil
Nil
Nil
Nil
Nil
Nil
Nil
Nil
0.2
min
imum
35
Pesticid
es
N
D
ND
N
D
ND
N
D
ND
N
D
ND
Absent
36
Silver
as Ag
ND
N
D
ND
N
D
ND
N
D
ND
N
D
0.1
max
37
Min
era
l O
il
ND
N
D
ND
N
D
ND
N
D
ND
N
D
0.5
max
38
Tota
l Chro
miu
m as
Cr+
6
<0.0
1
<0.0
1
0.0
3
<0.0
1
<0.0
1
<0.0
1
<0.0
1
<0.0
1
0.0
5 m
ax
39
Poly
nucle
ara
rom
atic
Hydro
carb
ons a
s P
AH
ND
N
D
ND
N
D
ND
N
D
ND
N
D
0.0
001 m
ax
Bacte
rio
log
ical p
aram
ete
rs
1
Tota
l Pla
te C
ount/
ml
126
95
103
149
87
138
116
112
--
2
MPN
of
Colifo
rm/1
00m
l
09
04
12
07
05
02
10
10
Absent
3
MPN
of
E-C
oli/1
00m
l Pre
sent
Pre
sent
Pre
sent
Pre
sent
Absent
Pre
sent
Pre
sent
Pre
sent
Absent

Addit
ional
Info
rmati
on
Deccan R
em
edie
s L
imit
ed
Pr
idh
vi
En
vir
ote
ch
(P
) L
imit
ed
.
3
6
Tab
le N
o.1
.14
Grou
nd
wate
r q
uality
fo
r t
he s
tud
y p
erio
d O
cto
ber 2
01
5 t
o D
ecem
ber 2
01
5
S.N
o
PA
RA
METE
R
Pro
ject
sit
e
Bu
rid
ipad
u
Kasim
pu
r
Ko
thu
ru
P
asta
pu
r
Nam
ata
ba
d
Reji
nth
al
Baru
r
1
Colo
r (
Hazen u
nits)
Nil
01
02
01
03
Nil
Nil
04
2
Odour
agre
eable
Agre
eable
Agre
eable
agre
eable
agre
eable
agre
eable
agre
eable
Agre
eable
3
Turb
idity (
NTU
) 4.6
0
1.1
0
1.9
0
2.1
0
1.5
0
0.8
0
1.3
0
0.6
4
pH
6.7
1
6.9
4
7.1
5
8.2
7
7.0
3
7.5
9
7.6
2
6.9
4
5
Taste
agre
eable
Agre
eable
Agre
eable
agre
eable
agre
eable
agre
eable
Agre
eable
Agre
eable
6
E.C
(m
icro
mhos/c
m)
425
417
438
383
1,5
72
402
371
1525
7
Tota
l dis
solv
ed s
olids
268
246
267
230
1,0
26
245
219
995
8
Phenolp
thale
ne
alk
alinity a
s C
aCo3
Nil
Nil
Nil
Nil
Nil
Nil
Nil
Nil
9
Meth
ylo
range
alk
alinity
as C
aCo3
105
101
108
94
248.4
0
99
90
241
10
Tota
l alk
alinity
as
CaCo3
105
101
108
94
248.4
0
99
90
241
11
Tota
l hard
ness
as
CaCo3
102
64
69
60
471
63
57
457
12
Calc
ium
as C
a
27
17
21
16
76
19
15
74
13
Magnesiu
m as M
g
8.3
9
5.2
3
4.0
2
4.8
6
68.3
0
3.7
7
4.7
4
66.1
1
14
Sodiu
m
as N
a
51
62.7
1
67.0
8
58.6
1
109
61.5
4
55.8
1
106
15
Pota
ssiu
m
as K
1.9
0
3.4
2
3.6
6
3.2
0
61
3.3
6
3.0
4
59
16
Copper
as C
u
<
0.0
1
<0.0
1
0.0
3
<0.0
1
0.0
6
0.0
2
<0.0
1
0.0
6
17
Iro
n as F
e
0.0
8
0.1
3
0.1
6
0.1
2
0.2
3
0.1
5
0.1
1
0.2
0
18
Manganese a
s M
n
<0.0
1
<0.0
1
0.0
1
<0.0
1
0.0
5
0.0
1
<0.0
1
0.0
4
19
Chlo
rides
as C
l 43
42
44.6
4
39
252
40.9
5
37
244
20
Sulp
hate
s a
s S
O4
33
32
34.3
4
30
152.9
6
31.5
0
28
148.3
7
21
Nitra
tes
as N
O3
14
13.4
8
14.4
2
12.6
0
27.6
0
13.2
3
12
26.7
7
22
Flo
uri
des a
s F
0.3
0
0.4
6
0.4
0
0.4
2
0.8
5
0.3
7
0.3
8
0.7
8
23
Phenolic
com
pounds
as C
6H
5O
H
<0.0
1
<0.0
1
<0.0
1
<0.0
1
<0.0
1
<0.0
1
<0.0
1
<0.0
1

Addit
ional
Info
rmati
on
Deccan R
em
edie
s L
imit
ed
Pr
idh
vi
En
vir
ote
ch
(P
) L
imit
ed
.
3
7
24
Merc
ury
as H
g
<0.0
01
<0.0
01
<0.0
01
<0.0
01
0.0
02
<0.0
01
<0.0
01
0.0
01
25
Cadm
ium
as C
d
<0.0
1
<0.0
1
<0.0
1
<0.0
1
0.0
4
<0.0
1
<0.0
1
<0.0
1
26
Alu
min
imum
as A
l <
0.0
1
<0.0
1
<0.0
1
<0.0
1
0.0
6
<0.0
1
<0.0
1
<0.0
1
27
Bari
um
as B
a
<0.0
1
<0.0
1
<0.0
1
<0.0
1
0.0
3
<0.0
1
<0.0
1
<0.0
1
28
Borr
on a
s B
0.6
2
0.5
8
0.8
0
0.5
5
0.8
0
0.7
3
0.7
1
0.5
6
29
Sele
niu
m a
s S
e
<0.0
1
<0.0
1
<0.0
1
<0.0
1
0.0
1
<0.0
1
<0.0
1
<0.0
1
30
Cyanid
e a
s C
N
N
D
ND
N
D
ND
N
D
ND
N
D
ND
31
Lead a
s P
b
<0.0
1
<0.0
1
<0.0
1
<0.0
1
0.0
9
<0.0
1
0.0
7
<0.0
1
32
Zin
c a
s Z
n
0.0
3
0.0
5
0.0
9
0.0
5
0.1
3
0.0
8
0.1
2
0.0
4
33
Anio
nic
D
ete
rgents
as M
BAS
ND
N
D
ND
N
D
ND
N
D
ND
N
D
34
Fre
e
Resid
ual
Chlo
rine
as c
l2
Nil
Nil
Nil
Nil
Nil
Nil
Nil
Nil
35
Pesticid
es
ND
N
D
ND
N
D
ND
N
D
ND
N
D
36
Silver
as A
g
ND
N
D
ND
N
D
ND
N
D
ND
N
D
37
Min
era
l O
il
ND
N
D
ND
N
D
ND
N
D
ND
N
D
38
Hexavale
nt
Chro
miu
m a
sC
r+6
<0.0
1
<0.0
1
<0.0
1
<0.0
1
0.0
3
<0.0
1
0.0
2
<0.0
1
39
Poly
nucle
ar
aro
matic
Hydro
carb
ons a
s P
AH
:
ND
N
D
ND
N
D
ND
N
D
ND
N
D
B
acte
rio
log
ical P
aram
ete
rs
1
Tota
l Pla
te C
ount/
ml
94
118
134
110
156
125
147
166
2
MPN
of
Colifo
rm/1
00m
l
06
06
12
02
10
04
08
14
3
MPN
of
E-C
oli/1
00m
l Absent
Absent
Absent
Absent
Absent
Absent
Absent
Absent

Additional Information Deccan Remedies Limited
Pridhvi Envirotech (P) Limited. 38
Table –1.15 Summary of Surface Water Quality Analysis Results for the month of May 2017
S No PARAMETER Narija vagu
1 Color (Hazen units) 16
2 Odour disagreeable
3 Turbidity (NTU) 20
4 pH 7
5 BOD 1.1
6 DO 0.7
7 E.C (micromhos/cm) 742
8 Total dissolved solids 468
9 Phenolpthalene alkalinity as CaCo3 Nil
10 Methylorange alkalinity as CaCo3 216
11 Total alkalinity as CaCo3 216
12 Total hardness as CaCo3 266
13 Calcium as Ca 54
14 Magnesium as Mg 31.3
15 Sodium as Na 43
16 Potassium as K 8.8
17 Copper as Cu 0.06
18 Iron as Fe 0.18
19 Manganese as Mn 0.04
20 Chlorides as Cl 66.7
21 Sulphates as SO4 29
22 Nitrates as NO3 37.3
23 Flourides as F 0.58
24 Phenolic compounds as C6H5OH <0.001
25 Mercury as Hg 0.004
26 Cadmium as Cd 0.08
27 Aluminimum as A1 0.05
28 Barium 0.02
29 Boron 0.82
30 Seleniun as Se <0.01
31 Cyanide as CN ND
32 Lead as Pb 0.1
33 Zinc as Zn 0.2
34 Anionic Detergents as MBAS ND
35 Free Residual Chlorine Nil
36 Pesticides ND
37 Silver as Ag <0.01
38 Mineral Oil ND
39 Hexavalent Chromium as Cr+6 0.04
40 Polynuclear aromatic Hydrocarbons as PAH ND
Bacteriological Parameters 0
1 Total Plate Count/ml 266
2 MPN of Coliform/100ml 46
3 MPN of E-Coli/100ml 18

Additional Information Deccan Remedies Limited
Pridhvi Envirotech (P) Limited. 39
Table No: 1.16 Summary of Surface Water Quality Analysis Results for study period October 2015 to December 2015
S.No. PARAMETER
Kasimpur
Tank Yelgoie Tank
1 Color (Hazen units) 16 08
2 Odour disagreeable disagreeable
3 Turbidity (NTU) 21.6 49
4 pH 7.1 6.82
5 BOD 1.2 1.4
6 DO 0.7 0.8
7 E.C (micromhos/cm) 825 581
8 Total dissolved solids 520 352
9 Phenolpthalene alkalinity as CaCo3 Nil Nil
10 Methylorange alkalinity as CaCo3 241 174
11 Total alkalinity as CaCo3 241 174
12 Total hardness as CaCo3 296 140
13 Calcium as Ca 61 39
14 Magnesium as Mg 34.88 10.33
15 Sodium as Na 47.85 64.7
16 Potassium as K 9.8 7.83
17 Copper as Cu 0.07 0.05
18 Iron as Fe 0.21 0.16
19 Manganese as Mn 0.05 0.02
20 Chlorides as Cl 74.1 48
21 Sulphates as SO4 32.2 20
22 Nitrates as NO3 41.55 36
23 Flourides as F 0.65 0.58
24 Phenolic compounds as C6H5OH <0.001 <0.001
25 Mercury as Hg 0.005 0.003
26 Cadmium as Cd 0.09 0.05
27 Aluminimum as A1 0.06 0.02
28 Barium 0.03 0.01
29 Boron 0.92 0.84
30 Seleniun as Se <0.01 <0.01
31 Cyanide as CN ND ND
32 Lead as Pb 0.12 0.08
33 Zinc as Zn 0.2 0.13
34 Anionic Detergents as MBAS ND ND
35 Free Residual Chlorine Nil Nil
36 Pesticides ND ND
37 Silver as Ag <0.01 <0.01
38 Mineral Oil ND ND
39 Hexavalent Chromium as Cr+6 0.05 0.02
40 Polynuclear aromatic Hydrocarbons as PAH ND ND
Additional Information Deccan Remedies Limited
Pridhvi Envirotech (P) Limited. 40
Bacteriological Parameters
1 Total Plate Count/ml 296 380
2 MPN of Coliform/100ml 52 46
3 MPN of E-Coli/100ml 20 12
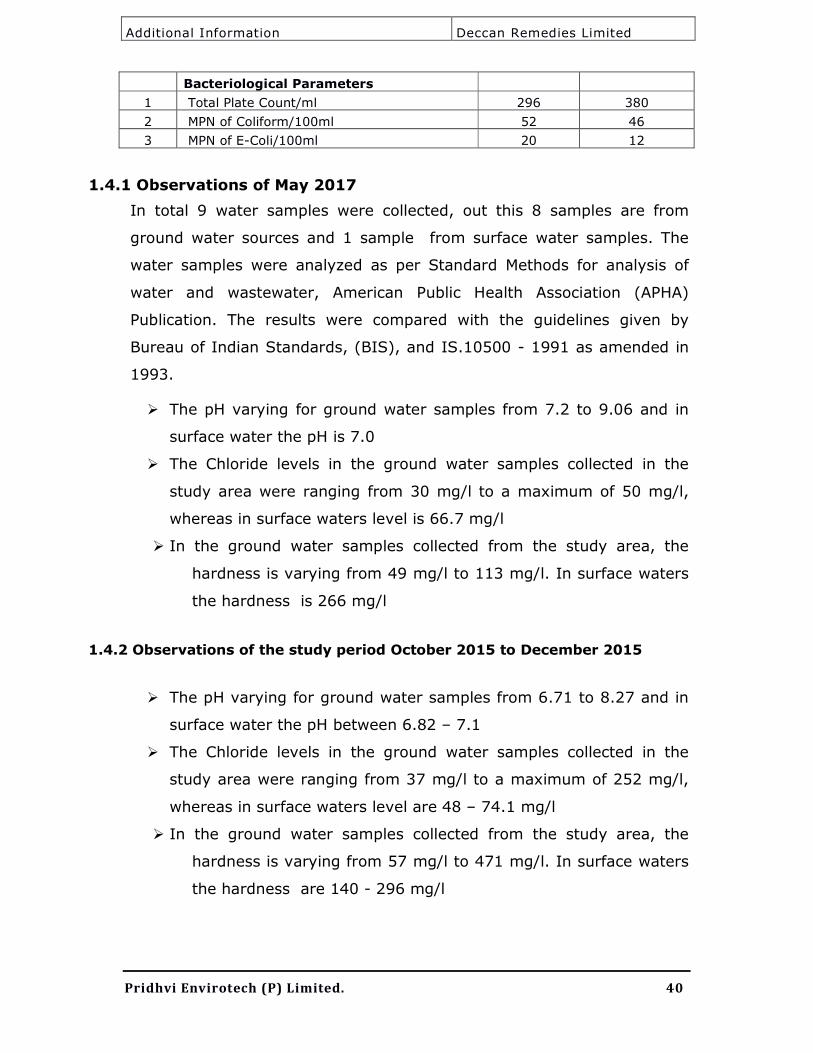
1.4.1 Observations of May 2017
In total 9 water samples were collected, out this 8 samples are from
ground water sources and 1 sample from surface water samples. The
water samples were analyzed as per Standard Methods for analysis of
water and wastewater, American Public Health Association (APHA)
Publication. The results were compared with the guidelines given by
Bureau of Indian Standards, (BIS), and IS.10500 - 1991 as amended in
1993.
� The pH varying for ground water samples from 7.2 to 9.06 and in
surface water the pH is 7.0
� The Chloride levels in the ground water samples collected in the
study area were ranging from 30 mg/l to a maximum of 50 mg/l,
whereas in surface waters level is 66.7 mg/l
� In the ground water samples collected from the study area, the
hardness is varying from 49 mg/l to 113 mg/l. In surface waters
the hardness is 266 mg/l
1.4.2 Observations of the study period October 2015 to December 2015
� The pH varying for ground water samples from 6.71 to 8.27 and in
surface water the pH between 6.82 – 7.1
� The Chloride levels in the ground water samples collected in the
study area were ranging from 37 mg/l to a maximum of 252 mg/l,
whereas in surface waters level are 48 – 74.1 mg/l
� In the ground water samples collected from the study area, the
hardness is varying from 57 mg/l to 471 mg/l. In surface waters
the hardness are 140 - 296 mg/l

Additional Information Deccan Remedies Limited
Pridhvi Envirotech (P) Limited. 41
1.5 Land Environment
Total 4 soil sampling locations were selected for physico-chemical
characteristics. The soil sampling locations are presented in Table 1.17
and its characteristics are presented in Table 1.18 and 1.19. The soil
sampling locations are shown in Figure 1.11.
Table 1.17
Location of Soil Sampling Stations
S No. Location Code
Location Name Direction w.r.t. Plant
1 S1 Project site --
2 S2 Buridipadu West
3 S3 Kothuru NE
4 S4 Rejental NNE
Fig 1.11 Soil Sampling Locations

Additional Information Deccan Remedies Limited
Pridhvi Envirotech (P) Limited. 42
Table –1.18
Physico-Chemical Characteristics of Soil for the month of May 2017
S.No Parameter Unit Project
site
Buridipad
u
Kothuru Rejantal
1 pH ( Soil water extract) 7.48 6.84 7.88 6.8
2 E.C ( Soil water extract) µmhos/cm 264 300 274 280
3 Nitrogen (as N) % 0.036 0.04 0.039 0.05
4 Bulk Density g/cc 1.34 1.29 1.36 1.3
5 Infiltration rate mm/hour 26 25 29 30
6 Porosity % 45 40 46 39
7 Moisture % 5.92 6.73 7.29 5.35
8 Cation-Exchange
capacity (CEC) Meq/100gm 4.1 6.47 6.16 6.82
9 Organic Matter % 1.5 1.08 1.28 1.16
10 Phosphorous (as P) mg/kg 47.1 37 41 33.9
11 Carbonates % Nil Nil Nil Nil
12 Potassium (As K+) Ppm 461 422 412 357
13 Sodium (as Na) Ppm 240 372 354 389
14 Calcium (as Ca) Ppm 269 289 313 278
15 Magnesium (as Mg2+) ppm 53 58.63 73.63 65.9
16 Chlorides(as Cl) ppm 299 306 305 272
17 Organic Carbon % 0.87 0.63 0.74 0.67
18
Texture Silty sand Silty Sand Silty sand
Silty
sand
19 a) Sand % % 24 28 31 34
20 b) Silt % % 45 49 44 44
21 c) Clay % % 31 23 25 22
22 Sodium Absorption ratio 5.9 8.55 6.24 9.02
23 Aluminium (as Al) Mg/Kg 0.02 0.06 0.035 0.027
24 Arsenic (as As) Mg/Kg <0.01 <0.01 <0.01 <0.01
25 Boron (as B) Mg/Kg 0.75 0.79 0.9 0.07
26 Cadmium (as Cd) Mg/Kg <0.01 0.03 0.01 0.04
27 Chromium (as Cr) Mg/Kg 0.08 0.04 0.06 0.03
28 Copper (as Cu) Mg/Kg 0.65 0.56 0.61 0.45
29 Iron (as Fe) Mg/Kg 0.82 0.9 0.74 0.83
30 Lead (as pb) Mg/Kg 0.29 0.33 0.31 0.25
31 Manganese ( as Mn) Mg/Kg 0.16 0.14 0.13 0.1
32 Mercury (as Hg) Mg/Kg <0.001 <0.001 <0.001 <0.001
33 Nickel (as Ni) Mg/Kg 0.2 0.13 0.11 0.14
34 Selenium (as Se) Mg/Kg <0.01 <0.01 <0.01 <0.01
35 Silver (as Ag) Mg/Kg <0.01 <0.01 <0.01 <0.01
36 Zinc ( as Zn) Mg/Kg 0.97 0.82 0.82 0.9

Additional Information Deccan Remedies Limited
Pridhvi Envirotech (P) Limited. 43
37 Available Phosphorous
as P2O5 Mg/Kg 82 65.7 74.2 84.4
38 Available Potassium K2O Mg/Kg 707.3 699 686 638.3
39 Base Saturation 16.8 16 15.6 14.8
40 Ca/mg Ratio 5.16 4.78 4.29 4.13
Table No.1.19 Soil Analysis Data for the study period October 2015 to
December 2015
S.No Parameter Unit Project
site
Buridipadu Kothuru Rejantal
1 pH ( Soil water
extract) 7.34
7.06 7.81 6.94
2 E.C ( Soil water
extract) µmhos/cm 259
310 272 286
3 Nitrogen (as N) % 0.036 0.042 0.039 0.051
4 Bulk Density g/cc 1.32 1.34 1.35 1.33
5 Infiltration rate mm/hour 26 26 29 31
6 Porosity % 45 42 46 40
7 Moisture % 5.81 6.94 7.22 5.46
8 Cation-Exchange
capacity (CEC) Meq/100gm 4.10 6.68 6.10 6.96
9 Organic Matter % 1.48 1.12 1.27 1.19
10 Phosphorous (as P) mg/kg 46.2 38.5 40.8 34.6
11 Carbonates % Nil Nil Nil Nil
12 Potassium (As K+) Ppm 452
436 408 365
13 Sodium (as Na) Ppm 236 384 351 397
14 Calcium (as Ca) Ppm 264 298 310 284
15 Magnesium (as
Mg2+) ppm 52.1
60.45 72.91 67.30
16 Chlorides(as Cl) ppm 294 316 302 278
17 Organic Carbon % 0.86 0.65 0.74 0.69
18
Texture
Silty
sand
Silty Sand Silty
sand
Silty
sand
19 a) Sand % % 24 29 31 35
20 b) Silt % % 45 48 44 45
21 c) Clay % % 31 23 25 20
22 Sodium Absorption
ratio 5.8
8.82 6.18 9.21
23 Aluminium (as Al) Mg/Kg 0.02 0.062 0.035 0.028
24 Arsenic (as As) Mg/Kg <0.01 <0.01 <0.01 <0.01
25 Boron (as B) Mg/Kg 0.74 0.82 0.90 0.08
26 Cadmium (as Cd) Mg/Kg <0.01 0.03 0.01 0.04
27 Chromium (as Cr) Mg/Kg 0.08 0.04 0.06 0.03
28 Copper (as Cu) Mg/Kg 0.65 0.58 0.61 0.46
29 Iron (as Fe) Mg/Kg 0.82 0.90 0.74 0.85
30 Lead (as pb) Mg/Kg 0.29 0.35 0.31 0.26

Additional Information Deccan Remedies Limited
Pridhvi Envirotech (P) Limited. 44
S.No Parameter Unit Project
site
Buridipadu Kothuru Rejantal
31 Manganese ( as Mn) Mg/Kg 0.16 0.14 0.13 0.10
32 Mercury (as Hg) Mg/Kg <0.001 <0.001 <0.001 <0.001
33 Nickel (as Ni) Mg/Kg 0.2 0.13 0.11 0.15
34 Selenium (as Se) Mg/Kg <0.01 <0.01 <0.01 <0.01
35 Silver (as Ag) Mg/Kg <0.01 <0.01 <0.01 <0.01
36 Zinc ( as Zn) Mg/Kg 0.96 0.85 0.82 0.90
37 Available Phosphorous as P2O5 Mg/Kg
80.4 67.8 73.5 86.20
38 Available Potassium K2O Mg/Kg 693.5
721.60 680.0 651.40
39 Base Saturation 16.5 17.2 15.46 15.15
40 Ca/mg Ratio 5.06 4.93 4.25 4.22
1.5.1 Observations of Soil Quality Data for may 2017
The pH of the soil is an important parameter; plants cannot grow in low
and high pH value. The normal range of the soil pH is 6.0 to 8.5. The pH
values in the study area are varying from 6.8- 7.88 indicating that the
soils are alkaline.
The electrical conductivity in the study area is varying from 264 - 300
µmhos. The organic carbon in the study area is varying from 0.63 – 0.87
%, Phosphorus is varying from 33.9 – 47.1 kg/ha ,Potassium in the study
area is varying between 357 - 461 kg/ha
1.5.2 Observations of Soil Quality Data for study period October 2015 to December 2015
The pH of soil samples ranges from Neutral to mildly alkaline. The cation
exchange capacity of the soils is very low in one sample & low in 3
samples contributed mainly by sodium exchangeable ions. The level of
nitrogen of the samples is very low while the potassium levels are high.
The base saturation of the samples is predominantly strongly leached.
The calcium magnesium ratios of the samples reflect calcium is balanced
in all samples. Bulk density of soil of impact varies from 1.32 – 1.35 g/cc.
The porosity values range from 31-47%. Soil texture is predominantly
silty sand.

Additional Information Deccan Remedies Limited
Pridhvi Envirotech (P) Limited. 45
2.0 Corporate Social Responsibility (CSR) Plan
A suggestive plan for developing the socio-economic environment in the
project impact area together with indicative budgets submitted earlier
along with EIA Report is presented below:
Activity Year wise Budgets (Rs. Lakhs)
1 2 3 4 5 Total
1. Health Camps 3.0 3.5 4.0 4.5 5.0 20.0
2. Vocational Skill
Development
Programmes
3.0 3.0 4.0 4.0 5.0 19.0
3. Entrepreneurship
Camps 1.0 2.0 2.0 2.0 2.0 9.0
4. Contributing to
neighbourhood
cleanliness under
“Swachh Bharat”
mission
2.0 2.5 3.0 3.5 4.0 15.0
Total 9.0 11.0 13.0 14.0 16.0 63.0
As per the recommendations of the EAC we are submitting revised CSR
Plan for providing facilities in the three proximity villages- Kothur (B)
Village, Buridipadu Village and Didigi Village.
2.1 Revised CSR Plan:
Total cost of the project is Rs. 12.4 Crores out of which Rs. 31.0 Lakhs
(2.5% of total project cost) is allocated for CSR Activities over a period of
5 years as per the recommendations of EAC In addition to Rs. 63.0 lakhs
as per the suggestive plan for CSR activities submitted along with EIA
Report.
A supplementary plan for corporate social responsibility in the 3 villages
together with indicative budgets is presented below:
Activity Year wise Budgets (Rs. Lakhs)
1 2 3 4 5 Total
1. Installation of
Solar Street Lights 4.0 4.0 4.0 0.5* 0.5* 13

Additional Information Deccan Remedies Limited
Pridhvi Envirotech (P) Limited. 46
(60) in 3
surrounding villages
2. Installation of RO drinking water
plants (3) in 3 surrounding
villages
7.5 1.5* 1.5* 1.5* 1.5* 13.5
3. Plantation of 1000
perennial Native trees
2.1 0.6* 0.6* 0.6* 0.6* 4.5
Total 13.6 6.1 6.1 2.6 2.6 31.0
*maintenance costs
2.2. Plan for regular testing of ground water through lab accredited
by the Ministry for ensuring decontaminated agricultural water
supply.
We have already allocated budget for post monitoring in the EIA Report in
chapter 6. Ground water quality will be monitored quarterly in 4 locations
and surface water quality will be monitored in 2 locations as detailed
below.
Monitoring plan for water quality
S.No Sample location Frequency Unit cost INR
Total Cost/ Annum INR
1 Ground water Quarterly 3000 48,000
Plant site
Didigi Village
Kothur (B) Village
Buridipadu Village
2 Surface water Quarterly 3000 24,000
Narinja vagu
Kasimpur
Total 72,000

ANNEXURE I
Minutes of EAC Meeting

Minutes of the 21th
Expert Appraisal Committee (Industry-2) meeting held during 27th
to
29th
March, 2017 at Brahmaputra Hall, Vayu Wing, Ministry of Environment, Forest and
Climate Change, Indira Paryavaran Bhawan, New Delhi -110003.
Time : Meeting held at 10: 00 AM
21.1 Opening Remarks of the Chairman
21.2. Confirmation of the Minutes of the 20th
Meetings of the EAC (Industry-2) held on
27th
to 28th
February, 2017 at New Delhi.
21.2.1 Reconsideration of the proposal “ Environmental Clearance for exploratory drilling
in L-I PML, Kuthalam, PML, Kali, and Greater Kali PML and Neyveli PML IN
Kauvery Basin , Tamil Nadu by M/s. ONGC- Environmental Clearance
The Member Secretary informed that the above mentioned proposal has been
considered by the EAC in its 3rdmeeting held during 18-19th
January 2016. The committee
during the said EAC meeting recommended for PH exemption in four districts viz. Nagapattinam,
Ariyalur, Thanjavur and Tiruvarur, wherein 21 wells of the proposed project are located. The
EAC also recommended for grant of Environmental Clearance for these 21 exploratory wells.
The Member Secretary further informed the EAC that the Ministry has decided to place
the proposal before the EAC to reconsider the recommendations and justify the reasons for giving
public hearing exemption in aforesaid four (4) districts.
The EAC discussed the issue with the ONGC officials who were present in the meeting
for other proposals of ONGC. After examining the facts the EAC decided to seek information
from the PP on following points:
1. The district and year- wise details of public hearings held earlier.
2. The distance between proposed wells and earlier wells for which public hearing has already
been held in referred four districts.
3. Public agitation against the project.
27th
March, 2017 (Day 1)
21.3 (Environmental Clearance)
21.3.1
Expansion of existing Sugar Plant (4500 TCD to 7500 TCD), Cogeneration unit (18 MW to
36 MW) and establishment of distillery (60 KLPD) with installation of incineration boiler to
generate 3 MW power at Sy No 413 & 443, Hirenandi Village, Gokak Taluk, Belgaum

The EAC has deliberated on the proposal and the public hearing report. The committee found the
AAQ data satisfactory. The EAC has noted the issues raised in the public hearing are employment,
ground water contamination, loss of crop due to pollution, validity of baseline data, drinking water
etc. The EAC has noted that the issues came out during the public hearing are serious and desired
to have a field visit by the EAC sub-committee. The EAC also desired that the PP shall comply
with the direction issued by SPCB in CFO/CTO to the existing unit and submit a report in this
regard.
Considering the above facts, the EAC decided to defer the proposal till the submission of
above information/documents by the PP and conduct of site visit by the sub-committee of
EAC.
21.3.3
Bulk Drugs & Drugs Intermediates (2400 TPA) Manufacturing Unit at Sy. No. 75 (A),
Kothur-B Village, Bidar Road, Zaheerabad (M), Sangareddy District (Formerly Medak),
Telangana by M/s Deccan Remedies Limited- Environmental
Clearance[IA/TG/IND2/31166/2015, J-11011/276/2015-IA II (I)]
The Project Proponent and the accredited consultant M/s Pridhvi Envirotech (P) Ltd.,
Hyderabadgave a detailed presentation on the salient features of the project and informed that:
1. The proposal is forBulk Drugs & Drugs Intermediates (2400 TPA) Manufacturing Unit at
Sy. No. 75 (A), Kothur-B Village, Bidar Road, Zaheerabad (M), Sangareddy District
(Formerly Medak), Telangana by M/s Deccan Remedies Limited.
2. All Synthetic Organic Chemicals Industry located outside the notified industrial area/estate
are listed at S.N. 5(f) of Schedule of Environmental Impact Assessment (EIA) Notification
under Category ‘A’ and is appraised at Central Level by Expert Appraisal Committee
(EAC).
3. The project proposal was considered by the Expert Appraisal Committee (Industry-2) in its
3rd
meeting held during 18th
– 19th
January 2016 and recommended Terms of References
(TORs) for the Project. The TOR has been issued by Ministry vide letter dated 5th
March,
2016.
4. The land area is 31.8 acres. The PP will develop Greenbelt in 33% of the total area. The
estimated project cost is Rs. 12.4 crores. Total capital cost earmarked towards
environmental pollution control measures is Rs. 2.5 crores and the recurring cost
(operation and maintenance) will be about Rs. 85 lakhs per annum. The proposed project
will provide employment to 100 persons. The PP proposes to allocate Rs. 63 lakhs @ of 5
% towards Corporate Social Responsibility.
5. It is reported that there are no national parks, wildlife sanctuaries, Biosphere Reserves,
Tiger/ Elephant Reserves, Wildlife Corridors etc. lies within 10km distance from the
project site. There are 6 Reserve Forests located within 10 KM radius of the project site,
viz. Zahirabad RF (0.77 KM), Didgi R.F (2.57km East), Hadnur R.F (7.54km North East),
Karbemal R.F (8.91km North West), Gopanpalli R.F (8.38km South West) and Shekhapur
R.F(8.95km south). Narinja vagu a surface water body is within 10 KM distance from the
project site.

6. The Ambient air quality monitoring was carried out at 8 locations during October 2015 -
January 2016 and the baseline data indicates the ranges of concentration as: PM10 ( 46.1-
85.0 µg/m3), PM2.5 (20.4-35.3 µg/m
3), SO2 ( 7.3-16.6 µg/m
3) and NO2 ( 13.0-19.4 µg/m
3)
respectively. AAQ modeling study for point source emissions indicated that the maximum
incremental GLCs after the proposed project would be 0.816 µg/m3, 2.097 µg/m
3 and
2.484 µg/m3 with respect to PM10, SOx and NOx. The resultant concentrations are within
the National Ambient Air Quality Standards (NAAQS).
7. The total water requirement is 174.6 m3/day of which fresh water requirement of 114.1
m3/day and will be met from ground water.
8. Treated effluent of 60.5 KLD will be reused out of total effluent of 87.7 KLD will be
treated through Stripper, MEE and ATFD for high TDS Stream and Low TDS will be
treated in Biological ETP followed by RO system. The plant will be based on Zero Liquid
discharge system.
9. Power requirement for the proposed project will be – 1000 KVA and will be met from
state power distribution corporation limited (TSCPDCL). 1 X 500 KVA DG Set will be
used as standby during power failure. Stack (height 10 m) will be provided as per CPCB
norms to the proposed DG set which will be used as standby during power failure.
10. 0.5 TPH Diesel fired boiler and 5 TPH Coal fired boiler will be installed. Multi cyclone
separator/ bag filter with a stack of height of 6 m for 0.5 TPH Boiler and 20 m for 5 TPH
Boiler will be installed for controlling the Particulate emissions (within statutory limit of
115mg/Nm3).
11. The process emissions generation is 227.6 kgs/day which are scrubbed through double
stage scrubbers.
12. The solid waste/ Hazardous waste generation and its management are as below:
S. No Description of
Waste
HW
Category No.
as per rules
Unit
Quantity
generated Disposal Option
Hazardous waste
1 Forced
Evaporation Salts
34.3 TPM 108.3 TSDF, HWMP,
Dundigal
2 Process Inorganic
Salts
28.1 TPM 0.05 TSDF, HWMP,
Dundigal
3 ETP Sludge 34.3 TPM 3.0 Cement Units/TSDF,
HWMP, Dundigal
4 Process organic
residues
28.3 TPM 65.08 Cement Units/TSDF,
HWMP
5 Spent Carbon 28.2 TPM 1.74 Cement Units /TSDF,
HWMP
6 Distillation Bottom
Residue
36.4 TPM 1.5 Cement Units/TSDF,
HWMP, Dundigal
Non Hazardous waste
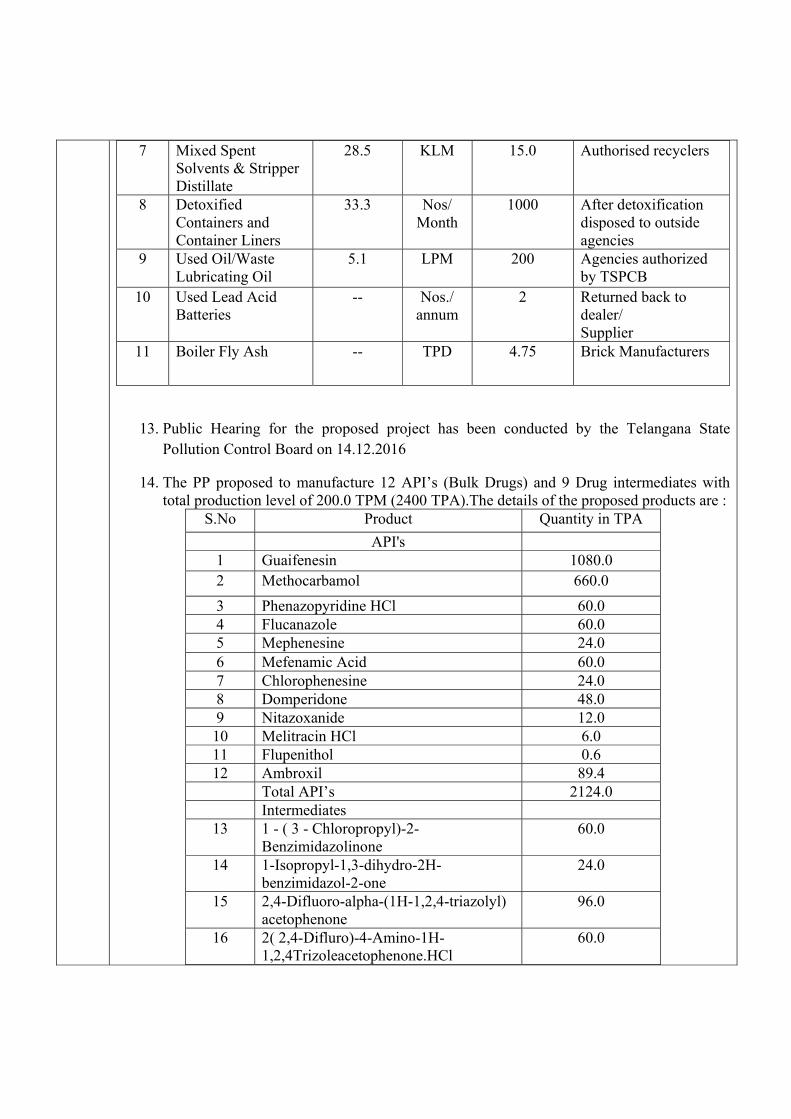
7 Mixed Spent
Solvents & Stripper
Distillate
28.5 KLM 15.0 Authorised recyclers
8 Detoxified
Containers and
Container Liners
33.3 Nos/
Month
1000 After detoxification
disposed to outside
agencies
9 Used Oil/Waste
Lubricating Oil
5.1 LPM 200 Agencies authorized
by TSPCB
10 Used Lead Acid
Batteries
-- Nos./
annum
2 Returned back to
dealer/
Supplier
11 Boiler Fly Ash -- TPD 4.75 Brick Manufacturers
13. Public Hearing for the proposed project has been conducted by the Telangana State
Pollution Control Board on 14.12.2016
14. The PP proposed to manufacture 12 API’s (Bulk Drugs) and 9 Drug intermediates with
total production level of 200.0 TPM (2400 TPA).The details of the proposed products are :
S.No Product Quantity in TPA
API's
1 Guaifenesin 1080.0
2 Methocarbamol 660.0
3 Phenazopyridine HCl 60.0
4 Flucanazole 60.0
5 Mephenesine 24.0
6 Mefenamic Acid 60.0
7 Chlorophenesine 24.0
8 Domperidone 48.0
9 Nitazoxanide 12.0
10 Melitracin HCl 6.0
11 Flupenithol 0.6
12 Ambroxil 89.4
Total API’s 2124.0
Intermediates
13 1 - ( 3 - Chloropropyl)-2-
Benzimidazolinone
60.0
14 1-Isopropyl-1,3-dihydro-2H-
benzimidazol-2-one
24.0
15 2,4-Difluoro-alpha-(1H-1,2,4-triazolyl)
acetophenone
96.0
16 2( 2,4-Difluro)-4-Amino-1H-
1,2,4Trizoleacetophenone.HCl
60.0

17 3,3-dimethyl-2-benzofuran-1(3H)-one. 12.0
18 1- Phathalanol -3,3-dimethyl-1-Phenyl-
1.
12.0
19 10,10-dimethylanthracen-9(10H)-one 6.0
20 9-[3-(dimethylamino)propyl]-9,10-
dihydro-10,10-dimethylanthracene-9-ol
6.0
21 2-(Trifluoromethyl) thioxanthen-9-one 0.0
Total Intermediates 276.0
Total ( API’s + Intermediates) 2400.0
The EAC has deliberated on the project proposal and public hearing report. The committee noted
that the baseline data has been conducted before the award of TOR. The EAC desired to have
another one month baseline data to be collected and to submit the result after the modelling study.
EAC also asked the PP to submit revised CSR plan (2.5 % of the project cost) with
implementation period of five years having provision of :
1. Drinking water facility with RO plant, solar lights on village streets in nearby three villages
bearing the maintenance cost.
2. Planting of 1000 perennial native trees per year till five years in the surroundings and nearby
selected three villages..
3. Plan for regular testing of ground water through lab accredited by the Ministry for ensuring
decontaminated agricultural water supply.
Considering the above facts, the EAC decided to defer the proposal till the submission of
above information/documents by the PP.
Reconsideration of EC
21.3.4
Expansion of Pesticide Products Unit at Plot. No. C1-76/523, 77/524, 78/525, 65/551,
66/550, 100 Shed Area, Notified Industrial estate, GIDC Vapi, Ta: Pardi, Di: Valsad,
Gujarat by M/S Netmatrix Crop Care Limited -Environmental clearance-
[IA/GJ/IND2/35671/2015, J-11011/11/2016-IA II (I)]
The project proponent and the accredited consultant M/s Eco Chem Sales & Services, Surat
gave a detailed presentation on the salient features of the project and informed that:
i. The proposal is for expansion of Pesticide products from 93.3 TPM to 840 TPM at plot.
No. C1-76/523, 77/524, 78/525,65/551, 66/550, 100 Shed Area, Notified Industrial
estate, GIDC Vapi, Ta: Pardi, Di: Valsad, Gujarat by M/s. Netmatrix Crop Care
Limited.
ii. The project proposal was considered by the Expert Appraisal Committee (Industry-2) in
Its 4th
meeting held during 11th
-12th
February 2016 and recommended Terms of
References (TORs) for the Project. The TOR has been issued by Ministry vide letter

Additional Information Deccan Remedies Limited
Pridhvi Envirotech (P) Limited. 47
Annexure-II
Micrometeorological data for the month of May 2017
Year Month Day Time
Wind
Dir (Deg)
Wind
Speed (km/h)
Temperature (*C) RH (%)
Rainfall (mm)
Solar Rad (wat/m2)
Dew
Point (*C)
2017 5 1 0 15 0 27.8 26.5 0 0 6.8
2017 5 1 1 15 0 27.2 27.6 0 0 6.8
2017 5 1 2 100 0 26 29.8 0 0 6.9
2017 5 1 3 52 0 25.6 32.6 0 0 7.9
2017 5 1 4 52 0 24.8 33.3 0 0 7.5
2017 5 1 5 52 0 24.4 36.5 0 0 8.5
2017 5 1 6 227 0 24.1 34.6 0 0 7.4
2017 5 1 7 227 0 24.7 32.1 0 0 6.8
2017 5 1 8 49 0 26 30.1 0 1484 7
2017 5 1 9 19 0 28.6 24.3 0 1481 6.2
2017 5 1 10 152 0 31.8 19 0 1478 5.3
2017 5 1 11 230 0 34.3 18.2 0 1479 6.7
2017 5 1 12 179 0 35.7 12 0 1479 1.8
2017 5 1 13 295 0 38.1 9.4 0 1479 0.1
2017 5 1 14 306 0 38.9 9.4 0 1480 0.7
2017 5 1 15 74 0 39.8 9.4 0 1482 1.4
2017 5 1 16 73 0 39.4 8.5 0 1485 -0.3
2017 5 1 17 36 0 39 8.5 0 1487 -0.6
2017 5 1 18 25 0 37.9 9.4 0 0 0
2017 5 1 19 79 0 36.9 11.2 0 0 1.7
2017 5 1 20 286 0 34.5 19 0 0 7.5
2017 5 1 21 300 3 30.3 32.2 0 0 11.8
2017 5 1 22 235 4 28.1 32.2 0 0 9.9
2017 5 1 23 272 1 27.6 31.9 0 0 9.3
2017 5 2 0 273 0 27 32.7 0 1489 9.1
2017 5 2 1 269 0 26.6 32.8 0 1488 8.8
2017 5 2 2 268 0 26.4 32.9 0 1487 8.7
2017 5 2 3 247 0 25.7 34.7 0 1486 8.9
2017 5 2 4 264 0 25.2 36.8 0 1485 9.3
2017 5 2 5 258 0 24.9 38.6 0 1484 9.8
2017 5 2 6 258 0 24.3 41.8 0 1483 10.5
2017 5 2 7 265 0 24.2 40 0 1482 9.7
2017 5 2 8 273 0 25.7 34.4 0 1476 8.7
2017 5 2 9 272 0 27.9 30.5 0 1471 8.9
2017 5 2 10 272 0 30.8 27.4 0 1468 9.8
2017 5 2 11 269 0 34 23.2 0 1465 10.1
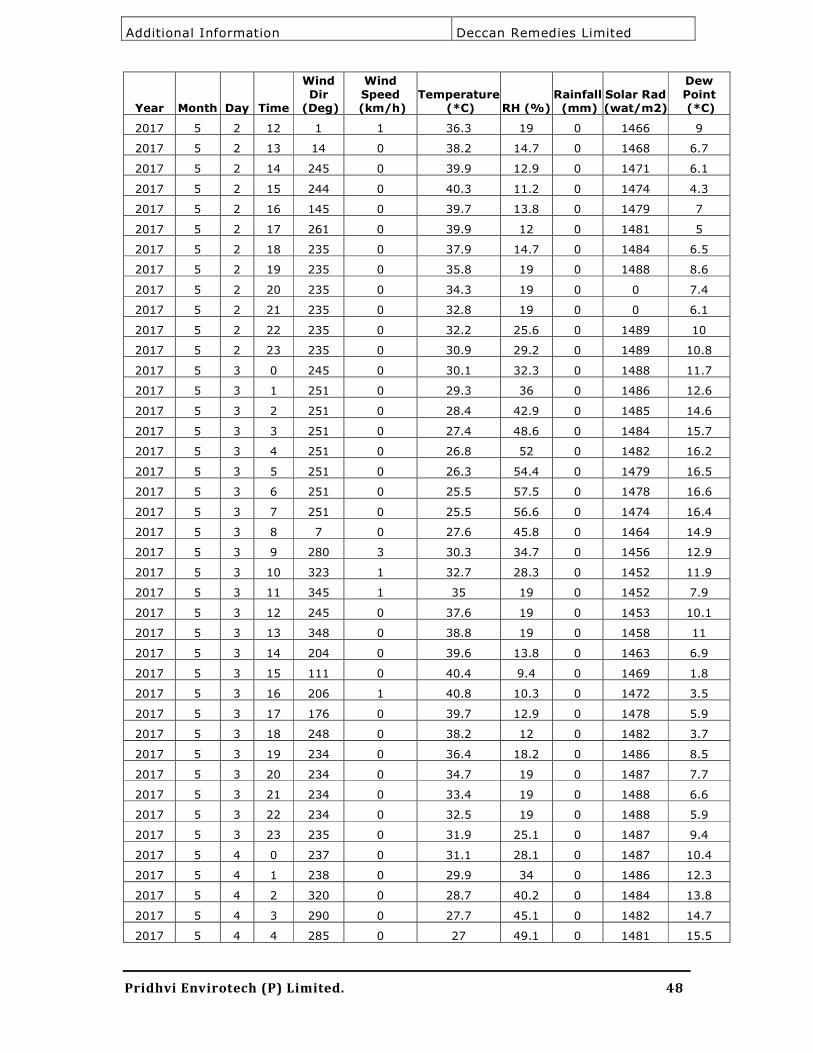
Additional Information Deccan Remedies Limited
Pridhvi Envirotech (P) Limited. 48
Year Month Day Time
Wind
Dir (Deg)
Wind
Speed (km/h)
Temperature (*C) RH (%)
Rainfall (mm)
Solar Rad (wat/m2)
Dew
Point (*C)
2017 5 2 12 1 1 36.3 19 0 1466 9
2017 5 2 13 14 0 38.2 14.7 0 1468 6.7
2017 5 2 14 245 0 39.9 12.9 0 1471 6.1
2017 5 2 15 244 0 40.3 11.2 0 1474 4.3
2017 5 2 16 145 0 39.7 13.8 0 1479 7
2017 5 2 17 261 0 39.9 12 0 1481 5
2017 5 2 18 235 0 37.9 14.7 0 1484 6.5
2017 5 2 19 235 0 35.8 19 0 1488 8.6
2017 5 2 20 235 0 34.3 19 0 0 7.4
2017 5 2 21 235 0 32.8 19 0 0 6.1
2017 5 2 22 235 0 32.2 25.6 0 1489 10
2017 5 2 23 235 0 30.9 29.2 0 1489 10.8
2017 5 3 0 245 0 30.1 32.3 0 1488 11.7
2017 5 3 1 251 0 29.3 36 0 1486 12.6
2017 5 3 2 251 0 28.4 42.9 0 1485 14.6
2017 5 3 3 251 0 27.4 48.6 0 1484 15.7
2017 5 3 4 251 0 26.8 52 0 1482 16.2
2017 5 3 5 251 0 26.3 54.4 0 1479 16.5
2017 5 3 6 251 0 25.5 57.5 0 1478 16.6
2017 5 3 7 251 0 25.5 56.6 0 1474 16.4
2017 5 3 8 7 0 27.6 45.8 0 1464 14.9
2017 5 3 9 280 3 30.3 34.7 0 1456 12.9
2017 5 3 10 323 1 32.7 28.3 0 1452 11.9
2017 5 3 11 345 1 35 19 0 1452 7.9
2017 5 3 12 245 0 37.6 19 0 1453 10.1
2017 5 3 13 348 0 38.8 19 0 1458 11
2017 5 3 14 204 0 39.6 13.8 0 1463 6.9
2017 5 3 15 111 0 40.4 9.4 0 1469 1.8
2017 5 3 16 206 1 40.8 10.3 0 1472 3.5
2017 5 3 17 176 0 39.7 12.9 0 1478 5.9
2017 5 3 18 248 0 38.2 12 0 1482 3.7
2017 5 3 19 234 0 36.4 18.2 0 1486 8.5
2017 5 3 20 234 0 34.7 19 0 1487 7.7
2017 5 3 21 234 0 33.4 19 0 1488 6.6
2017 5 3 22 234 0 32.5 19 0 1488 5.9
2017 5 3 23 235 0 31.9 25.1 0 1487 9.4
2017 5 4 0 237 0 31.1 28.1 0 1487 10.4
2017 5 4 1 238 0 29.9 34 0 1486 12.3
2017 5 4 2 320 0 28.7 40.2 0 1484 13.8
2017 5 4 3 290 0 27.7 45.1 0 1482 14.7
2017 5 4 4 285 0 27 49.1 0 1481 15.5

Additional Information Deccan Remedies Limited
Pridhvi Envirotech (P) Limited. 49
Year Month Day Time
Wind
Dir (Deg)
Wind
Speed (km/h)
Temperature (*C) RH (%)
Rainfall (mm)
Solar Rad (wat/m2)
Dew
Point (*C)
2017 5 4 5 285 0 26.2 52.2 0 1480 15.7
2017 5 4 6 285 0 25.5 54.8 0 1479 15.8
2017 5 4 7 285 0 25.7 52.4 0 1475 15.3
2017 5 4 8 285 0 28.1 42 0 1466 14
2017 5 4 9 121 0 30.9 33.2 0 1458 12.8
2017 5 4 10 83 3 33.2 27.2 0 1455 11.7
2017 5 4 11 145 0 35.2 19 0 1456 8.1
2017 5 4 12 327 1 37.1 19 0 1457 9.7
2017 5 4 13 81 0 39 19 0 1459 11.2
2017 5 4 14 73 0 40.2 12 0 1464 5.3
2017 5 4 15 70 1 41.3 12 0 1469 6.1
2017 5 4 16 59 0 40.3 11.2 0 1475 4.3
2017 5 4 17 353 0 39.3 12 0 1479 4.6
2017 5 4 18 66 0 38.7 12.9 0 1482 5.2
2017 5 4 19 252 0 37.3 14.7 0 1484 6
2017 5 4 20 252 0 35.3 19 0 1486 8.2
2017 5 4 21 252 0 34.2 19 0 1487 7.3
2017 5 4 22 252 0 33.1 19 0 1487 6.4
2017 5 4 23 252 0 32.4 19 0 1488 5.8
2017 5 5 0 252 0 31.6 25.4 0 1487 9.4
2017 5 5 1 252 0 30.8 26.1 0 1487 9.1
2017 5 5 2 252 0 30.2 27 0 1487 9.1
2017 5 5 3 14 0 29.2 29.8 0 1487 9.7
2017 5 5 4 134 0 28.4 32.1 0 1486 10.1
2017 5 5 5 134 0 28.3 32.1 0 1484 10
2017 5 5 6 134 0 27.6 33.5 0 1484 10
2017 5 5 7 134 0 27.6 33.9 0 1483 10.2
2017 5 5 8 360 0 29.8 28.6 0 1477 9.6
2017 5 5 9 5 0 32.8 19 0 1471 6.1
2017 5 5 10 343 1 43.2 19 0 1225 14.6
2017 5 5 11 16 1 37.5 19 0 1470 10
2017 5 5 12 336 1 39.2 13.8 0 1471 6.6
2017 5 5 13 313 1 41.1 9.4 0 1472 2.4
2017 5 5 14 350 0 41.6 10.3 0 1475 4.1
2017 5 5 15 283 0 42.7 9.4 0 1477 3.6
2017 5 5 16 128 0 42.8 8.5 0 1478 2.2
2017 5 5 17 62 0 41.7 10.3 0 1483 4.1
2017 5 5 18 206 3 39.3 18.2 0 1487 10.8
2017 5 5 19 225 0 36.3 15.5 0 0 6
2017 5 5 20 256 0 35.1 19 0 0 8
2017 5 5 21 285 0 34.2 19 0 0 7.3

Additional Information Deccan Remedies Limited
Pridhvi Envirotech (P) Limited. 50
Year Month Day Time
Wind
Dir (Deg)
Wind
Speed (km/h)
Temperature (*C) RH (%)
Rainfall (mm)
Solar Rad (wat/m2)
Dew
Point (*C)
2017 5 5 22 310 0 33.4 19 0 0 6.6
2017 5 5 23 310 0 32.7 19.5 0 0 6.4
2017 5 6 0 269 0 32.5 29 0 1488 12.1
2017 5 6 1 269 0 31.6 31.7 0 1487 12.7
2017 5 6 2 271 0 30.6 33.1 0 1486 12.5
2017 5 6 3 271 0 29.8 34 0 1486 12.2
2017 5 6 4 271 0 29.5 35.5 0 1484 12.6
2017 5 6 5 271 0 29.1 39 0 1483 13.7
2017 5 6 6 271 0 28.7 40.3 0 1482 13.9
2017 5 6 7 271 0 28.8 37.5 0 1480 12.8
2017 5 6 8 271 0 30.1 32.9 0 1476 11.9
2017 5 6 9 237 0 32.2 26.5 0 1470 10.5
2017 5 6 10 9 0 35 19 0 1465 7.9
2017 5 6 11 316 0 36.8 19 0 1467 9.4
2017 5 6 12 15 1 38.1 12.9 0 1471 4.7
2017 5 6 13 344 1 40.4 11.2 0 1471 4.4
2017 5 6 14 355 0 41.9 9.4 0 1472 3
2017 5 6 15 312 0 42.4 10.3 0 1476 4.7
2017 5 6 16 343 0 40.5 10.3 0 1482 3.2
2017 5 6 17 272 0 40.6 10.3 0 1482 3.3
2017 5 6 18 340 1 38.3 19 0 1486 10.6
2017 5 6 19 348 0 36.5 19 0 1488 9.2
2017 5 6 20 348 0 34.7 19 0 0 7.7
2017 5 6 21 348 0 33.3 19 0 0 6.6
2017 5 6 22 348 0 32.5 21.7 0 0 7.8
2017 5 6 23 348 0 31.7 26.5 0 0 10.1
2017 5 7 0 348 0 31.2 26.2 0 1489 9.5
2017 5 7 1 348 0 30.3 29.5 0 1489 10.5
2017 5 7 2 348 0 29.8 26.4 0 1488 8.4
2017 5 7 3 21 0 30.1 27 0 1486 9
2017 5 7 4 256 0 29.6 27.3 0 1486 8.7
2017 5 7 5 256 0 28.6 30.9 0 1486 9.7
2017 5 7 6 152 0 28.1 45 0 1485 15.1
2017 5 7 7 232 0 27.6 55.4 0 1482 18
2017 5 7 8 276 0 28.4 52.9 0 1473 18
2017 5 7 9 280 0 30.3 40.5 0 1464 15.4
2017 5 7 10 321 1 32.3 34.4 0 1458 14.6
2017 5 7 11 169 0 34 29.8 0 1456 13.8
2017 5 7 12 268 0 36.1 21.2 0 1454 10.5
2017 5 7 13 354 0 38 19 0 1455 10.4
2017 5 7 14 0 1 39.5 15.5 0 1460 8.5

Additional Information Deccan Remedies Limited
Pridhvi Envirotech (P) Limited. 51
Year Month Day Time
Wind
Dir (Deg)
Wind
Speed (km/h)
Temperature (*C) RH (%)
Rainfall (mm)
Solar Rad (wat/m2)
Dew
Point (*C)
2017 5 7 15 11 1 40.3 12.9 0 1464 6.4
2017 5 7 16 141 0 41.2 11.2 0 1469 5
2017 5 7 17 132 0 40.8 11.2 0 1476 4.7
2017 5 7 18 132 0 39.6 10.3 0 1482 2.6
2017 5 7 19 268 0 38.3 19 0 1483 10.6
2017 5 7 20 221 0 35.6 19.5 0 1484 8.8
2017 5 7 21 280 0 34 26 0 1484 11.8
2017 5 7 22 269 0 32.9 31.4 0 1483 13.7
2017 5 7 23 269 0 31.8 33.8 0 1483 13.9
2017 5 8 0 269 0 31 35 0 1482 13.7
2017 5 8 1 145 0 30.2 39.9 0 1480 15
2017 5 8 2 64 0 29.6 42 0 1476 15.3
2017 5 8 3 26 0 29.1 39.4 0 1475 13.9
2017 5 8 4 26 0 28.3 37 0 1474 12.2
2017 5 8 5 8 0 27.5 33.6 0 1474 10
2017 5 8 6 8 0 26.9 36 0 1474 10.5
2017 5 8 7 8 0 26.7 38.1 0 1472 11.2
2017 5 8 8 29 0 27.7 32.4 0 1468 9.6
2017 5 8 9 9 1 30.7 23.2 0 1459 7.3
2017 5 8 10 26 0 32.7 19 0 1460 6.1
2017 5 8 11 86 1 34.9 19 0 1461 7.9
2017 5 8 12 5 0 37.7 14.7 0 1461 6.3
2017 5 8 13 264 0 39.8 12.9 0 1465 6
2017 5 8 14 227 0 41.2 10.3 0 1467 3.8
2017 5 8 15 132 1 41.5 9.4 0 1474 2.7
2017 5 8 16 124 0 40.7 10.3 0 1479 3.4
2017 5 8 17 42 3 37.6 19 0 1483 10.1
2017 5 8 18 145 0 36.6 13.8 0 1484 4.5
2017 5 8 19 145 0 36.1 19 0 1484 8.8
2017 5 8 20 224 0 35 19 0 1485 7.9
2017 5 8 21 309 0 33.6 19 0 1486 6.8
2017 5 8 22 345 1 31.9 19 0 1486 5.4
2017 5 8 23 353 0 31.3 19 0 1485 4.9
2017 5 9 0 313 0 30.2 25.9 0 1486 8.5
2017 5 9 1 313 0 29.8 27 0 1486 8.7
2017 5 9 2 313 0 29.1 27.9 0 1486 8.6
2017 5 9 3 313 0 28.4 29.6 0 1486 8.9
2017 5 9 4 313 0 27.6 33.2 0 1485 9.9
2017 5 9 5 313 0 26.8 32.6 0 1485 8.9
2017 5 9 6 313 0 26.4 32.9 0 1484 8.7
2017 5 9 7 313 0 26.7 32.1 0 1483 8.6

Additional Information Deccan Remedies Limited
Pridhvi Envirotech (P) Limited. 52
Year Month Day Time
Wind
Dir (Deg)
Wind
Speed (km/h)
Temperature (*C) RH (%)
Rainfall (mm)
Solar Rad (wat/m2)
Dew
Point (*C)
2017 5 9 8 313 0 28.8 30 0 1478 9.4
2017 5 9 9 357 0 30.8 19 0 1473 4.5
2017 5 9 10 69 0 33.3 19 0 1469 6.6
2017 5 9 11 124 1 36.4 12.9 0 1468 3.4
2017 5 9 12 125 1 39.1 10.3 0 1472 2.2
2017 5 9 13 142 1 40.6 9.4 0 1475 2
2017 5 9 14 145 3 41.6 9.4 0 1478 2.7
2017 5 9 15 112 1 42.3 9.4 0 1479 3.3
2017 5 9 16 141 0 42 8.5 0 1482 1.6
2017 5 9 17 145 0 41.5 8.5 0 1485 1.2
2017 5 9 18 225 0 40.5 11.2 0 1488 4.5
2017 5 9 19 234 0 37.2 19 0 0 9.7
2017 5 9 20 242 0 34.8 19 0 0 7.8
2017 5 9 21 240 0 34.1 19 0 0 7.2
2017 5 9 22 177 0 33.1 19 0 0 6.4
2017 5 9 23 190 4 30.7 35.2 0 1489 13.5
2017 5 10 0 190 3 27.8 39.2 0 1487 12.6
2017 5 10 1 252 1 27.6 42 0 1485 13.5
2017 5 10 2 278 1 26.6 42.4 0 1483 12.8
2017 5 10 3 264 0 25.7 44.4 0 1482 12.7
2017 5 10 4 251 0 25.7 47.5 0 1479 13.7
2017 5 10 5 312 1 25.3 43.6 0 1476 12
2017 5 10 6 2 0 25.2 46.3 0 1473 12.9
2017 5 10 7 345 0 25.1 46.5 0 1471 12.8
2017 5 10 8 355 0 25.7 43.2 0 1465 12.2
2017 5 10 9 355 0 28.1 32.5 0 1456 10
2017 5 10 10 297 0 31.8 19 0 1451 5.3
2017 5 10 11 358 3 35.1 19 0 1454 8
2017 5 10 12 12 1 37.7 13.8 0 1457 5.4
2017 5 10 13 64 0 39.7 12.9 0 1462 5.9
2017 5 10 14 283 1 40.7 11.2 0 1467 4.6
2017 5 10 15 87 1 41.4 9.4 0 1470 2.6
2017 5 10 16 231 0 41.5 9.4 0 1474 2.7
2017 5 10 17 306 1 39.6 19 0 1479 11.7
2017 5 10 18 314 1 37.1 19 0 1482 9.7
2017 5 10 19 259 0 35.2 19 0 1484 8.1
2017 5 10 20 275 0 33.7 19 0 1484 6.9
2017 5 10 21 276 0 32.7 26 0 1485 10.6
2017 5 10 22 276 0 32 27.3 0 1485 10.8
2017 5 10 23 275 0 31.2 29.2 0 1484 11.1
2017 5 11 0 273 0 30.3 32.9 0 1483 12.1

Additional Information Deccan Remedies Limited
Pridhvi Envirotech (P) Limited. 53
Year Month Day Time
Wind
Dir (Deg)
Wind
Speed (km/h)
Temperature (*C) RH (%)
Rainfall (mm)
Solar Rad (wat/m2)
Dew
Point (*C)
2017 5 11 1 264 0 29.3 36.4 0 1482 12.8
2017 5 11 2 264 0 28.4 39.2 0 1482 13.1
2017 5 11 3 264 0 27.8 42.3 0 1480 13.8
2017 5 11 4 273 0 27.2 40.4 0 1479 12.5
2017 5 11 5 276 0 26.8 42.8 0 1478 13.1
2017 5 11 6 255 0 26.4 44.1 0 1476 13.2
2017 5 11 7 338 0 26.7 41.6 0 1473 12.6
2017 5 11 8 2 0 27.6 40.1 0 1468 12.8
2017 5 11 9 331 0 29.3 32.6 0 1462 11.1
2017 5 11 10 4 1 32 26 0 1456 10.1
2017 5 11 11 275 1 34.8 19 0 1453 7.8
2017 5 11 12 180 0 37.2 18.2 0 1455 9.1
2017 5 11 13 278 0 38.9 13.8 0 1459 6.3
2017 5 11 14 165 0 40.6 12 0 1463 5.6
2017 5 11 15 173 1 40.9 12 0 1469 5.8
2017 5 11 16 292 0 40 12 0 1472 5.1
2017 5 11 17 223 0 39.7 12 0 1476 4.9
2017 5 11 18 207 0 38.1 17.3 0 1481 9.1
2017 5 11 19 224 0 36.3 19 0 1484 9
2017 5 11 20 224 0 34.8 19 0 1486 7.8
2017 5 11 21 224 0 33.4 19 0 1487 6.6
2017 5 11 22 224 0 32.4 26 0 1487 10.4
2017 5 11 23 242 0 31.4 29.2 0 1486 11.3
2017 5 12 0 242 0 30.7 31.4 0 1485 11.8
2017 5 12 1 242 0 29.8 34.1 0 1484 12.2
2017 5 12 2 296 0 28.9 39.5 0 1483 13.7
2017 5 12 3 296 0 27.9 45.8 0 1482 15.2
2017 5 12 4 296 0 27.4 50.9 0 1480 16.4
2017 5 12 5 343 0 26.8 55.5 0 1478 17.3
2017 5 12 6 326 0 26.2 59.5 0 1474 17.8
2017 5 12 7 286 0 26.2 57.9 0 1469 17.4
2017 5 12 8 303 0 27.9 43.5 0 1457 14.3
2017 5 12 9 282 0 30.4 33.9 0 1450 12.7
2017 5 12 10 326 0 32.9 28.3 0 1447 12.1
2017 5 12 11 230 1 35.1 21.2 0 1447 9.6
2017 5 12 12 240 0 37.3 19 0 1449 9.8
2017 5 12 13 214 1 39.3 19 0 1452 11.5
2017 5 12 14 316 1 39.9 19 0 1457 11.9
2017 5 12 15 45 1 40.4 16.4 0 1462 10.1
2017 5 12 16 151 0 40.7 13.8 0 1467 7.7
2017 5 12 17 264 0 39.8 16.4 0 1473 9.6

Additional Information Deccan Remedies Limited
Pridhvi Envirotech (P) Limited. 54
Year Month Day Time
Wind
Dir (Deg)
Wind
Speed (km/h)
Temperature (*C) RH (%)
Rainfall (mm)
Solar Rad (wat/m2)
Dew
Point (*C)
2017 5 12 18 235 0 38.9 19 0 1476 11.1
2017 5 12 19 234 0 37.1 19 0 1480 9.7
2017 5 12 20 331 0 35.4 19 0 1482 8.3
2017 5 12 21 331 0 34.1 19 0 1482 7.2
2017 5 12 22 331 0 33.1 25.6 0 1483 10.8
2017 5 12 23 331 0 32.2 26.5 0 1483 10.5
2017 5 13 0 324 0 31.4 29.2 0 1482 11.3
2017 5 13 1 324 0 30.6 32 0 1482 12
2017 5 13 2 323 0 29.9 33.4 0 1481 12
2017 5 13 3 290 0 29.6 36.4 0 1479 13.1
2017 5 13 4 262 0 28.9 39.7 0 1477 13.8
2017 5 13 5 262 0 28.2 42.8 0 1476 14.4
2017 5 13 6 262 0 27.5 45.6 0 1476 14.7
2017 5 13 7 262 0 27.6 44.5 0 1473 14.4
2017 5 13 8 264 0 29.6 36.8 0 1464 13.2
2017 5 13 9 350 0 32 31.1 0 1456 12.7
2017 5 13 10 328 0 34.7 22.1 0 1452 9.9
2017 5 13 11 29 0 37.6 19 0 1451 10.1
2017 5 13 12 344 1 39.3 19 0 1455 11.5
2017 5 13 13 115 0 40.6 19 0 1458 12.5
2017 5 13 14 330 0 40.1 19 0 1465 12.1
2017 5 13 15 132 0 39.3 19 0 1469 11.5
2017 5 13 16 353 3 35.1 25.4 0 1475 12.3
2017 5 13 17 280 0 32.2 26 0 1476 10.2
2017 5 13 18 242 0 33.9 33.8 0 1473 15.7
2017 5 13 19 259 0 33.3 30.1 0 1472 13.4
2017 5 13 20 259 0 32.7 29.4 0 1472 12.5
2017 5 13 21 259 0 32.2 32.9 0 1471 13.8
2017 5 13 22 259 0 31.3 32.9 0 1470 13
2017 5 13 23 259 0 30.8 33.5 0 1470 12.8
2017 5 14 0 259 0 30.2 33.8 0 1470 12.4
2017 5 14 1 259 0 30.2 32.4 0 1469 11.8
2017 5 14 2 259 0 30.2 33.2 0 1467 12.2
2017 5 14 3 259 0 29.7 36.7 0 1466 13.3
2017 5 14 4 124 0 28.7 37.6 0 1466 12.8
2017 5 14 5 139 0 29.7 33.8 0 1460 12
2017 5 14 6 139 0 29.2 35.6 0 1460 12.4
2017 5 14 7 4 1 28.8 36.7 0 1458 12.5
2017 5 14 8 348 0 30.4 34.1 0 1450 12.8
2017 5 14 9 1 0 32.6 27.7 0 1442 11.5
2017 5 14 10 8 1 35.4 19 0 1442 8.3

Additional Information Deccan Remedies Limited
Pridhvi Envirotech (P) Limited. 55
Year Month Day Time
Wind
Dir (Deg)
Wind
Speed (km/h)
Temperature (*C) RH (%)
Rainfall (mm)
Solar Rad (wat/m2)
Dew
Point (*C)
2017 5 14 11 350 3 37.8 18.2 0 1447 9.6
2017 5 14 12 15 1 39.3 13.8 0 1453 6.6
2017 5 14 13 124 0 41.4 11.2 0 1457 5.2
2017 5 14 14 88 1 42.7 9.4 0 1462 3.6
2017 5 14 15 49 1 43 9.4 0 1468 3.8
2017 5 14 16 2 0 42.7 10.3 0 1472 4.9
2017 5 14 17 91 0 42.4 11.2 0 1475 5.9
2017 5 14 18 98 0 40.3 16.4 0 1481 10
2017 5 14 19 98 0 38.9 16.4 0 1484 8.9
2017 5 14 20 211 0 37.4 19 0 1485 9.9
2017 5 14 21 234 0 36.8 19 0 1484 9.4
2017 5 14 22 234 0 35.4 19 0 1485 8.3
2017 5 14 23 249 0 34.2 19 0 1484 7.3
2017 5 15 0 306 0 33.7 21.7 0 1484 8.8
2017 5 15 1 313 1 32.6 26.4 0 1483 10.8
2017 5 15 2 158 3 31.2 29.4 0 1482 11.2
2017 5 15 3 357 3 28.8 61.3 0.2 1481 20.8
2017 5 15 4 355 11 25.2 56.6 0 1478 16.1
2017 5 15 5 25 1 25.7 54 0 1470 15.8
2017 5 15 6 21 0 25.9 57.2 0 1465 16.9
2017 5 15 7 57 0 26.4 52.3 0 1461 15.9
2017 5 15 8 0 0 28 49.5 0 1452 16.5
2017 5 15 9 360 1 30.2 43.9 0 1441 16.6
2017 5 15 10 4 3 32.5 34.4 0 1435 14.7
2017 5 15 11 353 3 34.3 29.1 0 1435 13.7
2017 5 15 12 53 4 36.2 19 0 1439 8.9
2017 5 15 13 16 4 37.8 19 0 1443 10.2
2017 5 15 14 344 3 39.1 19 0 1450 11.3
2017 5 15 15 77 1 40.4 13.8 0 1455 7.5
2017 5 15 16 15 1 41.1 12 0 1461 6
2017 5 15 17 25 1 40.4 11.2 0 1468 4.4
2017 5 15 18 1 0 39.7 12 0 1473 4.9
2017 5 15 19 11 0 38.2 17.3 0 1478 9.2
2017 5 15 20 11 0 36.5 19 0 1480 9.2
2017 5 15 21 11 0 35.2 19 0 1481 8.1
2017 5 15 22 11 0 34 26 0 1482 11.8
2017 5 15 23 11 0 33.3 26.5 0 1481 11.4
2017 5 16 0 355 0 32.7 27.3 0 1480 11.4
2017 5 16 1 2 1 32.3 27.6 0 1479 11.2
2017 5 16 2 347 0 31.7 26.9 0 1478 10.3
2017 5 16 3 87 0 31.3 27.9 0 1477 10.5

Additional Information Deccan Remedies Limited
Pridhvi Envirotech (P) Limited. 56
Year Month Day Time
Wind
Dir (Deg)
Wind
Speed (km/h)
Temperature (*C) RH (%)
Rainfall (mm)
Solar Rad (wat/m2)
Dew
Point (*C)
2017 5 16 4 360 0 31.4 29.5 0 1475 11.4
2017 5 16 5 354 0 30.9 32.3 0 1475 12.4
2017 5 16 6 354 0 29.9 34.6 0 1475 12.5
2017 5 16 7 2 0 29.6 36.5 0 1472 13.1
2017 5 16 8 340 1 31.1 30.7 0 1466 11.8
2017 5 16 9 70 1 33.1 19 0 1461 6.4
2017 5 16 10 129 3 35.8 19 0 1460 8.6
2017 5 16 11 144 3 38.1 16.4 0 1464 8.3
2017 5 16 12 145 4 39.4 12.9 0 1467 5.7
2017 5 16 13 145 4 41.1 12 0 1470 6
2017 5 16 14 112 3 42.2 10.3 0 1472 4.5
2017 5 16 15 121 4 42.8 11.2 0 1475 6.2
2017 5 16 16 134 3 42.7 9.4 0 1478 3.6
2017 5 16 17 145 1 41.9 10.3 0 1481 4.3
2017 5 16 18 115 0 40.8 12 0 1484 5.7
2017 5 16 19 90 0 39.2 19 0 1486 11.4
2017 5 16 20 90 0 36.9 19 0 1487 9.5
2017 5 16 21 90 0 35.9 19 0 1487 8.7
2017 5 16 22 351 1 34.8 19 0 1487 7.8
2017 5 16 23 66 0 33.3 27 0 1485 11.7
2017 5 17 0 64 0 32.2 27.7 0 1485 11.2
2017 5 17 1 64 0 31.3 29.2 0 1485 11.2
2017 5 17 2 40 0 31 28.7 0 1484 10.7
2017 5 17 3 40 0 30.2 31.4 0 1484 11.3
2017 5 17 4 40 0 29.7 32.4 0 1483 11.4
2017 5 17 5 63 0 29.4 32.5 0 1482 11.1
2017 5 17 6 63 0 28.6 33.2 0 1482 10.8
2017 5 17 7 63 0 28.7 32.4 0 1479 10.5
2017 5 17 8 46 0 30.3 28.1 0 1474 9.7
2017 5 17 9 62 3 32.9 19 0 1471 6.2
2017 5 17 10 22 4 34 19 0 1473 7.1
2017 5 17 11 331 1 34.6 15.5 0 1475 4.6
2017 5 17 12 38 3 36.5 13.8 0 1474 4.4
2017 5 17 13 9 4 38.3 11.2 0 1474 2.8
2017 5 17 14 16 3 39.1 12 0 1476 4.4
2017 5 17 15 91 4 38.8 12 0 1479 4.2
2017 5 17 16 353 3 38.6 13.8 0 1480 6.1
2017 5 17 17 14 1 37.3 14.7 0 1483 6
2017 5 17 18 84 1 35.7 16.4 0 1486 6.3
2017 5 17 19 72 0 34.6 19 0 1487 7.6
2017 5 17 20 12 0 33.6 19 0 1488 6.8
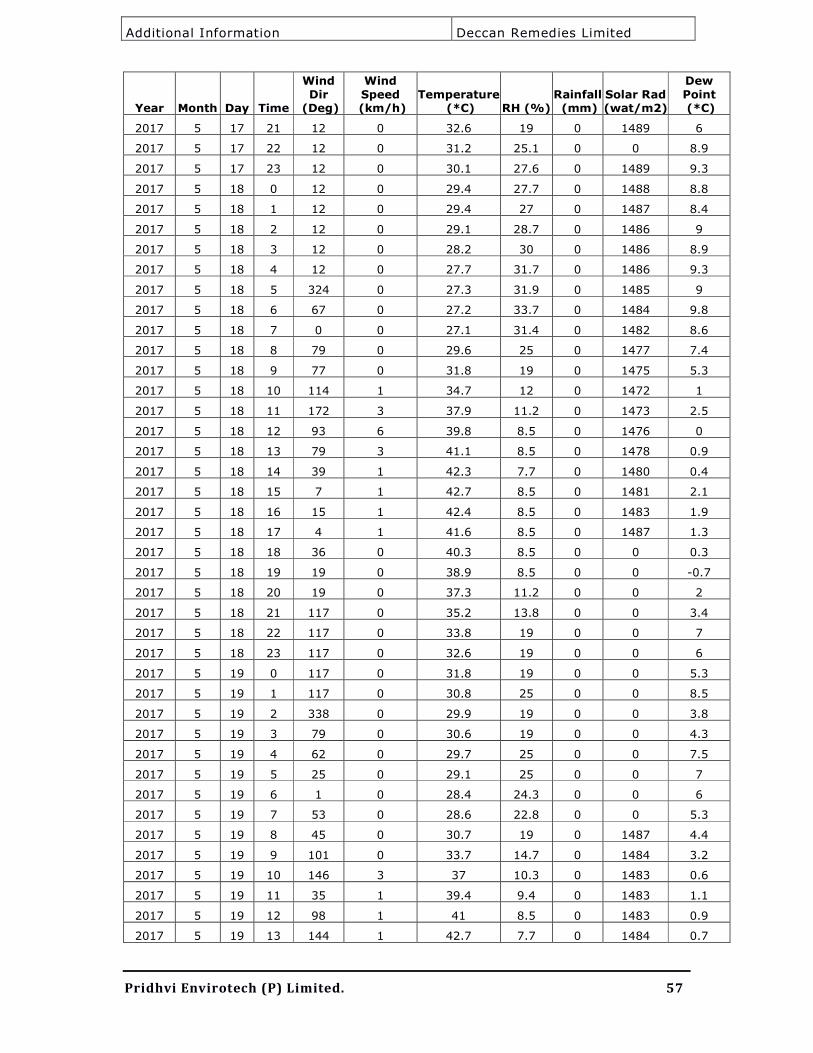
Additional Information Deccan Remedies Limited
Pridhvi Envirotech (P) Limited. 57
Year Month Day Time
Wind
Dir (Deg)
Wind
Speed (km/h)
Temperature (*C) RH (%)
Rainfall (mm)
Solar Rad (wat/m2)
Dew
Point (*C)
2017 5 17 21 12 0 32.6 19 0 1489 6
2017 5 17 22 12 0 31.2 25.1 0 0 8.9
2017 5 17 23 12 0 30.1 27.6 0 1489 9.3
2017 5 18 0 12 0 29.4 27.7 0 1488 8.8
2017 5 18 1 12 0 29.4 27 0 1487 8.4
2017 5 18 2 12 0 29.1 28.7 0 1486 9
2017 5 18 3 12 0 28.2 30 0 1486 8.9
2017 5 18 4 12 0 27.7 31.7 0 1486 9.3
2017 5 18 5 324 0 27.3 31.9 0 1485 9
2017 5 18 6 67 0 27.2 33.7 0 1484 9.8
2017 5 18 7 0 0 27.1 31.4 0 1482 8.6
2017 5 18 8 79 0 29.6 25 0 1477 7.4
2017 5 18 9 77 0 31.8 19 0 1475 5.3
2017 5 18 10 114 1 34.7 12 0 1472 1
2017 5 18 11 172 3 37.9 11.2 0 1473 2.5
2017 5 18 12 93 6 39.8 8.5 0 1476 0
2017 5 18 13 79 3 41.1 8.5 0 1478 0.9
2017 5 18 14 39 1 42.3 7.7 0 1480 0.4
2017 5 18 15 7 1 42.7 8.5 0 1481 2.1
2017 5 18 16 15 1 42.4 8.5 0 1483 1.9
2017 5 18 17 4 1 41.6 8.5 0 1487 1.3
2017 5 18 18 36 0 40.3 8.5 0 0 0.3
2017 5 18 19 19 0 38.9 8.5 0 0 -0.7
2017 5 18 20 19 0 37.3 11.2 0 0 2
2017 5 18 21 117 0 35.2 13.8 0 0 3.4
2017 5 18 22 117 0 33.8 19 0 0 7
2017 5 18 23 117 0 32.6 19 0 0 6
2017 5 19 0 117 0 31.8 19 0 0 5.3
2017 5 19 1 117 0 30.8 25 0 0 8.5
2017 5 19 2 338 0 29.9 19 0 0 3.8
2017 5 19 3 79 0 30.6 19 0 0 4.3
2017 5 19 4 62 0 29.7 25 0 0 7.5
2017 5 19 5 25 0 29.1 25 0 0 7
2017 5 19 6 1 0 28.4 24.3 0 0 6
2017 5 19 7 53 0 28.6 22.8 0 0 5.3
2017 5 19 8 45 0 30.7 19 0 1487 4.4
2017 5 19 9 101 0 33.7 14.7 0 1484 3.2
2017 5 19 10 146 3 37 10.3 0 1483 0.6
2017 5 19 11 35 1 39.4 9.4 0 1483 1.1
2017 5 19 12 98 1 41 8.5 0 1483 0.9
2017 5 19 13 144 1 42.7 7.7 0 1484 0.7

Additional Information Deccan Remedies Limited
Pridhvi Envirotech (P) Limited. 58
Year Month Day Time
Wind
Dir (Deg)
Wind
Speed (km/h)
Temperature (*C) RH (%)
Rainfall (mm)
Solar Rad (wat/m2)
Dew
Point (*C)
2017 5 19 14 31 1 43.6 6.8 0 1486 -0.3
2017 5 19 15 56 1 43.1 7.7 0 1487 1
2017 5 19 16 66 3 42.5 8.5 0 0 2
2017 5 19 17 94 0 42.3 7.7 0 0 0.4
2017 5 19 18 8 0 40.8 8.5 0 0 0.7
2017 5 19 19 19 0 39.3 9.4 0 0 1
2017 5 19 20 39 0 37.6 10.3 0 0 1
2017 5 19 21 39 0 36.1 12 0 0 2.1
2017 5 19 22 39 0 34.9 19 0 0 7.9
2017 5 19 23 39 0 33.6 19 0 0 6.8
2017 5 20 0 39 0 32.2 19 0 0 5.7
2017 5 20 1 39 0 31.6 19 0 0 5.2
2017 5 20 2 33 0 30.3 24.3 0 0 7.6
2017 5 20 3 33 0 29.2 26.2 0 0 7.8
2017 5 20 4 33 0 28.2 26.4 0 0 7
2017 5 20 5 33 0 28.4 20.2 0 0 3.4
2017 5 20 6 33 0 27.6 27.5 0 0 7.1
2017 5 20 7 33 0 27.3 28.5 0 0 7.4
2017 5 20 8 324 1 30.2 19 0 0 4
2017 5 20 9 351 3 33.7 12.9 0 1487 1.3
2017 5 20 10 127 1 36.4 10.3 0 1486 0.1
2017 5 20 11 80 4 38.6 9.4 0 1486 0.5
2017 5 20 12 120 3 40 8.5 0 1487 0.1
2017 5 20 13 145 3 41.6 7.7 0 1487 -0.1
2017 5 20 14 145 3 42.2 8.5 0 1488 1.7
2017 5 20 15 145 1 43 7.7 0 1488 0.9
2017 5 20 16 2 1 42.9 7.7 0 1489 0.9
2017 5 20 17 129 0 42.7 8.5 0 0 2.1
2017 5 20 18 8 0 41.1 8.5 0 0 0.9
2017 5 20 19 24 0 38.8 10.3 0 0 2
2017 5 20 20 24 0 37.1 13.8 0 0 4.9
2017 5 20 21 24 0 35.5 13.8 0 0 3.7
2017 5 20 22 24 0 34.7 13.8 0 0 3
2017 5 20 23 317 0 34.2 14.7 0 0 3.6
2017 5 21 0 295 0 34.8 13.8 0 0 3.1
2017 5 21 1 295 0 33.6 19 0 0 6.8
2017 5 21 2 42 0 32.6 19 0 0 6
2017 5 21 3 36 0 31.5 19 0 0 5.1
2017 5 21 4 43 0 30.4 19 0 0 4.2
2017 5 21 5 38 0 29.5 19 0 0 3.4
2017 5 21 6 38 0 28.3 26.1 0 0 7
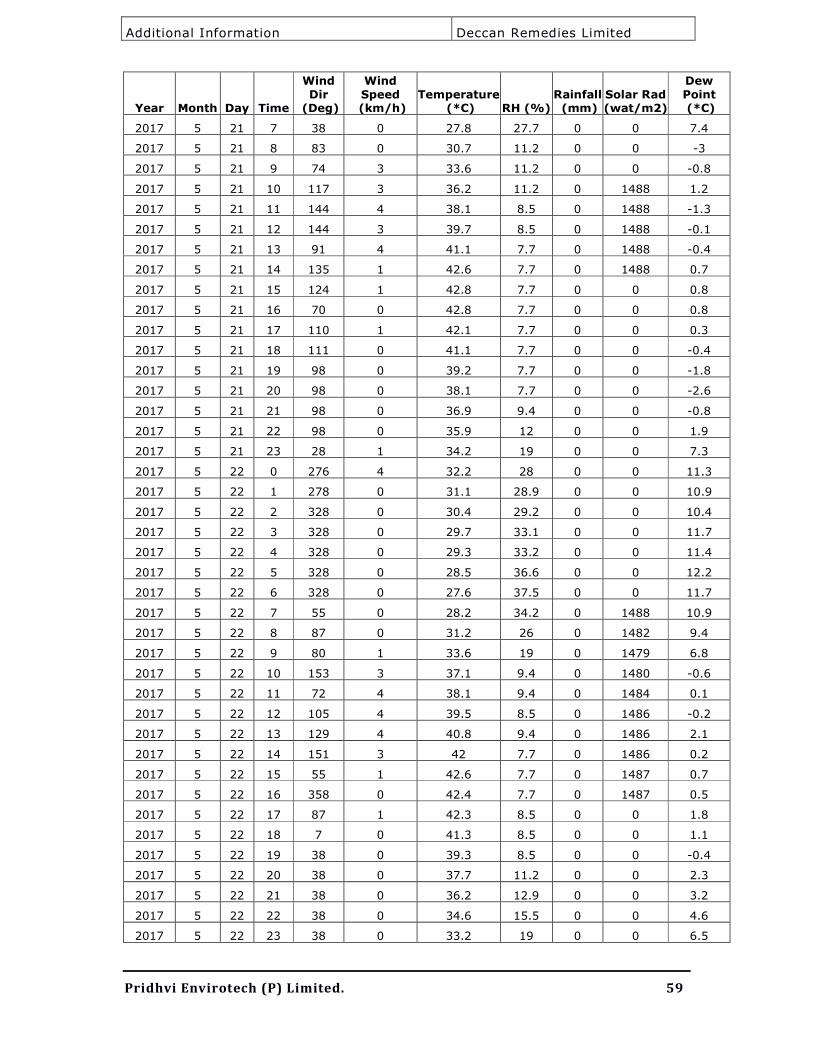
Additional Information Deccan Remedies Limited
Pridhvi Envirotech (P) Limited. 59
Year Month Day Time
Wind
Dir (Deg)
Wind
Speed (km/h)
Temperature (*C) RH (%)
Rainfall (mm)
Solar Rad (wat/m2)
Dew
Point (*C)
2017 5 21 7 38 0 27.8 27.7 0 0 7.4
2017 5 21 8 83 0 30.7 11.2 0 0 -3
2017 5 21 9 74 3 33.6 11.2 0 0 -0.8
2017 5 21 10 117 3 36.2 11.2 0 1488 1.2
2017 5 21 11 144 4 38.1 8.5 0 1488 -1.3
2017 5 21 12 144 3 39.7 8.5 0 1488 -0.1
2017 5 21 13 91 4 41.1 7.7 0 1488 -0.4
2017 5 21 14 135 1 42.6 7.7 0 1488 0.7
2017 5 21 15 124 1 42.8 7.7 0 0 0.8
2017 5 21 16 70 0 42.8 7.7 0 0 0.8
2017 5 21 17 110 1 42.1 7.7 0 0 0.3
2017 5 21 18 111 0 41.1 7.7 0 0 -0.4
2017 5 21 19 98 0 39.2 7.7 0 0 -1.8
2017 5 21 20 98 0 38.1 7.7 0 0 -2.6
2017 5 21 21 98 0 36.9 9.4 0 0 -0.8
2017 5 21 22 98 0 35.9 12 0 0 1.9
2017 5 21 23 28 1 34.2 19 0 0 7.3
2017 5 22 0 276 4 32.2 28 0 0 11.3
2017 5 22 1 278 0 31.1 28.9 0 0 10.9
2017 5 22 2 328 0 30.4 29.2 0 0 10.4
2017 5 22 3 328 0 29.7 33.1 0 0 11.7
2017 5 22 4 328 0 29.3 33.2 0 0 11.4
2017 5 22 5 328 0 28.5 36.6 0 0 12.2
2017 5 22 6 328 0 27.6 37.5 0 0 11.7
2017 5 22 7 55 0 28.2 34.2 0 1488 10.9
2017 5 22 8 87 0 31.2 26 0 1482 9.4
2017 5 22 9 80 1 33.6 19 0 1479 6.8
2017 5 22 10 153 3 37.1 9.4 0 1480 -0.6
2017 5 22 11 72 4 38.1 9.4 0 1484 0.1
2017 5 22 12 105 4 39.5 8.5 0 1486 -0.2
2017 5 22 13 129 4 40.8 9.4 0 1486 2.1
2017 5 22 14 151 3 42 7.7 0 1486 0.2
2017 5 22 15 55 1 42.6 7.7 0 1487 0.7
2017 5 22 16 358 0 42.4 7.7 0 1487 0.5
2017 5 22 17 87 1 42.3 8.5 0 0 1.8
2017 5 22 18 7 0 41.3 8.5 0 0 1.1
2017 5 22 19 38 0 39.3 8.5 0 0 -0.4
2017 5 22 20 38 0 37.7 11.2 0 0 2.3
2017 5 22 21 38 0 36.2 12.9 0 0 3.2
2017 5 22 22 38 0 34.6 15.5 0 0 4.6
2017 5 22 23 38 0 33.2 19 0 0 6.5

Additional Information Deccan Remedies Limited
Pridhvi Envirotech (P) Limited. 60
Year Month Day Time
Wind
Dir (Deg)
Wind
Speed (km/h)
Temperature (*C) RH (%)
Rainfall (mm)
Solar Rad (wat/m2)
Dew
Point (*C)
2017 5 23 0 38 0 32.7 19 0 0 6.1
2017 5 23 1 225 0 31.7 19 0 0 5.2
2017 5 23 2 225 0 31.1 19 0 0 4.8
2017 5 23 3 225 0 30 25 0 0 7.8
2017 5 23 4 16 0 29.6 23.5 0 0 6.5
2017 5 23 5 16 0 30.2 19 0 0 4
2017 5 23 6 132 0 30.5 19 0 0 4.3
2017 5 23 7 132 0 30.3 24.7 0 0 7.9
2017 5 23 8 79 0 32.4 19 0 1487 5.8
2017 5 23 9 91 0 35.8 10.3 0 1485 -0.3
2017 5 23 10 124 3 37.7 10.3 0 1486 1.1
2017 5 23 11 145 4 39 10.3 0 1487 2.1
2017 5 23 12 146 4 40.6 8.5 0 1486 0.6
2017 5 23 13 145 3 40.8 8.5 0 1487 0.7
2017 5 23 14 129 1 42.1 7.7 0 1487 0.3
2017 5 23 15 80 1 43 7.7 0 1487 0.9
2017 5 23 16 136 1 42.7 7.7 0 0 0.7
2017 5 23 17 120 1 42.1 7.7 0 0 0.3
2017 5 23 18 90 0 41 7.7 0 0 -0.5
2017 5 23 19 90 0 39.1 7.7 0 0 -1.9
2017 5 23 20 90 0 36.9 8.5 0 0 -2.2
2017 5 23 21 90 0 36.2 9.4 0 0 -1.3
2017 5 23 22 90 0 34.5 12.9 0 0 1.9
2017 5 23 23 90 0 33.2 14.7 0 0 2.8
2017 5 24 0 90 0 32.5 14.7 0 0 2.2
2017 5 24 1 90 0 31.4 19 0 0 5
2017 5 24 2 90 0 30.8 19 0 0 4.5
2017 5 24 3 90 0 29.7 25 0 0 7.5
2017 5 24 4 90 0 28.9 26.5 0 0 7.7
2017 5 24 5 90 0 28.4 25 0 0 6.4
2017 5 24 6 90 0 28.3 26.8 0 0 7.3
2017 5 24 7 90 0 29 27.2 0 0 8.2
2017 5 24 8 42 0 31 19 0 0 4.7
2017 5 24 9 91 0 33.8 12 0 1486 0.3
2017 5 24 10 145 1 36.9 8.5 0 1486 -2.2
2017 5 24 11 94 1 39.6 7.7 0 1486 -1.5
2017 5 24 12 107 1 41.3 7.7 0 1487 -0.3
2017 5 24 13 146 1 43.1 6.8 0 1487 -0.7
2017 5 24 14 25 1 44.1 6.8 0 0 0.1
2017 5 24 15 139 0 44.3 6.8 0 0 0.2
2017 5 24 16 146 0 43.6 6.8 0 0 -0.3

Additional Information Deccan Remedies Limited
Pridhvi Envirotech (P) Limited. 61
Year Month Day Time
Wind
Dir (Deg)
Wind
Speed (km/h)
Temperature (*C) RH (%)
Rainfall (mm)
Solar Rad (wat/m2)
Dew
Point (*C)
2017 5 24 17 136 1 43 7.7 0 0 0.9
2017 5 24 18 146 0 42.5 7.7 0 0 0.6
2017 5 24 19 145 0 40.3 8.5 0 0 0.3
2017 5 24 20 145 0 38.2 9.4 0 0 0.2
2017 5 24 21 238 0 36.5 11.2 0 0 1.4
2017 5 24 22 241 0 35.1 19 0 0 8
2017 5 24 23 244 0 34.2 19 0 0 7.3
2017 5 25 0 278 0 33.8 26 0 0 11.6
2017 5 25 1 279 0 32.9 31.5 0 0 13.7
2017 5 25 2 279 0 32.1 32.1 0 0 13.3
2017 5 25 3 280 0 31.3 33.9 0 0 13.5
2017 5 25 4 280 0 30.8 33.5 0 0 12.8
2017 5 25 5 280 0 30.5 33.2 0 0 12.4
2017 5 25 6 280 0 29.7 34 0 0 12.1
2017 5 25 7 280 0 29.6 32.4 0 1488 11.3
2017 5 25 8 74 0 31.7 19 0 1484 5.2
2017 5 25 9 345 3 34.6 12 0 1482 0.9
2017 5 25 10 351 1 36.5 10.3 0 1482 0.2
2017 5 25 11 146 1 38.8 8.5 0 1483 -0.8
2017 5 25 12 111 1 41.2 8.5 0 1483 1
2017 5 25 13 145 1 42.7 9.4 0 1483 3.6
2017 5 25 14 98 1 43.7 8.5 0 1483 2.8
2017 5 25 15 115 0 44.1 8.5 0 1484 3.1
2017 5 25 16 129 0 41.6 9.4 0 0 2.7
2017 5 25 17 142 1 40.8 9.4 0 0 2.1
2017 5 25 18 145 4 39 10.3 0 0 2.1
2017 5 25 19 145 0 38.6 11.2 0 0 3
2017 5 25 20 269 0 37 19 0 0 9.6
2017 5 25 21 313 0 34.2 19 0 0 7.3
2017 5 25 22 319 0 33.3 19 0 0 6.6
2017 5 25 23 319 0 32.6 26 0 0 10.6
2017 5 26 0 319 0 31.9 27.1 0 0 10.6
2017 5 26 1 22 0 31.6 26 0 0 9.7
2017 5 26 2 63 0 32.1 27.6 0 1488 11
2017 5 26 3 63 0 31.8 27.5 0 1487 10.7
2017 5 26 4 62 0 31.4 31 0 1486 12.2
2017 5 26 5 62 0 31.2 39.2 0 1485 15.7
2017 5 26 6 309 0 30.7 49.1 0 1483 18.9
2017 5 26 7 309 0 30.3 52.9 0 1480 19.7
2017 5 26 8 326 0 31.3 42.4 0 1473 17
2017 5 26 9 49 0 33.7 26 0 1465 11.5

Additional Information Deccan Remedies Limited
Pridhvi Envirotech (P) Limited. 62
Year Month Day Time
Wind
Dir (Deg)
Wind
Speed (km/h)
Temperature (*C) RH (%)
Rainfall (mm)
Solar Rad (wat/m2)
Dew
Point (*C)
2017 5 26 10 128 0 35.9 19 0 1463 8.7
2017 5 26 11 114 3 38.7 16.4 0 1465 8.8
2017 5 26 12 255 1 40.2 14.7 0 1469 8.3
2017 5 26 13 145 3 41.4 12 0 1471 6.2
2017 5 26 14 120 3 42.3 12 0 1473 6.9
2017 5 26 15 84 3 42.3 11.2 0 1476 5.8
2017 5 26 16 112 3 42.1 12 0 1478 6.7
2017 5 26 17 83 0 40.7 12.9 0 1482 6.7
2017 5 26 18 43 0 39.7 14.7 0 1484 7.9
2017 5 26 19 1 0 39 15.5 0 1485 8.1
2017 5 26 20 21 0 37.7 19 0 1486 10.1
2017 5 26 21 5 0 36.7 19 0 1486 9.3
2017 5 26 22 5 0 36.2 19 0 1486 8.9
2017 5 26 23 220 0 35.1 19.9 0 1486 8.7
2017 5 27 0 278 0 33.2 30.5 0 1486 13.5
2017 5 27 1 224 1 30.7 46.2 0.2 1484 17.9
2017 5 27 2 313 0 27.4 52.1 0 1482 16.8
2017 5 27 3 316 0 27.8 50.2 0 1476 16.6
2017 5 27 4 313 0 27.6 53.2 0 1472 17.3
2017 5 27 5 280 0 27.3 54.3 0 1469 17.4
2017 5 27 6 1 0 27.2 47.4 0 1466 15.1
2017 5 27 7 5 1 27.7 49.9 0 1459 16.4
2017 5 27 8 9 3 28.9 44.5 0 1450 15.6
2017 5 27 9 31 4 30.4 38.6 0 1443 14.7
2017 5 27 10 100 4 32.4 31.1 0 1438 13.1
2017 5 27 11 16 3 34.5 26 0 1436 12.2
2017 5 27 12 63 1 37.3 19 0 1437 9.8
2017 5 27 13 0 1 38.4 19 0 1445 10.7
2017 5 27 14 77 1 39.1 19 0 1451 11.3
2017 5 27 15 79 1 40.6 17.3 0 1453 11.1
2017 5 27 16 142 0 40.9 16.4 0 1458 10.5
2017 5 27 17 88 0 41 16.4 0 1462 10.6
2017 5 27 18 360 0 39.8 17.3 0 1469 10.4
2017 5 27 19 0 0 38.6 19 0 1473 10.9
2017 5 27 20 146 1 35.2 25.2 0 1476 12.3
2017 5 27 21 4 0 33.4 19 0 1477 6.6
2017 5 27 22 5 0 32.9 20.8 0 1477 7.5
2017 5 27 23 120 3 32.3 32.9 0 1476 13.9
2017 5 28 0 210 3 28.3 44.9 0.2 1474 15.2
2017 5 28 1 232 0 27.9 50.9 0 1468 16.9
2017 5 28 2 238 0 27.1 47.6 0 1465 15.1

Additional Information Deccan Remedies Limited
Pridhvi Envirotech (P) Limited. 63
Year Month Day Time
Wind
Dir (Deg)
Wind
Speed (km/h)
Temperature (*C) RH (%)
Rainfall (mm)
Solar Rad (wat/m2)
Dew
Point (*C)
2017 5 28 3 234 0 27.3 50 0 1462 16
2017 5 28 4 2 0 27.6 43.9 0 1458 14.2
2017 5 28 5 360 0 27.7 45.6 0 1454 14.9
2017 5 28 6 139 0 27.4 46.3 0 1451 14.9
2017 5 28 7 189 0 27.6 46.1 0 1445 15
2017 5 28 8 146 0 27.8 43.7 0 1439 14.3
2017 5 28 9 146 0 29.3 38 0 1432 13.5
2017 5 28 10 197 0 31 33.2 0 1426 12.9
2017 5 28 11 8 0 33.2 27.1 0 1421 11.7
2017 5 28 12 117 1 35.8 19 0 1424 8.6
2017 5 28 13 33 1 37.6 19 0 1431 10.1
2017 5 28 14 16 3 38.4 19 0 1438 10.7
2017 5 28 15 341 6 39.4 19 0 1443 11.5
2017 5 28 16 22 3 40.4 19 0 1447 12.4
2017 5 28 17 73 1 40.1 19 0 1453 12.1
2017 5 28 18 73 0 39 19 0 1461 11.2
2017 5 28 19 84 0 37.7 19 0 1466 10.1
2017 5 28 20 84 0 36.7 19 0 1468 9.3
2017 5 28 21 9 1 35.3 19 0 1469 8.2
2017 5 28 22 0 3 33.2 26 0 1470 11.1
2017 5 28 23 353 0 32.2 26 0 1471 10.2
2017 5 29 0 163 4 31.2 45 0 1470 17.9
2017 5 29 1 139 6 25.9 66.9 0.2 1466 19.4
2017 5 29 2 149 3 25.4 65.3 0 1455 18.5
2017 5 29 3 120 0 25 75.7 0 1444 20.5
2017 5 29 4 120 0 24.2 76.6 0 1435 19.9
2017 5 29 5 299 0 24.1 75.2 0 1427 19.5
2017 5 29 6 299 0 24.3 77.3 0 1420 20.1
2017 5 29 7 40 0 24.3 75.7 0 1413 19.8
2017 5 29 8 357 0 25.8 61.7 0 1399 18
2017 5 29 9 55 1 28.4 43.4 0 1384 14.8
2017 5 29 10 55 8 30.8 35.1 0 1387 13.6
2017 5 29 11 129 4 33.1 29.5 1 1397 12.9
2017 5 29 12 259 0 33.7 20.9 0.2 1409 8.3
2017 5 29 13 248 0 27.1 37.7 0.2 1428 11.4
2017 5 29 14 251 0 27.3 34.1 0.5 1434 10
2017 5 29 15 259 0 27.7 36 0.2 1434 11.2
2017 5 29 16 259 0 30.4 20.2 0 1426 5.1
2017 5 29 17 328 0 27.9 25.9 0.7 1438 6.5
2017 5 29 18 330 0 31.8 19 0 1435 5.3
2017 5 29 19 328 0 32.9 19 0 1434 6.2

Additional Information Deccan Remedies Limited
Pridhvi Envirotech (P) Limited. 64
Year Month Day Time
Wind
Dir (Deg)
Wind
Speed (km/h)
Temperature (*C) RH (%)
Rainfall (mm)
Solar Rad (wat/m2)
Dew
Point (*C)
2017 5 29 20 330 0 33.1 19 0 1435 6.4
2017 5 29 21 330 0 33.3 25.2 0 1436 10.7
2017 5 29 22 330 0 33.3 20.8 0 1437 7.9
2017 5 29 23 330 0 33.3 19 0 1439 6.6
2017 5 30 0 330 0 33.4 19 0 1440 6.6
2017 5 30 1 330 0 33.4 26 0 1441 11.2
2017 5 30 2 330 0 33.4 26.8 0 1442 11.7
2017 5 30 3 330 0 33.4 27.4 0 1443 12
2017 5 30 4 330 0 33.3 27.7 0 1443 12.1
2017 5 30 5 330 0 33.3 28.3 0 1443 12.4
2017 5 30 6 330 0 33.2 28.3 0 1444 12.3
2017 5 30 7 330 0 33.1 28.1 0 1444 12.2
2017 5 30 8 330 0 33.1 28.3 0 1445 12.3
2017 5 30 9 330 0 33.1 28.6 0 1445 12.4
2017 5 30 10 330 0 33.1 29.9 0 1445 13.1
2017 5 30 11 330 0 33.2 22.5 0 1444 8.9
2017 5 30 12 330 0 32.2 26 0 1446 10.2
2017 5 30 13 330 0 31.9 19 0 1448 5.4
2017 5 30 14 282 0 32.6 27.5 0 1447 11.4
2017 5 30 15 282 0 33.3 26 0 1446 11.2
2017 5 30 16 282 0 33.4 25.2 0 1446 10.8
2017 5 30 17 282 0 33.5 25.6 0 1446 11.1
2017 5 30 18 282 0 33.5 25.6 0 1447 11.1
2017 5 30 19 282 0 33.5 24.3 0 1448 10.3
2017 5 30 20 282 0 33.5 26 0 1448 11.3
2017 5 30 21 283 0 33.6 31 0 1448 14.1
2017 5 30 22 283 0 33.6 28.3 0 1448 12.7
2017 5 30 23 283 0 33.6 27 0 1447 12
2017 5 31 0 283 0 33.6 27.5 0 1447 12.3
2017 5 31 1 283 0 33.6 27.3 0 1447 12.1
2017 5 31 2 283 0 33.6 27.4 0 1448 12.2
2017 5 31 3 283 0 33.5 28.3 0 1448 12.6
2017 5 31 4 283 0 33.4 28.9 0 1448 12.8
2017 5 31 5 283 0 33.4 29.8 0 1448 13.3
2017 5 31 6 283 0 33.4 30.4 0 1447 13.6
2017 5 31 7 283 0 33.3 31.1 0 1447 13.9
2017 5 31 8 283 0 33.2 32.4 0 1447 14.4
2017 5 31 9 283 0 33.3 32.4 0 1446 14.5
2017 5 31 10 283 0 33.4 32.4 0 1445 14.6
2017 5 31 11 283 0 31 33.1 0 1447 12.8
2017 5 31 12 283 0 30.3 25.9 0 1449 8.5
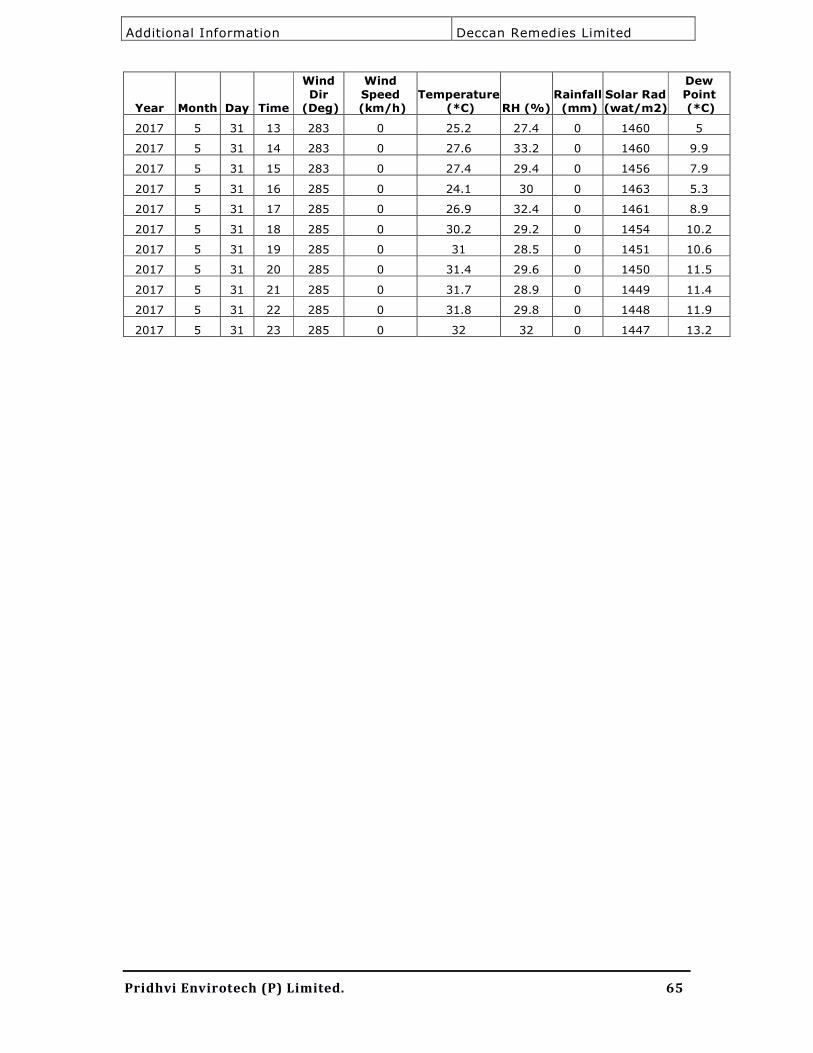
Additional Information Deccan Remedies Limited
Pridhvi Envirotech (P) Limited. 65
Year Month Day Time
Wind
Dir (Deg)
Wind
Speed (km/h)
Temperature (*C) RH (%)
Rainfall (mm)
Solar Rad (wat/m2)
Dew
Point (*C)
2017 5 31 13 283 0 25.2 27.4 0 1460 5
2017 5 31 14 283 0 27.6 33.2 0 1460 9.9
2017 5 31 15 283 0 27.4 29.4 0 1456 7.9
2017 5 31 16 285 0 24.1 30 0 1463 5.3
2017 5 31 17 285 0 26.9 32.4 0 1461 8.9
2017 5 31 18 285 0 30.2 29.2 0 1454 10.2
2017 5 31 19 285 0 31 28.5 0 1451 10.6
2017 5 31 20 285 0 31.4 29.6 0 1450 11.5
2017 5 31 21 285 0 31.7 28.9 0 1449 11.4
2017 5 31 22 285 0 31.8 29.8 0 1448 11.9
2017 5 31 23 285 0 32 32 0 1447 13.2

Additional Information Deccan Remedies Limited
Pridhvi Envirotech (P) Limited. 66
Annexure-III
Ambient Air Quality Data
Location: AAQ1-Project site
May-2017
Date PM10 (µg/m3)
PM2.5 (µg/m3)
SO2 (µg/m3)
Nox (µg/m3)
NH3 (µg/m3)
CO (µg/m3)
VOC (ppm)
2.5.2017 62.3 23.8 16.3 18.3 17.6 1.7 1.1
3.5.2017 64.2 23.1 13.4 19.4 16.3 2.1 1.5
9.5.2017 66.4 20.6 9.3 15.2 16.2 2.2 1.2
10.5.2017 59.3 21.4 15.3 14.7 17.3 2.1 1.6
18.5.2017 60.2 18.5 14.7 21.6 20.3 2.2 1.0
19.5.2017 58.3 27.4 10.8 20.3 18.8 2.1 1.0
24.5.2017 63.2 22.3 13.2 17.3 16.3 2.1 1.2
25.5.2017 59.2 24.2 15.2 19.3 20.1 1.8 1.4
Max 66.4 27.4 16.3 21.6 20.3 2.2 1.6
min 58.3 18.5 9.3 14.7 16.2 1.7 1.0
mean 61.6 22.7 13.5 18.3 17.9 2.0 1.3
Ambient Air Quality Data
Location: AAQ2- Burdhiphad
May 2017
Date
PM10
(µg/m3)
PM2.5
(µg/m3)
SO2
(µg/m3)
Nox
(µg/m3)
NH3
(µg/m3)
CO
(µg/m3)
VOC
(ppm)
2.5.2017 54.7 18.5 14.2 15.3 20.4 1.4 1.6
3.5.2017 53.2 19.5 13.2 13.2 26.7 1.2 1.4
9.5.2017 60.4 20.3 13.5 18.3 23.2 1.4 2.1
10.5.2017 55.3 21.3 13.6 12.3 25.3 1.2 2.6
18.5.2017 52.3 19.3 14.6 15.3 19.6 1.5 1.1
19.5.2017 60.2 19.8 11.3 16.4 21.2 1.2 1.2
24.5.2017 58.2 17.6 14.2 14.6 23.4 1.4 1.4
25.5.2017 54.3 20.7 12.3 15.3 24.3 1.2 1.8
Max 60.4 21.3 14.6 18.3 26.7 1.5 2.6
min 52.3 17.6 11.3 12.3 19.6 1.2 1.1
mean 56.075 19.625 13.3625 15.0875 23.0125 1.3125 1.65

Additional Information Deccan Remedies Limited
Pridhvi Envirotech (P) Limited. 67
Ambient Air Quality Data
Location:AAQ3 Kashimpur
May-2017
Date
PM10
(µg/m3)
PM2.5
(µg/m3)
SO2
(µg/m3)
Nox
(µg/m3)
NH3
(µg/m3)
CO
(µg/m3)
VOC
(ppm)
2.5.2017 51.3 20.3 15.2 15.1 26.3 1.2 1.5
3.5.2017 49.5 18.6 12.3 15.2 24.2 1.5 1.2
9.5.2017 52.3 16.4 15.2 14.3 23.6 1.2 1.4
10.5.2017 55.3 17.3 14.5 17.6 19.6 1.5 1.8
18.5.2017 60.2 22.4 13.7 16.8 20.1 1.3 1.9
19.5.2017 60.2 18.3 10.2 16.4 23.5 1.5 1.2
24.5.2017 51.2 20.7 16.2 14.8 26.3 1.5 1.5
25.5.2017 53.2 20.3 12.3 16.2 20.3 1.4 1.2
Max 60.2 22.4 16.2 17.6 26.3 1.5 1.9
min 49.5 16.4 10.2 14.3 19.6 1.2 1.2
mean 54.15 19.2875 13.7 15.8 22.9875 1.3875 1.4625
Ambient Air Quality Data
Location: AAQ4 Zahirabad
May-2017
PM10 PM2.5 SO2 Nox NH3 CO VOC
2.5.2017 64.3 24.3 12.6 12.5 27.3 1.2 1.4
3.5.2017 65.3 20.3 14.6 12.3 25.2 1.6 1.7
9.5.2017 66.3 24.2 12.4 17.3 23.2 1.2 1.2
10.5.2017 65.3 20.3 14 16.2 20.7 1.4 1.4
18.5.2017 53.7 31.5 9.8 12.3 24.3 1.5 1.2
19.5.2017 63.2 20.3 12.3 15.2 28.3 1.2 1.7
24.5.2017 58.3 28.4 12.4 16.3 23.2 1.6 1.2
25.5.2017 58.2 23.6 12.3 16.3 21.2 1.3 1.6
Max 66.3 31.5 14.6 17.3 28.3 1.6 1.7
min 53.7 20.3 9.8 12.3 20.7 1.2 1.2
mean 61.825 24.1125 12.55 14.8 24.175 1.375 1.425

Additional Information Deccan Remedies Limited
Pridhvi Envirotech (P) Limited. 68
Annexure -II
Ambient Air Quality Data
Location:AAQ5 Kotthuru(B)
May-2017
PM10 PM2.5 SO2 Nox NH3 CO VOC
2.5.2017 49.3 23.2 13.2 14.3 19.8 1.6 1.3
3.5.2017 53.2 21.3 13.6 14.6 21.5 1.2 1.2
9.5.2017 45.6 22.5 13.2 15.2 20.6 1.5 1.6
10.5.2017 49.2 24.2 13.2 14.2 18.7 1.2 1.2
18.5.2017 69.5 19.5 13.2 18.3 20.3 1.1 1.5
19.5.2017 50.6 20.3 12.3 16.2 23.2 1.6 1.2
24.5.2017 70.5 21.4 14.3 14.2 21.8 1.2 1.6
25.5.2017 63.2 22.4 12.3 15.2 20.4 1.7 1.3
Max 70.5 24.2 14.3 18.3 23.2 1.7 1.6
min 45.6 19.5 12.3 14.2 18.7 1.1 1.2
mean 56.4 21.9 13.2 15.3 20.8 1.4 1.4
Ambient Air Quality Data
Location:AAQ6 Rejaital
May-2017
PM10 PM2.5 SO2 Nox NH3 CO VOC
2.5.2017 54.3 21.2 13.5 12.7 23.4 1.4 1.5
3.5.2017 52.3 24.2 12.5 14.3 18.7 1.5 1.2
9.5.2017 53.2 26.2 12.2 15.6 25.3 1.3 1.2
10.5.2017 55.3 21.2 11.5 14 23.4 1.2 1.2
18.5.2017 49.2 26.2 12.5 13.6 20.5 1.5 1.7
19.5.2017 60.2 23.2 14.2 14.6 20.6 1.2 1.2
24.5.2017 61.4 26.2 12.5 15.5 19.3 1 1.2
25.5.2017 58.2 26.2 13.2 13.9 21.3 1.1 1.8
Max 61.4 26.2 14.2 15.6 25.3 1.5 1.8
min 49.2 21.2 11.5 12.7 18.7 1 1.2
mean 55.5 24.3 12.8 14.3 21.6 1.3 1.4

Additional Information Deccan Remedies Limited
Pridhvi Envirotech (P) Limited. 69
Ambient Air Quality Data
Location:AAQ7 Barur
May-2017
PM10 PM2.5 SO2 Nox NH3 CO VOC
2.5.2017 65.3 20.1 11.2 13.7 20.5 1.4 1.4
3.5.2017 46.5 21.5 12.2 14.5 16.7 1.2 1.2
9.5.2017 49.9 20.3 10.3 14.7 21.5 1.5 1.5
10.5.2017 51.2 21.4 11.2 15.6 20.6 1.2 1.2
18.5.2017 56.3 22.3 12.3 15.3 18.7 1.2 1.2
19.5.2017 48.8 20.1 11.2 13.2 18.6 1.2 2.6
24.5.2017 67.2 18.2 12.3 12.4 20.3 1.4 1.4
25.5.2017 53.4 19.3 12.1 14.2 21.4 1.5 1.5
Max 67.2 22.3 12.3 15.6 21.5 1.5 2.6
min 46.5 18.2 10.3 12.4 16.7 1.2 1.2
mean 54.825 20.4 11.6 14.2 19.7875 1.325 1.5
Ambient Air Quality Data
Location:AAQ8 Gangwar
May-2017
PM10 PM2.5 SO2 NOX NH3 CO VOC
2.5.2017 52.2 20.3 11.3 11.9 21.2 1.2 2
3.5.2017 56.2 17.4 13.2 12.4 18.4 1.6 1.8
9.5.2017 50.6 20.4 12.6 19.6 19.4 1.2 1
10.5.2017 52.3 19.4 12.4 12.5 21.3 1.5 1.9
18.5.2017 55.3 21.3 12.4 16.2 20.5 1.5 2.1
19.5.2017 52.4 26.5 11.2 15.2 20.8 1.2 1.7
24.5.2017 56.2 23.4 10.3 17.3 22.1 1 1.2
25.5.2017 49.8 19.7 12.2 14.2 26.4 1.2 1.6
Max 56.2 26.5 13.2 19.6 26.4 1.6 2.1
min 49.8 17.4 10.3 11.9 18.4 1 1
mean 53.125 21.05 11.95 14.9125 21.2625 1.3 1.6625


