Subscriber access provided by UNIV OF MARYLAND COLL PARK The Journal of Physical Chemistry C is published by the American Chemical Society. 1155 Sixteenth Street N.W., Washington, DC 20036 Article Ion-Mobility Spectrometry of Nickel Nanoparticle Oxidation Kinetics: Application to Energetic Materials Lei Zhou, Ashish Rai, Nicholas Piekiel, Xiaofei Ma, and Michael R. Zachariah J. Phys. Chem. C, 2008, 112 (42), 16209-16218 • DOI: 10.1021/jp711235a • Publication Date (Web): 25 September 2008 Downloaded from http://pubs.acs.org on December 5, 2008 More About This Article Additional resources and features associated with this article are available within the HTML version: • Supporting Information • Access to high resolution figures • Links to articles and content related to this article • Copyright permission to reproduce figures and/or text from this article
Transcript
Subscriber access provided by UNIV OF MARYLAND COLL PARK
The Journal of Physical Chemistry C is published by the American ChemicalSociety. 1155 Sixteenth Street N.W., Washington, DC 20036
Article
Ion-Mobility Spectrometry of Nickel NanoparticleOxidation Kinetics: Application to Energetic Materials
Lei Zhou, Ashish Rai, Nicholas Piekiel, Xiaofei Ma, and Michael R. ZachariahJ. Phys. Chem. C, 2008, 112 (42), 16209-16218 • DOI: 10.1021/jp711235a • Publication Date (Web): 25 September 2008
Downloaded from http://pubs.acs.org on December 5, 2008
More About This Article
Additional resources and features associated with this article are available within the HTML version:
• Supporting Information• Access to high resolution figures• Links to articles and content related to this article• Copyright permission to reproduce figures and/or text from this article
Ion-Mobility Spectrometry of Nickel Nanoparticle Oxidation Kinetics: Application toEnergetic Materials
Lei Zhou, Ashish Rai, Nicholas Piekiel, Xiaofei Ma, and Michael R. Zachariah*Department of Mechanical Engineering and Department of Chemistry and Biochemistry UniVersity ofMaryland, College Park, Maryland 20742
ReceiVed: NoVember 27, 2007; ReVised Manuscript ReceiVed: May 16, 2008
Nanoscaled nickel particles have attracted interest for their potential use as a fuel in energetic materials. Inthis work, we combined two ion-mobility spectrometry approaches, tandem differential mobility analysis(TDMA) and tandem differential mobility-particle mass analysis (DMA-APM), to study the size-resolvedreactivity of nickel nanoparticles. Nickel nanoparticles were generated in situ by using gas-phase thermalpyrolysis of nickel carbonyl. Four particle sizes (40, 62, 81, and 96 nm, mobility size) were then selected byusing a differential mobility analyzer. These particles were sequentially oxidized in a flow reactor at varioustemperatures (25-1100 °C). The size and mass change of the size-selected and -reacted particles were thenmeasured by a second DMA, or an APM. We found that both particle size and mass were increased as thetemperature increased. However, at higher temperature (600-1100 °C), a different mass and size changebehavior was observed that could be attributed to a phase transition between NiO and Ni2O3. A shrinkingcore model employed to extract the size-resolved kinetic parameters shows that the activation energy foroxidation decreased with decreasing particle size. The burning time power dependence on particle size wasfound to be less than 2 and nickel particles were found to be kinetically more active than aluminum.
IntroductionRecent advancements in the field of so-called “nanoenergetic”
materials are focused on either enhancing or tuning reactivity.On one level this issue reduces to a length-scale argument,whereby smaller fuel/oxidizer combinations result in smallerdiffusion lengths and therefore higher reactivity. On anotherlevel, this discussion leads to choices of different thermiteformulation. Although there have been considerable successesin enhancing the energy release rate of thermite systems, thegoal of tuning the reactivity is still a subject for further research.In one of our previous works, we reported a method to controlthe energy release rate of energetic nanoparticles by creationof a core shell nanostructure on the oxidizer particle.1 Similarly,the reactivity of nanoenergetic material can also be controlledby modifying the structure of the aluminum fuel.2 More recentlywe have seen that mixtures of nanoaluminum and nanoboronoutperform either material on their own.3 Those results suggestboth material choices (e.g., Ni, Ti, etc.) and nanoarchitectureas a means to tune the energy release profiles of materialsbeyond aluminum. The application of those materials wouldtake the form of composite materials, e.g., Al/Ni alloy, or metalparticles with a different morphology such as aluminum corewith nickel coating. While considerable opportunity exists forimprovements, in actuality very little attention has been paidto the kinetics of reactivity of small metal particles beyondnanoaluminum. While the oxidation of nickel in the form ofbulk sample or thin films has been studied for over a century,4–27
there are only a few studies on the oxidation of nickelnanoparticles.5,28–32 Carter developed a solid state kinetic modelbased on a diffusion-controlled mechanism for the oxidationof ∼100 µm particles using a microbalance.22 Fromhold obtainedthe same oxidation rate law using a coupled current approachwith the assumption of zero space charge.6 Karmhag and
Niklasson explored the oxidation kinetics of micron size nickelparticles using thermogravimetric measurements, and obtaineda lower activation energy than bulk nickel.31,32 As particle sizedecreases into the nanoscale, the mass transfer limitations shouldbe reduced and we should expect to see an enhancement inreactivity. Our previous work on the oxidation of nanoaluminumparticles shows that both the overall rate constant and activationenergy are size dependent.33,34 Karmhag et al. studied theoxidation of nano-sized nickel particles at low temperatures(135-235 °C) using thermogravimetric measurements andsuggested that nonlinear diffusion resulting from space and localcharging occurs in this case, and results in a higher rate constantand lower activation energy.29 The same group also probed thesize-dependent oxidation kinetics, and found that the rateconstant roughly goes as the square of the inverse of particlediameter.30 They further proposed a phenomenological modelto consider the nonlinear effect in oxidation of nanoscaledparticles.28
All the above studies were carried out with use of conven-tional dynamic thermal techniques such as thermogravimetry.It is well-known that those methods are greatly influenced byheat and mass transfer effects such that the results are biasedby experimental artifacts.34,35 In this work we employ aerosol-based techniques to study the oxidation kinetics of Ni nano-particles. Our previous results on the study of solid-gas phasereaction kinetics show that the reaction rates obtained usingaerosol-based techniques are much higher than those fromconventional methods, which may represent the intrinsic reactiv-ity of nanoparticles.34,35
The basic idea of the experimental approach is to prepare Niparticles of characterized size/shape (i.e., monodisperse) andmonitor changes during oxidation in free-flight (i.e., no sub-strate). This study consists of two experiments, both of whichrely on ion-mobility separation. A Tandem Differential MobilityAnalyzer (DMA) system12,36,37 is used to measure the size* Corresponding author. E-mail: [email protected].
J. Phys. Chem. C 2008, 112, 16209–16218 16209
10.1021/jp711235a CCC: $40.75 2008 American Chemical SocietyPublished on Web 09/25/2008
change after oxidation, while the mass change is tracked by aDMA-APM (Aerosol Particle Mass Analyzer) system.33,38–40 Themass and size changes of nanoparticles are studied from roomtemperature to 1100 °C. The average density obtained from massand size measurements shows the nickel nanoparticle oxidationprocess can be correlated to the formation of both NiO andNi2O3 (4Ni + 3O2 f 2Ni2O3, 2Ni + O2 f 2NiO) and a phasechange region where both the oxidation of nickel and decom-position of Ni2O3 to NiO (2Ni2O3 f 4NiO + O2) occursimultaneously. The reaction rates were then extracted from theexperiment data as a function of particle size.
Experimental Approach
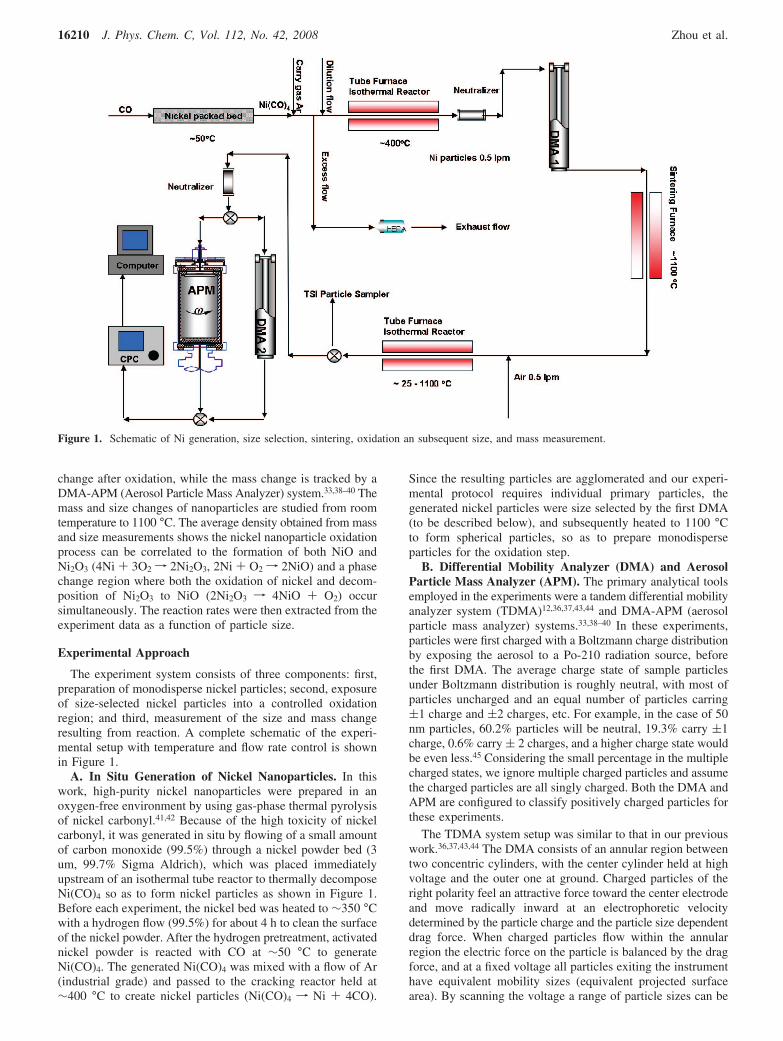
The experiment system consists of three components: first,preparation of monodisperse nickel particles; second, exposureof size-selected nickel particles into a controlled oxidationregion; and third, measurement of the size and mass changeresulting from reaction. A complete schematic of the experi-mental setup with temperature and flow rate control is shownin Figure 1.
A. In Situ Generation of Nickel Nanoparticles. In thiswork, high-purity nickel nanoparticles were prepared in anoxygen-free environment by using gas-phase thermal pyrolysisof nickel carbonyl.41,42 Because of the high toxicity of nickelcarbonyl, it was generated in situ by flowing of a small amountof carbon monoxide (99.5%) through a nickel powder bed (3um, 99.7% Sigma Aldrich), which was placed immediatelyupstream of an isothermal tube reactor to thermally decomposeNi(CO)4 so as to form nickel particles as shown in Figure 1.Before each experiment, the nickel bed was heated to ∼350 °Cwith a hydrogen flow (99.5%) for about 4 h to clean the surfaceof the nickel powder. After the hydrogen pretreatment, activatednickel powder is reacted with CO at ∼50 °C to generateNi(CO)4. The generated Ni(CO)4 was mixed with a flow of Ar(industrial grade) and passed to the cracking reactor held at∼400 °C to create nickel particles (Ni(CO)4 f Ni + 4CO).
Since the resulting particles are agglomerated and our experi-mental protocol requires individual primary particles, thegenerated nickel particles were size selected by the first DMA(to be described below), and subsequently heated to 1100 °Cto form spherical particles, so as to prepare monodisperseparticles for the oxidation step.
B. Differential Mobility Analyzer (DMA) and AerosolParticle Mass Analyzer (APM). The primary analytical toolsemployed in the experiments were a tandem differential mobilityanalyzer system (TDMA)12,36,37,43,44 and DMA-APM (aerosolparticle mass analyzer) systems.33,38–40 In these experiments,particles were first charged with a Boltzmann charge distributionby exposing the aerosol to a Po-210 radiation source, beforethe first DMA. The average charge state of sample particlesunder Boltzmann distribution is roughly neutral, with most ofparticles uncharged and an equal number of particles carring(1 charge and (2 charges, etc. For example, in the case of 50nm particles, 60.2% particles will be neutral, 19.3% carry (1charge, 0.6% carry ( 2 charges, and a higher charge state wouldbe even less.45 Considering the small percentage in the multiplecharged states, we ignore multiple charged particles and assumethe charged particles are all singly charged. Both the DMA andAPM are configured to classify positively charged particles forthese experiments.
The TDMA system setup was similar to that in our previouswork.36,37,43,44 The DMA consists of an annular region betweentwo concentric cylinders, with the center cylinder held at highvoltage and the outer one at ground. Charged particles of theright polarity feel an attractive force toward the center electrodeand move radically inward at an electrophoretic velocitydetermined by the particle charge and the particle size dependentdrag force. When charged particles flow within the annularregion the electric force on the particle is balanced by the dragforce, and at a fixed voltage all particles exiting the instrumenthave equivalent mobility sizes (equivalent projected surfacearea). By scanning the voltage a range of particle sizes can be
Figure 1. Schematic of Ni generation, size selection, sintering, oxidation an subsequent size, and mass measurement.
16210 J. Phys. Chem. C, Vol. 112, No. 42, 2008 Zhou et al.
extracted and counted to yield a size distribution. In our system,DMA-1 is held at a fixed voltage, and thus is used as a band-pass filter to create the monodisperse particle source, by selectingparticles with the same electrical mobility size. In the size rangeof consideration here, the DMA functions as a source ofmonoarea particles.46 However, since DMA-1 selected particlesare aggregates, a sintering furnace was placed after DMA-1 toform individual spherical particles for the oxidation step. Asecond DMA was operated in voltage-step mode with acondensation particle counter (CPC) as a particle size distribu-tion measurement tool to track the size change after the oxidationprocess. A second Po-210 neutralizer was placed between theoxidation furnace and DMA-2 to recharge the particles. Thiswas necessary as with the high-temperature treatment (sinteringor high oxidation temperatures) some of the particles lost theircharge. In summary, the TDMA experiment tracks changes inphysical size as a result of oxidation.
In a parallel experiment the change in particle mass afteroxidation was measured by an aerosol particle mass analyzer(APM) coupled with a CPC. The APM is a relatively newtechnique that can determine the particle mass distribution basedon particle mass to charge ratio.40 The APM consists of twoconcentric cylindrical electrodes that rotate together at acontrolled speed. An electrical field is created by applying highvoltage on the inner electrode while the outer one is held atground. Charged particles flowing within the concentric cylin-ders experience opposing centrifugal and electrostatic forces andas a result particles exiting the instrument at fixed voltage androtation speed all have the same nominal mass. By scanningeither the voltage or the rotation speed, the particle massdistribution (independent of particle shape) can be determined.Our previous experiments have used the DMA-APM techniqueto measure the inherent density of nanoparticles, as well as tostudy the mechanism of aluminum oxidation.33,38
On the basis of operating conditions for the DMA and APMwe estimate uncertainties as follows. For the DMA operatingconditions the uncertainty is based on the theoretical transferfunction, which will give an uncertainly in the peak particlesize of (4%. We then use Gaussian fit to determine the peaksize, which would have a precision uncertainty of no more than1%. A similar result can be obtained for the APM; however,the uncertainties are not due to the transfer function butuncertainties in the step voltage, which has a resolution of only(0.5 V, which gives an uncertainty in mass of ∼4%.
Using the root-sum-square (RSS) method, we can estimatedthe uncertainty of density calculation at ∼5%. This is consistentwith prior work (unpublished) using combined DMA/APM onreference aerosols (NaCl and DOP) which gave an experimen-tally determined uncertainly in density of 4%.
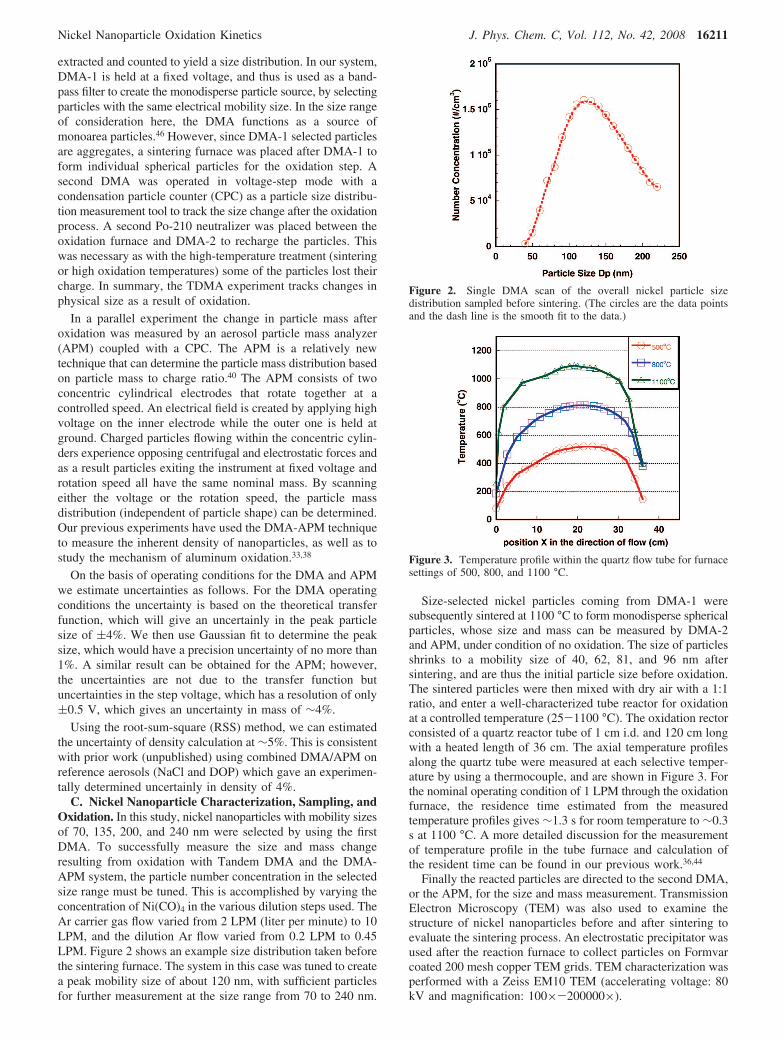
C. Nickel Nanoparticle Characterization, Sampling, andOxidation. In this study, nickel nanoparticles with mobility sizesof 70, 135, 200, and 240 nm were selected by using the firstDMA. To successfully measure the size and mass changeresulting from oxidation with Tandem DMA and the DMA-APM system, the particle number concentration in the selectedsize range must be tuned. This is accomplished by varying theconcentration of Ni(CO)4 in the various dilution steps used. TheAr carrier gas flow varied from 2 LPM (liter per minute) to 10LPM, and the dilution Ar flow varied from 0.2 LPM to 0.45LPM. Figure 2 shows an example size distribution taken beforethe sintering furnace. The system in this case was tuned to createa peak mobility size of about 120 nm, with sufficient particlesfor further measurement at the size range from 70 to 240 nm.
Size-selected nickel particles coming from DMA-1 weresubsequently sintered at 1100 °C to form monodisperse sphericalparticles, whose size and mass can be measured by DMA-2and APM, under condition of no oxidation. The size of particlesshrinks to a mobility size of 40, 62, 81, and 96 nm aftersintering, and are thus the initial particle size before oxidation.The sintered particles were then mixed with dry air with a 1:1ratio, and enter a well-characterized tube reactor for oxidationat a controlled temperature (25-1100 °C). The oxidation rectorconsisted of a quartz reactor tube of 1 cm i.d. and 120 cm longwith a heated length of 36 cm. The axial temperature profilesalong the quartz tube were measured at each selective temper-ature by using a thermocouple, and are shown in Figure 3. Forthe nominal operating condition of 1 LPM through the oxidationfurnace, the residence time estimated from the measuredtemperature profiles gives ∼1.3 s for room temperature to ∼0.3s at 1100 °C. A more detailed discussion for the measurementof temperature profile in the tube furnace and calculation ofthe resident time can be found in our previous work.36,44
Finally the reacted particles are directed to the second DMA,or the APM, for the size and mass measurement. TransmissionElectron Microscopy (TEM) was also used to examine thestructure of nickel nanoparticles before and after sintering toevaluate the sintering process. An electrostatic precipitator wasused after the reaction furnace to collect particles on Formvarcoated 200 mesh copper TEM grids. TEM characterization wasperformed with a Zeiss EM10 TEM (accelerating voltage: 80kV and magnification: 100×-200000×).
Figure 2. Single DMA scan of the overall nickel particle sizedistribution sampled before sintering. (The circles are the data pointsand the dash line is the smooth fit to the data.)
Figure 3. Temperature profile within the quartz flow tube for furnacesettings of 500, 800, and 1100 °C.
A. Size and Mass Measurements of Nickel NanoparticleOxidation. The morphology of nickel nanoparticles as they exitthe generator is shown in Figure 4a and indicates the particlesare highly aggregated with primary particles less than 5 nm. Atthe high oxidation temperatures, oxidation and sintering (whichdecreases surface area) would occur simultaneously for suchsmall primary particle size, and make the measurements andsubsequent data analysis too ambiguous. For this reason wechoose to sinter the aggregates to spheres. TEM images of thepolydisperse particles sampled after the sintering furnace areshown in Figure 4b and confirm that the aggregates weresuccessfully sintered to form spheres. Note that the TEM samplewas prepared by sintering polydisperse particles without DMA-1selection, and although the sintering process would result inperfectly spherical particles without any aggregate structure,47
the high concentration of generated particles leads to reaggre-
gation. This reaggregation can be prevented by first sizeselecting particles with DMA-1. Mobility sizes of 70, 135, 200,and 240 nm aggregate particles were selected, their size andmass after sintering were subsequently measured with DMA-2and APM, and the results are show in Figure 5. The particlesizes shrink to 40, 62, 81, and 96 nm after sintering and themeasured mass (APM) and size (DMA) show a relationship ofmass ∼Dp3.006, implying that individual spherical nickel particleswere obtained for the subsequent oxidation step.
We now turn to the size-selected measurements. Mobilitysize-selected Ni particles of 40, 62, 81, and 96 nm (aftersintering) were mixed with air and oxidized, following whichthe size or mass of the reacted particles is measured by a secondDMA or APM.
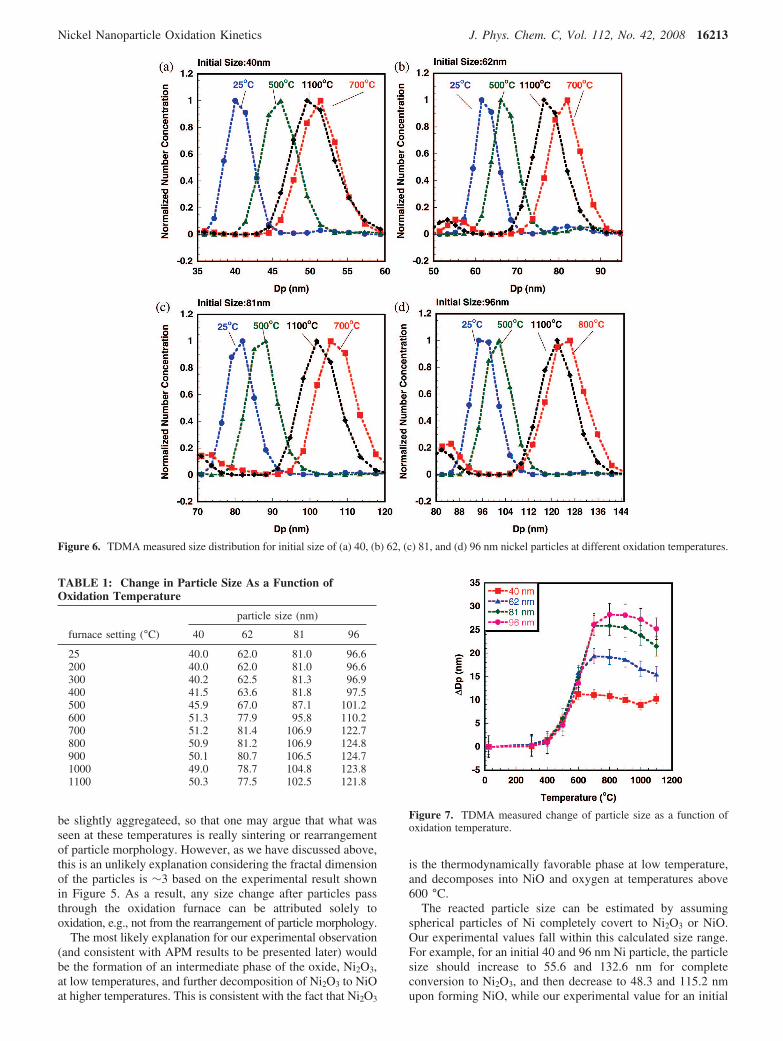
Panels a, b, c, and d of Figure 6 show normalized particlesize distributions measured by DMA-2 at selected furnacetemperatures for initial mobility size of 40, 62, 81, and 96 nm,respectively. The size distributions obtained for each furnacetemperature were fit to a Gaussian distribution to determine thepeak size. As mentioned above, the initial unreacted particlesize is determined from DMA 2 at 25 °C. Furthermore,measurements of particle oxidation at 200 °C show no sizechange, indicating that reaction if there is any is below ourdetection limit, which we estimate from prior work to be ∼0.3nm in diameter.
The TDMA experimental results in Figure 6 show that theparticle size first increases as we increase the furnace temper-ature, and reaches a size maximum at 600 (for particles withinitial size 40 nm), 700 (for particles with initial sizes 62 and81 nm), and 800 °C (for particles with initial size 96 nm).Further increases in the reaction temperature result in decreasesin particle size as the peak size decreased from a maximum of51.3 to 49 nm, 81.4 to 77.5 nm, 106.9 to 102.5 nm, and 124.8to 121.8 nm for particles with initial sizes of 40, 62, 81, and 96nm, respectively. The detailed particle peak size data are shownin Table 1, and the size change ∆Dp as a function of furnacetemperature is shown in Figure 7.
The TDMA experiment indicates that the oxidation starts at∼300 °C as evidenced by an increase in particle size. This sizeincrease results because nickel oxidation forms a lower densityoxide than the zerovalent metal. However, the size increase isnot continuous in temperature, and in the higher temperatureregions (above 600 °C), a significant size decrease is observedfor all particle sizes. There are several possible reasons that cancontribute to the shrinkage of particles at high temperatures.First, some particles are not perfectly spherical, and some may
Figure 4. TEM micrographs of nickel samples: (a) before sintering(b) after sintering.
Figure 5. APM measured mass (Y axis) and TDMA measured initialparticle size (X axis).
16212 J. Phys. Chem. C, Vol. 112, No. 42, 2008 Zhou et al.
be slightly aggregateed, so that one may argue that what wasseen at these temperatures is really sintering or rearrangementof particle morphology. However, as we have discussed above,this is an unlikely explanation considering the fractal dimensionof the particles is ∼3 based on the experimental result shownin Figure 5. As a result, any size change after particles passthrough the oxidation furnace can be attributed solely tooxidation, e.g., not from the rearrangement of particle morphology.
The most likely explanation for our experimental observation(and consistent with APM results to be presented later) wouldbe the formation of an intermediate phase of the oxide, Ni2O3,at low temperatures, and further decomposition of Ni2O3 to NiOat higher temperatures. This is consistent with the fact that Ni2O3
is the thermodynamically favorable phase at low temperature,and decomposes into NiO and oxygen at temperatures above600 °C.
The reacted particle size can be estimated by assumingspherical particles of Ni completely covert to Ni2O3 or NiO.Our experimental values fall within this calculated size range.For example, for an initial 40 and 96 nm Ni particle, the particlesize should increase to 55.6 and 132.6 nm for completeconversion to Ni2O3, and then decrease to 48.3 and 115.2 nmupon forming NiO, while our experimental value for an initial
Figure 6. TDMA measured size distribution for initial size of (a) 40, (b) 62, (c) 81, and (d) 96 nm nickel particles at different oxidation temperatures.
TABLE 1: Change in Particle Size As a Function ofOxidation Temperature
40 nm particle increases to 51.3 nm at 600 °C, and then shrinksto 49 nm at 1000 °C. For an initial size of 96 nm particle thesize is 124.8 nm at 800 °C and 121.8 nm at 1100 °C. Alsothese results show that the smaller the initial particle size, thecloser we achieve to full conversion, while larger particlesrequire a higher temperature to achieve full conversion.
To further investigate the oxidation of nickel nanoparticlesand evaluate the phase behavior observed in the TDMAexperiments, we substitute the APM for the second DMA totrack particle mass changes due to oxidation. As discussedpreviously, the APM classifies particles by mass through abalance of electrostatic and the centrifugal forces.40 For each
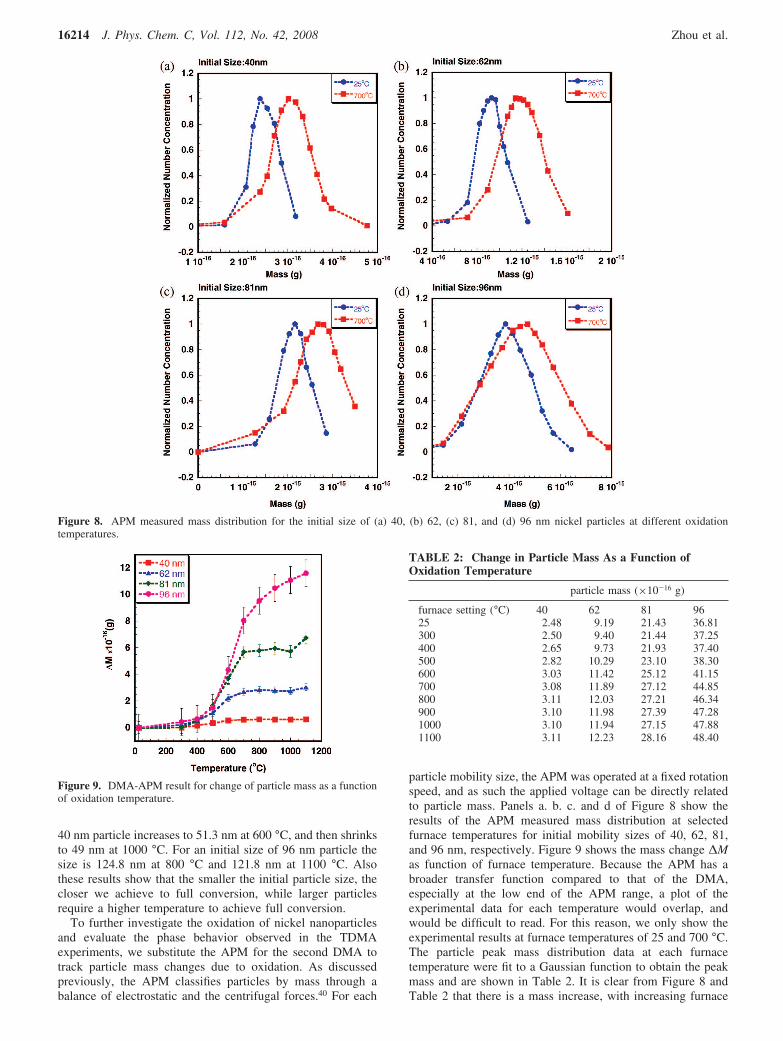
particle mobility size, the APM was operated at a fixed rotationspeed, and as such the applied voltage can be directly relatedto particle mass. Panels a. b. c. and d of Figure 8 show theresults of the APM measured mass distribution at selectedfurnace temperatures for initial mobility sizes of 40, 62, 81,and 96 nm, respectively. Figure 9 shows the mass change ∆Mas function of furnace temperature. Because the APM has abroader transfer function compared to that of the DMA,especially at the low end of the APM range, a plot of theexperimental data for each temperature would overlap, andwould be difficult to read. For this reason, we only show theexperimental results at furnace temperatures of 25 and 700 °C.The particle peak mass distribution data at each furnacetemperature were fit to a Gaussian function to obtain the peakmass and are shown in Table 2. It is clear from Figure 8 andTable 2 that there is a mass increase, with increasing furnace
Figure 8. APM measured mass distribution for the initial size of (a) 40, (b) 62, (c) 81, and (d) 96 nm nickel particles at different oxidationtemperatures.
Figure 9. DMA-APM result for change of particle mass as a functionof oxidation temperature.
TABLE 2: Change in Particle Mass As a Function ofOxidation Temperature
16214 J. Phys. Chem. C, Vol. 112, No. 42, 2008 Zhou et al.
temperature, that reaches a maximum at above 600 °C. On theother hand, from Figure 9, we can see in the hypothesized phasechange region that the measured value for the mass fluctuateswithin the experimental uncertainty for initial 40, 62, and 81nm particles, and increases slowly with increased temperaturefor the initial 96 nm particle. As we discussed above, thetheoretical particle size should grow to 55.6 and 136.6 nm foran initial 40 and 96 nm nickel particle, if we assume completeconversion, while the DMA measured value is 51.3 and 124.8nm. This suggests that the nickel particle could act as amulticomponent oxide during the oxidation process.
Presumably the particle would have a nickel core with anouter oxide layer that contains both NiO and Ni2O3. Both theoxidation of the nickel core and decomposition of the outerNi2O3 layer could occur simultaneously and result in a roughlyconstant particle mass as observed for small particles, and slowmass gain for large particles.
Our previous work showed that the APM when combinedwith TEM image analysis can accurately determine particle
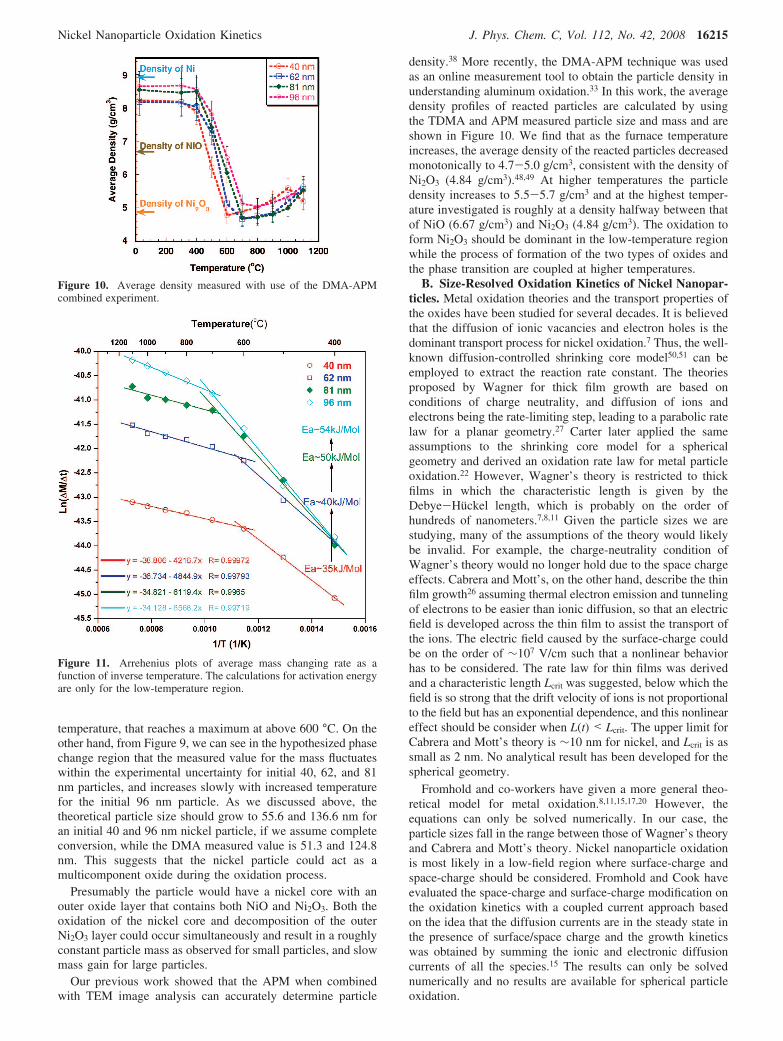
density.38 More recently, the DMA-APM technique was usedas an online measurement tool to obtain the particle density inunderstanding aluminum oxidation.33 In this work, the averagedensity profiles of reacted particles are calculated by usingthe TDMA and APM measured particle size and mass and areshown in Figure 10. We find that as the furnace temperatureincreases, the average density of the reacted particles decreasedmonotonically to 4.7-5.0 g/cm3, consistent with the density ofNi2O3 (4.84 g/cm3).48,49 At higher temperatures the particledensity increases to 5.5-5.7 g/cm3 and at the highest temper-ature investigated is roughly at a density halfway between thatof NiO (6.67 g/cm3) and Ni2O3 (4.84 g/cm3). The oxidation toform Ni2O3 should be dominant in the low-temperature regionwhile the process of formation of the two types of oxides andthe phase transition are coupled at higher temperatures.
B. Size-Resolved Oxidation Kinetics of Nickel Nanopar-ticles. Metal oxidation theories and the transport properties ofthe oxides have been studied for several decades. It is believedthat the diffusion of ionic vacancies and electron holes is thedominant transport process for nickel oxidation.7 Thus, the well-known diffusion-controlled shrinking core model50,51 can beemployed to extract the reaction rate constant. The theoriesproposed by Wagner for thick film growth are based onconditions of charge neutrality, and diffusion of ions andelectrons being the rate-limiting step, leading to a parabolic ratelaw for a planar geometry.27 Carter later applied the sameassumptions to the shrinking core model for a sphericalgeometry and derived an oxidation rate law for metal particleoxidation.22 However, Wagner’s theory is restricted to thickfilms in which the characteristic length is given by theDebye-Huckel length, which is probably on the order ofhundreds of nanometers.7,8,11 Given the particle sizes we arestudying, many of the assumptions of the theory would likelybe invalid. For example, the charge-neutrality condition ofWagner’s theory would no longer hold due to the space chargeeffects. Cabrera and Mott’s, on the other hand, describe the thinfilm growth26 assuming thermal electron emission and tunnelingof electrons to be easier than ionic diffusion, so that an electricfield is developed across the thin film to assist the transport ofthe ions. The electric field caused by the surface-charge couldbe on the order of ∼107 V/cm such that a nonlinear behaviorhas to be considered. The rate law for thin films was derivedand a characteristic length Lcrit was suggested, below which thefield is so strong that the drift velocity of ions is not proportionalto the field but has an exponential dependence, and this nonlineareffect should be consider when L(t) < Lcrit. The upper limit forCabrera and Mott’s theory is ∼10 nm for nickel, and Lcrit is assmall as 2 nm. No analytical result has been developed for thespherical geometry.
Fromhold and co-workers have given a more general theo-retical model for metal oxidation.8,11,15,17,20 However, theequations can only be solved numerically. In our case, theparticle sizes fall in the range between those of Wagner’s theoryand Cabrera and Mott’s theory. Nickel nanoparticle oxidationis most likely in a low-field region where surface-charge andspace-charge should be considered. Fromhold and Cook haveevaluated the space-charge and surface-charge modification onthe oxidation kinetics with a coupled current approach basedon the idea that the diffusion currents are in the steady state inthe presence of surface/space charge and the growth kineticswas obtained by summing the ionic and electronic diffusioncurrents of all the species.15 The results can only be solvednumerically and no results are available for spherical particleoxidation.
Figure 10. Average density measured with use of the DMA-APMcombined experiment.
Figure 11. Arrehenius plots of average mass changing rate as afunction of inverse temperature. The calculations for activation energyare only for the low-temperature region.
More recently Fromhold has developed a model focused onthe oxidation rate of spherical metal particles in the low spacecharge limit using the coupled current approach for oxidethicknesses below 100 nm.6 Only surface charge and lineardiffusion were considered in their study, and a rate law similarto that from Carter’s work was obtained. This suggested to usthat the diffusion-controlled shrinking core model could beapplied to our study as a relatively straightforward way toprocess our experimental results.
Following Carter’s analysis at steady state, the diffusion fluxthrough the oxide shell can be related to the reaction rate ofreactant by
dNO2
dt)-4πDeCO2
r1r2
r2 - r1(1)
In eq 1, r1 and r2 are the radius of the nickel core and the reactedparticle. CO2 is the oxygen molar concentration in gas and NO2
is the number of moles of oxygen in the oxide layer. De is thediffusion coefficient for ion diffusion in the oxide layer:
De)Am exp(- Ea
RT) (2)
Here Am is the pre-exponential factor, Ea is reaction activationenergy, and R is the gas constant. Equation 1 immediately leadsto the mass change rate for the reacted nickel nanoparticle, as
dMdt
) 4πMO2DeCO2
r1r2
r2 - r1(3)
where MO2 is the molecular weight of oxygen. Knowing thefurnace temperature profiles from Figure 3, the particle masschange, ∆M can be obtained by integrating eq 3 as the particletravels down the oxidation furnace. However, as we discussedabove, the nickel nanoparticle oxidation should be a composite
between formation of NiO and Ni2O3, and the phase transition.Therefore the relative concentration of NiO and Ni2O3 withinthe oxide layer is temperature dependent. As a result, theinstantaneous mass changing rate dM/dt cannot be determinedwith our current experimental approach.
Considering the exponential temperature dependence of therate constant and the fact that most of the reaction would occurat the center of the furnace at the peak temperature, weapproximate the instantaneous mass changing rate dM/dt in eq3 with the average mass changing rate to get
ln∆M
τ)-Ea/RT+ ln(4πMO2
CO2Am
r1r2
r2 - r1) (4)
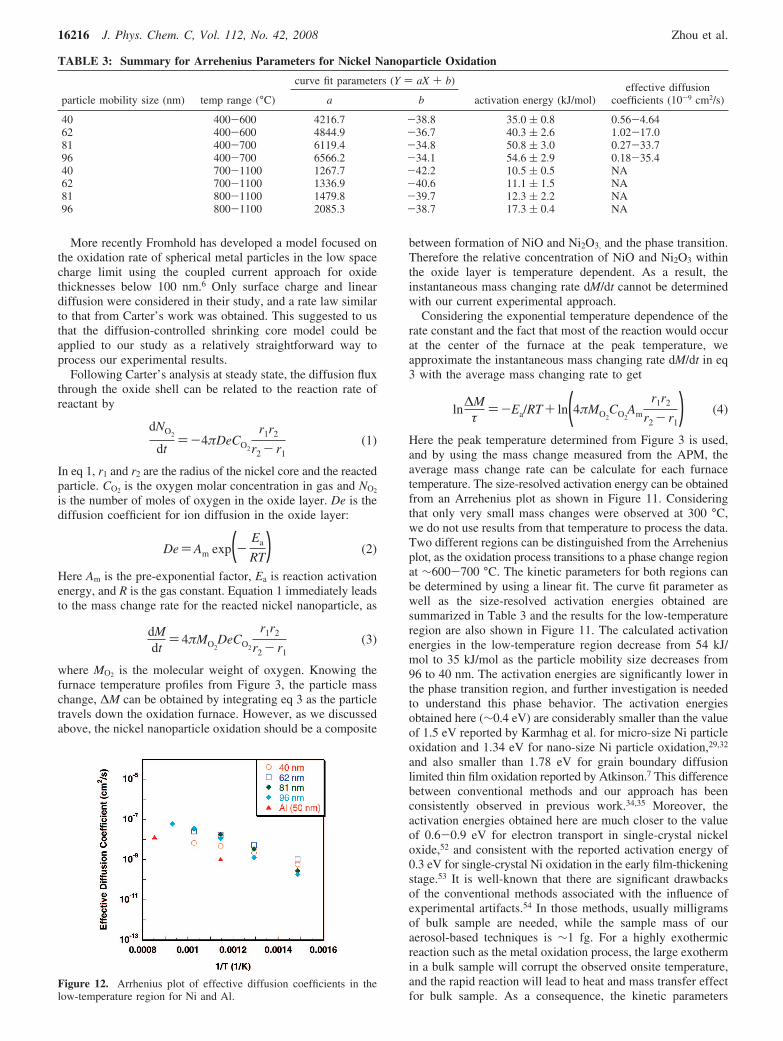
Here the peak temperature determined from Figure 3 is used,and by using the mass change measured from the APM, theaverage mass change rate can be calculate for each furnacetemperature. The size-resolved activation energy can be obtainedfrom an Arrehenius plot as shown in Figure 11. Consideringthat only very small mass changes were observed at 300 °C,we do not use results from that temperature to process the data.Two different regions can be distinguished from the Arreheniusplot, as the oxidation process transitions to a phase change regionat ∼600-700 °C. The kinetic parameters for both regions canbe determined by using a linear fit. The curve fit parameter aswell as the size-resolved activation energies obtained aresummarized in Table 3 and the results for the low-temperatureregion are also shown in Figure 11. The calculated activationenergies in the low-temperature region decrease from 54 kJ/mol to 35 kJ/mol as the particle mobility size decreases from96 to 40 nm. The activation energies are significantly lower inthe phase transition region, and further investigation is neededto understand this phase behavior. The activation energiesobtained here (∼0.4 eV) are considerably smaller than the valueof 1.5 eV reported by Karmhag et al. for micro-size Ni particleoxidation and 1.34 eV for nano-size Ni particle oxidation,29,32
and also smaller than 1.78 eV for grain boundary diffusionlimited thin film oxidation reported by Atkinson.7 This differencebetween conventional methods and our approach has beenconsistently observed in previous work.34,35 Moreover, theactivation energies obtained here are much closer to the valueof 0.6-0.9 eV for electron transport in single-crystal nickeloxide,52 and consistent with the reported activation energy of0.3 eV for single-crystal Ni oxidation in the early film-thickeningstage.53 It is well-known that there are significant drawbacksof the conventional methods associated with the influence ofexperimental artifacts.54 In those methods, usually milligramsof bulk sample are needed, while the sample mass of ouraerosol-based techniques is ∼1 fg. For a highly exothermicreaction such as the metal oxidation process, the large exothermin a bulk sample will corrupt the observed onsite temperature,and the rapid reaction will lead to heat and mass transfer effectfor bulk sample. As a consequence, the kinetic parameters
TABLE 3: Summary for Arrehenius Parameters for Nickel Nanoparticle Oxidation
curve fit parameters (Y ) aX + b)
particle mobility size (nm) temp range (°C) a b activation energy (kJ/mol)effective diffusion
Figure 12. Arrhenius plot of effective diffusion coefficients in thelow-temperature region for Ni and Al.
16216 J. Phys. Chem. C, Vol. 112, No. 42, 2008 Zhou et al.
extracted from the conventional methods are obscured. TheTDMA and DMA-APM techniques employed here allow adirect measure of mass and volume change of individualparticles, which enables us to explore the intrinsic reactivity ofnanoparticles with minimizing the sampling error introducedby mass and heat transfer.
The effective diffusion coefficient is determined by calculatingthe unreacted nickel core radius r1. Although the oxide layercontains both NiO and Ni2O3 and their relative concentrationscannot be determined, the oxygen concentration is roughlyuniform for NiO and Ni2O3. Calculation shows that the relativeoxygen density in NiO is 1.42 g/cm3 and that in Ni2O3 is 1.40g/cm3. The uniform oxygen density enables us to estimate thenickel core radius by using the mass change of the particlemeasured by the APM. Therefore the effective diffusioncoefficient can be calculated from eq 3. Since the shrinking-core model used here can only count for the oxidation process,the phase transition in the high-temperature region will corruptthe calculation of the effective diffusion coefficient. As aconsequence, the calculation is only valid in the low-temperatureregion, and the results are shown in Figure 12. Due to the well-known kinetic compensation effect, although the activationenergy is considerably smaller than the value measured by theconventional offline methods, the measured diffusion coefficientsare within the range of reported values.7 Since aluminum hasbeen well studied and has been used extensively as a primarythermite-based material, the effective diffusion coefficients foraluminum oxidation obtained from our previous work34 are alsoplotted in the figure for comparison. Surprisingly, the nickel isactually more active than aluminum although it should bepointed out that the aluminum measurements were made witha totally different experimental approach. However, despite theapparent faster kinetics of Ni, the higher enthalpy of aluminum
oxide (-1675.7 kJ/mol vs -489.5 kJ/mol for Ni2O3 or -239.7kJ/mol for NiO)48,55 implies aluminum is still a more promisingenergetic material that nickel. Nevertheless, Ni might findapplications as an ignition source, for example, or in tuningthe reaction profile in mixed metal nanocomposites.
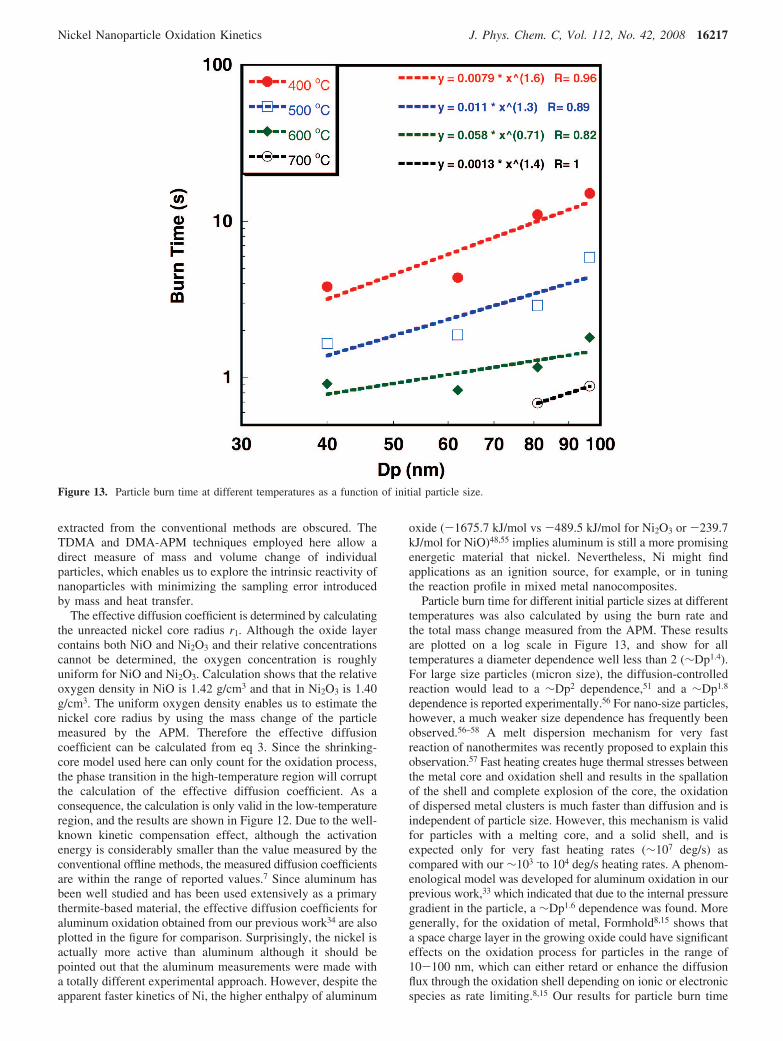
Particle burn time for different initial particle sizes at differenttemperatures was also calculated by using the burn rate andthe total mass change measured from the APM. These resultsare plotted on a log scale in Figure 13, and show for alltemperatures a diameter dependence well less than 2 (∼Dp1.4).For large size particles (micron size), the diffusion-controlledreaction would lead to a ∼Dp2 dependence,51 and a ∼Dp1.8
dependence is reported experimentally.56 For nano-size particles,however, a much weaker size dependence has frequently beenobserved.56–58 A melt dispersion mechanism for very fastreaction of nanothermites was recently proposed to explain thisobservation.57 Fast heating creates huge thermal stresses betweenthe metal core and oxidation shell and results in the spallationof the shell and complete explosion of the core, the oxidationof dispersed metal clusters is much faster than diffusion and isindependent of particle size. However, this mechanism is validfor particles with a melting core, and a solid shell, and isexpected only for very fast heating rates (∼107 deg/s) ascompared with our ∼103 -to 104 deg/s heating rates. A phenom-enological model was developed for aluminum oxidation in ourprevious work,33 which indicated that due to the internal pressuregradient in the particle, a ∼Dp1.6 dependence was found. Moregenerally, for the oxidation of metal, Formhold8,15 shows thata space charge layer in the growing oxide could have significanteffects on the oxidation process for particles in the range of10-100 nm, which can either retard or enhance the diffusionflux through the oxidation shell depending on ionic or electronicspecies as rate limiting.8,15 Our results for particle burn time
Figure 13. Particle burn time at different temperatures as a function of initial particle size.
suggested that a model that includes both the pressure gradientand space charge effect would be worthy of investigation.
Conclusions
We applied online aerosol ion-mobility based methods tostudy oxidation and reactivity of nickel nanoparticles. The nickelnanoparticles were generated in situ during the oxidationexperiments with use of gas-phase thermal pyrolysis of nickelcarbonyl. Particles of well-controlled sizes and structure weregenerated and subsequently size selected by using a DMA. Themass and size changes of reacted particles were measured withan APM and a second DMA. The experimental data can bedivided into an oxidation region and a phase transit region. Onthe basis of the diffusion-controlled rate equation in theshrinking core model, we found that the activation energy ofoxidation decreased from 54 kJ/mol to 35 kJ/mol as the particlesize decrease from 96 to 40 nm at low temperatures. Theabsolute burning time and the effective diffusion coefficient werealso determined.
Acknowledgment. This work was supported by the ArmyResearch Office.
References and Notes
(1) Prakash, A.; McCormick, A. V.; Zachariah, M. R. Nano Lett. 2005,5, 1357.
(2) Park, K.; Rai, A.; Zachariah, M. R. J. Nanopart Res. 2006, 8, 455.(3) Sullivan, K.; Young, G.; Zachariah, M. R. Combust. Flame.
Submitted for publication.(4) Mrowec, S.; Grzesik, Z. J. Phys. Chem. Solids 2004, 65, 1651.(5) Rellinghaus, B.; Stappert, S.; Wassermann, E. F.; Sauer, H.;
Spliethoff, B. Eur. Phys. J. D 2001, 16, 249.(6) Fromhold, J. A. T. J. Phys. Chem. Solids 1988, 49, 1159.(7) Atkinson, A. ReV. Mod. Phys. 1985, 57, 437.(8) Fromhold, A. T., Jr. Theory of Metal Oxidation; North-Holland
Publishing Company: Amsterdam, The Netherlands, 1980; Vol. 2.(9) Sales, B. C.; Maple, M. B.; Vernon, F. L. Phys. ReV. B 1978, 18,
486.(10) Sales, B. C.; Maple, M. B. Phys. ReV. Lett. 1977, 39, 1636.(11) Fromhold, A. T., Jr. Theory of Metal Oxidation; North-Holland
Publishing Company: Amsterdam, The Netherlands, 1976; Vol. 1.(12) Knutson, E. O.; Whitby, K. T. J. Aerosol Sc. 1975, 6, 443.(13) Graham, M. J.; Cohen, M. J. Electrochem. Soc. 1972, 119, 879.(14) Caplan, D.; Graham, M. J.; Cohen, M. J. Electrochem. Soc. 1972,
119, 1205.(15) Fromhold, A. T.; Cook, E. L. Phys. ReV. 1968, 175, 877.(16) Pizzini, S.; Morlotti, R. J. Electrochem. Soc. 1967, 114, 1179.(17) Fromhold, A. T.; Cook, E. L. Phys. ReV. 1967, 163, 650.(18) Fromhold, A. T., Jr.; Earl, L. C. J. Appl. Phys. 1967, 38, 1546.(19) Kazuo, F.; Bruce Wagner, J., Jr. J. Electrochem. Soc. 1965, 112,
384.(20) Fromhold, A. T., Jr J. Chem. Phys. 1964, 41, 509.(21) Phillips, W. L., Jr J. Electrochem. Soc. 1963, 110, 1014.(22) Carter, R. E. J. Chem. Phys. 1961, 34, 2010.(23) Gulbransen, E. A.; Andrew, K. F. J. Electrochem. Soc. 1957, 104,
451.
(24) Gulbransen, E. A.; Andrew, K. F. J. Electrochem. Soc. 1954, 101,128.
(25) Dravnieks, A. J. Am. Chem. Soc. 1950, 72, 3761.(26) Cabrera, N.; Mott, N. F. Rep. Prog. Phys. 1948, 12, 163.(27) Wagner, C. Z. Phys. Chem. Abt. B 1933, 21.(28) Niklasson, G. A.; Karmhag, R. Surf. Sci. 2003, 532, 324.(29) Karmhag, R.; Niklasson, G. A.; Nygren, M. J. Appl. Phys. 2001,
E. P.; Prasad, P. N. J. Appl. Phys. 2005, 98, 054308/1.(42) He, Y. Q.; Li, X. G.; Swihart, M. T. Chem. Mater. 2005, 17, 1017.(43) Kim, S. H.; Zachariah, M. R. J. Phys. Chem. B 2006, 110, 4555.(44) Higgins, K. J.; Jung, H. J.; Kittelson, D. B.; Roberts, J. T.;
Zachariah, M. R. EnViron. Sci. Technol. 2003, 37, 1949.(45) Hinds, W. C. Aerosol Technology: Properties, BehaVior, and
Measurement of airborne particles, 2nd ed.; John Wiley & Sons, Inc.: NewYork, 1999.
(46) Jung, H.; Kittelson, D. B.; Zachariah, M. R. Combust. Flame 2005,142, 276.
(47) Tsyganov, S.; Kastner, J.; Rellinghaus, B.; Kauffeldt, T.; Westerhoff,F.; Wolf, D. Phys. ReV. B 2007, 75.
(49) Antonsen, D. H.; Meshri, D. T. Kirk-Othmer Encycl. Chem.Technol. (5th ed.) 2006, 17, 106.
(50) Smith, J. M. Chemical Engineering Kinetics, 3rd ed.; McGraw-Hill Inc.: New York, 1981.
(51) Levenspiel, O. Chemical Reaction Engineering, 3rd ed.; John Wiley& Sons: New York, 1999.
(52) Aiken, J. G.; Jordan, A. G. J. Phys. Chem. Solids 1968, 29, 2153.(53) Mitchell, D. F.; Graham, M. J. Surf. Sci. 1982, 114, 546.(54) Ortega, A. International Journal of Chemical Kinetics 2001, 33,
343.(55) CRC Handbook of Chemistry and Physics; Hampden Data Services
Ltd., 2002.(56) Huang, Y.; Risha, G. A.; Yang, V.; Yetter, R. A. Proceedings of
the Combustion Institute 2007, 31, 2001.(57) Valery, I. L.; Blaine, W. A.; Steven, F. S.; Michelle, P. Appl. Phys.
Lett. 2006, 89, 071909.(58) Young, G.; Sullivan, K.; Zachariah, M. R.“Investigation of Boron


![Additional resources and features associated with this article are … · 2018-01-18 · “[is the] development of innovative apparatuses and techniques that offer drastic improvements](https://static.documents.pub/doc/80x56/5f09ed647e708231d4292c70/additional-resources-and-features-associated-with-this-article-are-2018-01-18.jpg)


![Campus Solutions 9.0 Additional Features October 2012 · PDF fileHeader_2] Oracle Statement of Direction— ... CASH_OFF_RECEIPT table RECEIPT_NBR Receipt ... Additional Features October](https://static.documents.pub/doc/80x56/5a92d1a37f8b9a30358ba18f/campus-solutions-90-additional-features-october-2012-oracle-statement-of-direction.jpg)