22
Additive Printing of Flexible Electronics for Sensing Tse Nga (Tina) Ng Electrical and Computer Engineering Dept., UC San Diego [email protected] 1 um 1 mm

Additive Printing of Flexible Electronics for Sensing
Tse Nga (Tina) Ng Electrical and Computer Engineering Dept., UC San Diego
1 um
1 mm
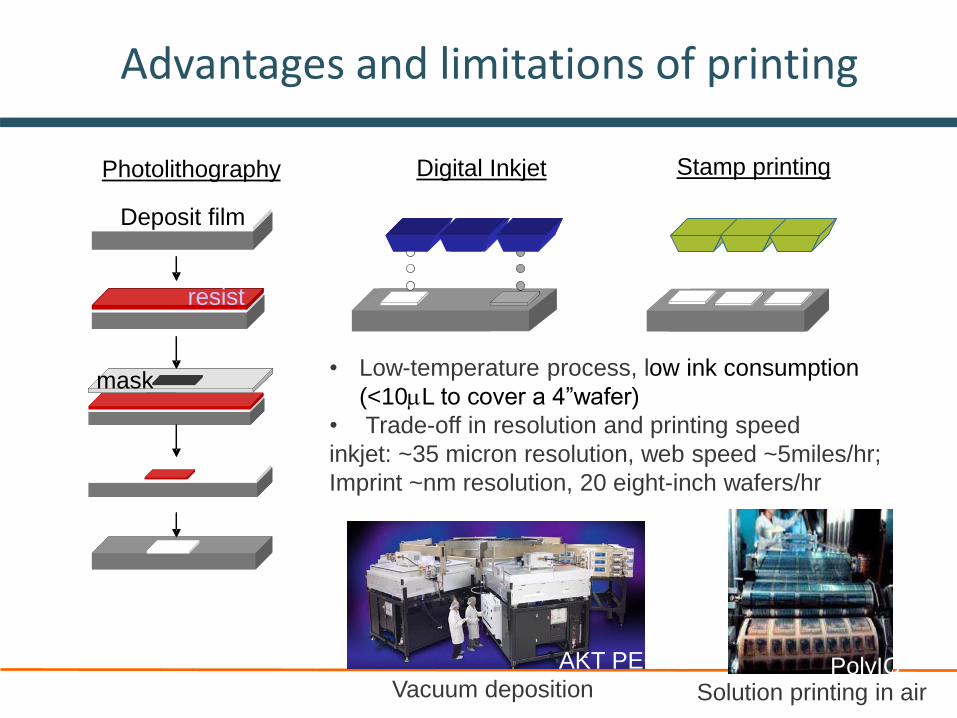
Advantages and limitations of printing
resist
Deposit film
Photolithography
resist
Deposit film
mask
Stamp printingDigital Inkjet
• Low-temperature process, low ink consumption
(<10L to cover a 4”wafer)
• Trade-off in resolution and printing speed
inkjet: ~35 micron resolution, web speed ~5miles/hr;
Imprint ~nm resolution, 20 eight-inch wafers/hr
AKT PECVD PolyICVacuum deposition Solution printing in air

3
Applications for printed sensors
• Scalable to large-area, flexible, tunable materials
Human-computer interface (touch, imager, etc.)
• Multi-component arrays that increase selectivity
Low-cost, high-volume for distributed sensing
GE-Avery Dennison
PARC ARPA-E MONITOR
APL 92 (2008) 213303
Someya, U Tokyo

4
1.E+08
1.E+10
1.E+12
600 1000 1400
D*
[Jo
nes
]
wavelength [nm]
Solution processed sensors comparable to conventional Ge
Tunable organic materials with infrared detectivity
comparable to commercial Newport Ge diode
ACS Appl. Mater. Interface 9 (2017) 1654.
Polymer Science, DOI: 10.1039/c7py00241f
Ge photodiode

5
Printed TFTs for local sensor control
M x N lines, interconnect takes
more space than sensors
TFT
With TFTs, M + N lines only
Simple signal conditioning/processing
Alex Blau
Gain/ threshold
detect
sensors
TFT integrated
circuits provides
signal conditioning
before Si chip

6
Key challenge for integrated TFT circuits
Challenge for implementation: Designs that tolerate variations in OTFTs
Monte Carlo Simulation for 100 samples
-for a gain + latch circuit with 7 TFTs
TFT variation
(1s std dev)
Yield
25% 50%
10% 80%
5% 98%
0
5
10
15
20
0 10 20
outp
ut
[V]
input [v]
Sci. Rep (2015) 5, 13457.
Proc. IEEE (2015) 103, 607
• Variation leads to circuit error
• Controlling variation is key to
practical yield

7
Courtesy of Murmann group at Stanford
Similar level of variations: main source of variation is semiconductor,
less impact from channel W/L
0
2
4
6
8
10
12
-10
0
-50 0
50
10
0
Co
un
t
Bin [% deviation from mean current]
p
n
All-printed OTFTs Photolithographically patterned OTFTs
Printed vs photolithographic OTFTs
Sci. Rep (2012) 2, 585.

8
L
WVVVV
pn
pnn
T
p
TDD
inv
,
1
Modify channel surface to adjust VT
• Important to control threshold voltage VT
• Back-channel interface affects VT: electronic dipole, film morphology, etc.
J. Appl. Phys. 113 (2013) 094506
1.0E-12
1.0E-10
1.0E-08
1.0E-06
-15 0 15 30
dra
in c
urr
ent
[A]
gate bias [V]
VT
Gate
Gate insulator
DrainSource
Gate
Gate insulator
DrainSource
(a) after illumination without gate bias
(b) after illumination with negative gate bias
fixed positive
charges in the bulk
sheet charge fixed
at front channel
charges fixedin the bulk
charges fixed in the bulkand at the back channel
Bare substrate
Gate
Gate insulator
DrainSource
Gate
Gate insulator
DrainSource
(a) after illumination without gate bias
(b) after illumination with negative gate bias
fixed positive
charges in the bulk
sheet charge fixed
at front channel
charges fixedin the bulk
charges fixed in the bulkand at the back channel

9
Small molecules:
Suppressing thermal disorder
by side chain location
J. Anthony, Sirringhaus, et al.
Nature Communications 7,
10736 (2016)
Material structures that reduce disorder
McCoullouch, et al.
Nature 515, (2014) 384–388
Polymers:
Reduce tail states by rigid
backbone that reduces torsion

10
Reduced variations in printed OTFTs
1s =8-10%
Mobility =0.6cm2/Vs
1s =12%
Mobility =0.7cm2/Vs
1s =40%
Mobility =0.12cm2/Vs
Uniformity can be improved in both polymer and small molecules
P-type gen 1 P-type gen 2 N-type gen 2

11
From materials to circuit fabrication
1 mm
“S”
“F”
Design, simulate circuitsDevelop ink & devices Build device models
Print and test
IEEE Elec. Dev. Lett. (2013) 34, 271.

12
Other examples of printed circuits
1 mm
Shift register
IEEE Elec. Dev. Lett.,
34 (2013) 271.
Voltage multiplier
Flexible Printed Electronics
(2016) 1, 015002.
1st
stage
5th
Temperature dose tag
Sci Rep (2015), 5, 13457.

13
Desirable to digitize signal near sensor
Amplitude signal prone to attenuation error; frequency signal more reliable
Same freq as before,
will get same readout
Attenuation affects
amplitude measurement
Need to add digitizing circuit near sensor

14
Voltage-controlled oscillator
-6
-3
0
3
6
9
0 50 100
Am
plit
ud
e [
V]
Time [ms]
10Vdd
-6
-3
0
3
6
9
0 50 100
Am
plit
ud
e [
V]
Time [ms]
8Vdd
0
5
10
15
20
25
0 10 20 30
osc
illat
ion
cyc
le t
ime
[m
s]
supply voltage Vdd [V]
15
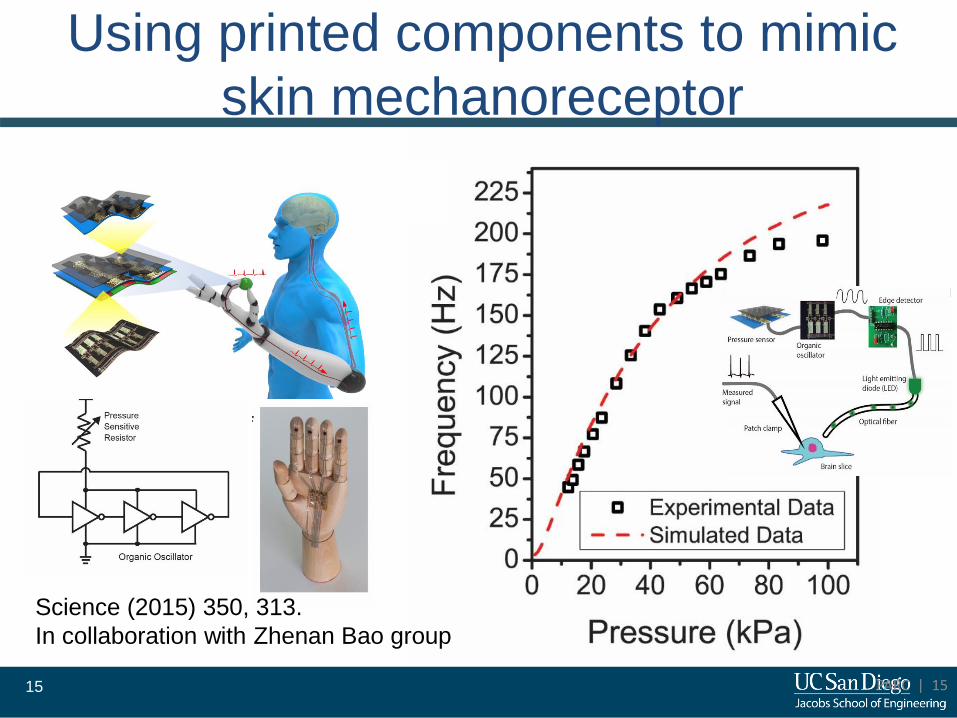
Using printed components to mimic
skin mechanoreceptor
PARC | 15
Science (2015) 350, 313.
In collaboration with Zhenan Bao group

16
Need to augment spasticity diagnosis
Spatiscity -involuntary activation of muscle, very common in patient with neurological disorders such as stroke, traumatic brain injury, cerebral palsy, etc. affect 764K in US; 17M world wide
UI Chicago
Score Modified Ashworth Scale (MAS)
0 No increase in muscle tone
1 Slight increase in muscle tone, with a catch and
release at the end of the range of motion (ROM)
1+ Slight increase in muscle tone, followed by minimal
resistance throughout the remainder of ROM
2 More marked increase in muscle tone through
most of the ROM, but affected parts easily moved
3 Considerable increase in muscle tone, passive
movement difficult
4 Affected part is rigid in both flexion and extension

17
Issue with reliability in MAS ratings
• 5 patients and 12 tasks: each doctor gave 60 MAS ratings
• Only 27% of the ratings were the same; poor inter-rating reliability, yet dosage is based on this rating
Two doctors’ MAS ratings on the same patients
In collaboration with Dr. Garudadri (Calit2) and Dr. Skalsky at UCSD School of Medicine

18
Prototype glove to quantify spasticity
Glove worn by the doctor during assessment:-measure force (printed pressure sensor by Tekscan) and angular velocity (gyroscope)-Power to move a limb P=F*v

19
Mock patient to calibrate sensor glove
-calibrate sensor glove with a mock patient with changeable resistance (2-20kg)• load cell to measure force • potentiometer to measure angular velocity• the power P=F*v to move the mock limb is recorded
Forc
e [g
]A
ngu
lar
velo
city
[d
eg/s
]
Time (Sampling at 80 Hz)

20
Better resolution than MAS scale
• Quantitative glove measurement allows comparison between rating trials, less dependence on rater perception
• Glove sensor improves the resolution of the spasticity assessment
Pow
er m
easu
red
by
glo
ve [
Nm
/s]
Power setting on mock patient [Nm/s]Po
wer
mea
sure
d b
y gl
ove
[N
m/s
]Power setting on mock patient [Nm/s]
In press, IEEE-NIH 2016 HI-POCT Proceeding

21
Summary
• Apply additive printing to demonstrate organic TFT circuits
1. increase tolerance to device variation issues
2. integrated local digitizing circuits near sensors
• Example application of printed pressure sensor to achieve quantitative
assessment in spasticity diagnosis
1 mm
3.86 x 1.66 mm

22
Acknowledgment
Collaborators:
PARC colleagues
Antonio Facchetti, Northwestern
Zhenan Bao, Stanford
Iain McCollouch, Imperial/KAUST
Funding: UCSD colleagues:
Leanne Chukoskie
Harinath Garudadri
Andrew Skalsky
Michael Yip
Students:
Fei Deng, Padmaja Jonnalagedda,
Zhenghui Wu, Weichuan Yao,
Hyunwoong Kim, Kaiping Wang,
Udit Parekh, Moran Amit


