Addressing an Achilles Heel of PCTs: Missing Race and Ethnicity Data in Electronic Health Records Monique L. Anderson, MD Assistant Professor of Medicine Duke Clinical Research Institute Duke University School of Medicine August 28, 2015
Transcript
Addressing an Achilles Heel of PCTs: Missing Race and Ethnicity Data in
Electronic Health Records
Monique L. Anderson, MD
Assistant Professor of Medicine
Duke Clinical Research Institute
Duke University School of Medicine
August 28, 2015
NIH Common Fund Diversity Supplement: Can we examine impact of treatments tested in PCTs by race and ethnicity?
Talk Objectives
1) Discuss the importance of collecting race and ethnicity in PCTs
2) Highlight current challenges with using race and ethnicity data from electronic health records for PCTs
3) Demonstrate imputation methods that could optimize the Collaboratory’s ability to study treatment effect by race and ethnicity
Heterogeneity of Treatment Effect
• RCTs report single measure of treatment impact, average treatment effect
• Same treatment can have variable responses in different populations
• HTE defined as non-random variability in the direction of magnitude of a treatment effect
• HTE or subgroup analyses answer the question, “How likely does a treatment work for a similar group of individuals?”
Racial HTE in RCTs• Blacks are more likely to benefit from non-specific vasodilators
compared with whites for systolic heart failure (V-HeFT, SOLVD trials).1,2
• Compared with whites, Asians have higher response rate, survival, and greater toxicity from chemotherapy for both non-SCLC and SCLC. 3
• Blacks fare worse with a genetically-guided warfarin algorithm compared to a clinically-guided algorithm in the recent Optimal Anticoagulation through Genetics (COAG) trial.4
• Compared with whites, blacks have poorer response rates to treatments for Hepatitis C.
• Pegylated IFN with Ribavirin5
• HIV/Hep C Co-infection- Ledipasvir and sofosbuvir 6
• Hispanics have lower response rates and survival for colon cancer compared with whites.7
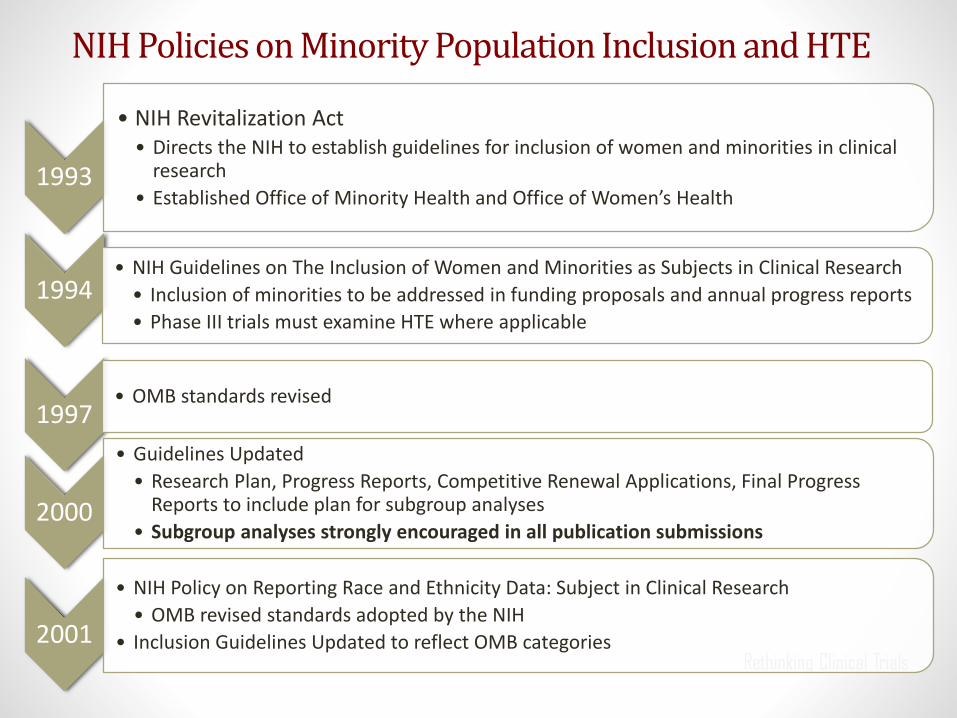
• NIH Revitalization Act • Directs the NIH to establish guidelines for inclusion of women and minorities in clinical
research
• Established Office of Minority Health and Office of Women’s Health
1994• NIH Guidelines on The Inclusion of Women and Minorities as Subjects in Clinical Research
• Inclusion of minorities to be addressed in funding proposals and annual progress reports
• Phase III trials must examine HTE where applicable
1997• OMB standards revised
2000
• Guidelines Updated
• Research Plan, Progress Reports, Competitive Renewal Applications, Final Progress Reports to include plan for subgroup analyses
• Subgroup analyses strongly encouraged in all publication submissions
2001
• NIH Policy on Reporting Race and Ethnicity Data: Subject in Clinical Research
• OMB revised standards adopted by the NIH
• Inclusion Guidelines Updated to reflect OMB categories
NIH Policies on Minority Population Inclusion and HTE
FDA Policies and Guidance for Race and Ethnicity Reporting and HTE Analyses
1988
• Guidelines for the Format and Content of Clinical and Statistical Sections of NDAs
• Emphasized the importance of subgroup analyses; specified race and ethnicity subgroups should be analyzed
1998
• Demographic Rule – Half of NDAs have sufficient analyses
• Sponsors of IND applications to submit annual demographics of enrolled population
• NDA required to submit effectiveness and safety data for demographic subgroups
• Regulation does not apply to devices
2005
• FDA Guidance on Reporting Race and Ethnicity Reporting in Clinical Research
• OMB Categories Recommended
2007
• FDAAA 801 - Reporting of Basic Results Mandatory for Applicable Clinical Trial
• Race and ethnicity reporting is optional; age and sex mandatory
2012
• Section 907 FDASIA
• Action Plan released Aug 2014 to improve demographic inclusion, data collection, and analyses
FDASIA Report of Status Collection and Analysis of Race and Ethnicity Data
• Drugs and biologic NDAs all include tabulations and address subset analyses by sex, race, and age
• Whites dominate participation
• Subgroup analyses w/o sufficient numbers or power to detect differences in most cases
• Devices
• 70% applications list race/ethnicity
• 20% report race/ethnicity subgroup analyses
• FDA makes data available on 17% of HTE analyses
FDA Report: Collection, Analysis, and Availability of DemographicSubgroup Data 88or FDA-approved medical products. Aug 2013
CDER: Trial Composition by Race
9
CDER: Trial Composition by Race
10
0
10
20
30
40
50
60
70
80
90
100
Ticagrelor(ACS)
Rivaroxaban(DVT)
Azilsartan(HTN)
Linaglpi n(DM)
Indacaterol(COPD)
Abiraterone(PC)
Telaprevir(HepC)
CDERApprovedNewMolecularEn tyBiologics2011
White Black Asian Other
Missing Data in Mini-Sentinel
Pragmatic Clinical Trials - Attractive Option for HTE by Race and Ethnicity?
• Focus on external validity and how interventions work in the real world.
• Draw from health systems serving heterogeneous populations; studies will (with little effort) include more women, elderly, minorities, and low SES populations compared with traditional randomized RCTs.
• Test comparative effectiveness and standard of care practices to determine which are optimal.
Race and Ethnicity in Electronic Health Records
• Low-quality data due to administrator or clinical assignment of race and ethnicity
• Large amounts of missing race and ethnicity data
• Institutional variability in data collection practices
Agreement of Self-Reported versus EHR Race/Ethnicity Data among Veterans Affairs Patients
Boehmer, U. Am J Public Health. 2003
0
10
20
30
40
50
60
70
80
90
100
Na veAmerican
Asian AfricanAmerican
Hispanic PacificIslander
White
Other
AfricanAmerican
White
Self-Reported Race
EHR Race
22.8% 83.4% 92.0 % 83.4% 69.6% 97.9 %
Self-Report versus EHR Race and Ethnicity in a FQHC in Cabarrus County: Convenience Sample
• Convenience Sample of 265 patients.
• EHR race was available for 96.4% of sample.
• 32.8% (87/265) of patients did not have agreement between self-report and EHR race.
• Most (n=62) were discrepancies in racial identity among patients of Hispanic ethnicity. EHR race was either unreported or white.
• Of blacks, only 4 were coded as another race.
From Drs. Meredith Nahm and Kristin Newby
Race and Ethnicity Distribution of Health Plan Membership in Kaiser Permanente Southern California
Race Percent
HistoricalmembersuptoMay31,2011(n=12,764,185)
White 15.1
Hispanic 15.1
Black 4.2
AsianandPacificIslander 2.9
AmericanIndianandAlaskaNative 0.1
Multiracial 0.1
Other 0.9
Unknown(missing) 61.6
ActivemembersonJanuary1,2009(n=3,323,588)
White 25.6
Hispanic 30.1
Black 7.6
AsianandPacificIslander 6.2
AmericanIndianandAlaskaNative 0.1
Multiracial 0.2
Other 1.9
Unknown(missing) 28.3
Derose SF et al. Medical Care Research and Review. 2012:70(3)330-345
Variability in Data Collection of Demonstration Projects
• Indirect Estimation for Race and Ethnicity has been encouraged by the Agency for Healthcare Research and Quality and the Institute of Medicine1
• Organizations currently using these data:
• Kaiser-Permanente Geographically Enriched Member Socio-demographics datamart (GEMS)2
• Medicare3
• Health plans (Aetna)
• Several methods developed to estimate missing race data in EHR and administrative records3
• Surname
• Geocoding only
• Bayesian Surname Geocoding
• Bayesian Improved Surname Geocoding
1. IOM Race, Ethnicity, and Language Data: Standardization for Heath Care Quality Improvement. 20092. http://share.kaiserpermanente.org/static/cb_annual report/reports/docs/2011_chapters/cb11_healthy_people.pdf 3. Bonito AJ, et al. Creation of New Race-Ethnicity Codes and SES Indicators for MedicareBeneficiaries. AHRQ Publication No. 08-0029_EF. January 2008
Preliminary Data: Sensitivity/Specificity of BISG for Men and Women
Men Women
Sensitivity
Black 61.0 60.0
White 91.0 91.0
Hispanic 91.0 83.0
Asian 84.0 75.0
AIAN 57.0 55.0
MultipleRaces 0.0 0.0
Specificity
Black 93.0 93.0
White 66.0 64.0
Hispanic 99.0 99.0
Asian 99.0 99.0
AIAN 100.0 100.0
MultipleRaces 100.0 100.0
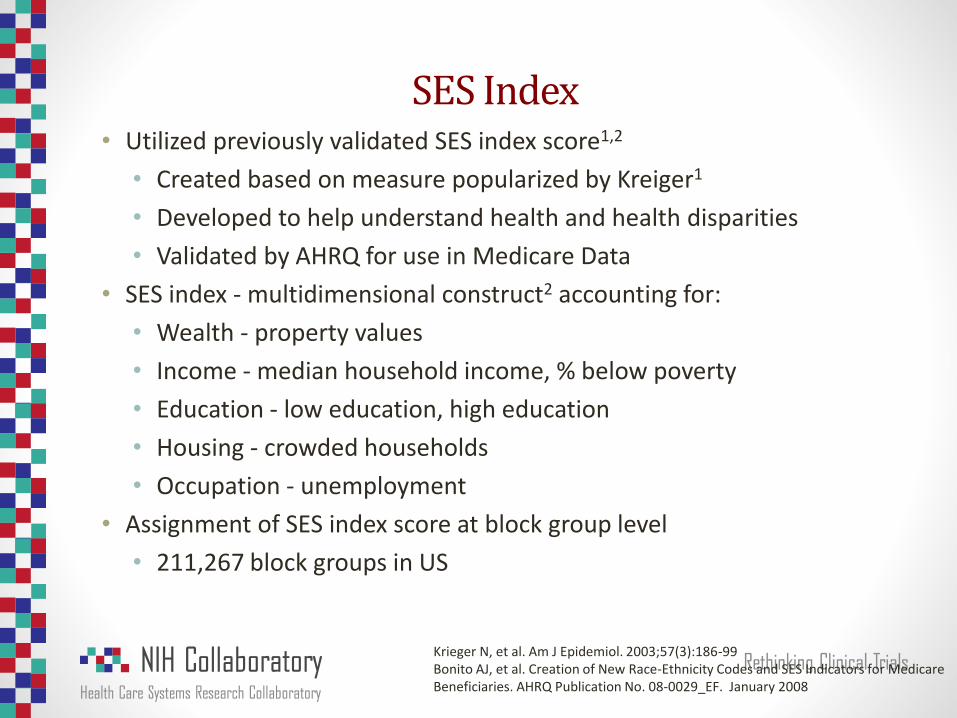
SES Index• Utilized previously validated SES index score1,2
• Created based on measure popularized by Kreiger1
• Developed to help understand health and health disparities
• Validated by AHRQ for use in Medicare Data
• SES index - multidimensional construct2 accounting for:
• Wealth - property values
• Income - median household income, % below poverty
• Education - low education, high education
• Housing - crowded households
• Occupation - unemployment
• Assignment of SES index score at block group level
• 211,267 block groups in US
Krieger N, et al. Am J Epidemiol. 2003;57(3):186-99Bonito AJ, et al. Creation of New Race-Ethnicity Codes and SES Indicators for MedicareBeneficiaries. AHRQ Publication No. 08-0029_EF. January 2008
Integration of SES index score in DEDUCE Research Portal
• SES index1
• Scores then assigned to all patients whose addresses were able to be geocoded
• Range 35-78
• SES index quartiles created for use in research
• SES Q1- 35-48
• SES Q2- 49-51
• SES Q3- 52-55
• SES Q4- 56-78
Bonito AJ, et al. Creation of New Race-Ethnicity Codes and SES Indicators for MedicareBeneficiaries. AHRQ Publication No. 08-0029_EF. January 2008
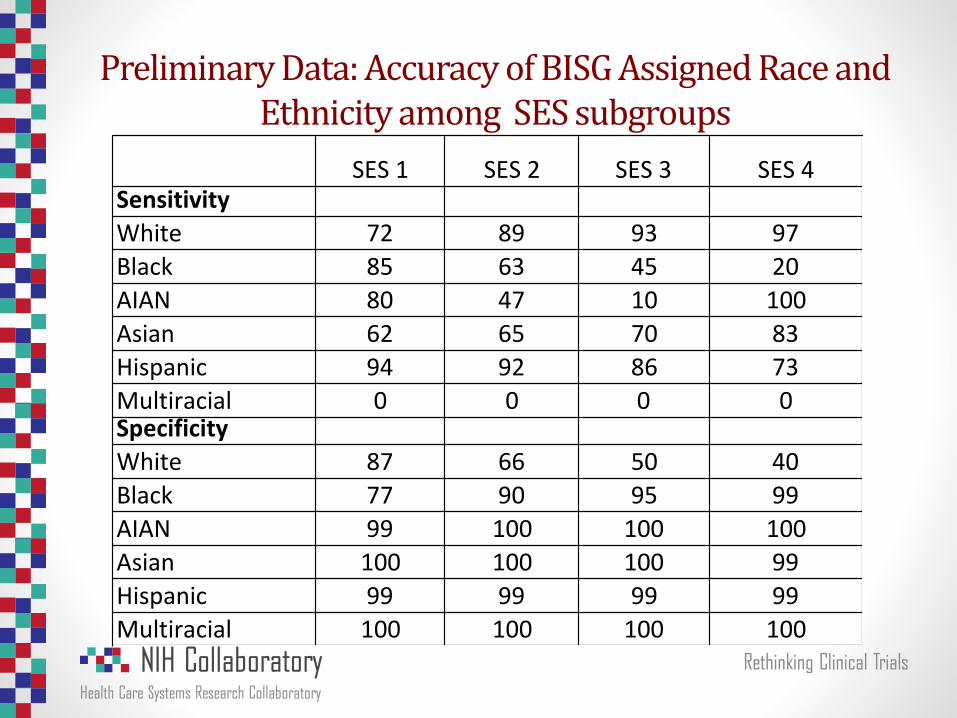
Preliminary Data: Accuracy of BISG Assigned Race and Ethnicity among SES subgroups
SES1 SES2 SES3 SES4Sensitivity
White 72 89 93 97
Black 85 63 45 20
AIAN 80 47 10 100
Asian 62 65 70 83
Hispanic 94 92 86 73
Multiracial 0 0 0 0Specificity
White 87 66 50 40
Black 77 90 95 99
AIAN 99 100 100 100
Asian 100 100 100 99
Hispanic 99 99 99 99
Multiracial 100 100 100 100
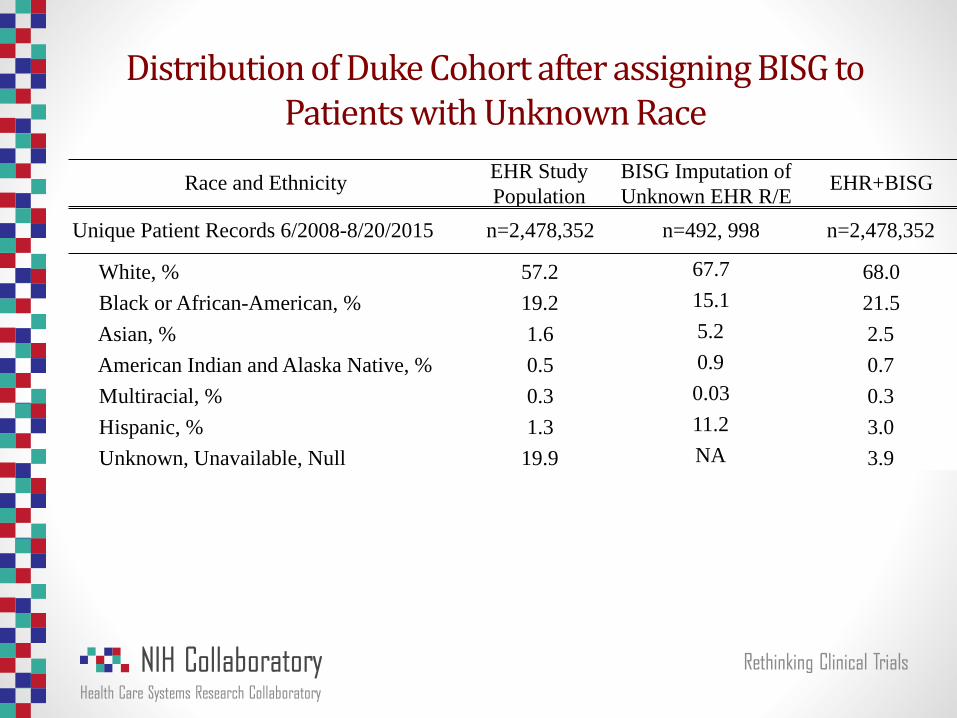
Race and EthnicityEHR Study
Population
BISG Imputation of
Unknown EHR R/EEHR+BISG
Unique Patient Records 6/2008-8/20/2015 n=2,478,352 n=492, 998 n=2,478,352
White, % 57.2 67.7 68.0
Black or African-American, % 19.2 15.1 21.5
Asian, % 1.6 5.2 2.5
American Indian and Alaska Native, % 0.5 0.9 0.7
Multiracial, % 0.3 0.03 0.3
Hispanic, % 1.3 11.2 3.0
Unknown, Unavailable, Null 19.9 NA 3.9
Distribution of Duke Cohort after assigning BISG to Patients with Unknown Race
Limitations
• BISG imputation helps, but is not perfect
• No data on surnames occurring less than 100 times.
• Hispanic is listed as a race; Asian and Pacific Islanders combined.
• If block group or surname missing, can’t use BISG but other methods available.
• Slightly lower accuracy with women for some race groups.
• We compared BISG to EHR assigned race; EHR assigned race may not represent self-report in an unknown number of cases.
• Surname list was created in 2005 based on 2000 census data; unclear if a new surname list will be released in 2015.
Next Steps and Ongoing Work
• Over 6-9 months, we will work to optimize use of indirect imputation strategies in Duke EHR.
• We will explore methods to build upon BISG imputation to improve accuracy and will provide measures of certainty for imputed race and ethnicity.
• Over next 12 months, we will create a toolkit for use of indirect estimators in health systems PCTs (race/ethnicity and SES).
• Goal is to work directly with 1-2 PCTs to impute missing race and ethnicity data, as well as provide SES index data.
• Simulation modeling to optimize detection of racial HTE when using electronic health system data
Conclusions
• In summary, we have a unique opportunity to learn more about how treatments in PCTs may differ for minorities.
• Efforts to examine treatment effect by race and ethnicity may be hampered by large amounts of missing race and ethnicity data.
• We have shown acceptable accuracy for large minority groups with BISG and can reduce missing data significantly. • Reduced accuracy of BISG imputation as SES increases for blacks and
Hispanics
• While imputation is a viable interim fix, engaging health systems in long-term solutions to improve data quality is necessary.
Acknowledgements
• Adrian Hernandez, MD
• Robert Califf, MD
• Sohayla Pruitt, MA
• Kinghshuk Roy Choudhury, PhD
• Yuliya Lokhnygina, PhD
• Meredith Nahm, PhD
• Judy Stafford, MS
• Darcy Louzao, PhD
• Tammy Reece, Cheri Janning, Liz Wing, Jonathan McCall
Research reported in this presentation was supported by the Common FundResearch Supplements To Promote Diversity In Health Related Research under AwardNumber 3U54AT007748-02S1 and the Health Care Systems Research CollaboratoryCoordinating Center under Award Number 1U54AT007748-01 the National Centerfor Complementary and Integrative Health, a center of the National Institutes ofHealth. The content is solely the responsibility of the authors and does notnecessarily represent the official views of the National Institutes of Health.
Additional Slides
Adler-Milstein et alHealth Afffairs 2014. 33(9) 1664-1671
2009 AHRQ Report: Quality of Health Care in US
Socioeconomic Status (SES)
• Paucity of data on the availability of SES data in the EHR
• Experience in Duke EHR
• Years of Education– 0% of the time
• Occupation- 0.56% of the time
• About 2500 patients out of >4,400,000 have this data collected.
• Paucity of availability of data in RCTs
• Increasing use of geocoded neighborhood-level SES variables in observational studies
• More recently, the use of SES data within Medicare
Socioeconomic Index ScoreConstruct Measure Definition
Occupation
Unemployment Percentageofpersonsaged16
yearsorolderinthelaborforce
whoareunemployed(andactively
seekingwork)
Income
BelowUSPovertyLine Percentageofpersonsbelowthe
federallydefinedpovertyline
MedianIncome Medianhouseholdincome
Wealth
PropertyValues Medianvalueofowner-occupied
homes
Education
LowEducation Percentageofpersonsaged>25
yearswithlessthana12th-grade
education
HighEducation Percentageofpersonsaged>25
yearswithatleast4yearsof
college
Housing
Crowdedhouseholds Percentageofhouseholds
containingoneormorepersonper
room
Implementation of SES Index within Duke Medicine Health System’s Research Infrastructure
Strategies to Improve Quality and Completeness
• Collecting data at a patient’s first visit
• Offering routine staff training
• Incorporating questions into existing admission forms
• Development and enforcement of hospital policies regarding data collection
• Availability of a frequently asked questions and answers document for staff
• For patients, much more receptive to “we are collecting this information to improve the care of all patients”
Gomez, J health care poor and underserved25(2014):1384-1396