Addressing GHG emissions from international maritime transport ICAO/IMO Side Event UNFCCC COP 20 Dr Edmund Hughes Head, Air Pollution and Energy Efficiency Marine Environment Division, 1 st December 2014
Transcript
Addressing GHG emissions from international maritime transport ICAO/IMO Side Event UNFCCC COP 20
Dr Edmund Hughes Head, Air Pollution and Energy Efficiency
Marine Environment Division, 1st December 2014
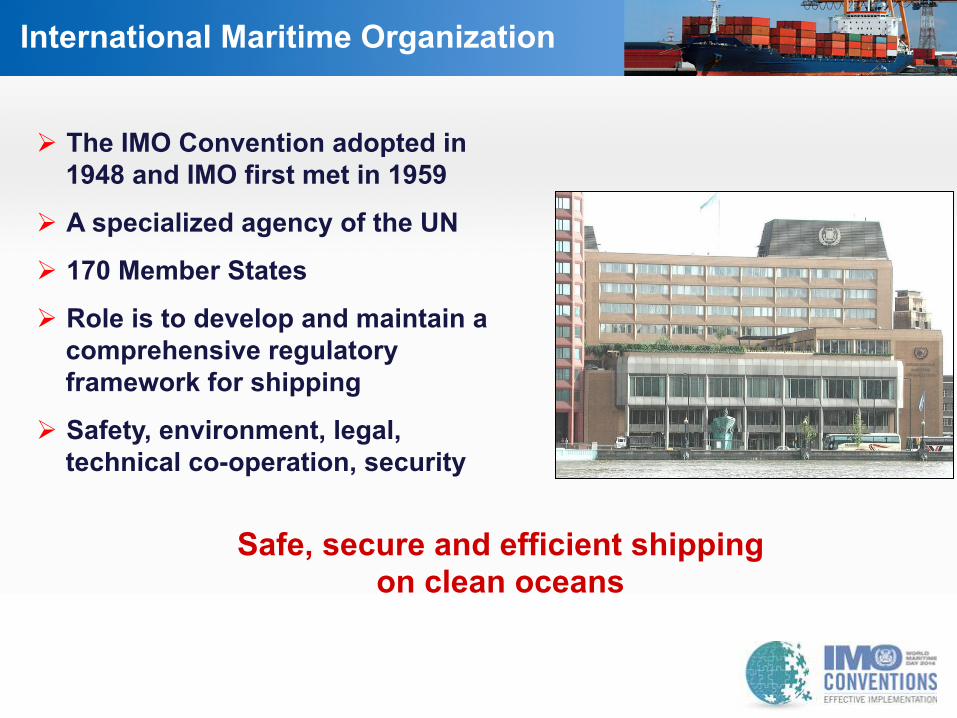
International Maritime Organization Ø The IMO Convention adopted in
1948 and IMO first met in 1959
Ø A specialized agency of the UN
Ø 170 Member States
Ø Role is to develop and maintain a comprehensive regulatory framework for shipping
Safe, secure and efficient shipping on clean oceans
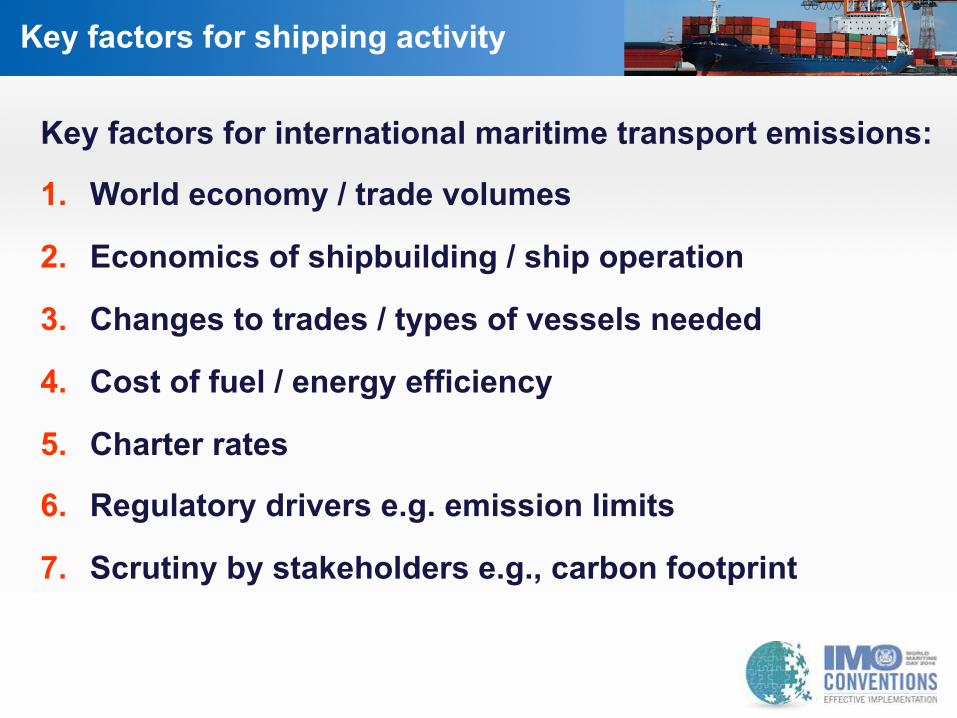
Key factors for international maritime transport emissions:
1. World economy / trade volumes
2. Economics of shipbuilding / ship operation
3. Changes to trades / types of vessels needed
4. Cost of fuel / energy efficiency
5. Charter rates
6. Regulatory drivers e.g. emission limits
7. Scrutiny by stakeholders e.g., carbon footprint
Key factors for shipping activity
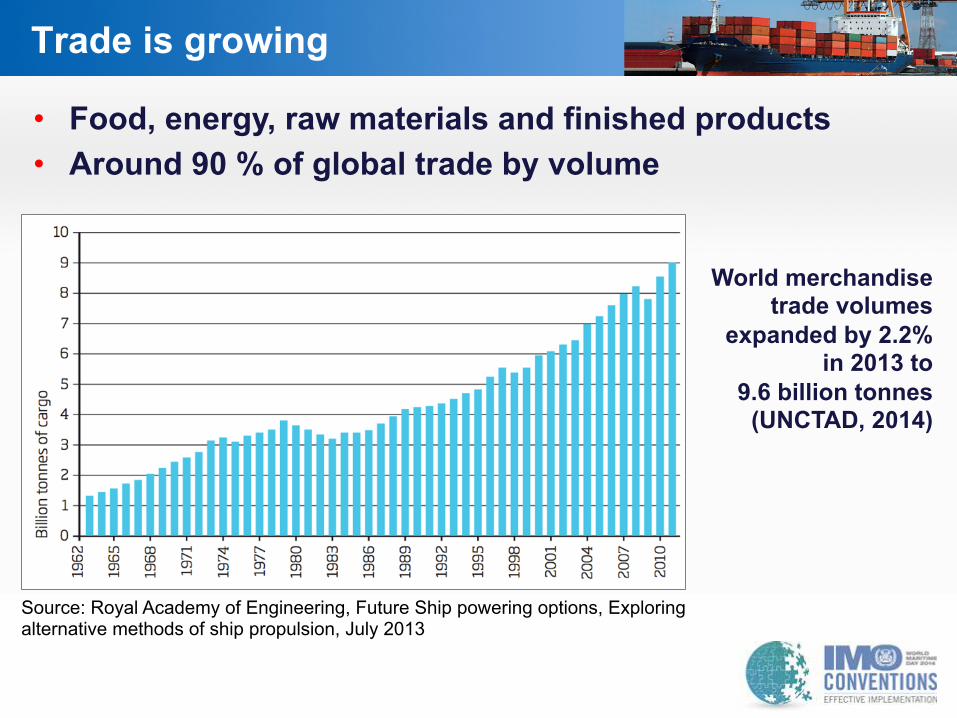
Trade is growing
• Food, energy, raw materials and finished products • Around 90 % of global trade by volume
World merchandise trade volumes
expanded by 2.2% in 2013 to
9.6 billion tonnes (UNCTAD, 2014)
Source: Royal Academy of Engineering, Future Ship powering options, Exploring alternative methods of ship propulsion, July 2013
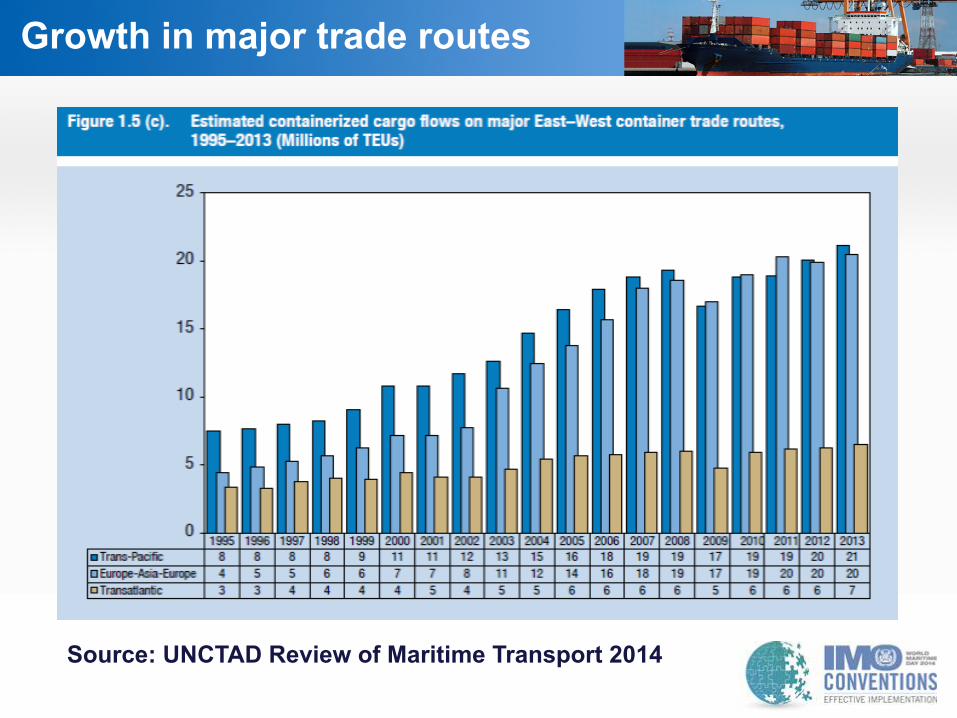
Growth in major trade routes
Source: UNCTAD Review of Maritime Transport 2014
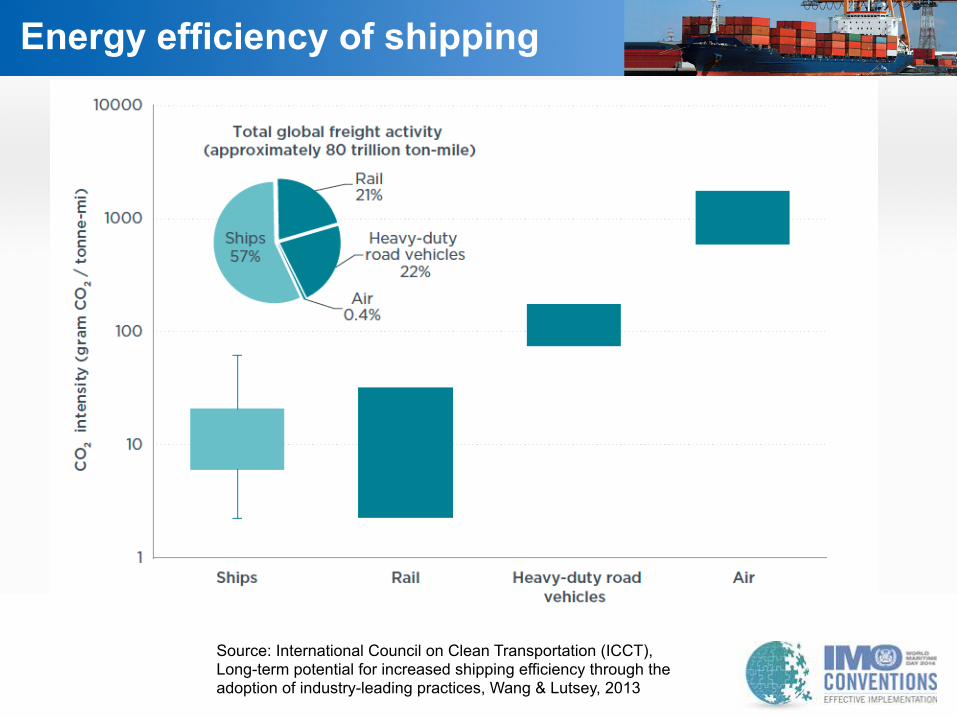
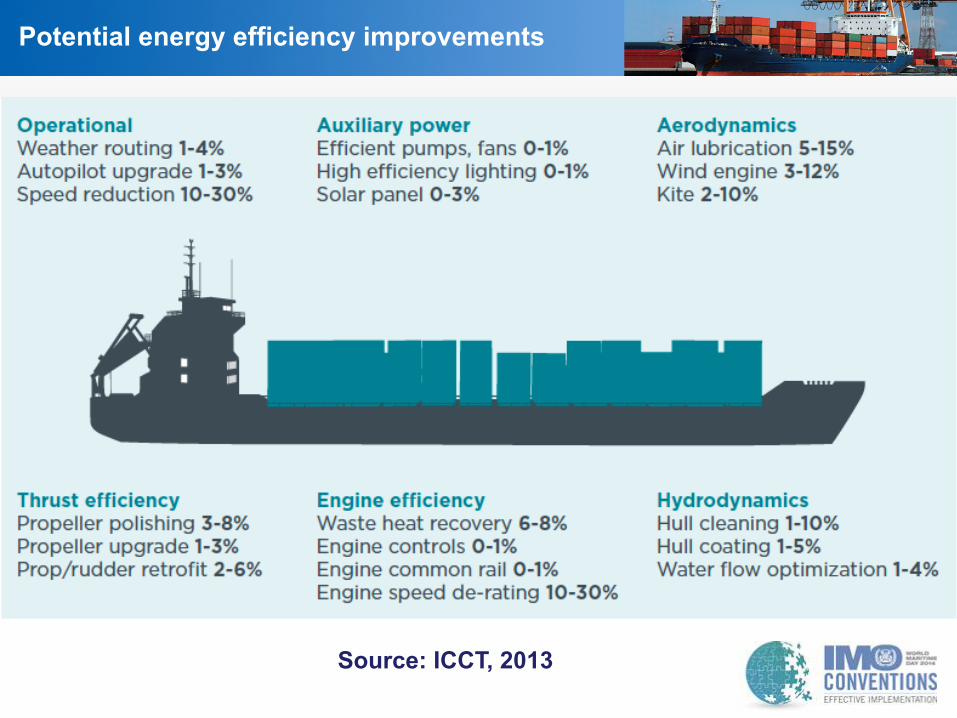
Energy efficiency of shipping
Source: International Council on Clean Transportation (ICCT), Long-term potential for increased shipping efficiency through the adoption of industry-leading practices, Wang & Lutsey, 2013
IMO work to address GHG
emissions from international
shipping
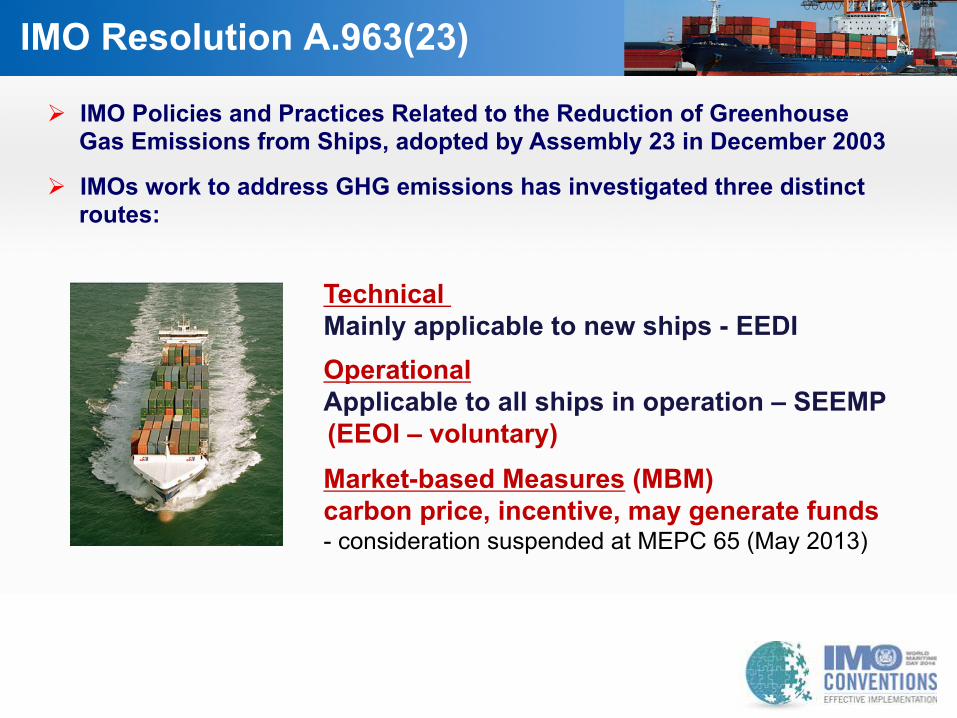
IMO Resolution A.963(23)
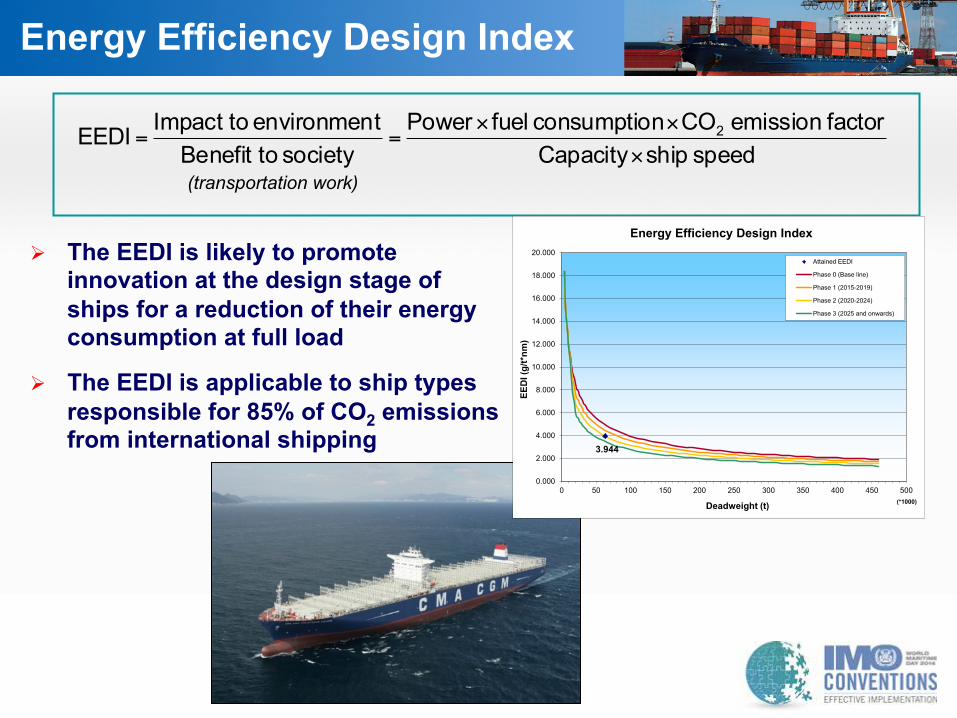
Technical Mainly applicable to new ships - EEDI
Operational Applicable to all ships in operation – SEEMP (EEOI – voluntary)
Market-based Measures (MBM) carbon price, incentive, may generate funds - consideration suspended at MEPC 65 (May 2013)
Ø IMO Policies and Practices Related to the Reduction of Greenhouse Gas Emissions from Ships, adopted by Assembly 23 in December 2003
Ø IMOs work to address GHG emissions has investigated three distinct routes:
9
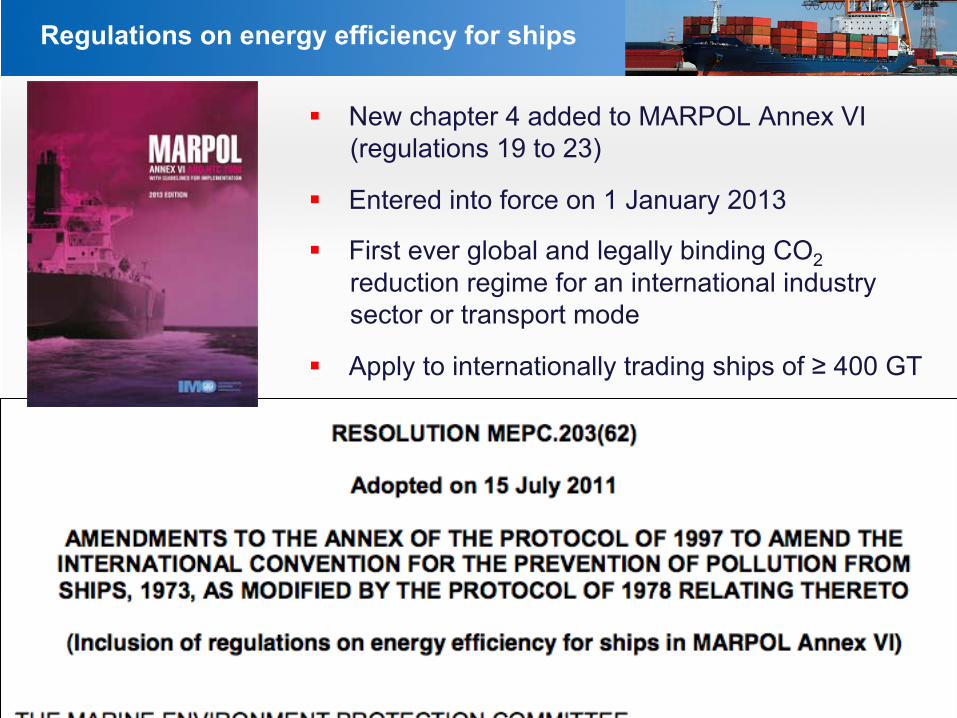
Regulations on energy efficiency for ships
§ New chapter 4 added to MARPOL Annex VI (regulations 19 to 23)
§ Entered into force on 1 January 2013
§ First ever global and legally binding CO2 reduction regime for an international industry sector or transport mode
§ Apply to internationally trading ships of ≥ 400 GT
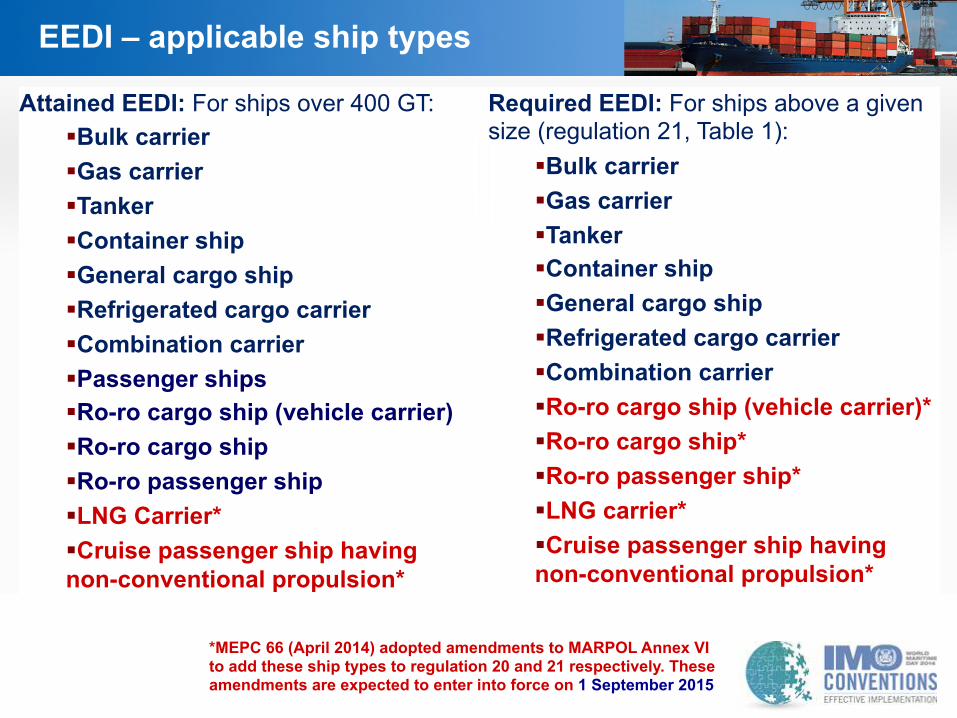
*MEPC 66 (April 2014) adopted amendments to MARPOL Annex VI to add these ship types to regulation 20 and 21 respectively. These amendments are expected to enter into force on 1 September 2015
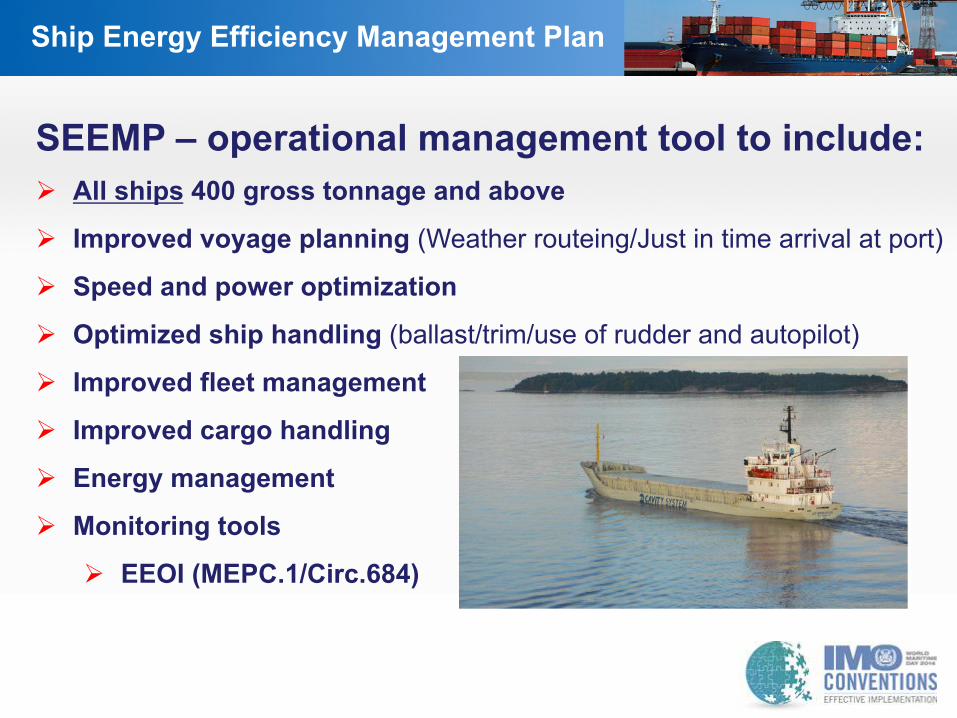
Ship Energy Efficiency Management Plan
SEEMP – operational management tool to include: Ø All ships 400 gross tonnage and above
Ø Improved voyage planning (Weather routeing/Just in time arrival at port)
Ø Speed and power optimization
Ø Optimized ship handling (ballast/trim/use of rudder and autopilot)
Ø Improved fleet management
Ø Improved cargo handling
Ø Energy management
Ø Monitoring tools
Ø EEOI (MEPC.1/Circ.684)
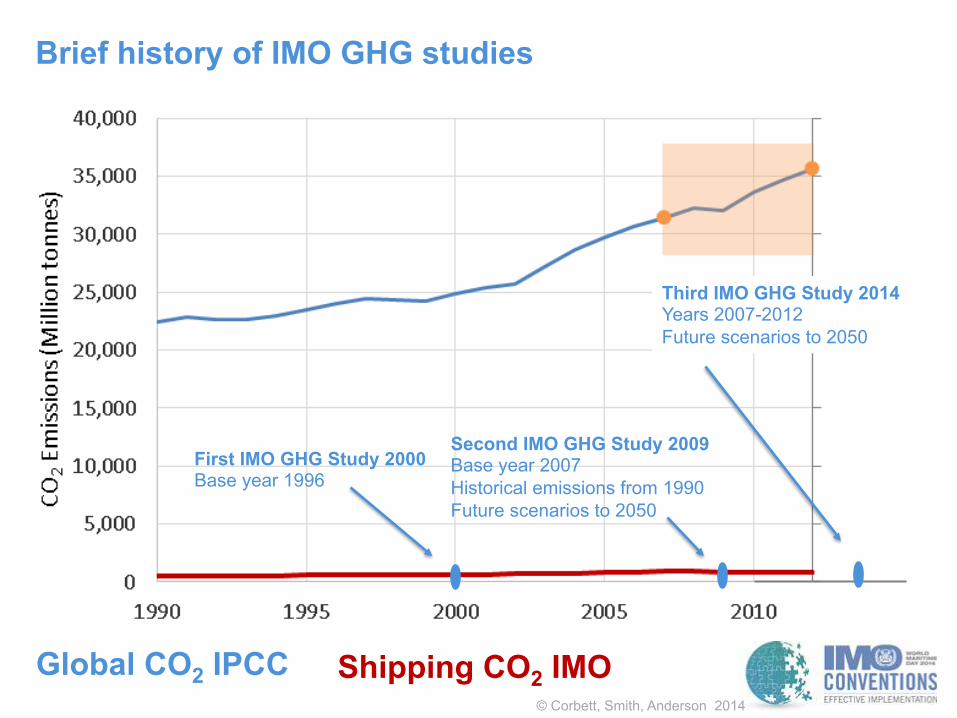
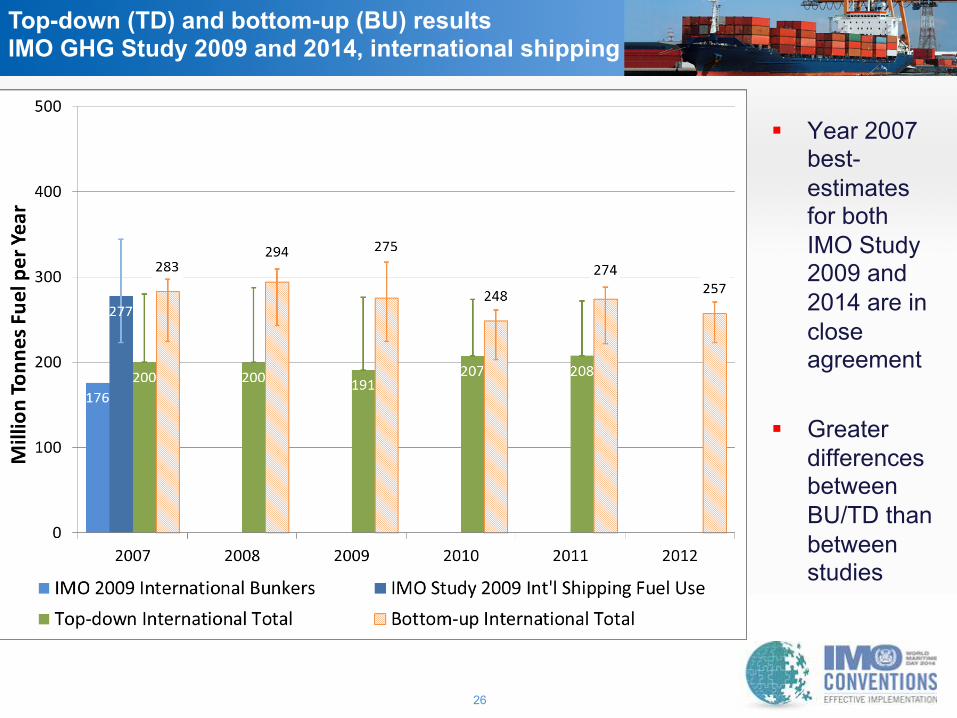
First IMO GHG Study 2000 Base year 1996
Second IMO GHG Study 2009 Base year 2007 Historical emissions from 1990 Future scenarios to 2050
Third IMO GHG Study 2014 Years 2007-2012 Future scenarios to 2050
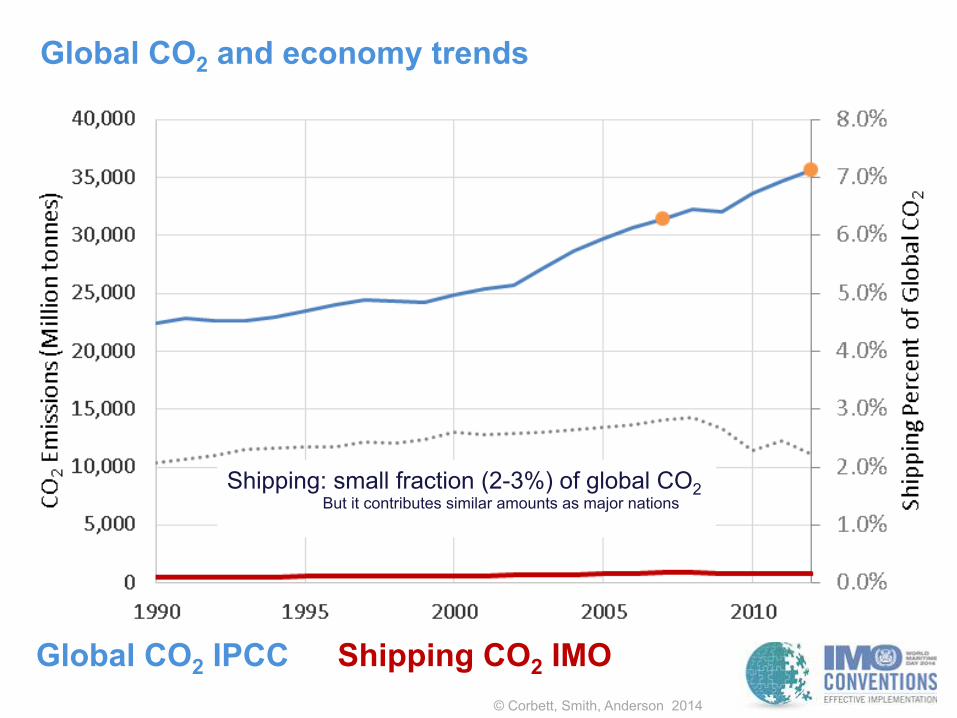
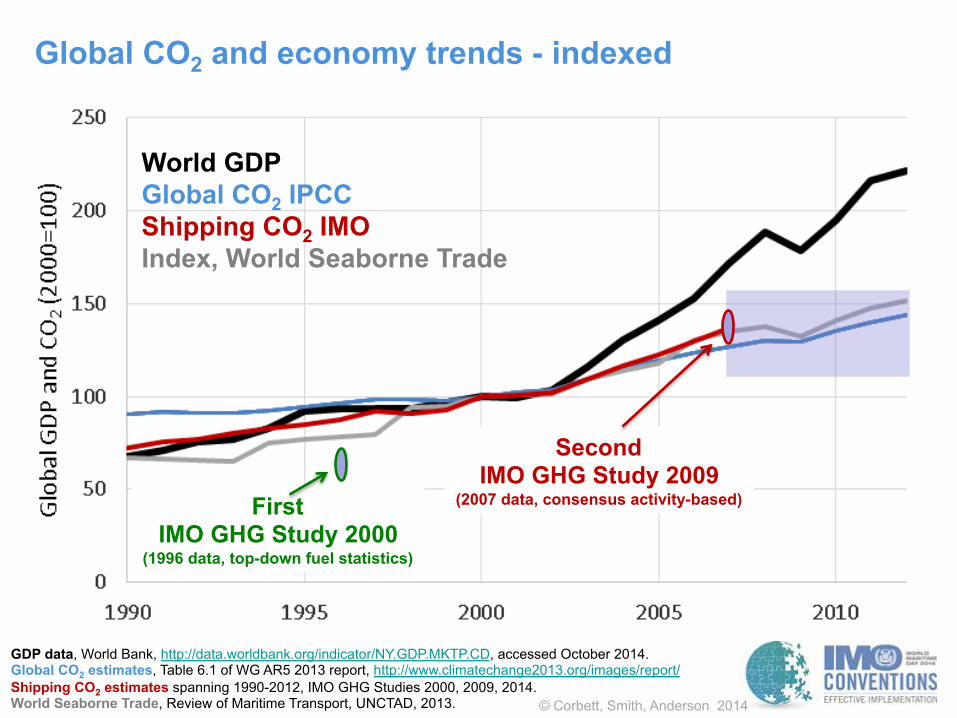
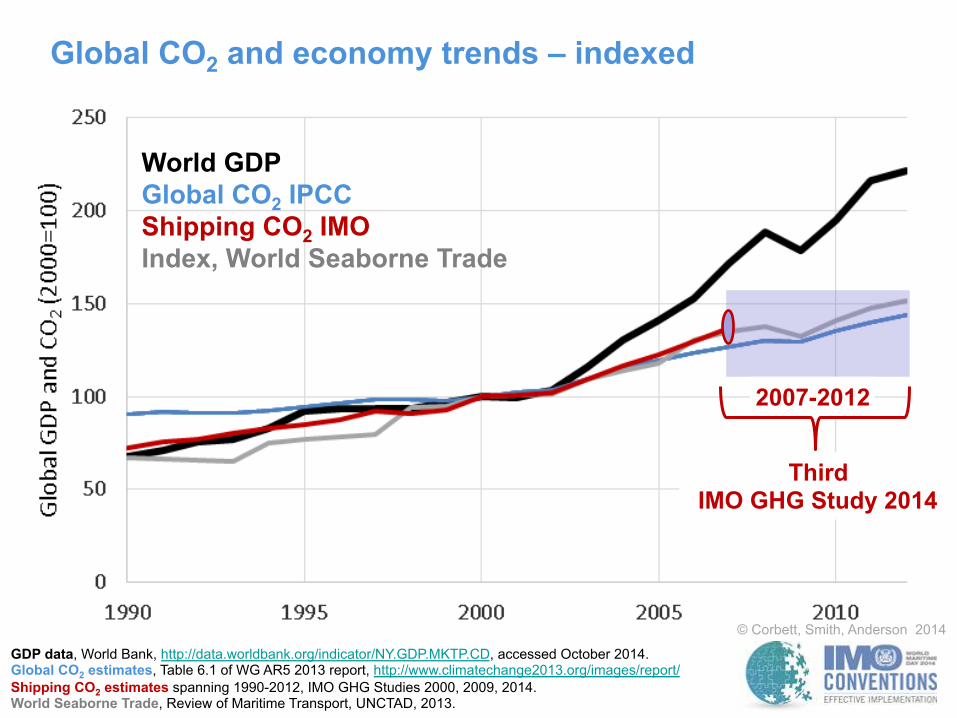
GDP data, World Bank, http://data.worldbank.org/indicator/NY.GDP.MKTP.CD, accessed October 2014. Global CO2 estimates, Table 6.1 of WG AR5 2013 report, http://www.climatechange2013.org/images/report/ Shipping CO2 estimates spanning 1990-2012, IMO GHG Studies 2000, 2009, 2014. World Seaborne Trade, Review of Maritime Transport, UNCTAD, 2013.
World GDP Global CO2 IPCC Shipping CO2 IMO Index, World Seaborne Trade
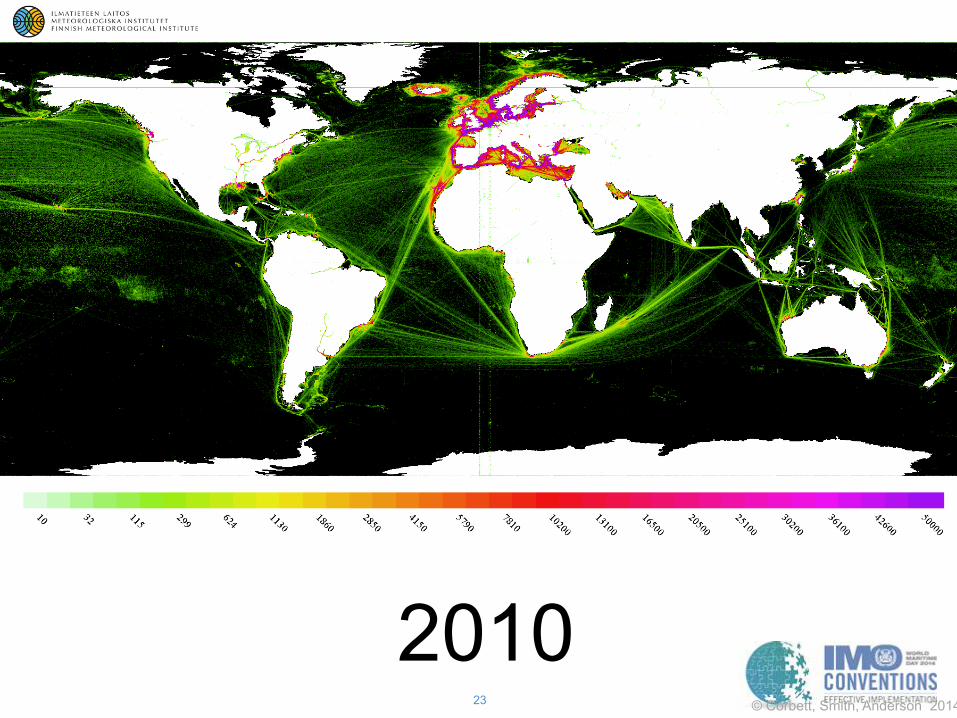
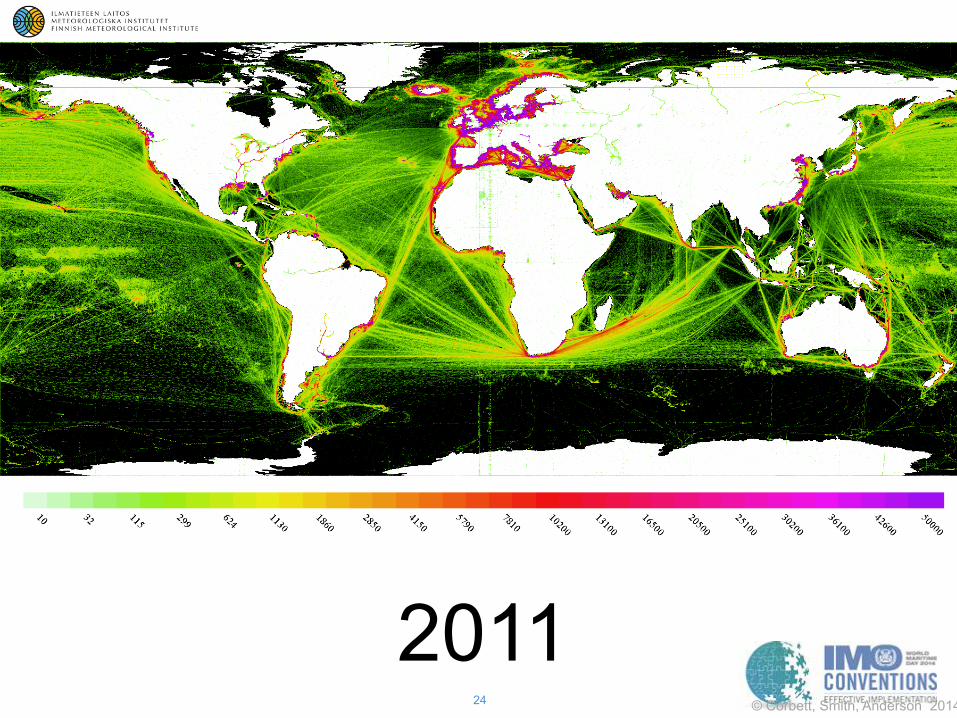
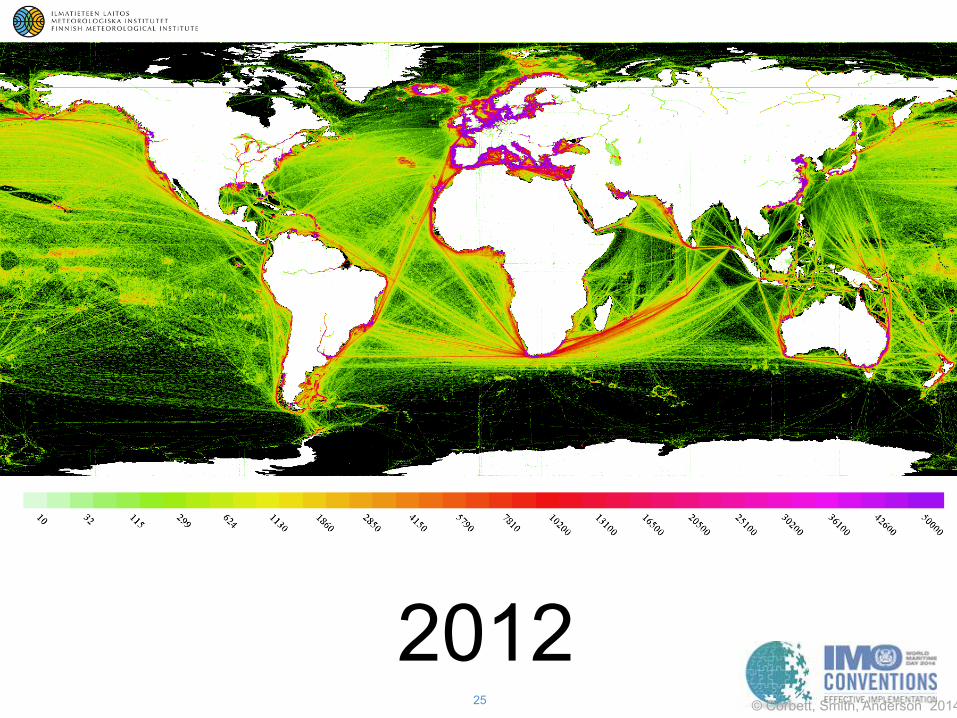
Third IMO GHG Study 2014
2007-2012
18
Third IMO GHG Study 2014
19
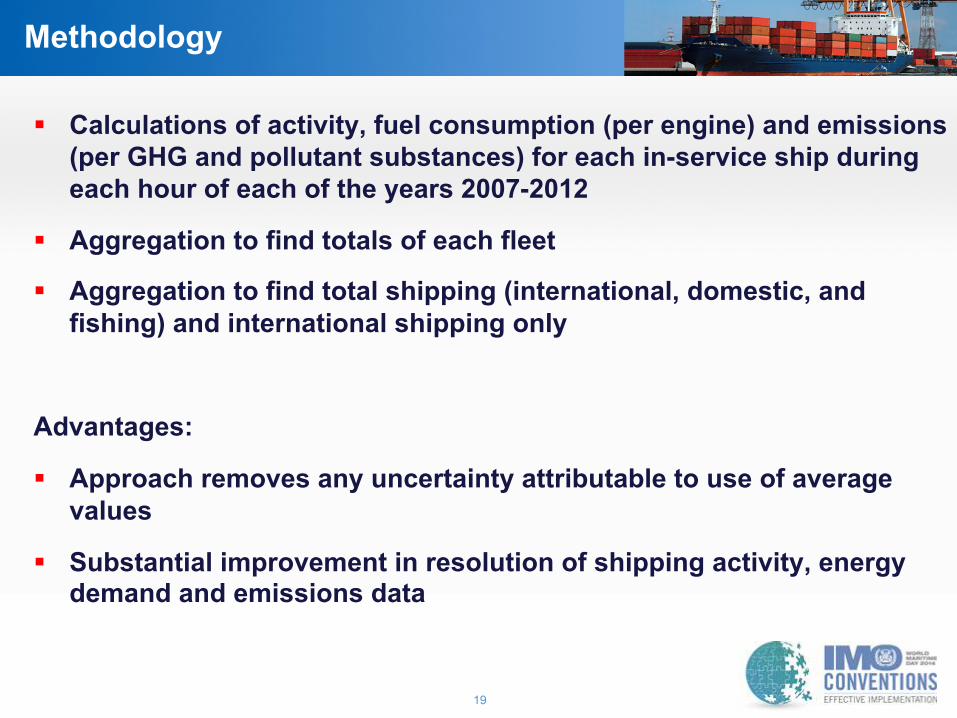
Methodology
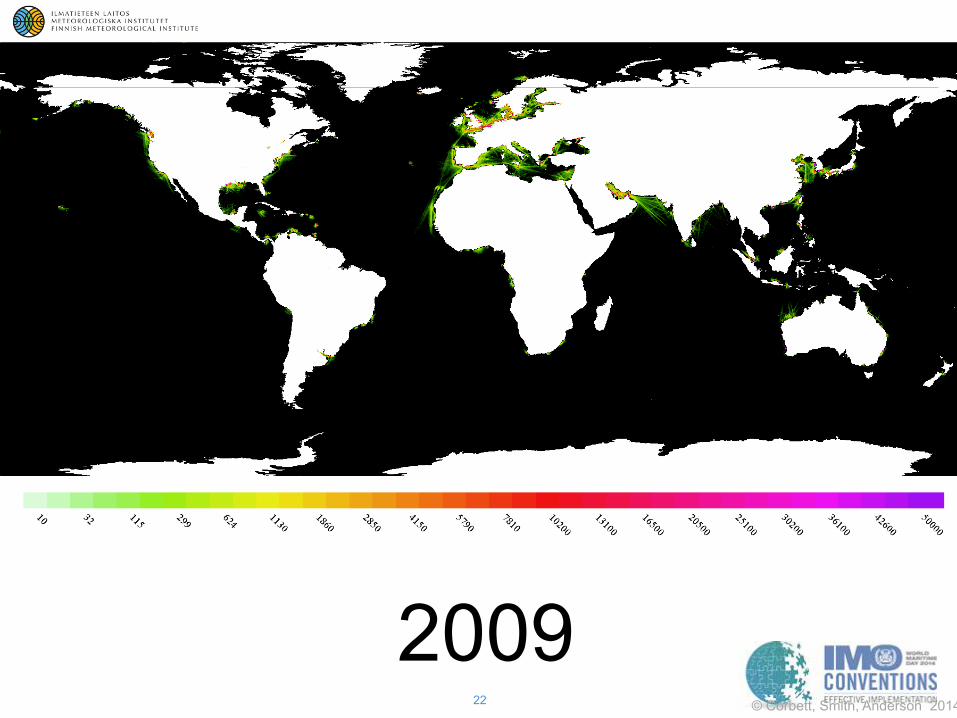
§ Calculations of activity, fuel consumption (per engine) and emissions (per GHG and pollutant substances) for each in-service ship during each hour of each of the years 2007-2012
§ Aggregation to find totals of each fleet
§ Aggregation to find total shipping (international, domestic, and fishing) and international shipping only
Advantages:
§ Approach removes any uncertainty attributable to use of average values
§ Substantial improvement in resolution of shipping activity, energy demand and emissions data
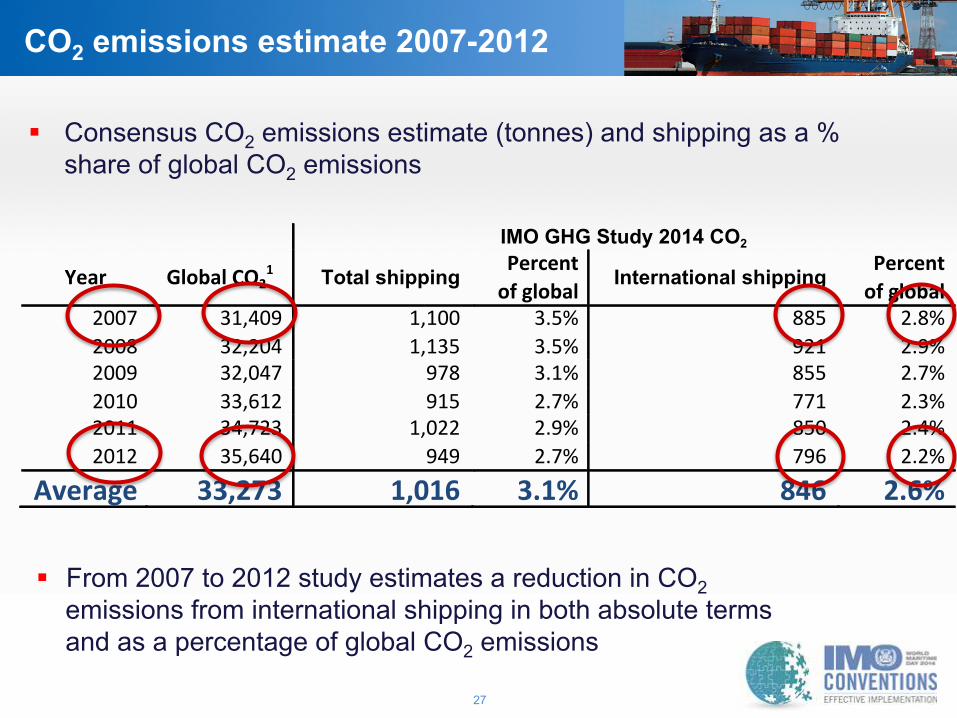
§ Consensus CO2 emissions estimate (tonnes) and shipping as a % share of global CO2 emissions
§ From 2007 to 2012 study estimates a reduction in CO2 emissions from international shipping in both absolute terms and as a percentage of global CO2 emissions
28
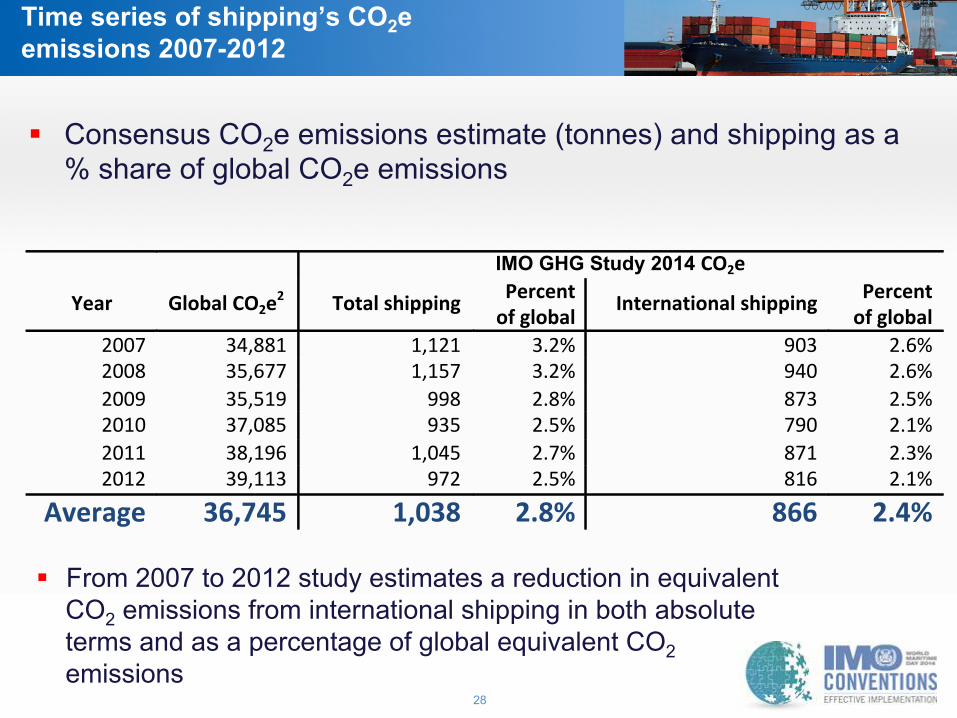
Time series of shipping’s CO2e emissions 2007-2012
§ Consensus CO2e emissions estimate (tonnes) and shipping as a % share of global CO2e emissions
§ From 2007 to 2012 study estimates a reduction in equivalent CO2 emissions from international shipping in both absolute terms and as a percentage of global equivalent CO2 emissions
29
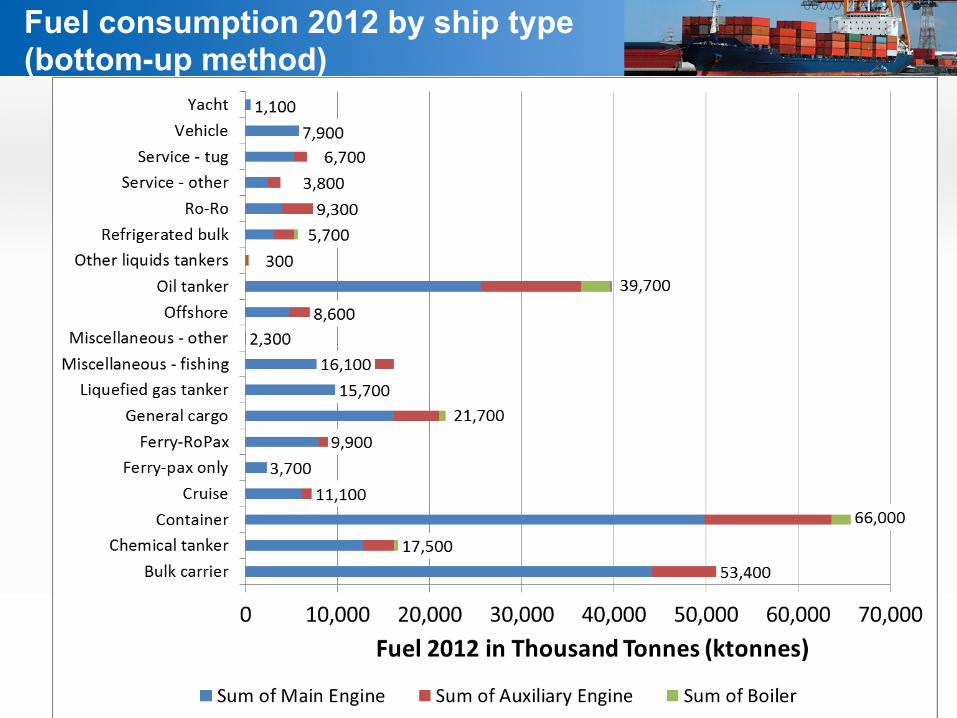
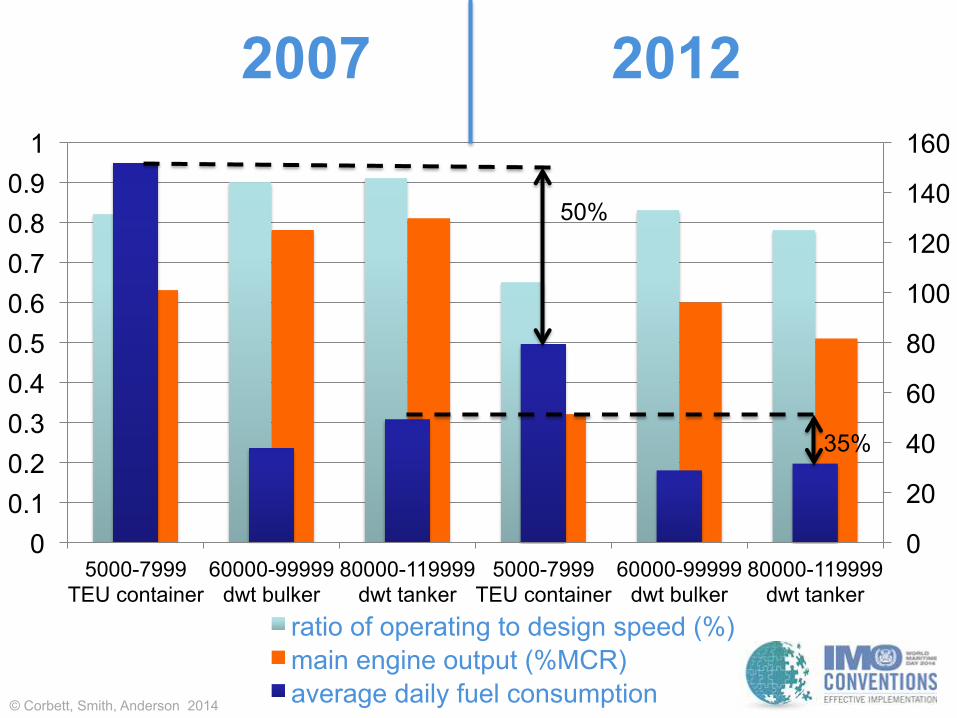
Fuel consumption 2012 by ship type (bottom-up method)
0 0.1 0.2 0.3 0.4 0.5 0.6 0.7 0.8 0.9
1
5000-7999 TEU container
60000-99999 dwt bulker
80000-119999 dwt tanker
5000-7999 TEU container
60000-99999 dwt bulker
80000-119999 dwt tanker
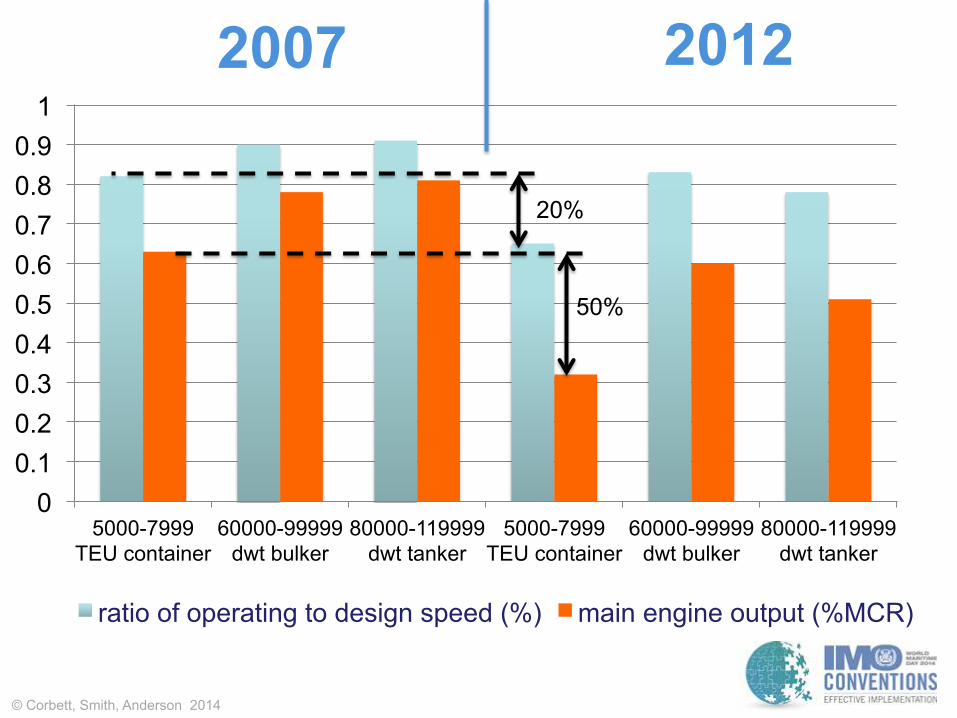
ratio of operating to design speed (%) main engine output (%MCR)
Ø 2nd IMO GHG Study 2009 projected rapid emissions increase, but since publication:
§ new set of long-term socio-economic scenarios has been developed by IPCC
§ larger & more efficient container ships have entered market
§ new emission projection methods have been developed:
- based on transport work activity, rather than tonnes of cargo - taking into account non-linear relations between activity drivers
(e.g. GDP) and activity (i.e., transport work)
Ø 3rd Third IMO Study 2014 has developed new projections
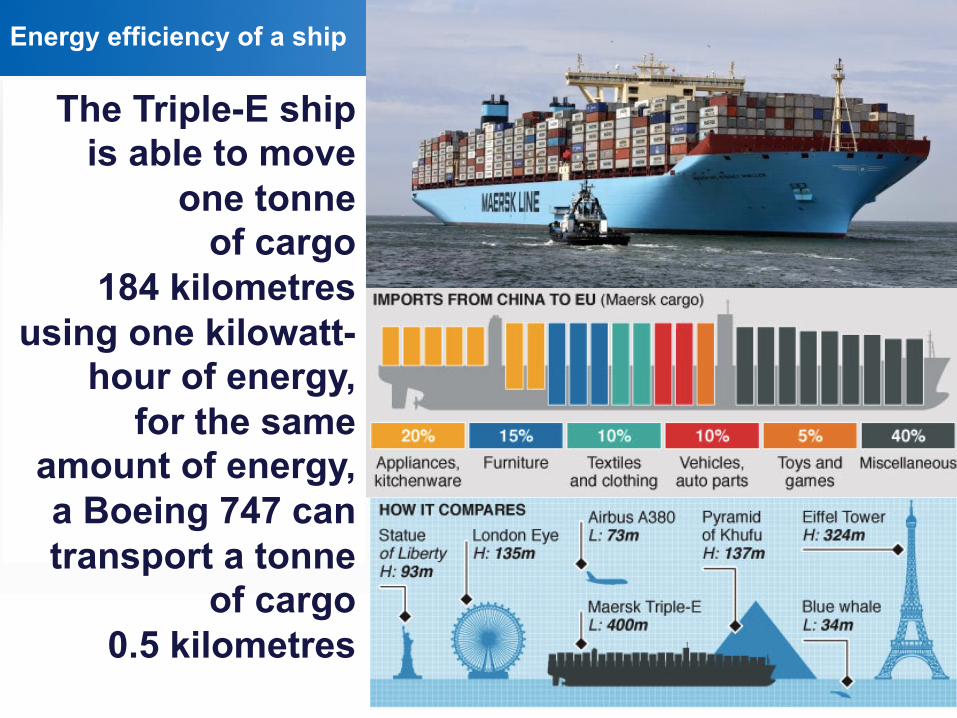
The Triple-E ship
is able to move one tonne
of cargo 184 kilometres
using one kilowatt-hour of energy,
for the same amount of energy, a Boeing 747 can transport a tonne
of cargo 0.5 kilometres
Energy efficiency of a ship
34
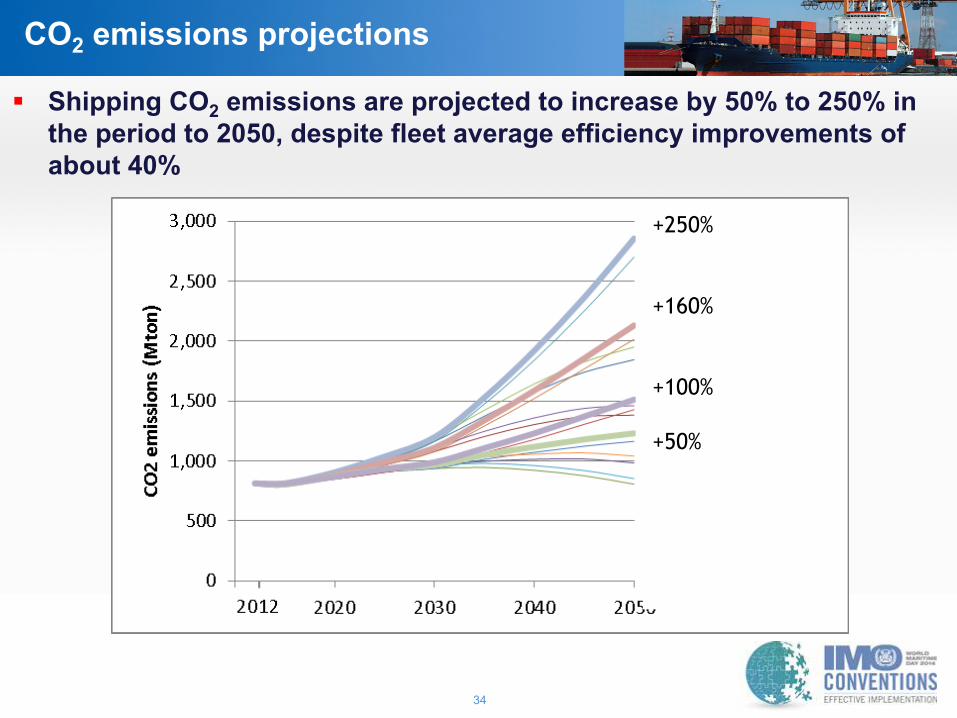
CO2 emissions projections
§ Shipping CO2 emissions are projected to increase by 50% to 250% in the period to 2050, despite fleet average efficiency improvements of about 40%
+250% +160% +100% +50%
35
Future scenarios (2012 – 2050)
§ Maritime CO2 emissions are projected to increase significantly in the coming decades
§ Depending on future economic and energy developments, BAU scenarios project increase by 50% to 250% in the period to 2050
§ Further action on efficiency and emissions can mitigate emissions growth, although all scenarios but one project emissions in 2050 to be higher than 2012
§ Demand for transport of unitized cargoes projected to increase most rapidly in all scenarios