Addressing groundwater Addressing groundwater overexploitation with MAR: a review of experiences from the Ai dP ifi i Asia and Pacific regions Paul Pavelic IWMI H d bdIdi IWMI, Hyderabad, India APWF Regional Water KnowledgeHub for Groundwater Management Launch Meeting Groundwater Management Launch Meeting Bangkok, Thailand, 2-3 June 2011 Global Groundwater Overexploitation Global Groundwater Overexploitation Global map of groundwater depletion, where 1000 on the legend is equal to one cubic kilometer of depletion per year. Source: Wada et al (2010)
Transcript
Addressing groundwaterAddressing groundwater overexploitation with MAR: a p
review of experiences from the A i d P ifi iAsia and Pacific regions
Paul PavelicIWMI H d b d I diIWMI, Hyderabad, India
APWF Regional Water KnowledgeHub for Groundwater Management Launch MeetingGroundwater Management Launch MeetingBangkok, Thailand, 2-3 June 2011
Global Groundwater OverexploitationGlobal Groundwater Overexploitation
Global map of groundwater depletion, where 1000 on the legend is equal to one cubic kilometer of depletion per year. Source: Wada et al (2010)
GW Response in Relation to Development & Production - 1Development & Production 1
depth
ground level
depthto
GWlevellevel
agricultural
dryland agricultural production
agricultural production
time
GW Response in Relation to Development & Production - 2Development & Production 2
depth
ground level
depthto
GWlevel shallowlevel shallow
wells dry up
deeper wells dry
mediumirrigation
production
agriculturaldeep wells
medium depth wells
shallow wells
dryland agricultural production
agricultural production
wellswells
time
GW Response in Relation to Development & Production - 3Development & Production 3
depth IntroduceDo Nothing
ground level
depthto
GWlevel
IntroduceMAR
Do NothingDifferent
shallow
major
level shallow wells dry up
moderate
deeper wells dry
mediumirrigation
production
agriculturaldeep wells
medium depth wells
shallow wells
timedryland agricultural production
agricultural production
wellswells
Tools for Sustainable GW M t
1 Direct approaches (eg groundwater regulation limits on
Management
1. Direct approaches (eg. groundwater regulation, limits on extraction etc)
2 I di t h ( i lt l b idi i i2. Indirect approaches (eg. agricultural subsidies, energy pricing food procurement policies, rural employment policies, agricultural trade and tariff policies etc)agricultural trade and tariff policies etc)
3. Technical approachesincluding supplyincluding supply augmentation (eg. MAR, RWH) and demandRWH) and demand management (drip irrigation, crop types)
4. Awareness and education- basededucation based approaches (eg. community participation)
Balancing the GW Budgetg g
Demand-
city
sideDecrease use
Cap
ac
Sustainable target level
tora
ge target level
I
uife
r S
t
Supply-
Increase recharge
Aqu side
Methods to store and recover water via Managed Aquiferwater via Managed Aquifer
Recharge (MAR)
“ f l h“ A process of replenishment of ground water reservoir by h ti iti i l dhuman activities in a planned manner – by spreading b i t h ll tbasins, trenches, wells etc. for replenishing the aquifer ”
Source: Dillon, (2005)
Reasons for MARReasons for MAR
O i GW d l ti• Overcoming GW resource depletion
• Increasing water securityg y
• Livelihood enhancement through supplemental wet season irrigation/drysupplemental wet season irrigation/dry season irrigation
• Conjunctive resource management tool
• Wastewater to water supplyWastewater to water supply
• Restoration or creation of resource
• Enhancing environmental values
Technical, Environmental and Economic Iss esEconomic Issues
WSD Structure Constructions within the two sub-catchments, 200-2003,
Rock-filled damCheck-dam
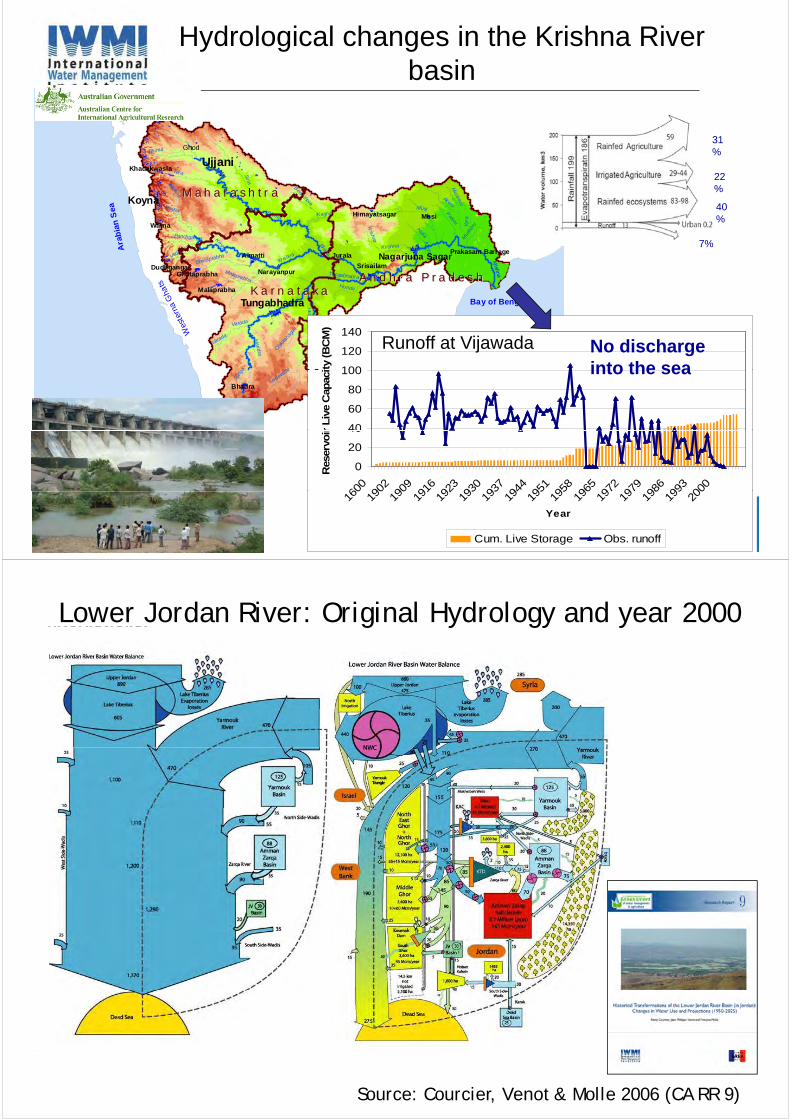
Hydrological changes in the Krishna River basinbasin
• Area: 259,948 km2
• Population: 73 million
• Three riparian statesUjjaniKhadakwasla
Ghod
Sina
Nira
B
Kris
Bhima
M
M h h t
31%
22%
Maharashtra
Arabia Bay of
Koyna
Warna
Kris
MusiHimayatsagar
Ara
bia
n S
ea Bhima
Musi
Akeru
Paleru
Halia
Krishna
KagnaKoyna
Vyr
aM
unne
ru
Bennithora
anga
Panchganga
rishna
Bhi
Krishn
Krishna
Munneru
M a h a r a s h t r aM a h a r a s h t r a %
40%
7%Arabian sea
Bay of Bengal Almatti
Ghataprabha
Malaprabha
Dudhganga
Tungabhadra
Srisailam
shnaNagarjuna Sagar KrishnaKrishna
Prakasam Barrage
Narayanpur
Jurala
Bay of Bengal
A
na G
hats
r i
Ghataprabha
K
Hundri
MalaprabhaTungabhadra
Vedgang hima
Krishna
hna
K a r n a t a k aK a r n a t a k aA n d h r a P r a d e s hA n d h r a P r a d e s h
Wes
tern
thi
Ha
gar
ga
Varada
Chikka
haga
ri
Haridra
Varada
100
120
140ity
(BC
M)
No discharge into the sea
Runoff at Vijawada
BhadraVedava
thi
Tung
a
40
60
80
100
r Liv
e C
apac
i into the sea
0
20
40
600
902
909
916
923
930
937
944
951
958
965
972
979
986
993
000
Res
ervo
ir
160
190
190
191
192
193
193
194
195
195
196
197
197
198
199
200
Year
Cum. Live Storage Obs. runoff
Lower Jordan River: Original Hydrology and year 2000g y gy y
Source: Courcier, Venot & Molle 2006 (CA RR 9)
The role of MAR in IWRM -Syrdarya River Basin CASyrdarya River Basin, CA
Ratio of summer to winter flow
Syrdarya River Basin
Irrigation & Hydropower Nexus
Fergana Valley AquifersSource: A Karimov, IWMI
Potential of aquifers of Fergana Valley as storage and source of wateras storage and source of water
Free storages of aquifers of Fergana ValleyFree storages of aquifers of Fergana Valley
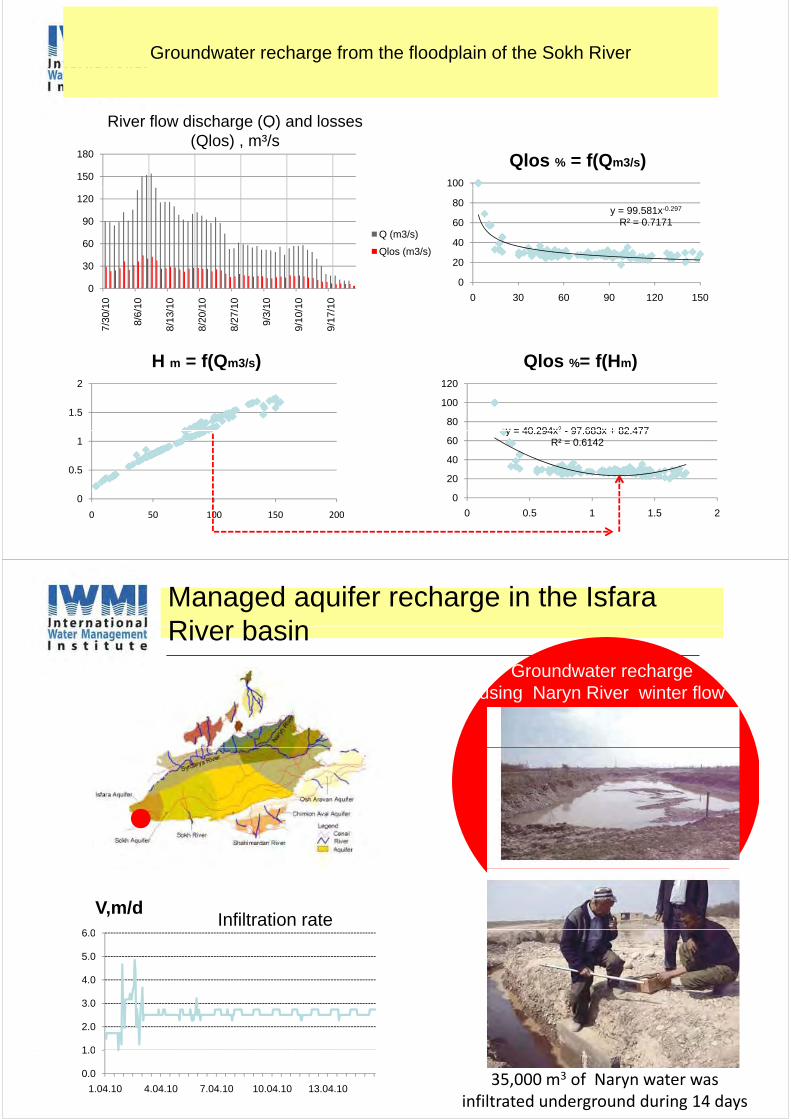
Enhancing natural recharge from river floodplain in Sokh
River Basin
Groundwater recharge from the floodplain of the Sokh River
River flow discharge (Q) and losses
100
Qlos % = f(Qm3/s)150
180
g ( )(Qlos) , m³/s
y = 99.581x-0.297
R² = 0.7171
40
60
80
60
90
120
Q (m3/s)
Ql ( 3/ )
0
20
0 30 60 90 120 1500
30
/10
/10
/10
/10
/10
/10
/10
/10
Qlos (m3/s)
H m = f(Qm3/s) Qlos %= f(Hm)
7/30
/
8/6/
8/13
/
8/20
/
8/27
/
9/3/
9/10
/
9/17
/
1.5
2
( )
y = 40 294x2 97 683x + 82 47780
100
120
( )
0.5
1y = 40.294x2 - 97.683x + 82.477
R² = 0.6142
20
40
60
0
0 50 100 150 200
0
0 0.5 1 1.5 2
Managed aquifer recharge in the Isfara River basinRiver basin
Groundwater recharge i N Ri i t flusing Naryn River winter flow
6 0
V,m/dInfiltration rate
4.0
5.0
6.0
1 0
2.0
3.0
0.0
1.0
1.04.10 4.04.10 7.04.10 10.04.10 13.04.1035,000 m3 of Naryn water was
infiltrated underground during 14 days
Conclusions
• MAR is not a panacea for water quantity/quality issuesquantity/quality issues
• MAR can be an effective strategy in a diverse range of settingsdiverse range of settings
• To harness it effectively, local benefits need t b d i t i l i tto be assessed against regional impacts
• Opens the way for more sustainable and p yeconomic conjunctive use of surface and groundwater resourcesg
Further Reading
AcknowledgementsAcknowledgements
• Tushaar Shah IWMI IndiaTushaar Shah, IWMI, India
• Akmal Karimov, IWMI, Uzbekistan
• Peter Dillon, CSIRO, Australia
K P li i i IWMI ITP I di• K. Palinisami, IWMI-ITP, India
• A. Raviraj, Tamil Nadu Agricultural Uni., Indiaj, g ,
• Andrew Noble, IMWI, Laos
• Kriengsak Srisuk, Khon Kaen Uni, Thailand
Thankyou & QuestionsThankyou & Questions…….
“ “ Let not a single drop of water received from rains go waste Let not a single drop of water received from rains go waste i t th ith t b fiti th d th b ti t th ith t b fiti th d th b t ””into the sea without benefiting the man and the beast into the sea without benefiting the man and the beast ””
King Parakramabahu (1153King Parakramabahu (1153--1186 AD) 1186 AD)