15
A ADELAIDE LED TRIAL: FINAL REPORT LED: Lightsavers

A
ADELAIDE LED TRIAL:FINAL REPORT
LED: Lightsavers

TABLE OF CONTENTS
................................................................................................Acknowledgements 2
...............................................................................................Executive Summary 3
............................................................................................................Background 4
..........................................................................The LightSavers Park 2 LED Trial 5
............................................................The Monitoring Protocol and Methodology 6
...................................................................................................................Results 9
.............................................................................Illuminance comparisons 9............................................................ Correlated color temperature (CCT) 9
.......................................................................................... Energy savings 10
............................................ Luminaire site-specific system effectiveness 10................................................................................. Lumen maintenance 11
..............................................................................................................Summary 14
1

ACKNOWLEDGEMENTS
The City of Adelaide has participated in a unique global trial of LED outdoor lighting organ-ized by The Climate Group. The key aim of the project was to test the performance of a vari-ety of LED luminaire products in real world field conditions, comparing these products with baseline high intensity discharge (HID) lamps using the same measurement protocol and equipment. Other cities participating in the initiative were: London, New York, Toronto, Syd-ney, Hong Kong, Kolkata, and Thane, a suburb of Mumbai, and Quezon City, the Philippines. Chinese cities Guiyang and Tianjin also participated as observers.
The LightSavers global LED trials ran from October 2009 to January 2012 and aimed to pro-vide greater certainty about the state of LED technology. During the trials, lighting managers from nine of the cities independently tested the performance of more than 500 luminaires representing 27 different commercially available LED products, using the same measure-ment protocol. Key findings of the trials were:
• LEDs achieve the expected 50 to 70 percent energy savings and reach up to 80 per-cent savings when coupled with smart controls;
• Even with these energy savings, the vast majority of tested products exceeded local lighting standards;
• Many commercial LED products tested show behavior indicative of lifespans of 50,000 hours, though the results from the trials should not be used for predictive pur-poses;
• LED products generally show very little change in color;• The ‘catastrophic’ failure rate of LED products over 6,000 hours is around one per-
cent, compared, for example, up to 10 percent for metal halide fixtures over a similar time period;
• In cities where surveys were conducted, the public prefers LED illumination, with about 90 percent of survey respondents supporting a full rollout of LEDs across city street lights.
It should be noted that the LED luminaire product tested in this trial was designed and manu-factured several years ago. It would be expected that recent generations of products should exhibit even better performance. The Climate Group’s LightSavers trial concludes that LEDs are now mature enough for scale-up in most outdoor applications, and that LEDs combined with smart controls promise greater savings.
The City of Adelaide’s participation in the global trial made an important contribution to the global trial results, especially given the longevity of the Park 2 trial, the longest among all the cities. The authors of this report, Philip Jessup and Reuben Finighan, would like to thank Belinda Hill, Senior Engineer at the City of Adelaide, for her leadership and enthusiastic support for the project. She provided timely monthly data and related information for this re-port, and extended the length of the trial in order to strengthen the evaluation of key per-formance parameters.
Finally, the author would like to thank Natural Resources Canada for additional support al-lowing the author to extend analysis in all the LightSavers trials. The LightSavers program was founded by the Toronto Atmospheric Fund. LightSavers is a registered mark of the To-ronto Atmospheric Fund, licensed to The Climate Group for use in the United States and elsewhere outside of Canada.
2
Executive Summary
For the period May 2010 - March 2012, the City of Adelaide tested single product LED lumi-naires along a pedestrian pathway located in Park 2 and compared them with baseline metal halide lamps previously employed in the same location. City of Adelaide staff report that overall the LED luminaire performed well, with no failures. Here is a summary of the results:
1. Illuminance. The LED luminaire provided illuminance four times greater than the illu-minance produced by the metal halide luminaire. At the beginning of the trial, the City opted for a higher illumination LED product in order to improve public safety in the park at night.
2. Correlated color temperature (CCT). There was a minor shift in CCT of the LED product over the initial 15 months of the trial, less than five percent. For the LED lumi-naire, this amounted to less than three percent on an annualized basis.
3. Energy. Despite its much greater brightness, the LED luminaire reduced electricity use compared with the baseline metal halide luminaire by approximately 18 percent.
4. Luminaire target area system effectiveness. The LED luminaire was significantly more effective at directing light to the surface of the pedestrian path. Indeed, the LED luminaire used five times less energy to deliver a unit of average illuminance to the surface, compared with the metal halide luminaire.
5. Lumen maintenance. For the purpose of this trial and study, we assumed a lifetime of 50,000 hours for the the LED product tested. Thus, lumen depreciation exceeding 2.8 percent on an annualized basis, net of luminaire dirt depreciation (LDD), would be less desirable than a value in the range of 2.8 percent or less. The lumen output of the LED luminaire declined by five percent on an annualized basis over 19-months, after an ini-tial burn in period of 1,000 hours, only a fair result.
In conclusion, the LED luminaires provided five times more illumination of Park 2’s pedes-trian pathway while still reducing electricity consumption by approximately 18 percent. Meanwhile, colour temperature shift of the LED luminaires was less than three percent.
The LED luminaire’s lumen depreciation on an annualized basis was five percent, taking into account dirt depreciation. Lumen depreciation in the range of 2.8 percent or less would have been desirable, performance indicative of a product lifetime of 50,000 hours defined by a decline in lumen output of 70 percent (L70). However, it should be noted that the IES TM-21 Working Group indicated in its report published in August 2011, that a minimum of 10,000 hours of testing after a 1,000 hour burn in period would be necessary to make any predictive assessment of LED luminaire products. Hence, the lumen maintenance results from trials such as this one are useful primarily in comparing multiple LED products with one another.
In terms of next steps, LightSavers recommends that as Adelaide proceeds with scale-up of its 4,800 public lights to LED technology, thorough lumen maintenance reports based on IES LM80 and TM21 be incorporated into the City’s procurement process.
Finally, LightSavers suggests the City explore the possible neighborhood acceptance of il-lumination levels closer to the Australian/New Zealand standard for P1 classification. The LED trial was substantially over lit relative to this standard, hence, the energy savings real-ized were the lowest among all of the LightSavers city trials.
3

Background
With 1.3 million residents, Adelaide is South Australia’s largest city and the fifth larg-est in Australia. Like the other major cities of Australia, Adelaide’s growth has been concentrated along the coast, with sprawling suburbs surrounding a central metro-politan region. Although electricity demand has fallen across Australia in recent years, per capita emissions remain among the highest in the world at around 20 ton-nes per year. South Australia’s leadership in wind energy (>20% contribution) has significantly reduced emissions intensity, however there is a continuing need to im-prove energy efficiency across all sectors to meet carbon reduction targets.
The central council district of Adelaide, known as the City of Adelaide, is home to ap-proximately 20,000 citizens. Population growth, with the potential for increased en-ergy demand and CO2 emissions (1.2 million tonnes in 2010) motivated the Adelaide City Council to develop and release its Strategic Plan 2012-2016, the Energy Man-agement Action Plan, and the Go Green with Public Lighting strategy. These plans have mandated measures to reduce Council’s energy use by 15 percent by 2014/15 from 2009/10 levels.
Public lighting currently accounts for 20 percent of the municipality’s and 2,600 ton-nes of CO2 emission annually. By 2020, Council plans to replace all of the City’s 4,800 public lights with LED technology. This will reduce electricity use from lighting by 50 percent and carbon emissions by 1,300 tonnes of CO2 per annum.
4

The City has started retrofitting the outdoor signs at municipal buildings, such as exit signs, with LED lights, and has completed replacing all traffic lights with LEDs, a combined reduction of nearly 600 tonnes CO2 annually. In addition to undertaking LightSavers trials, the Council has also begun replacing 10 percent of its public light-ing with LED technology.
The LightSavers Park 2 LED Trial
The primary aim of the LightSavers Adelaide Park 2 trial in the northern part of the city was to assess the quality and performance of a single LED luminaire product over a one-year period or more under local effects of the environment, including weather, seasonal changes, dust, grime, etc., in comparison to the incumbent metal halide (MH) luminaires now in use along Park 2’s pathways. Park 2 contains several sporting facilities, a large Aquatic Center that services the city, as well as open spaces with pedestrian pathways. The City of Adelaide owns the park and all lighting fixtures within the park.
Here is an overall summary of the trial:
• The pedestrian pathway has been illuminated by Louis Poulsen Arbiter metal halide lamps operating approximately 4,000 hours annually;
• The pole height is 3.5 meters;
• The distance between poles is 22 meters;
• Due to concerns about the potential for crime in the area, the park falls under the highest lighting standard sub-category found under AS/NZS 1158.3 for park pathways, namely P1. The P1 standard requires a minimum average horizontal illuminance of 7 lux, a minimum point horizontal illuminance of 2 lux.
The Monitoring Protocol and Methodology
The trial site in Park 2 is located along a pedestrian pathway in the middle of the park that runs past the Aquatic Center and connects two larger roads. This location was chosen because the path is flat and straight, increasing measurement consis-tency, and the lighting fixtures and poles are new, and hence exhibit no damage. Lit-tle ambient light impacts the path following the nightly closure of the Aquatic Com-plex at 10 pm, though light trespass is a concern at one end of the path from vehi-cles and adjacent streetlights. An additional obstacle to measurement accuracy, tree overgrowth along this path, was identified and overgrowth trimmed prior to the onset of the trial. Measurements were taken past 10 pm at a location that minimizes the light trespass from nearby roads.
5

FIGURE 1: Trial sampling grid
To facilitate consistency with other LightSavers trials, a sampling grid was designed based on IES RP-8 guidelines (see Figure 1 above). The green points represent measurement locations across one luminaire cycle, and lead to similar measure-ments along the centre of the pathway to those found for horizontal illuminance in the AS/NZS 1158.2 standards applicable for Park 2. One grid is used per product, i.e., one selected luminaire cycle is consistently measured throughout the trial for both the baseline and the LED luminaires.
City of Adelaide staff adopted the following protocol in implementing the trial.
1. Installation. An existing group of post-top luminaires designated as the base-line was cleaned and relamped with new Louis Poulsen Mini Orbiter MH lamps as per normal maintenance procedures. Meanwhile, 18 new post-top LED luminaires were installed by City of Adelaide staff on the site by May 2010.
2. Burn-in period and measurements. The baseline lamps and LED luminaires were “burned-in” for approximately 1,000 hours over May to August 2010. hence, for the purposes of this report, the first set of measurements were used starting in August 2010 after the initial burn-in period. The following initial set of measurements were taken for both baseline and LED luminaires:
a. Voltage and amperage,b. Photopic illuminance,c. Scotopic illuminance,d. Scotopic/photopic ratio,e. Correlated color temperature (CCT),f. Ambient temperature.
6

The monitoring team noted date, time, weather, and site conditions when they took measurements.
3. Power measurements. Spot voltage and amperage measurements of the baseline group and the LED luminaire group(s) luminaires were taken, from which apparent power was calculated. Power factor was not measured.
4. Illuminance measurements. Both photopic and scotopic illuminance readings were taken using the Solar Light SL-3101 radiometer, equipped with photopic and scotopic detectors that conform to CIE spectral luminous efficiency curves. The equipment was calibrated to the U.S. National Institute of Stan-dards and Technology (NIST) and has an accuracy of ±5 percent according to the manufacturer. The illuminance and CCT measurements were taken with the equipment placed on the pavement surface, facing the light source. The large volume of measurements taken over a long period of time and averaged together would be expected to reduce uncertainty stemming from the ±5 per-cent accuracy band. Vertical illuminance measurements were not taken.
Since the error band associated with the light meter is ±5 percent, the trial was designed to maximize precision and reduce potential errors through re-peated measurements over a long period of time. While there are no certain-ties when using statistical analysis, we believe the results described in the re-port can be interpreted with fair confidence due to the large volume of the sample data.
Photopic illuminance is used in conventional measures of light reaching the road and is the type of value specified in Australian standards. Scotopic illu-minance measures the efficacy of the eye’s peripheral vision under low light conditions at nighttime. White light LEDs, with a greater blue component in their spectrum than many conventional lighting products, yield significantly higher scotopic values.
In the Park 2 trial, however, the baseline MH luminaire already produces rela-tively white light compared to conventional light sources such as high pres-sure sodium lamps. As such, it was expected that the ratio of photopic to sco-topic light would be relatively similar for both the MH luminaire and the LED product.
5. Correlated color temperature (CCT). CCT was measured using the Konica Minolta CL-200 Chroma Meter and were taken twice, a baseline measure-ment in May 2010 and final measurement in September 2011, 15 months later. The meter has an accuracy of ±2 percent according to the manufacturer.
6. Ambient temperature. Ambient temperature measurements were taken along-side colour temperature and illuminance measurements, using City of Ade-laide equipment.
7

7. Periodic testing. Illuminance measurements were taken and recorded accord-ingly at random monthly intervals over 22 months, from May 2010 - March 2012. For purposes of the foregoing analysis, the initial 1,000 hours of data or three months were omitted, due to the high volatility of lumen output that typi-cally characterizes brand new LED devices.
8. Dirt depreciation test. In order to assess the impact of luminaire dirt deprecia-tion (LDD) on lumen maintenance, luminaires in the trial area were washed after one year of the trial. Two complete sets of illuminance readings were taken before and after washing the luminaires, to yield an approximate LDD for each group.
9. Lumen maintenance. LED streetlight luminaire manufacturers claim their products will typically maintain lumen output at 70 percent or above (L70) their original output for 50,000 hours or more. It is challenging to evaluate such claims in a real world trial. The Illuminating Engineering Society of North America (IESNA) TM-21 Working Group, during the course of its evaluation of 40 sets of laboratory data on LED light source lumen maintenance over 6,000 hours or more, concluded that lumen depreciation can change in various ways that is difficult to model or predict, especially during the first 1,000 hours of operation when rapid variations have been observed.
Ideally, in order to have predictive value, a field trial should be 10,000 hours or more, i.e., three years, with the last 5,000 hours yielding the most consistent
8

and reliable information. While ideal, such a trial is not practicable in a mu-nicipal context given limited resources, as well as the need to make procure-ment decisions in a shorter time frame. In this trial, data was collected ap-proximately monthly over a period of 19 months, or 6,300 hours. The lumen maintenance results from the trial provide a useful snapshot of how the LED product performed relative to baseline during this period. However, the results should not be used to predict how this product will perform in the future.
Results
Illuminance comparisons
The results reported below represent photopic measurements taken over the trial pe-riod and averaged together. The illumination produced by the LED product average four times greater than the illumination produced by the baseline metal halide prod-uct. As noted above, due to security and crime concerns, a relatively high wattage LED product was selected for the site in order to ensure the public would feel safe in the park with the new lighting.
Correlated color temperature (CCT)
Significant changes in color temperature of the illumination produced by LED lumi-naires over time may indicate problems stemming from degradation of the compo-nents of the LED device, especially the materials that encapsulate the LED source.
GRAPH 1: Adelaide Park 2 Illuminance
0
7.5
15.0
22.5
30.0
26.0
6.4
MH Baseline ADE-1
9
Aver
age I
llum
inan
ce o
ver t
rial p
erio
d ( L
ux)
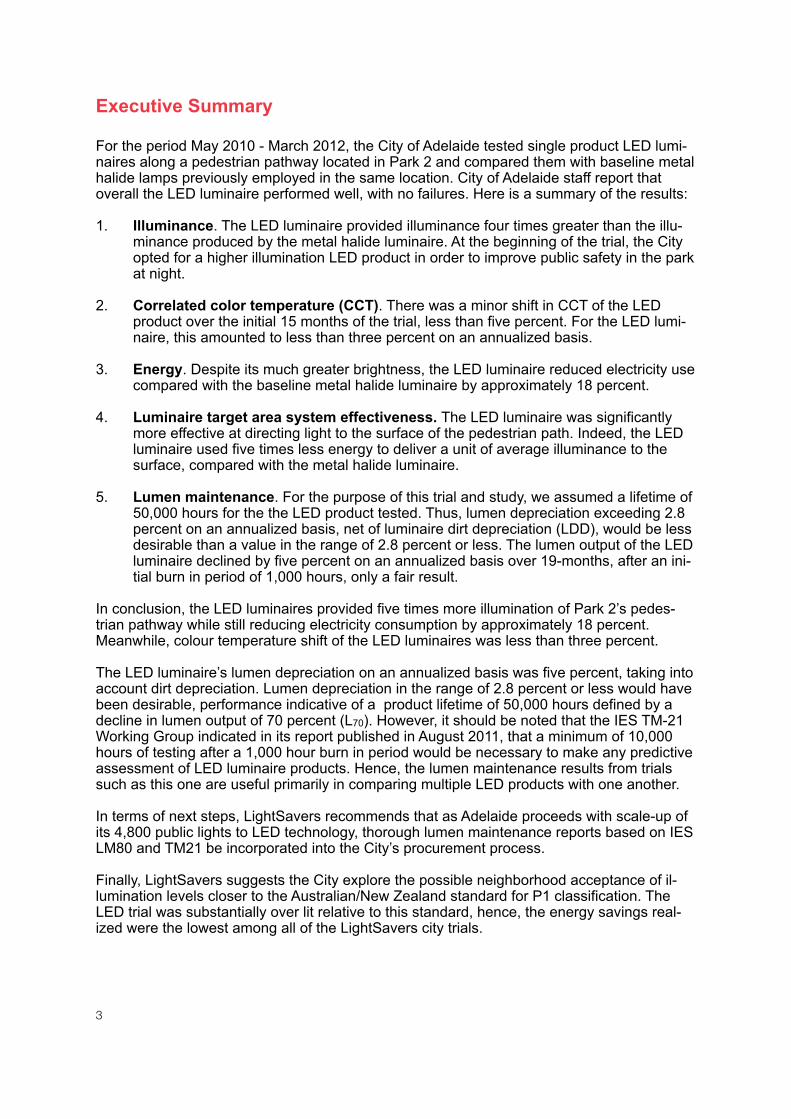
As the Table 2 below indicates, differences in measured CCT ratings for the metal halide and LED products changed in the range of five percent over the first 15 months. On an annualized basis, the LED luminaire shifted in colour by -3.9 percent. Given the ±2 percent accuracy of the meter, such relative change could have been less than two percent or greater than five percent.
Product Reference
Measured CCT Aug-2010 (Kelvin)
Measured CCT Aug-2011 (Kelvin)
% Measured Change
% Measured Change
Annualized
MH Baseline 3356 3174 -5.42% -4.34%
ADE-1 6672 6343 -4.93% -3.94%
Energy savings
Even though the LED product produced significantly higher illumination than the metal halide baseline lamp, savings of 18.4 percent were achieved. See Table 2.
Product Reference
Measured Energy (Watts)
MH baseline 103.0
ADE-1 84.0
Luminaire target area system effectiveness
A key advantage that LED luminaires hold over conventional HID luminaires is that the light they produce is more directional. Thus, more of the light produced by the LED luminaire is directed to the surface where it is needed. However, there does not currently exist a standard lighting metric for measuring how effective luminaires are projecting light on a specific surface in a field trial.
In the LightSavers trials we developed a “target area system effectiveness” metric that is calculated for each LED luminaire simply by dividing its average photopic illu-minance measured on a sampling grid by its apparent power value. The calculated value of lumens per watt is then indexed to the comparable baseline value, which is normalized to the value 1.0. This metric does not take into account uniformity.
TABLE 1: Summary of color temperature results
TABLE 2: Summary of energy use
10

Ascertaining how much apparent power it takes for a luminaire to deliver its light to a surface grid compared with a baseline product can assist lighting asset managers in understanding the directional effectiveness of different LED luminaire products at il-luminating a surface, compared with conventional lamps such that rely more on lu-minaire lens optics to direct and shape their light output. The figures below charac-terize this metric and compares the LED luminaire with the baseline.
Figure 2 above shows that the LED luminaire was able to deliver almost five times more illuminance per watt on Park 2’s pedestrian pathway than the baseline metal halide lamp .
Lumen maintenance
A key purpose of the LightSavers trial was to determine how the LED luminaires per-formed over a period of time. For the purposes of this study, lumen maintenance fac-tors affecting LED luminaires can be divided into two groups:
• Factors that can be reversed or recovered through maintenance, such as lumi-naire cleaning to remove dust and grime from its lens;
• Factors that cannot be reversed or recovered, such as the gradual fading of the LED device’s lumen output or dramatic changes in its correlated color tempera-ture (CCT).
In the first category, luminaire dirt depreciation (LDD) is the most significant factor. It results from the accumulation of dust and grime on the luminaire lens over time. This varies significantly from one locale, climate, or season to another. Air pollution is ob-viously an important variable. Also, an electrostatic charge on the plastic lens of a LED luminaire attracts particles floating in the air. The dryer the environment, the higher the charge and attraction of particles to the lens. Conversely, higher humidity reduces the static charge and particle attraction. Finally, design of the LED luminaire
FIGURE 2: Target area system effectiveness indexed to the baseline MH lamp (normalized value = 1.0 lumen/watt)
11
B
Baseline MH1.0 l/watt
ADE-14.9 l/watt

affects dust buildup. Some manufacturers incorporate self-washing features into their luminaire design, so that precipitation removes dust that has adhered to the lumi-naire lens. The effectiveness of such designs varies from one product to another.
Note that LDD is not linear. Dust buildup on a newly installed luminaire may be rapid at the start, depending on humidity and temperature, and then decline in rate as the amount of dirt on the luminaire lens reaches a level that dampens its static charge.
City of Adelaide staff washed the metal halide baseline and LED luminaire 16 months after the start of the trial, on September 29, 2011, after taking measurements three days earlier on September 26, 2011. As a result of this procedure, it was de-termined that dirt and dust buildup on the luminaire reduced photopic light output by about 0.86% over the initial 16 months of the trial or an annualized basis of 0.55%. Hence, the LDD for this site on an annual basis was 0.995 over the trial period.
In the second category of lumen maintenance factors, LED devices, unlike metal hal-ide lamps, do not typically burn out. Instead, the light they produce gradually fades over a long period of time in a non-linear fashion. As noted above, the end of lifetime of a LED device occurs when its light output declines to 70 percent of its original out-put. Since the luminaires in Park 2 operate approximately 4,000 hours annually, a LED luminaire rated at 50,000 hours of operation would reach L70 at 12-1/2 years after its initial start of operation, implying a calculated rate of approximately 2.8 per-cent depreciation per annum on an annualized basis over the lifetime of the product.
For the purpose of this trial and study, we assume a lifetime of 50,000 hours for the the LED product tested. Thus, lumen depreciation significantly exceeding 2.8 percent on an annualized basis, net of LDD, would be less desirable than a value in the range of 2.8 percent or less.
It should be noted again, in respect of the IESNA’s TM-21 Working Group’s recent findings, that the lumen depreciation metric for the first year or two has no predictive value. However, comparing first-year lumen output performance of multiple products in multiple trials can offer insights that enable lighting asset managers in a practical way to better differentiate products from one another.
The graph below shows the monthly averaged photopic illuminance values (lux) for the MH baseline luminaire (blue line) and LED luminaire (red line) over a period of 19 months. The black lines for each luminaire show each set of data subjected to Ex-cel’s exponential trendline function, which uses the LOGEST function to generate an exponential least squares fit of the individual observed values to a curved line. (This is the equivalent of performing an Excel LINEST linear least squares fit on the loga-rithms of the observed values, the slope of the generated straight line equalling the logarithm of the depreciation rate of the exponential fit.) The graphs are visual repre-sentations of illuminance measurements throughout the trial, hence the results of washing of the luminaires to remove dust and dirt, done 16 months after the trial be-gan, are reflected in the graphs.
12

Table 3 below summarizes the lumen maintenance findings from the trial. Taking into account the removal of dust and dirt from the luminaires lenses 16 months after the start of the trial, light output from the LED luminaire declined by five percent on an annualized basis, only a fair result.
During the hot summer months of November to January, when temperatures rose to 15°C and 28°C respectively, illuminance measurements taken on those days do not appear to have been affected.
Trial Reference
Annualized Exponential
Trendline (Excel)1
Lamp Lumen Depreciation
(LLD)
Luminaire Dirt Depreciation
Factor (LDD)
MH Baseline -11.9% 0.881 n.a.
ADE-1 -5.0% 0.950 0.976
1Net of washing luminaires September 25, 2011
0
6
12
18
24
30
Aug-02 Nov-17 Jan-27 May-02 Sep-29 Jan-16
GRAPH 2: Baseline MH and ADE-1 Lumen Maintenance
MH LED
TABLE 3: Summary of lumen maintenance results
13
Lum
en m
ainte
nanc
e ove
r tria
l per
iod
( Lux
)

Summary
City of Adelaide staff report that overall the LED luminaire performed well, with no failures. The LED luminaires provided five times more illumination of Park 2’s pedes-trian pathway while still reducing electricity consumption by approximately 18 per-cent. Meanwhile, colour temperature shift of the LED luminaires was less than three percent on an annualized basis after the first year of the trial.
The LED luminaire’s lumen depreciation on an annualized basis over the course of the trial was five percent, taking into account dirt deprecation after 16 months of the trial, greater than expected. As noted above, lumen depreciation in the range of 2.8 percent or less would have been desirable, performance indicative of a product life-time of 50,000 hours defined by a decline in lumen output of 70 percent (L70).
However, it should be noted that the IES TM-21 Working Group indicated in its report published in August 2011, that a minimum of 10,000 hours of testing after a 1,000 hour burn in period would be necessary to make any predictive assessment of LED luminaire products. Hence, the lumen maintenance results from trials such as this one are useful primarily in comparing multiple LED products with one another, using indicative, rather than predictive results.
Among the LightSavers trials, there was one other trial testing pedestrian pathway LED luminaires, in New York City’s Central Park. The post top luminaires there are of heritage design. In term of lumen maintenance among five LED products tested, an-nualized lumen maintenance performance (net of dirt depreciation) ranged from -6.8 percent to +8.8 percent. So the lumen maintenance performance indicated in the Adelaide LED trial fell into the upper range of values recorded in New York.
In terms of next steps, LightSavers recommends that as Adelaide proceeds with scale-up of its 4,800 public lights to LED technology, that thorough lumen mainte-nance reports based on IES LM80 and TM21 recommended practices be incorpo-rated into the City’s procurement process.
Also, LightSavers suggests that the City consult with local neighborhood residents to determine whether a lower level of illumination on the pedestrian pathways closer to the Australian/New Zealand standard for P1 classification might be acceptable. The energy savings in this trial were the lowest among all the LightSavers cities, but en-ergy savings could be significantly increased if the illuminance standard for P1 was followed. In New York, for instance, as a result of the LED trial there, authorities de-cided to accept illumination levels closer to the IES standard for pedestrian path-ways, which had been substantially over lit since a well publicized crime occurred there some years ago. Energy savings close to 65 - 70 percent have been achieved, as a result.
14

![LED RETROFIT STRATEGIES Retrofitting Education Buildings · Convert traditional fixtures with a LED retrofit module or LED kit (includes tubes and LED driver) [+] Pros: This approach](https://static.documents.pub/doc/80x56/602d87a30c499d6ec84ad164/led-retrofit-strategies-retrofitting-education-buildings-convert-traditional-fixtures.jpg)


