THIS SUBMISSION SHOULD BE CONSIDERED FOR THE WILLIAM C. CARTER AWARD. ADEPTS: Adaptive Intrusion Containment and Response using Attack Graphs in an E-Commerce Environment Yu-Sung Wu, Bingrui Foo, Blake Matheny, Tyler Olsen, Saurabh Bagchi School of Electrical & Computer Engineering, Purdue University 465 Northwestern Avenue, West Lafayette, IN 47907. Email: {yswu,foob,bmatheny,olsent,sbagchi}@purdue.edu Abstract Distributed e-commerce systems are suitable targets for malicious attacks because of the potential financial impact. Intrusion detection in such systems has been an active area of research. Once an intrusion is detected, it is important to contain the effect of the intrusion to some parts of the system while allowing the other parts to continue to provide service. It is also important to take preventive or reactive response to reduce the likelihood of the system being compromised through a future attack. In this paper, we present the design and implementation of an Adaptive Intrusion Tolerant System, ADEPTS, for automatically containing and responding to intrusions in a distributed e-commerce system. We use a directed acyclic graph (DAG) of intrusion goals as the underlying representation in the system. In an I-DAG, the nodes are sub-goals of an attack and to reach a particular node, goals corresponding to its child nodes have to be achieved first. We assume an intrusion detection framework which provides alerts to ADEPTS. In response, a parallel algorithm is executed to compute the likelihood that one or more goals in the DAG have been achieved. Next, a response measure computation algorithm is executed to determine the appropriate response action. There is also a feedback mechanism which estimates the success or failure of a deployed response and uses that in adjusting the system weights to guide future choices. ADEPTS is implemented on a distributed e-commerce system that comprises services including, web server, application server, database server, directory server. Alerts are simulated corresponding to different attack types, the algorithms executed and response actions deployed. The experiments bring out the latency of the infrastructure, and the effectiveness in dealing with failed responses through escalation compared to statically mapped Intrusion Response Systems (IRS). Keywords: automated intrusion response, intrusion containment, e-commerce system, simulated attacks, response latency and effectiveness.
Transcript
THIS SUBMISSION SHOULD BE CONSIDERED FOR THE WILLIAM C. CARTER AWARD.
ADEPTS: Adaptive Intrusion Containment and Response using Attack Graphs in an E-Commerce Environment
1 Introduction Electronic commerce, or e-commerce, has been touted as the next wave in the Internet revolution. The
definitions of e-commerce are many and varied, but almost all of them capture the following key features –
accessible service over the internet, near 24X7 availability, high degree of automation, high degree of
customizability, always on, on-demand service. The e-commerce market has seen explosive growth through the
heady days of the internet boom to stand at $95.7 billion in 2003. Forrester Research predicts the growth is going
to continue at a healthy rate of 19% compound annual growth rate over the next five years creating a total of 63
million US online shopping households in 2008 which spend $229.9 billion annually [5]. The huge financial
stakes involved in e-commerce make the infrastructure supporting e-commerce prime candidates for computer
security attacks. This has long led to interest in academic research and industrial research communities and
private enterprises into securing e-commerce systems. Consider the plethora of text books that exist on the subject
([1],[2],[3],[4]). A recent focus has been intrusion detection in e-commerce systems by analyzing the signatures of
incoming packets and either matching them against known attack patterns (misuse based signatures), or against
expected patterns (anomaly based signatures).
In order to meet the challenges of always-on, on-demand service availability, an e-commerce system needs to
be resilient to security attacks. Resilience must include both intrusion detection and intrusion response. Compared
to the problem of detection, automated response has received far less research attention. This has typically been
considered the domain of system administrators to manually "patch" the system in response to detected attacks.
However, as networked e-commerce services become ubiquitous and they are often placed in environments
difficult to reach for human intervention, automated tools for intrusion response gain importance. There is another
phase that may aid in achieving the goal of high availability – containment. This denotes restricting the effect of
the intrusion to a subset of the entire services operational on the e-commerce platform. This may allow users
restricted access to and use of the services, e.g. browsing a store catalog and checking on a previously placed
order may be available, while placing new orders may not be. Containment also simplifies the task of recovery
since localized, rather than distributed recovery, can be used only on the affected components. A challenge to the
containment process is the requirement that the existing interactions between e-commerce system components not
3
be substantially altered, such as interactions passing through additional checks, intermediaries, or executed over
slower channels.
In this paper, we present the design and implementation of an Adaptive Intrusion Tolerant System, ADEPTS,
for containing and responding to intrusions in a distributed e-commerce system. ADEPTS uses an Intrusion-
Directed Acyclic Graph (I-DAG) as the underlying representation for events that it processes. In an I-DAG, each
node represents an intermediate or ultimate goal of an attack and can be associated with an alert from the intrusion
detection framework in the system, which has been described in a previous paper [6]. A goal represented in a
node can be achieved only if the goals of its children nodes are achieved. ADEPTS takes intrusion alerts from the
detection framework, and can handle multiple concurrent alerts. On receiving the alerts, it calculates a
Compromised Confidence Index (CCI) for each node, which indicates the confidence that the goal corresponding
to the node has been achieved. It then classifies the nodes in the I-DAG into four bins (from strong candidate to
non-candidate) depending on how appropriate it is to trigger a response corresponding to the node. Second,
ADEPTS computes a Response Index (RI) for each response in each candidate node which indicates the confidence
that the particular response action is suitable for the specific attack. The RI depends on four factors – the
confidence in the detector, the candidate class the node was put in, the disruptivity of the response to legitimate
users, and the effectiveness of the response from past experience. These four factors are carefully chosen to take
the trade-offs in deciding on a response action into account. For example, a drastic response such as shutting
down a directory lookup service may be very effective, but is also likely to be very disruptive to normal users.
There is a feedback mechanism in the system which adjusts the Effectiveness Index (EI) of each response based
on whether the response was successful in preventing further attacks or spread of the current attack. The algorithm
uses aggregation to determine if a new alert represents a failure of a previously deployed response, or is a
completely new instance of an attack.
The design of ADEPTS is realized in an implementation which provides intrusion containment and response
services to a large distributed e-commerce system. Alerts corresponding to different types of attacks are simulated
in the system. The measurements bring out the latency of the system measured from the time the alert is seen by
the system to the time the response is deployed. ADEPTS can parallelize the process to determine the appropriate
4
response if concurrency is available through threads. We perform experiments to measure the speedup achieved
with the number of concurrent threads as the number of concurrent alerts and the size of the I-DAG increase.
The paper breaks new ground in the following ways:
1. ADEPTS is the first system, to the best of our knowledge, that provides a structured methodology for
containing intrusions in a distributed system. It is also the first system to aggregate the factors of severity of a
response, its effectiveness, and the possibility of escalation to determine the appropriate set of responses.
2. ADEPTS can handle multiple concurrent alerts, uncertainty in detection, and escalation due to failed response
actions. Each of these is of critical importance in an intrusion tolerance system applied to a real-world system.
3. ADEPTS is implemented and demonstrated on a large real-world e-commerce system. The system is made the
target of different kinds of attacks and the system performance measured under the workload.
However, the work presented here does not have as its goal any of the following: intrusion detection for an e-
commerce system, methodology for structuring or composing an e-commerce system, or proposing novel
response actions for specific services in an e-commerce system.
The rest of the paper is organized as follows. Section 2 refers to related research. Section 3 presents the
architecture of ADEPTS and describes its components. Section 4 provides an instantiation of the architecture and
presents the specific configuration of the system being evaluated in this paper. Section 5 describes the
experiments and the results. Section 6 concludes the paper with mention of future work.
2 Related Research The devastating impact of computer security attacks to today’s electronic world has spurred enormous interest
in intrusion detection research, both from academic and commercial quarters. There have been hundreds of
intrusion detection systems (IDS) available as research prototypes to high-priced enterprise systems and anywhere
in between. However, in order to guarantee the requirement for continuous availability of the services, it is also
important to consider how the system reacts once the intrusion is detected. The large majority of current IDSs
stops with flagging alarms and relies on manual response by the security administrator or system administrator.
This results in delays between the detection of the intrusion and the response which may range from minutes to
months. The delay has important consequences on the chance of success of the attack which was explored by
Cohen using simulated attack scenarios [8]. The results show that given a ten hour delay from detection, 80% of
5
the attacks succeed and given thirty hours, almost all the attacks succeed in their goal irrespective of the skill level
of the defending system’s administrator. This motivates the work in intrusion response systems (IRS). A majority
of the IRSs provide a set of preprogrammed responses that the administrator can choose from in initiating a
response. This may reduce the time gap between detection and response, but still leaves a potentially unbounded
window of vulnerability. The holy grail is an IRS that can respond to an attack automatically.
Static IRS. The majority of IRSs that employ automated responses provide a static mapping between type of
attack and the corresponding response action ([28], see [17] for tabulation of current IRSs). Snort provides a
Flexible Response add-on [26], in which a malicious connection can be automatically terminated. This is not
inserted in the path of the data being processed by the end-point and it is possible that malicious packets hit the
victim machines before the malicious connections are torn down. Snort-inline [27] provides the ability to drop
malicious packets before it can reach the endpoints by performing inline scanning through iptables. The only
response action considered in either case is connection termination. The static IRSs limit the applicability of the
system to well-known and well-understood attacks. If the initial response action does not succeed, there is no in-
built mechanism to learn from the failure, or, through other means, execute a different response. The lack of a
feedback path in the system makes it unsuitable for the dynamic environments of real-world systems. There is a
comparatively tiny volume of work on adaptive IRSs which is reviewed next.
Adaptive IRS. In [13], the authors propose a network model that allows an IRS to evaluate the effect of a
response on the network services. It creates a dependency tree of entities in the system and calculates the penalty
to the system due to a response directed at an entity, such as reconfiguring the firewall. Then, at each step of the
response process, the system chooses in a greedy manner the response that minimizes the penalty. There are some
studies which present taxonomy of offensive and defensive responses to aid in selection of coherent responses in
an automated response system ([10],[14],[15]). While the taxonomy provides a method for classifying available
responses, they do not show how that can help in automatically choosing appropriate responses.
Cooperating Security Managers (CSM) [9] is a distributed and host-based intrusion detection and response
system. CSM proactively detects intrusions and reactively responds to them using the Fisch DC&A taxonomy
[10] to classify the attack as well as the suspicion level assigned to the user by the intrusion detection system.
Depending on the suspicion level, CSM employs one of eight different response sets. CSM uses the suspicion
6
level of the user as the only determining factor in the choice of response. A second system called EMERALD
([11],[12]) is a distributed intrusion detection and response system that is meant for large scale heterogeneous
computing environments. The EMERALD architecture consists of hierarchical collections of monitors. A monitor
provides localized real-time analysis of infrastructure elements and network services and may interact with its
environment passively (reading activity logs or network packets) or actively (via probing that supplements normal
event gathering). Each monitor includes an instance of the EMERALD resolver, a countermeasure decision
engine capable of fusing the alerts from its associated analysis engines and invoking response handlers to counter
malicious activity. EMERALD uses two factors in determining the response – the amount of evidence furnished
to support the claim of intrusion and the severity of the response. In CSM and EMERALD, detection is the main
focus of the work and response considered as a side-issue. Neither system uses record of the past performance of
the intrusion detection system as measured by the incidence of false positives and false negatives. Neither keeps
track of the success or failure of the deployed response to use that to temper future responses. Importantly, neither
system provides a framework or mechanism for incorporating these factors in the automated response
determination.
The work that is most closely related to ours is the Adaptive, Agent-based Intrusion Response System
(AAIRS) ([16][17]). In AAIRS, multiple IDSs monitor a computer system and generate intrusion alarms. It
generates an attack confidence metric based on historical accuracy of the IDSs and passes it to an Analysis Agent.
Their decision algorithm for determining if an alarm corresponds to a new attack or an existing attack is adopted
by us in ADEPTS. The Analysis agent analyzes an incident and generates an abstract course of action to resolve the
incident, using the Response Taxonomy agent from [14] to classify the attack and to determine a response goal.
The Analysis agent passes the selected course of action to the Tactics agent, which decomposes the abstract
course of action into very specific actions and then invokes the appropriate components of the Response Toolkit.
The work provides a good framework on which the IRS can be built. However, it does not provide any of the
system-level techniques and algorithms that will be required for the AAIRS to work in practice. It leaves many
unanswered questions, including, what is the algorithm to determine a sequence of response actions to an incident,
how does the system measure the success of previous responses, or how are multiple concurrent attacks handled.
7
There is some previous work on protecting distributed systems against flooding based distributed denial of
service (DDoS) attacks in an automated manner ([18][19],[20],[21]). The method used is a two step one – in the
first the router traffic is analyzed to detect the physical interfaces through which the DDoS traffic enters the
network, followed by installing packet filters or rate limiting rules at the appropriate routers. This body of work
targets only prevention and does not handle cases when the prevention fails. The solutions are specific to DDoS
attacks, and both the steps are often human labor intensive.
Fault trees have been used extensively in root cause analysis in fault tolerant systems (see [22] for pointers).
They have also been used to a limited extent in secure system design – in modeling how a security violation
occurs ([23],[25]), or in evolving requirements for a secure application [24]. We use an attack graph
representation with nodes as intermediate goals since the same intermediate goals show up in several attack paths.
3 Design of ADEPTS 3.1 Intrusion DAG (I-DAG)
In ADEPTS, an Intrusion DAG, or I-DAG, is used as the underlying representation for knowledge about the
intrusions. In the I-DAG representation, each intrusion is considered to have an ultimate goal. The ultimate goal is
dissected into intermediate goals and the path to reach the ultimate goal through achieving the intermediate goals
is represented in the I-DAG. Each goal corresponds to a single node in the DAG, the ultimate goal being at the
root of the tree. These goal nodes are organized in causal order. Generally speaking, we can say that a parent node
can be achieved if any or all its children nodes are achieved. Each node stores two sets of services – a Cause
Service Set (CSS) and an Effect Service Set (ESS). The former set includes all services that may be compromised
in order to achieve the goal and the latter set includes all the services that are taken to be compromised once the
goal is achieved.
To model the notion of ‘necessary conditions’ and ‘sufficient conditions’ in the I-DAG, we introduce three
concepts: AND edges, OR edges, and Intermediate nodes. For a node X, its child nodes connected via AND edges
represents the condition that all the goals corresponding to the child nodes have to be achieved before the goal
corresponding to X can be achieved. For a node Y, its child nodes connected by OR edges represents the condition
that the goal corresponding to any one of its children has to be achieved before the goal corresponding to Y can be
achieved.
8
Figure 1: Sample I-DAG showing AND edges, OR edges and Intermediate nodes
A sample I-DAG is shown in Figure 1. Node H is connected to its
children by OR edges and therefore, H can be achieved if either goal
C or the goal D can be achieved. Node J is connected to its children F
and K by AND edges. For simplicity, we enforce that the in-edges of
each node in the DAG must be all AND edges or all OR edges. In other words, a mixture of both red and black in-
edges to a node is not permitted. In order to handle the cases where such relationships exist in a system, we
introduce the concept of Intermediate nodes. Intermediate nodes are pseudo nodes which have no goals associated
with them. The sole purpose of intermediate nodes is for intermediate Boolean expression aggregation. For
example, the intermediate node I in Fig. 1 represents the condition D Λ E. Therefore, the evaluation at L is H V
(D Λ E).
3.2 Overall Process Flow The I-DAG models the known paths an attacker can traverse to reach certain goals that adversely affect our e-
commerce system. Our motive in designing this IRS is to proactively prevent an attacker from moving up the
DAG, and therefore closer to the final goals, by responding appropriately at any of the nodes in the I-DAG. Here
we give a high-level description of the process flow with the different algorithms in ADEPTS. Details of the three
phases are given in subsequent sections. When the intrusion detection framework CIDS sends an alert to ADEPTS,
the alert consists of an event identifier and a confidence value. The event identifier corresponds to a node in the I-
DAG. The confidence value is a real number ∈ [0, 1] and indicates the detection system's confidence in the
validity of the alert. One or more alerts may enter the system at any given time, causing a new instantiation of an
appropriate I-DAG.
Figure 2. Overall process flow in ADEPTS. The four boxes (apart from CIDS) are part of the
system described here. The first two boxes are described in Section 3.3, the next in Section 3.4, and the last in
Section 3.5. As an alert comes into ADEPTS, the node in the
I-DAG corresponding to the alert is found and its
confidence value is updated with the alert’s
BA C D E
F G H I
J
K L
OR Edge AND Edge IntermediateNode
BA C D E
F G H I
J
K L
OR Edge AND Edge IntermediateNode
9
confidence. Then the CCI computation algorithm is run, which computes a set of candidate nodes where
responses may be taken. This is passed to the RI computation algorithm which calculates the Response Index for
every response of every node that the CCI algorithm flagged as possible candidates. It decides on a subset of
responses depending on the RI value computed and passes this to the Response algorithm for deploying the
responses and possibly calculating the Effectiveness Index (EI) for the responses. The I-DAG is traversed only by
the CCI computation algorithm. The process flow is shown in Figure 2.
3.3 Algorithm for Classifying Nodes as Candidates for Response: Node Classification Algorithm
3.3.1 CCI Computation Algorithm (Bottom-Up)
If a detector in the system detects an intrusion and there is a node in the I-DAG corresponding to the event,
then the confidence of the detector is assigned to the node. We define the Compromised Confidence Index (CCI)
of a node to represent the probability that a certain node has been compromised. It is computed based on the
confidence of the alert corresponding to the node and the CCI of its immediate children nodes. Mathematically,
the CCI of a node is given by CCI = f(f′(CCIi), Confidence of alarm) where CCIi correspond to the indices of the
children. The function f′ is given by max for OR-edges connecting the children to the parent, and by min for
AND-edges. The function f for our implementation is taken as the statistical mean. For nodes with no children,
their CCI will be the confidence of the detector. For nodes with no corresponding alerts, their CCI will be a
propagation of their children’s CCIs.
When new alerts are passed to this algorithm, the first step it performs is to traverse the I-DAG from bottom
up starting at the nodes for which alarms have been raised and going up to the roots. For each node traversed, the
CCI is computed. By starting the traversal only at the nodes for which alarms are flagged, we are optimizing the
algorithm for faster running time for the common case where only a small subset of the nodes in the I-DAG gets
alarms.
3.3.2 Response Set Computation Algorithm (Top-Down)
We define the Threshold of a node to represent a user-defined value such that if the CCI of the node is greater
than its Threshold, the system deduces the node has been compromised. After the algorithm has traversed to the
top of the DAG and updated the CCIs on the way, the second step is to traverse the DAG downwards starting
10
from the root nodes that were reached during the first step. While traversing down the I-DAG, each node
traversed is labeled. The possible labels are:
1. Strong Candidate (SC). A node with CCI greater than Threshold.
2. Weak Candidate (WC). A node with CCI less than or equal to Threshold, but the node is on an AND-path to
a SC node. An AND-path between source s and destination d is one where all the edges from s to d are
AND-edges.
3. Very Weak Candidate (VWC). A node with CCI less than or equal to Threshold, but the node is on an OR-
path to a SC node. An OR-path is a complement of an AND-path and has at least one edge which is not an
AND edge.
4. Non-Candidate (NC). A node that is not a SC, a WC, or a VWC node.
B C
A SC
VWC
0.70.20.30.40.2
ABCDE
0.70.20.30.40.2
ABCDE
CCI Values(from bottom-up
computation)
τ = 0.5
B C
A SC
WC
B C
A SC
VWC
D E
VWC
VWC WCVWC VWC
Figure 3. Illustration of labeling nodes as possible candidates for response during top-down algorithm
Next, the nodes are placed in a response set, indicating nodes for which some response may be initiated. The
decision to initiate a response is taken by the Response Index (RI) calculation algorithm described in Section 3.4.
There are two alternative ways in which a node can be placed in the response set: (i) It is a SC node and has no
parent node; or (ii) It is a SC, WC, or VWC node and has an immediate parent that is a NC. The motivation
behind the first class is that the node is likely to have been compromised. The motivation behind the latter class is
that the node is either likely to have been compromised or may be compromised to reach a higher up goal. If a
node in the second class does not have an immediate NC parent, it implies the response for the node is redundant
since a response for a higher up node will be taken.
3.3.3 Parallelization of algorithm
It is possible for ADEPTS to receive multiple concurrent alerts. This means that there can be multiple traversals
of the I-DAG that may or may not be independent of one another. This possibility leads to a decision to parallelize
the CCI computation and the Response Set computation algorithms. A thread pool is pre-spawned prior to alerts
11
arriving at the system. There is a shared job queue among the threads which contains the nodes that need to be
processed. An available thread from the thread pool picks up an entry from the job queue, services it and puts its
parents (for bottom-up CCI computation) or children (for top-down Response Set computation) back in the queue.
As an optimization, the thread continues to process one of the new nodes that it creates. The queue is locked by a
thread during its access. Consequently, increasing the thread pool size beyond a point gives diminishing returns
because of the context switch overhead of the threads and the additional contention for the shared lock. The
results from the experiment 1(a) in the results section shows that as the number of nodes in the DAG increases or
the number of alerts increases, a larger number of threads is favored. For each combination of the number of
nodes and alerts, it is possible to (empirically) estimate the optimal number of threads to provide the fastest
traversal. Such empirical estimates are made a priori and fed into the system. At runtime, the parallelization
algorithm picks the optimal number of threads based on the graph size and the number of alerts.
3.4 Algorithm for Determining Response: RI Computation Algorithm Each node in the I-DAG has an Effect Service Set (ESS) and each service in the effect set has 0 or more
responses associated with it. The response index (RI) is a real number ∈ (-∞, 4], used to determine the response to
be taken for a given node in the I-DAG. Every response for each node has an RI associated with it, however this
value is not calculated unless neccessary. Five measures are used to determine the RI – the CCI, the node class,
the disruptivity index (DI), the effectiveness index (EI), and the response itself. The CCI, node class, disruptivity
index(DI), and effectiveness index (EI) are all real numbers ∈ [0, 1]. For the disruptivity index, rather counter-
intuitively, the less disruptive the response, the higher is the index. For the effectiveness index, the more effective
that the given response has been in the past, the higher this value will be. The response however, falls within the
range -∞ < Response ≤ 0. The value for “Response" is determined by whether or not an action exists for the
response. Response is assigned -∞ if no action exists, or 0 otherwise. This prevents responses with no action from
being considered.
3.5 Algorithm for Feedback to Response Actions: Response Feedback Algorithm Feedback is necessary for ADEPTS to dynamically change which response actions are taken. When an attack is
detected, the response actions with the highest probability of success in containing the attack must be chosen. The
calculated RI partially depends on the Effectiveness Index (EI) for the response. Updating the EI is the primary
12
responsibility of the Response Feedback algorithm. Intuitively, EI is reduced for every detected failure of a
response action and increased for every successful deployment.
The responses to a service being compromised are classified into five categories in decreasing order of the
disruption caused to a legitimate user: (1) Remove the service functionality for all users. (2) Remove the service
functionality for a subset of users. (3) Reduce the service functionality for all users (e.g. allow database reads, but
disallow writes and executions). (4) Reduce the service functionality for a subset of users. (5) Download a patch
for the service. The responses may also be proactive, or reactive. A proactive response has the goal of preventing
a higher-level goal from being reached. In the I-DAG, this is analogous to removing the outgoing edges from a
node. A reactive response is one which tries to prevent future attacks from reaching the goal corresponding to the
node. In the I-DAG, this is analogous to removing the incoming edges of a node.
When an attack goal is achieved and a response initiated, the node in the I-DAG corresponding to that goal and
the response action taken are pushed onto a Sensitivity Queue (SensQ). The sensitivity queue keeps a history of
what attacks have been detected and the response actions taken. A 30 hour sensitivity period is used to monitor
the effectiveness of responses based on the study published in [8]. When a response action has been in the
sensitivity queue for over 30 hours, it is removed indicating the response was successful since no further attacks
of the kind were observed. The EI for the action is increased. When a response action is initiated, it is also put in
an Activation Lookup Table (ALT) indicating a response is underway. When the response action completes, it is
removed from the ALT. When the RI determination algorithm decides on a node on which to initiate a response,
the response with the highest RI value is chosen. However, if the response is already in the ALT, the response
with the next highest RI value is chosen. This is necessary because taking a response when it is already active will
achieve no effect on the system.
If a new alert comes into the system, the SensQ is searched to determine if that attack goal may have been
reached as the result of a previously failed response action. The responses examined for failure are the most recent
preventive response taken for the same node in the I-DAG, or the most recent reactive response for a child of that
node. The EI reduction for a child node is dependant on whether the arcs are OR-arcs or AND-arcs. If the child is
on an OR-arc and the parent is compromised, its EI is reduced by a lesser amount than if the child is on an AND-
13
arc. This is because an OR-child may or may not be contributory to the parent being compromised, while an
AND-child definitely is.
4 ADEPTS System 4.1 E-Commerce System
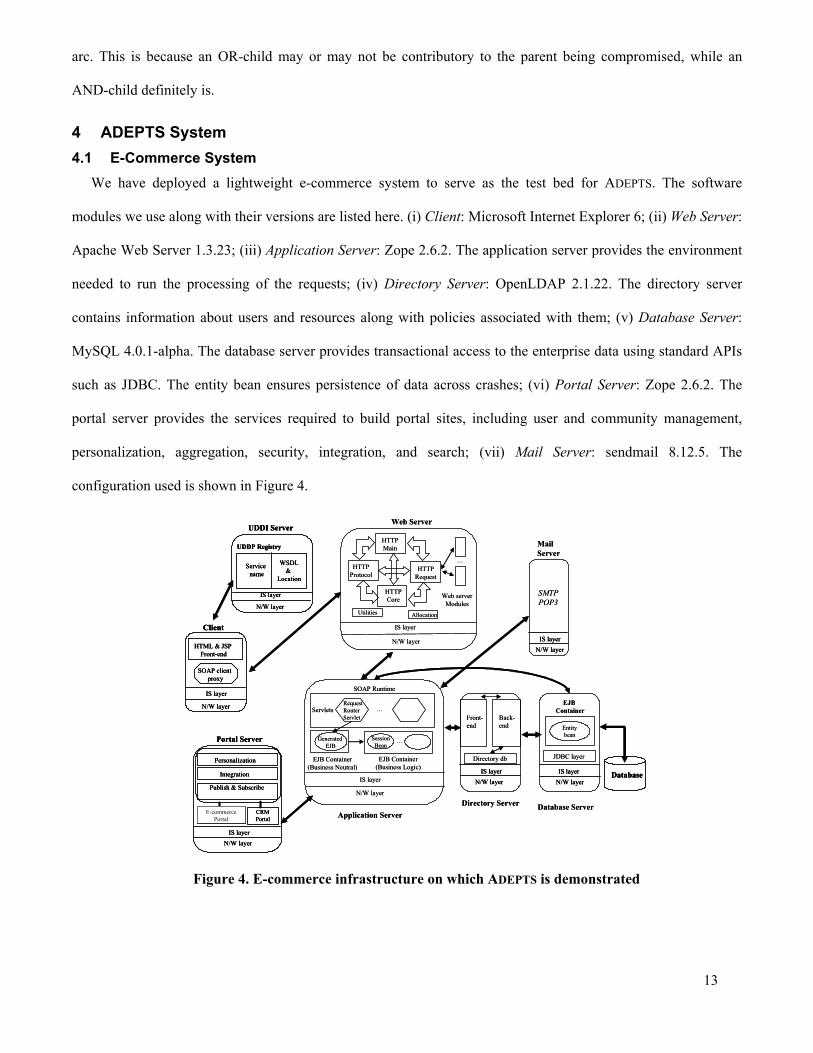
We have deployed a lightweight e-commerce system to serve as the test bed for ADEPTS. The software
modules we use along with their versions are listed here. (i) Client: Microsoft Internet Explorer 6; (ii) Web Server:
Apache Web Server 1.3.23; (iii) Application Server: Zope 2.6.2. The application server provides the environment
needed to run the processing of the requests; (iv) Directory Server: OpenLDAP 2.1.22. The directory server
contains information about users and resources along with policies associated with them; (v) Database Server:
MySQL 4.0.1-alpha. The database server provides transactional access to the enterprise data using standard APIs
such as JDBC. The entity bean ensures persistence of data across crashes; (vi) Portal Server: Zope 2.6.2. The
portal server provides the services required to build portal sites, including user and community management,
personalization, aggregation, security, integration, and search; (vii) Mail Server: sendmail 8.12.5. The
configuration used is shown in Figure 4.
Client
N/W layer
IS layer
HTML & JSP Front-end
SOAP client proxy
UDDI Server
N/W layer
IS layer
Service name
WSDL&
Location
UDDP Registry
N/W layer
IS layer
HTTPProtocol
HTTPMain
HTTPCore
HTTPRequest
Utilities Allocation
…
Web serverModules
Web Server
Application Server
N/W layer
IS layer
SOAP Runtime
…RequestRouterServlet
Servlets
Generated EJB
EJB Container(Business Neutral)
EJB Container(Business Logic)
SessionBean
…
Mail Server
N/W layerIS layer
SMTPPOP3
Database Server
N/W layerIS layer
EJB Container
Entity bean
JDBC layer
Directory Server
Directory db
Front-end
Back-end
N/W layerIS layer Database
Portal Server
N/W layerIS layer
Personalization
Integration
Publish & Subscribe
CRMPortal
E-commercePortal
Client
N/W layer
IS layer
HTML & JSP Front-end
SOAP client proxy
Client
N/W layer
IS layer
HTML & JSP Front-end
SOAP client proxy
UDDI Server
N/W layer
IS layer
Service name
WSDL&
Location
UDDP Registry
UDDI Server
N/W layer
IS layer
Service name
WSDL&
Location
UDDP Registry
N/W layer
IS layer
HTTPProtocol
HTTPMain
HTTPCore
HTTPRequest
Utilities Allocation
…
Web serverModules
Web Server
Application Server
N/W layer
IS layer
SOAP Runtime
…RequestRouterServlet
Servlets
Generated EJB
EJB Container(Business Neutral)
EJB Container(Business Logic)
SessionBean
…
Mail Server
N/W layerIS layer
N/W layerIS layer
SMTPPOP3
Database Server
N/W layerIS layer
N/W layerIS layer
EJB Container
Entity bean
JDBC layer
Directory Server
Directory db
Front-end
Back-end
N/W layerIS layer
N/W layerIS layer DatabaseDatabase
Portal Server
N/W layerIS layer
Personalization
Integration
Publish & Subscribe
CRMPortal
E-commercePortal
Portal Server
N/W layerIS layer
Personalization
Integration
Publish & Subscribe
CRMPortal
E-commercePortal
Figure 4. E-commerce infrastructure on which ADEPTS is demonstrated
14
4.2 Instantiation of ADEPTS Architecture & I-DAG Structure The e-commerce system used for the instantiation of ADEPTS has 26 nodes in its I-DAG. The I-DAG for the
system is automatically generated using a tool called Graphviz [7] from a specification of the vulnerabilities. The
root node corresponds to the goal “System-wide Denial-of-Service” and there are 11 leaf nodes. Examples of the
leaf nodes which correspond to the lowest level goals are “Port scanning”, “Finding dead IPs”, and “Finding
ICMP broadcasting IPs”. The average out-degree of a node is 1.38, the depth of the tree is 4, and the average
number of responses per node is 2.11. Example responses of class 1 (most disruptive) are “Restart the entire
system” and of class 4 (less disruptive) are “Disable SSL module of the Apache server for the offending subnet”.
The Node Classification algorithm described in Section 3.3 traverses the I-DAG twice, once during the
bottom-up CCI computation and again during the top-down Response Set computation. As the size of the system
to which ADEPTS is applied increases, the corresponding I-DAG also increases in size. Thus, for ADEPTS to be
scalable, the algorithm needs to scale with increasing I-DAG sizes. The goal of this experiment is to verify
whether the algorithm is scalable with graph size.
In this experiment, we generate random I-DAGs given certain input parameters – the total size in terms of
number of nodes, the number of levels, and the average degree of a node. A random number of alerts to the
generated I-DAG is simulated. The parallelized version of the Node Classification algorithm is then executed with
different numbers of threads in the thread pool processing the available jobs. The time for the algorithm to
terminate is taken as the output measure of interest. In the first part of the experiment, the variation of time under
different combinations of the I-DAG size and the number of alerts is studied. The size of the I-DAG is varied
between 200 and 3500 nodes, and the number of concurrent alerts is varied between 1 and 100. The control
parameter is the thread pool size, whose size is varied between 1 and 500 threads. The table that stores the optimal
thread pool size for different combinations of I-DAG size and the number of concurrent alerts is empirically
determined through the experiment and shown in Table 1. This table can be used subsequently when the system is
deployed to make runtime decisions about the number of threads to employ when alerts are seen. As expected, a
small number of concurrent alerts and a small I-DAG size provide far too little scope for concurrency to make
parallelization worthwhile. Thus, with 5 or less alerts, a single thread execution is optimal independent of the I-
15
DAG size. The optimal number of threads increases as either of the two input parameters increases. Finally, with
greater than 80 concurrent alerts, 100 parallel threaded execution is optimal. This also indicates that 100 threads
reach the limit of parallel speedup possible for the workload and larger thread pool sizes are never required. A
small subset of the experimental results to determine the table is shown in Figure 5. In it, the I-DAG size of 3000
nodes is chosen and the time taken with varying number of threads is shown for three different numbers of
concurrent alerts. It is seen that with the optimal thread pool sizes are 1, 5,
and 100 with 1, 10, and 100 concurrent alerts respectively.
Table 1: Empirical determination of optimal thread pool size for parallelizing Node Classification algorithm
In the second part of the experiment, the algorithm to dynamically vary the number of threads depending on
the I-DAG size and the number of concurrent alerts is evaluated. The algorithm picks the thread pool size that was
empirically determined in the initialization phase to give the fastest execution. The optimal execution times are
shown in Figure 6, as the number of nodes is varied. Expectedly, the time increases with the increasing number of
nodes. The increase is steeper for a larger number of concurrent alerts. It shows that even though the thread pool
size is being varied to pick the optimal size, the execution time still increases with increasing I-DAG size or
number of alerts. The increase with I-DAG size, however, is linear and not exponential, which bodes well for the
scalability of the algorithm.
0
0.2
0.4
0.6
0.8
1
1.2
1.4
1.6
1 10 100 1000# Parallel Threads
Tim
e (m
sec)
0
2
4
6
8
10
12
14
16
Tim
e (m
sec)
3200 node DDAG with 10 concurrent alerts (left axis)3000 node DDAG with single alert (left axis)3000 node DDAG with 100 concurrent alerts (right axis)
Figure 5: Variation of time for Node
Classification algorithm with thread pool size
0.00E+00
1.00E-01
2.00E-01
3.00E-01
4.00E-01
5.00E-01
6.00E-01
0 500 1000 1500 2000 2500
Number of nodes
Tim
e fo
r al
go #
1 (m
sec)
1 alert 5 concurrent alerts 10 concurrent alerts
Figure 6: Variation of time for Node Classification algorithm with optimal thread pool
size choice
5.2 Experiment 2: Overhead of Different Phases of ADEPTS The goal of this experiment is to quantify the time overhead of running the three phases of ADEPTS – the Node
Classification algorithm, the RI Computation algorithm, and the Response Feedback algorithm. The e-commerce
alerts nodes threads1 to 5 all 16 to 45 all 546 to 80 <= 300 5else else 100
16
system described in Section 4.1 is used for the experiment and a varying number of concurrent alerts from 1 to 25
(total number of nodes in the I-DAG is 26) is input to the system. The time for the system to respond is measured
from when the alert enters ADEPTS to when ADEPTS triggers the appropriate response. The response action itself
can take an arbitrary amount of time which is not a property of ADEPTS and is therefore not accounted for in the
measurement.
Figure 7 shows the time in microseconds with a breakdown of the time spent in each of the three phases, as the
number of concurrent alerts is varied. It is seen that the total time for a response from the system is always less
than 3.66 ms. The relative proportion of time spent in the three phases varies between 22-60% (phase 1), 37-71%
(phase 2), and 2.0-6.4% (phase 3). The time for phase 1 depends on the number of concurrent alerts while the
times for phases 2 and 3 depend on the number of responses decided upon by the system. Our experiments have
shown that the time for the RI computation is almost linearly related to the number of responses deployed. There
is no simple relationship between the number of alerts and the number of responses. It depends on a complex mix
of factors – the shape of the I-DAG and the nodes in it that have the alerts and the confidence value of each alert.
As the number of alerts is varied, the set of nodes at which the alerts are inserted is also varied. Hence, the
number of responses taken fluctuates as the number of alerts is varied. This explains the irregularity in times for
phases 2 and 3 with number of alerts. The number of responses deployed for a given number of alerts is shown in
Table 2. It can be seen that the times for phases 2 and 3 depend directly on the number of responses.
responses taken for different numbers of concurrent alerts
17
5.3 Experiment 3: Escalation of Response Actions using I-DAG The goal of this experiment is to show the effect of the I-DAG on escalation of responses in the event of
multiple attacks and failed responses. For this experiment, the entire I-DAG of the e-commerce system with a
total of 25 nodes is used. Each node has one or more responses which have unique response IDs from 0 to 134.
We simulate repeated instances of a set of concurrent attacks at intervals of 10 time units. Each set consists of 8
concurrent attacks corresponding to 8 goal nodes at different depths in the I-DAG. The set of goal nodes is: Zope
leaking information through XML-RPC requests, Limited intra-host control on the Apache host, Executing
arbitrary code on the Apache host, Buffer overflows in Apache chunk handling, Apache mod_ssl worm, Sendmail
buffer overflow, MySQL client interface buffer overflow, and Finding dead IP addresses. When these attack goals
are reached, ADEPTS takes some response actions. The experimental results in Table 4 and Table 5 show the
Sensitivity Queue (SensQ) and the Activation Lookup Table (ALT) at each of the attack times. The SensQ entry
has the following fields – the node which was reached as a result of the attack (Node), the response that was
taken (Response), and the parent/child node for the response (Parent/Child Node). If the response taken
is corresponding to the node which is reached, then the parent/child node field is set to -1. However, if no
appropriate response exists for the node, the response is taken at a child node (i.e. a lower-level goal) with the
objective of preventing future instances of the attack from reaching the node goal. The response may also be taken
at a parent node (higher level goal) with the objective of blocking the spread of the attack and preventing further
higher level goals being reached. In these two cases, the parent/child node field is set to the ID of the
corresponding parent or child node. Each ALT entry has the following fields – the ID of the response that was
taken (Response) and the time for which the response will be active (Time).
Table 3. Summary of responses taken for each attack instance.
Each attack instance corresponds to 8 nodes in the I-DAG being reached. The response for each alert is shown. A -1 in a response ID implies no response is taken. A -1 in a Parent/Child Node ID implies response is taken at the node whose goal is
reached and not at a parent or child node.
18
The summary of the responses taken is shown in Table 3. The leftmost column gives the attack number and the
8 other columns correspond to the 8 nodes whose goals are reached. Each column has the format (Node ID,
Response ID, Parent/Child Node ID).
There are one or more responses attached to each node. In successive instances of the attack, ADEPTS takes
one of the following actions:
1. A response for the node whose goal was achieved by the attack. There are two sub-classes within this. (a) The
same response as in the last instance of the attack can be taken (e.g., attack 2, 5th node), or (b) A different
response from the last instance of the attack can be taken (e.g., attack 2, 2nd node).
2. A response for a different node than for which the goal was achieved by the attack (e.g., attack 2, 3rd node has
a response corresponding to the child of the node). This is either a parent or a child node.
3. No response is taken. This can happen if a response is outstanding and no other appropriate response exists
for a parent or a child node (e.g., attack 2, 1st node).
A static IRS can only take a response corresponding to category 1(a).
Activation Lookup Table (ALT) snapshots for the second attack
A snapshot of the SensQ and the ALT for the first two attack instances is shown in Table 4 and Table 5. In
attack #1, all responses taken are for the node for which the alert was sent, and hence the parent/child node field is
always -1 and this field is omitted in the table. A response is removed from the SensQ after the sensitivity period
elapses. The period is 30 hours for our experiment. For attack #2, no response is taken for the alert in node 22
since a response (response ID 129) is currently outstanding and there is no child node for 22. Also, for the alert to
19
node 8, while response 115 is outstanding, the second attack triggers a different response (response 122) in the
child node.
6 Conclusions In the paper we have described the design and implementation of ADEPTS, a system for automatically
containing and responding to intrusions in a distributed e-commerce environment. ADEPTS uses an intrusion DAG
with the nodes as the goals of an attack, as the underlying representation for its algorithms. It provides methods to
automatically trigger a response of appropriate severity depending on the confidence that the goal corresponding
to a node has been achieved. There is a feeback mechanism to measure the effectiveness of a response and to bias
future responses towards those that are found to be more effective. ADEPTS is demonstrated on a real e-commerce
system that comprises 6 servers which has 26 nodes in its I-DAG.
The I-DAG traversal is parallelized and experiments conducted to evaluate the effectiveness of the
parallelization. The experiments show that a large DAG and a large number of concurrent alerts makes
parallelization worthwhile. Experiments to measure the latency of ADEPTS shows that the combined time for the
three phases is less than 3.66 ms. The time for phase 1 depends on the number of concurrent alerts while the time
for phases 2 and 3 depend on the number of responses decided upon by the system. There is no simple
relationship between the number of alerts and the number of responses. An experiment is conducted to show the
escalation of response actions with repeated alerts and exhibits the power of ADEPTS to adapt to the effectiveness
of response.
In the future, we plan to evaluate the containment effectiveness of ADEPTS. The containment can be quantified
by the survivability of the system, which is the portion of the system functionality that is available in the presence
of intrusions. The speed of propagation of the intrusion has to be estimated for determining the containment
strategy. We plan to investigate the effect of cascaded fallouts from multiple concurrent attacks in the system.
References
[1] S. Garfinkel and G. Spafford, “Web Security & Commerce,” O’Reilly, 1997. [2] A. Ghosh, “E-Commerce Security,” John Wiley and Sons, Inc., Third Avenue, New York, 1998. [3] V. Hassler, “Security Fundamentals for E-commerce,” Artech House, 2001. [4] L. D. Stein, “Web Security: A step-by-step reference guide,” Addison Wesley, Reading, Massachusetts, 1999. [5] Forrester Research Inc., “US E-Commerce Overview: 2003 to 2008,” Techstrategy Brief Series, July 2003. [6] Yu-Sung Wu, Bingrui Foo, Yongguo Mei, and Saurabh Bagchi, “Collaborative Intrusion Detection System (CIDS): A
Framework for Accurate and Efficient IDS,” In Proceedings of the 19th Annual Computer Security Applications
20
Conference (ACSAC ’03), December 8 - 12, 2003, Available at: http://www.ece.purdue.edu/~sbagchi/Research/Papers/cids_acsac03.pdf.
[7] AT&T Research, “Graphviz - open source graph drawing software,” Available at: http://www.research.att.com/sw/tools/graphviz/
[8] F. B. Cohen, “Simulating Cyber Attacks, Defenses, and Consequences,” Available at http://all.net/journal/ntb/simulate/simulate.html, May 13, 1999.
[9] G. B. White, E. A. Fisch, and U. W. Pooch, “Cooperating Security Managers: A Peer-based Intrusion Detection System,” IEEE Network, vol. 10, no. 1, January/February, 1996, pp. 20-23.
[10] E. A. Fisch, “Intrusion Damage Control and Assessment: A Taxonomy and Implementation of Automated Responses to Intrusive Behavior,” Ph.D. Dissertation, Texas A&M University, College Station, TX, 1996.
[11] P. A. Porras and P. G. Neumann, “EMERALD: Event Monitoring Enabling Responses to Anomalous Live Disturbances,” in Proc. 20th National Information Systems Security Conf., Baltimore, MD, October 7-10, 1997, pp. 353-365.
[12] P. G. Neumann and P. A. Porras, “Experience with EMERALD to Date,” in Proc. 1st USENIX Workshop on Intrusion Detection and Network Monitoring, Santa Clara, CA, April 11-12, 1999.
[13] Thomas Toth and Christopher Kruegel, “Evaluating the Impact of Automated Intrusion Response Mechanisms,” 18th Annual Computer Security Applications Conference (ACSAC ’02), December 9 - 13, 2002.
[14] Curtis A. Carver, Jr., and Udo W. Pooch, “An Intrusion Response Taxonomy and its Role in Automatic Intrusion Response,” Proceedings of the 2000 IEEE Workshop on Information Assurance and Security, United States Military Academy, West Point, NY, 6-7 June, 2000.
[15] U. Lindqvist and E. Jonsson, “How to Systematically Classify Computer Security Intrusions,” Proc. 1997 IEEE Symposium on Security and Privacy, Oakland, CA, May 4-7, 1997, pp. 154 - 163.
[16] Daniel Ragsdale, Curtis Carver, Jeffery Humphries, and Udo Pooch, “Adaptation Techniques for Intrusion Detection and Intrusion Response Systems,” In Proceedings of the IEEE International Conference on Systems, Man, and Cybernetics, Nashville, Tennessee, October 8-11, 2000, pp. 2344-2349.
[17] Curtis A. Carver, John M.D. Hill, and Udo W. Pooch, “Limiting Uncertainty in Intrusion Response,” Proceedings of the 2001 IEEE Workshop on Information Assurance and Security United States Military Academy, West Point, NY, 5-6 June, 2001.
[18] Recourse Technologies, “ManHunt product description,” Available at: http://www.recourse.com/products/manhunt/features.html.
[19] Dan Schnackenberg, Harley Holliday, Randall Smith, Kelly Djahandari, Dan Sterne, “Cooperative Intrusion Traceback and Response Architecture (CITRA),” DARPA Information Survivability Conference and Exposition (DISCEX II'01), June 12 - 14, 2001.
[20] D. Sterne, K. Djahandari, B. Wilson, B. Babson, D. Schnackenberg, H. Holliday, and T. Reid, “Autonomic Response to Distributed Denial of Service Attacks,” In Proceedings of the 4th International Symposium on Rapid Advances in Intrusion Detection, RAID 2001, Davis, CA, USA, October 2001.
[21] R. Mahajan, S. Bellovin, S. Floyd, J. Ioannidis, V. Paxson, and S. Shenker, “Controlling High Bandwidth Aggregates in the Network,” AT&T Center for Internet Research at ICSI (ACIRI), DRAFT, February 5, 2001. Available at: http://www.research.att.com/∼smb/papers/DDOS-lacc.pdf
[22] Daniel P. Siewiorek and Robert S. Swarz, “Reliable Computer Systems – Design and Evaluation,” Chapter 5: Evaluation Criteria, pg. 350, A. K. Peters Ltd., Third Edition.
[23] P.J. Brooke and R.F. Paige, “Fault Trees for Security System Analysis and Design,” Journal of Computers and Security, 22(3):256-264, Elsevier, May 2003.
[24] Guy Helmer, Johnny Wong, Mark Slagell, Vasant Honavar, Les Miller, and Robyn Lutz, “A Software Fault Tree Approach to Requirements Analysis of an Intrusion Detection System,” In Proceedings of the First Symposium on Requirements Engineering for Information Security, 2001.
[25] B. Schneier, “Attack Trees: Modeling Security Threats,” Dr. Dobbs Journal, December 1999, Available at: http://www.counterpane.com/attacktrees-ddj-ft.html.
[26] “Snort Flexible Response Add-On,” Available at: http://cerberus.sourcefire.com/~jeff/archives/snort/sp_respond2/ [27] “Snort In-line,” Available at: http://sourceforge.net/projects/snort-inline/ [28] “The Linux Intrusion Detection System (LIDS) Project,” Available at: http://www.lids.org