46
ADF Performance Monitor Frank Houweling - 2015
| Date post: | 17-Jul-2015 |
| Category: |
Technology |
| Upload: | amis-friends-of-oracle-and-java |
| View: | 332 times |
| Download: | 2 times |
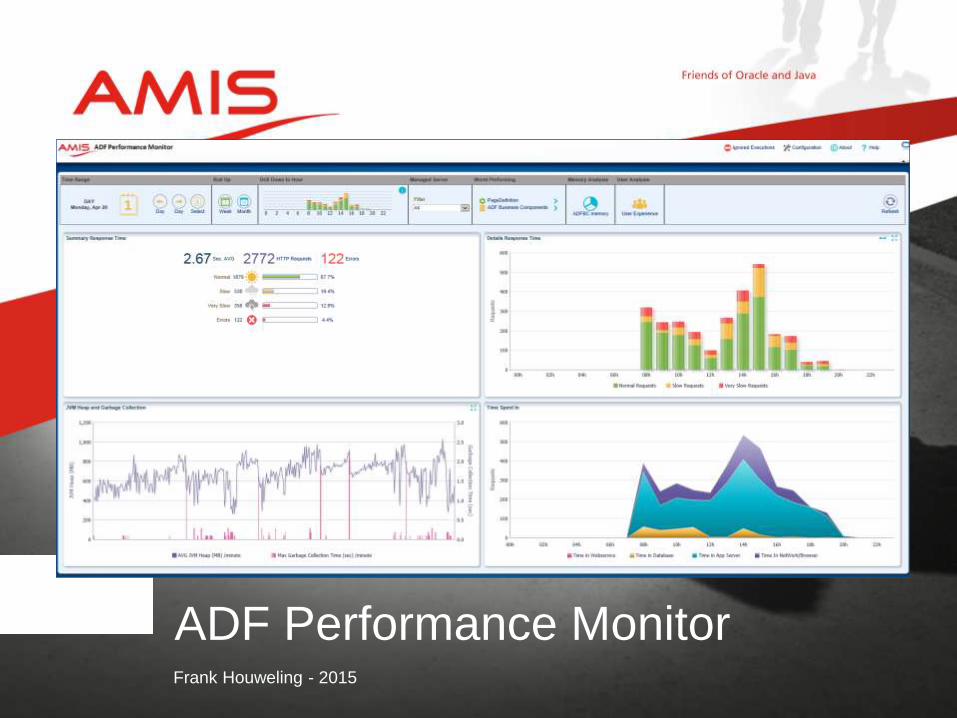
ADF Performance MonitorFrank Houweling - 2015
2
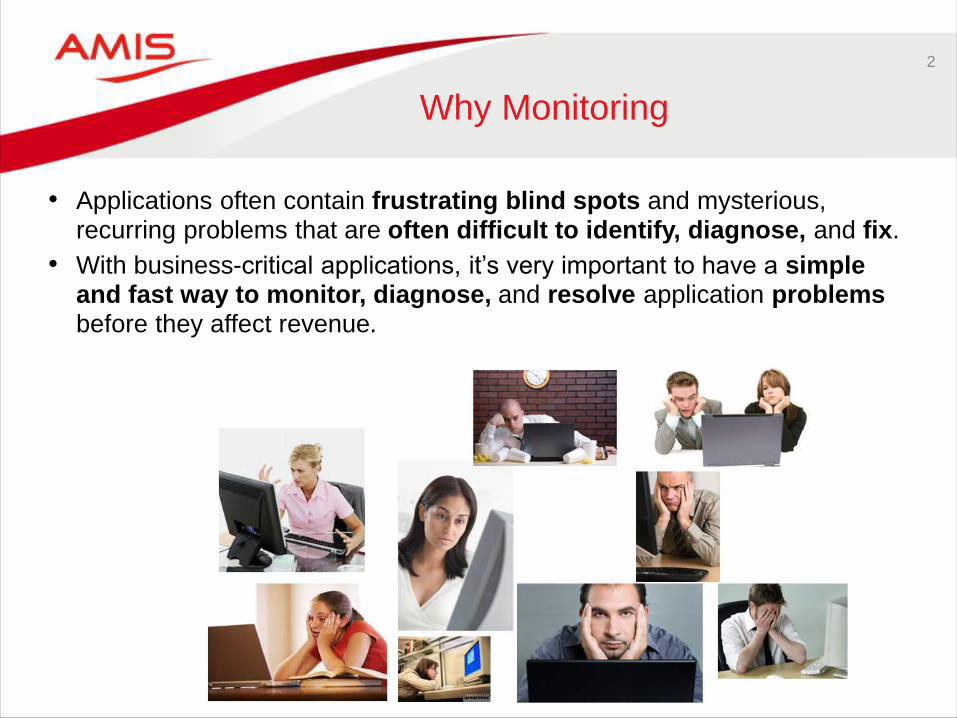
Why Monitoring
• Applications often contain frustrating blind spots and mysterious, recurring problems that are often difficult to identify, diagnose, and fix.
• With business-critical applications, it’s very important to have a simple and fast way to monitor, diagnose, and resolve application problemsbefore they affect revenue.

3
End User Experience:Call and Ask all Customers ?
4
ADF Performance Monitor
• Advanced tool designed for measuring, analyzing, improving, and checking the performance and health of Oracle ADF applications
• Tracks and collects crucial production performance information of the application’s runtime ADF components that are not standard provided by Oracle
• Helps development, QA, and operation teams to detect, analyze and resolve common and less common issues in response times, health and resource usage of ADF applications
• Can be used during development, test and production
• Is a library attached to your application
• Less than 1 day for implementation
• Needs to add a very small amount of code to application to make metrics classes active
5
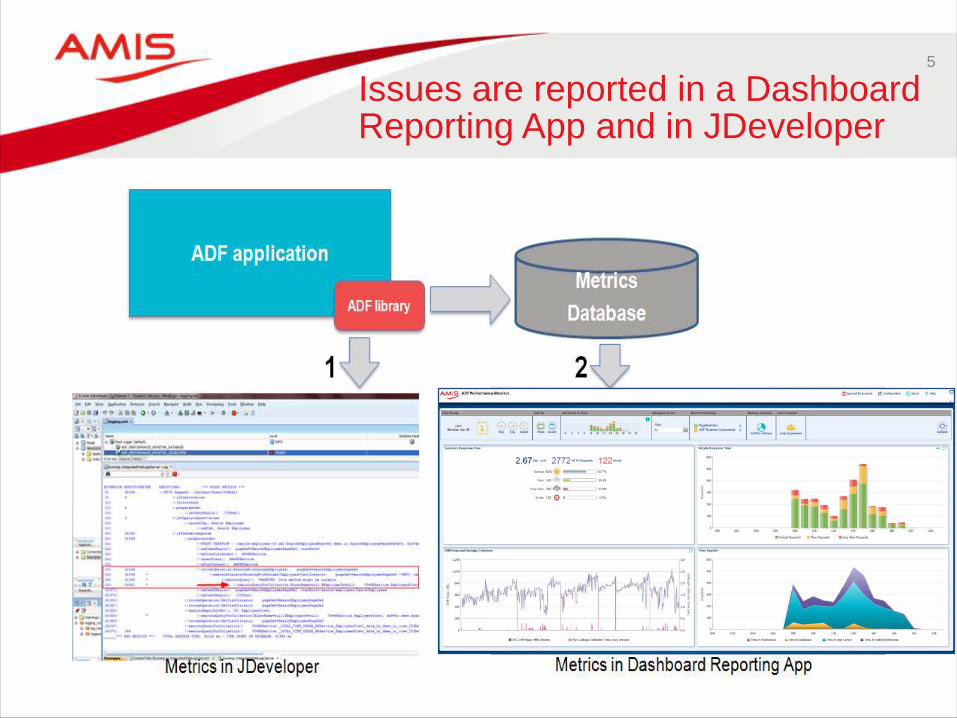
Issues are reported in a Dashboard Reporting App and in JDeveloper
6
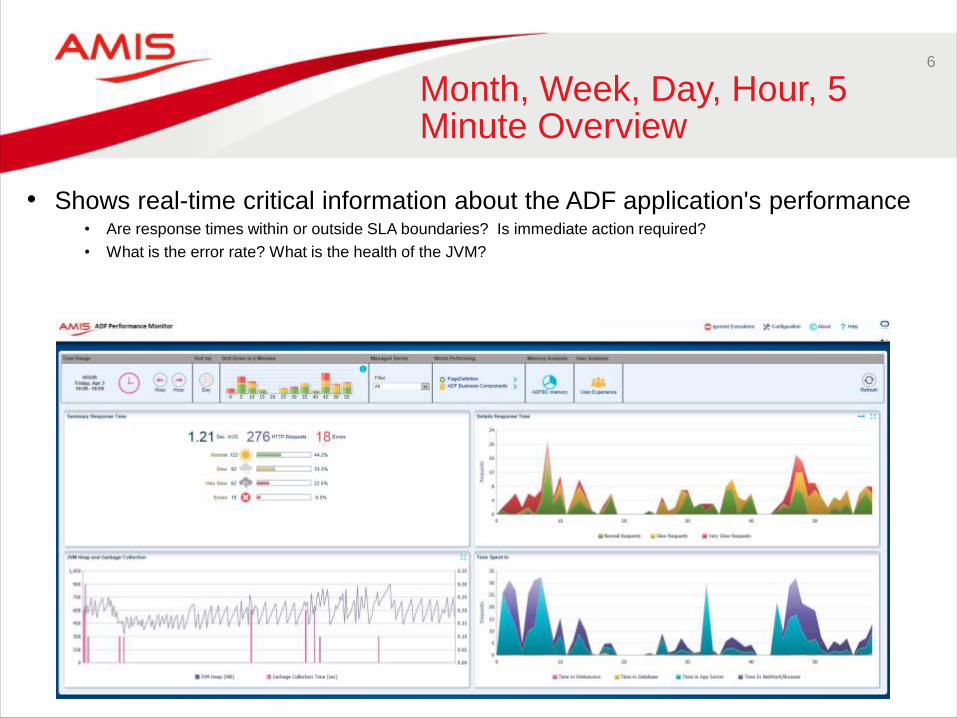
Month, Week, Day, Hour, 5 Minute Overview
• Shows real-time critical information about the ADF application's performance• Are response times within or outside SLA boundaries? Is immediate action required?
• What is the error rate? What is the health of the JVM?
7
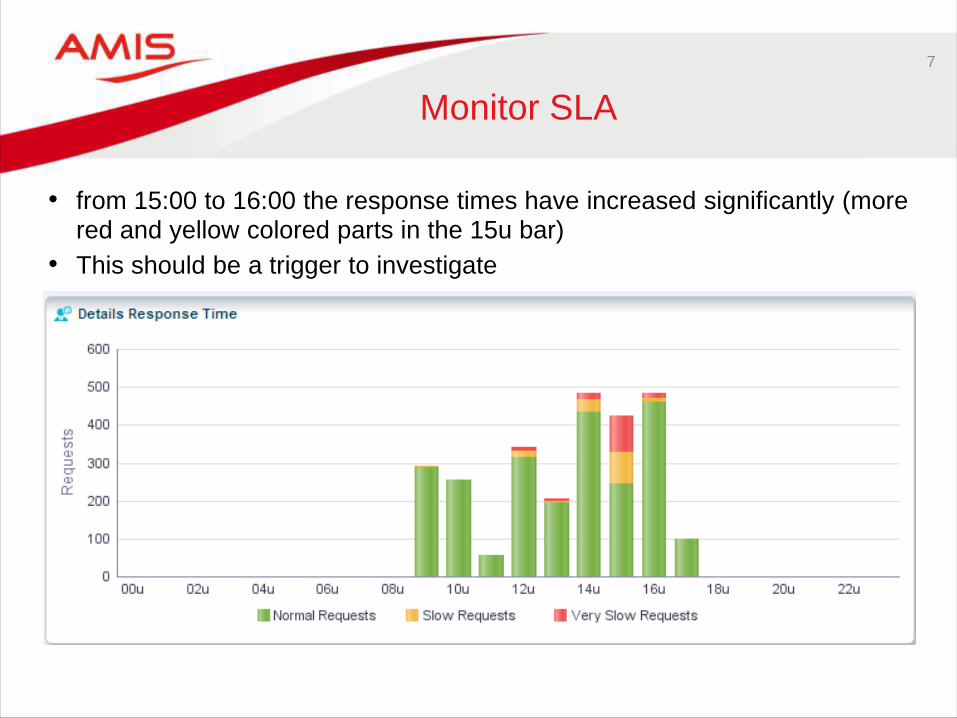
Monitor SLA
• from 15:00 to 16:00 the response times have increased significantly (more red and yellow colored parts in the 15u bar)
• This should be a trigger to investigate
8
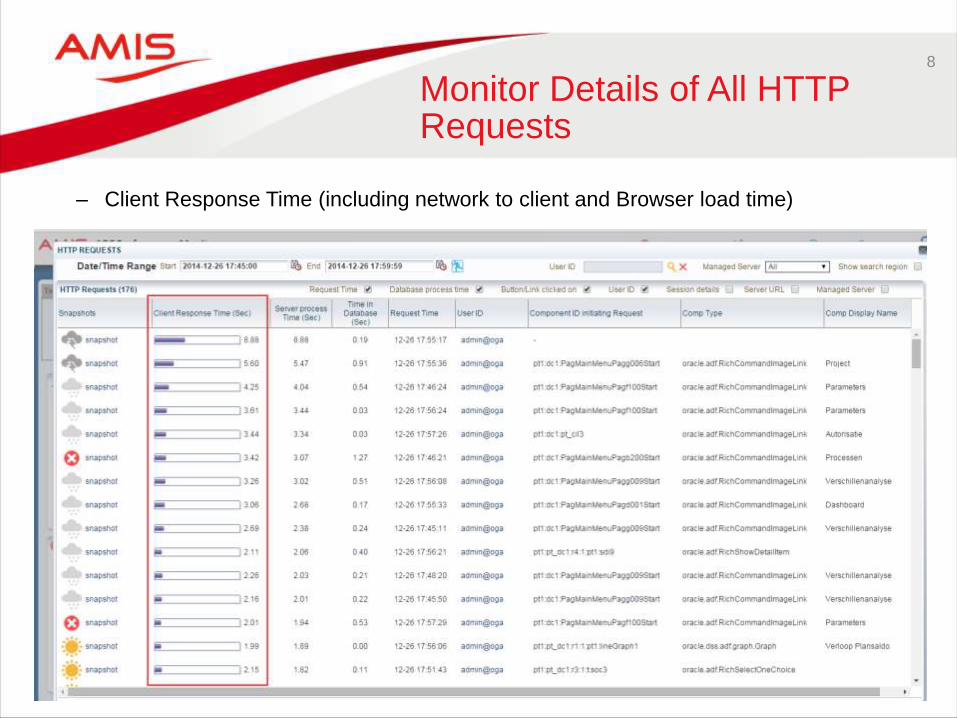
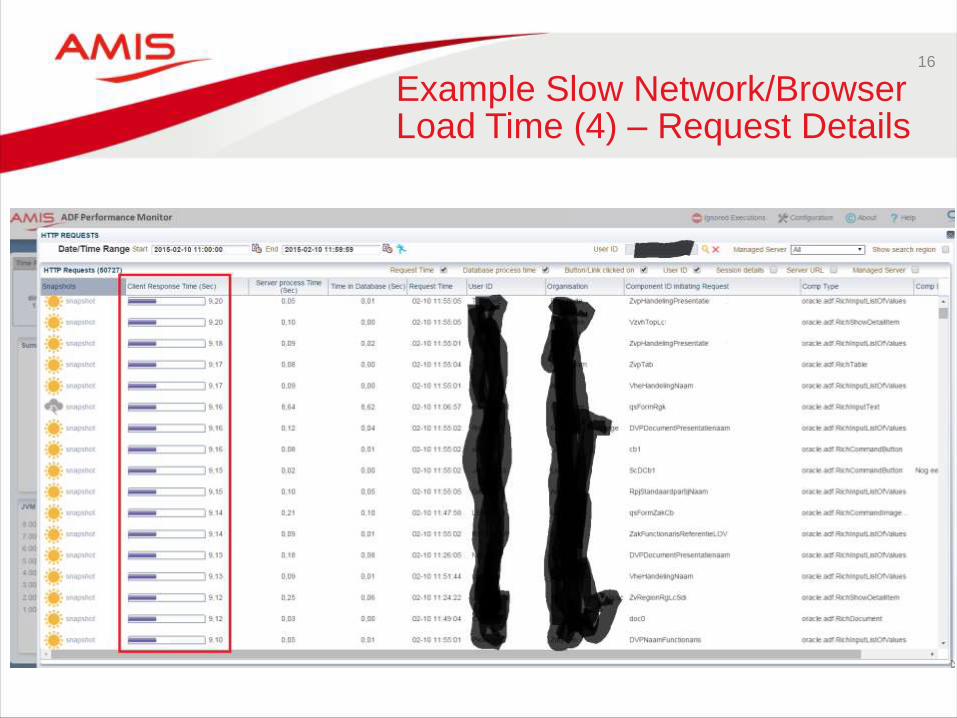
Monitor Details of All HTTP Requests
– Client Response Time (including network to client and Browser load time)
9
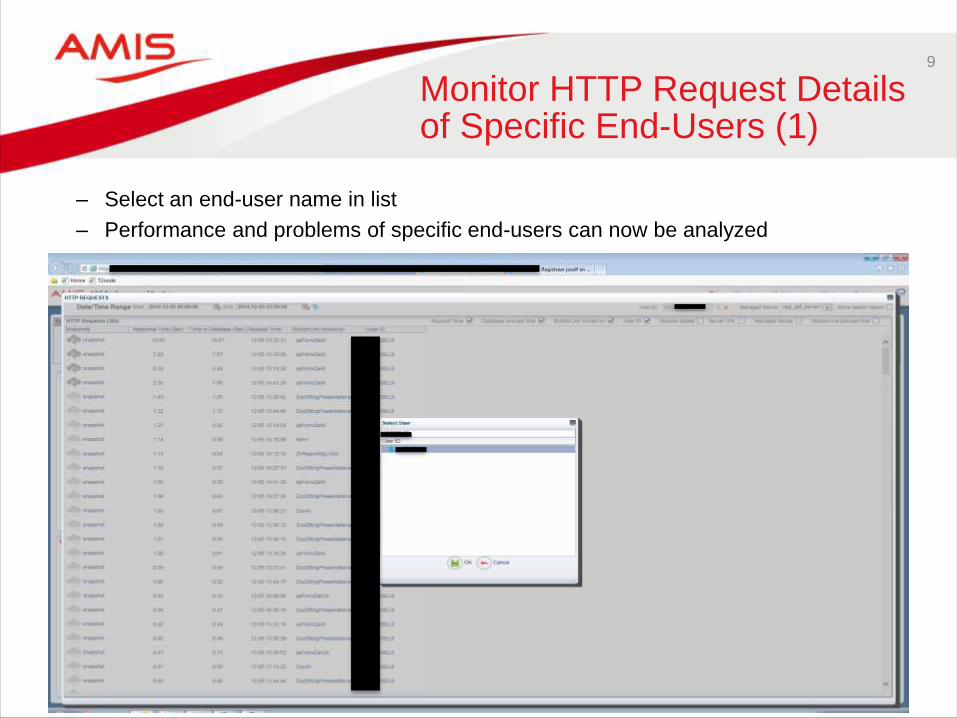
Monitor HTTP Request Details of Specific End-Users (1)
– Select an end-user name in list
– Performance and problems of specific end-users can now be analyzed

10
Monitor Requests of Specific End-Users (2)
– When and where did the end-user click ?
– What were the response times of this end-user ?
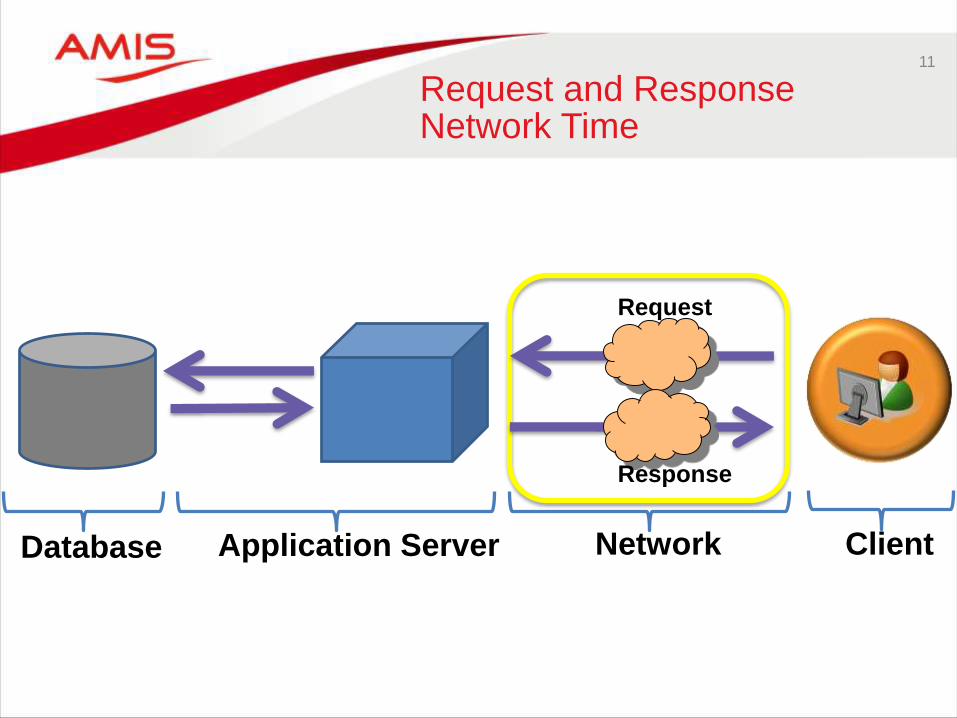
11
Request and Response Network Time
Database Application Server Network Client
Request
Response
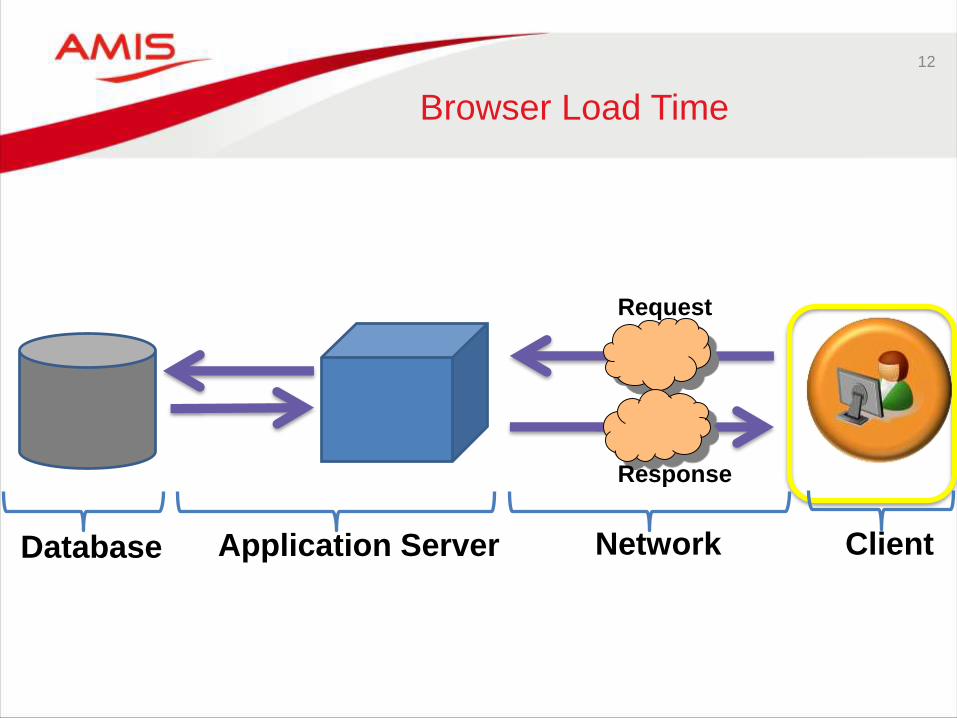
12
Browser Load Time
Database Application Server Network Client
Request
Response
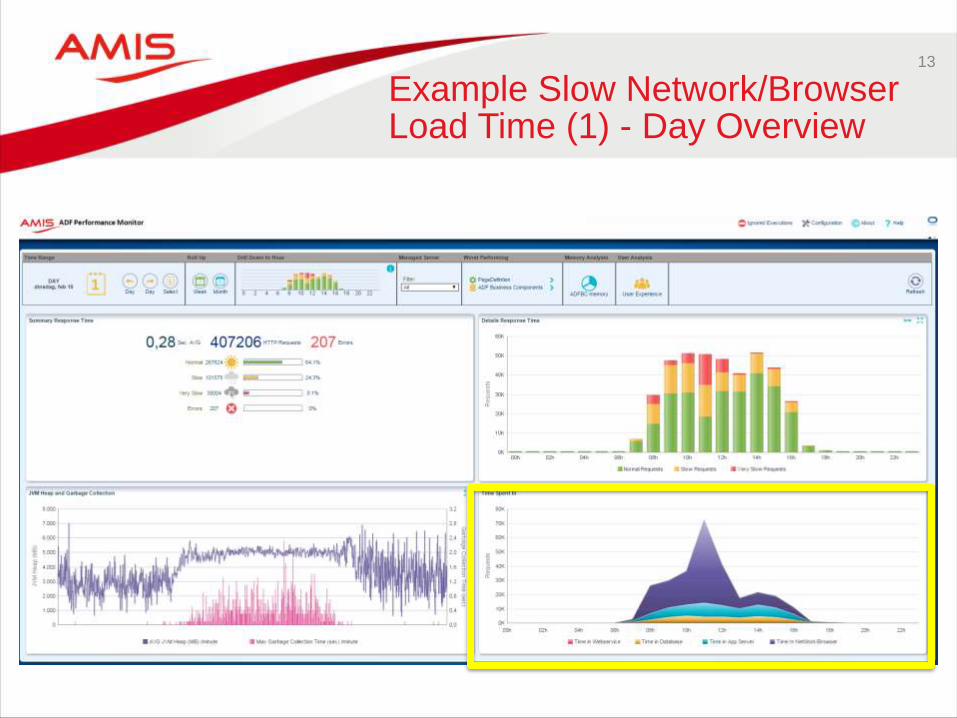
13
Example Slow Network/Browser Load Time (1) - Day Overview
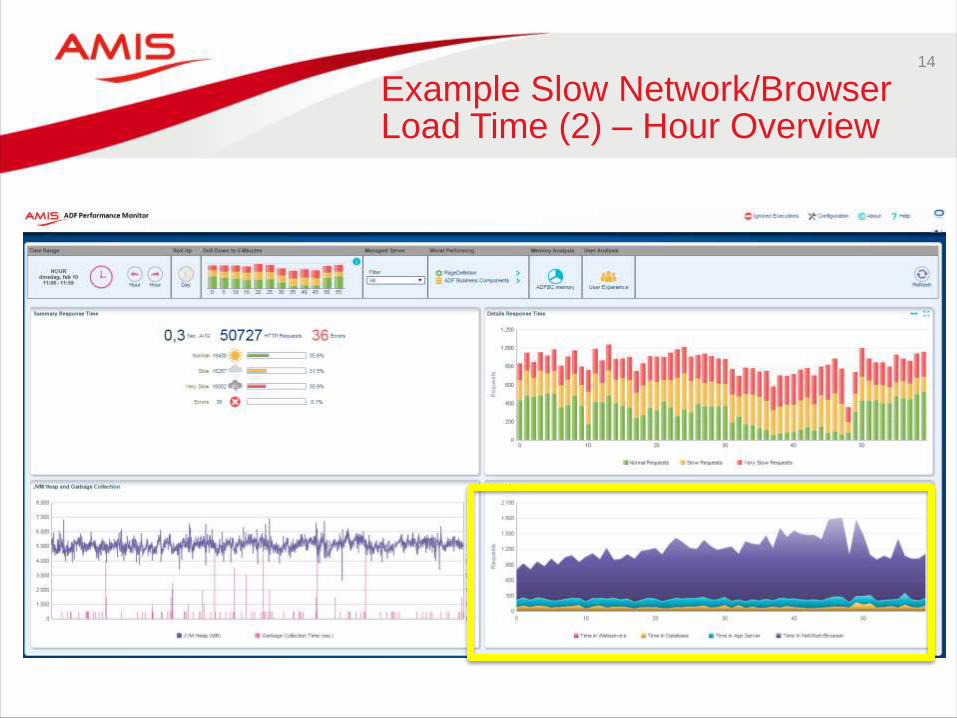
14
Example Slow Network/Browser Load Time (2) – Hour Overview
15
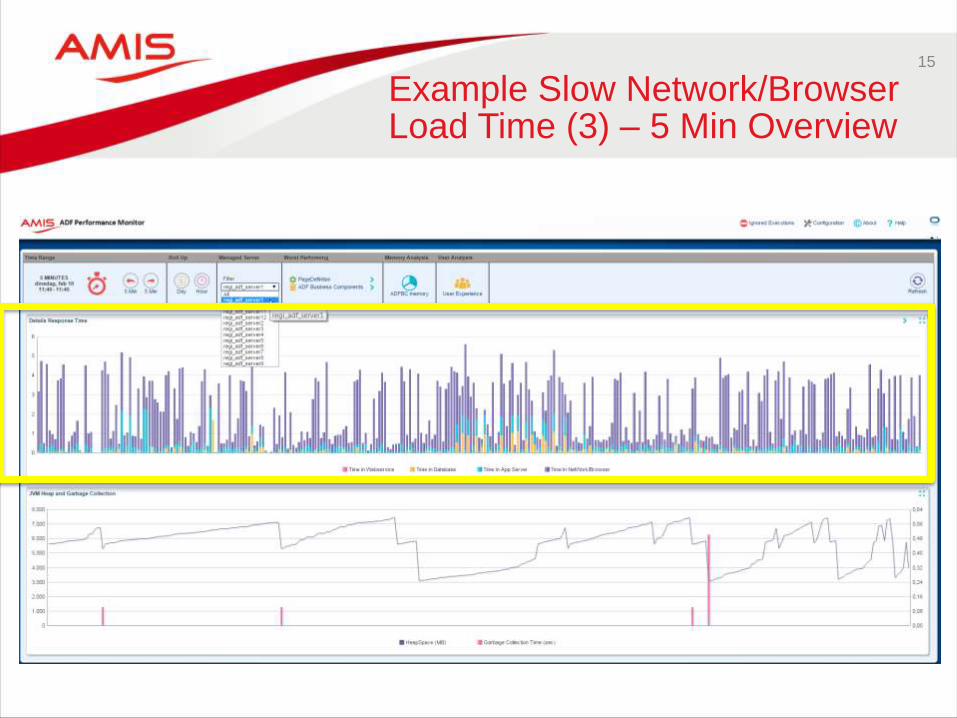
Example Slow Network/Browser Load Time (3) – 5 Min Overview
16
Example Slow Network/Browser Load Time (4) – Request Details
17
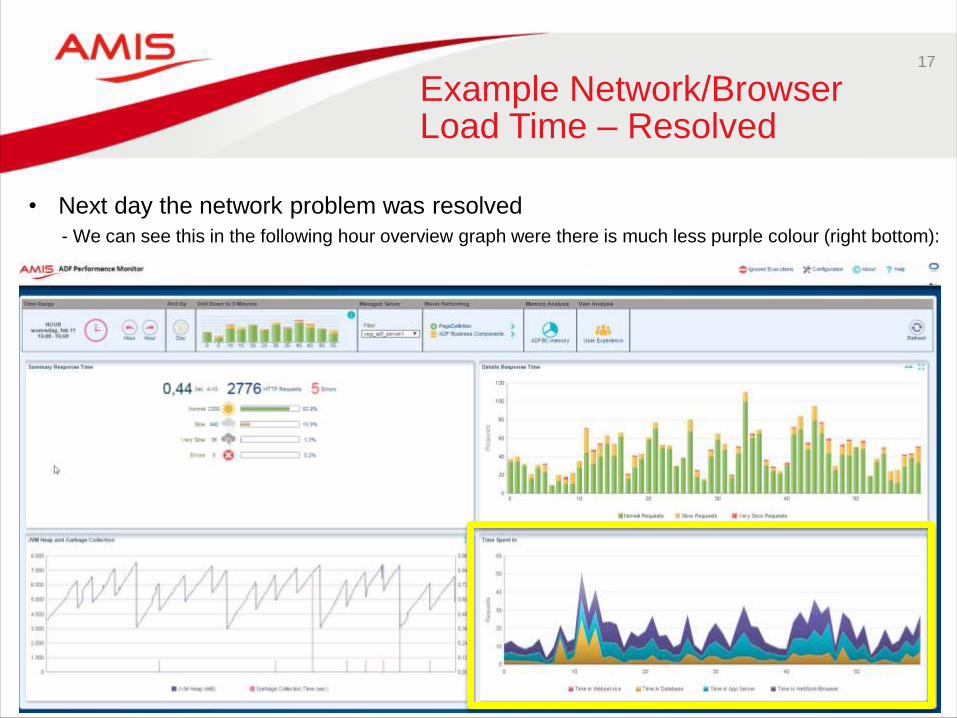
Example Network/Browser Load Time – Resolved
• Next day the network problem was resolved
- We can see this in the following hour overview graph were there is much less purple colour (right bottom):
18
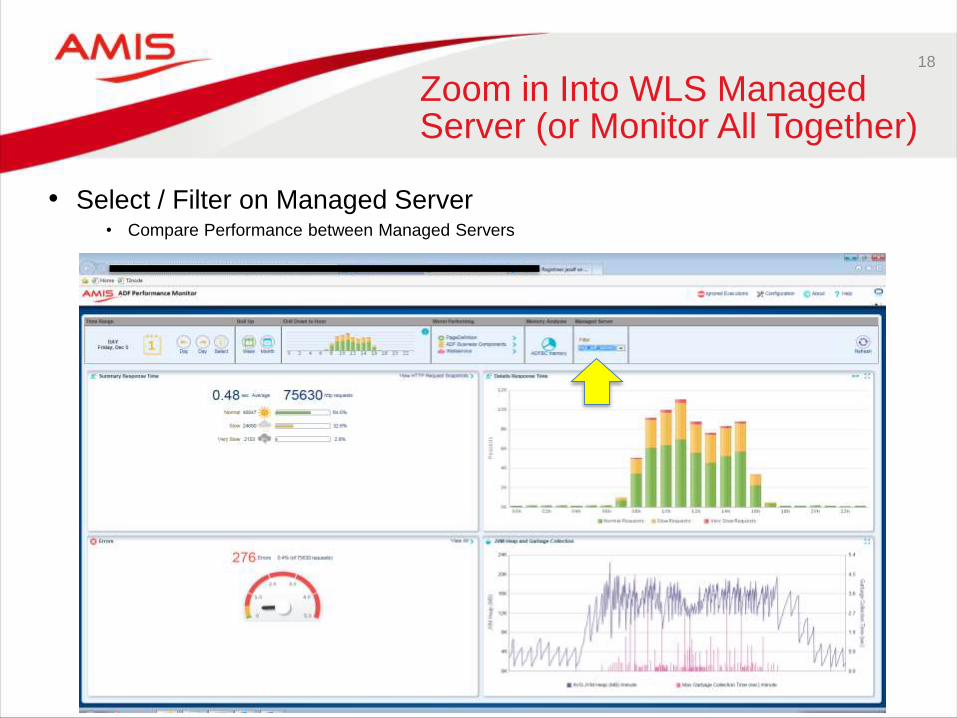
Zoom in Into WLS Managed Server (or Monitor All Together)
• Select / Filter on Managed Server• Compare Performance between Managed Servers
19
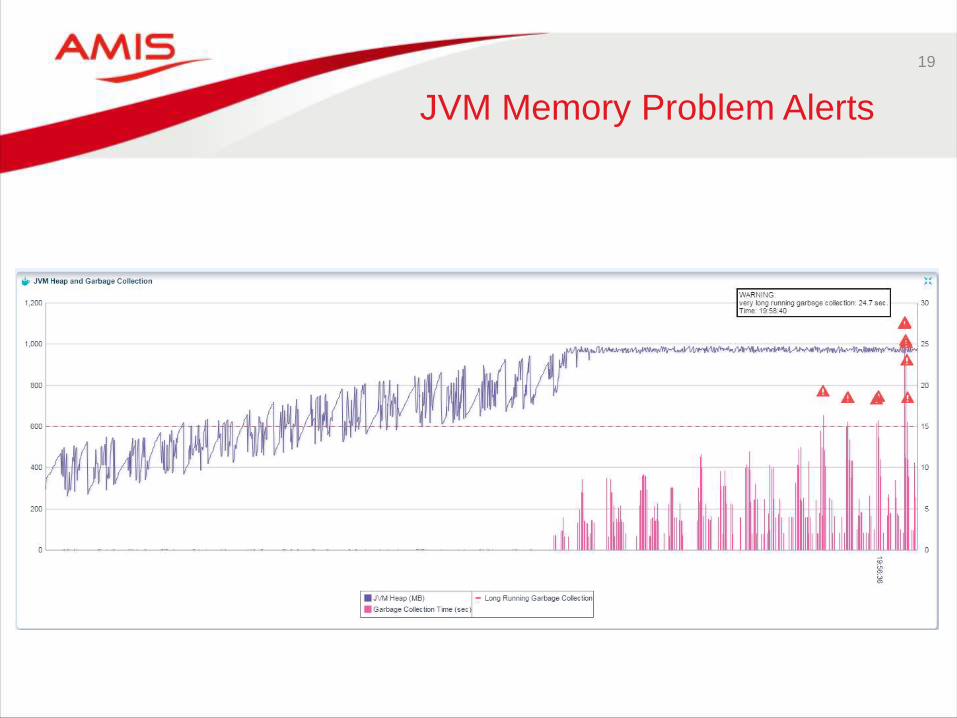
JVM Memory Problem Alerts
20
Quickly Troubleshoot Customer Complains
• All errors with all relevant detail information are recorded
• Error stack traces and call stacks are collected to allow the developer to quickly troubleshoot these errors
• This information helps to discover, analyze and resolve errors that happen frequently on test / production environments

21
Troubleshoot Production Errors (1)
• Top 10 Production Errors / Faults by Occurrences
22
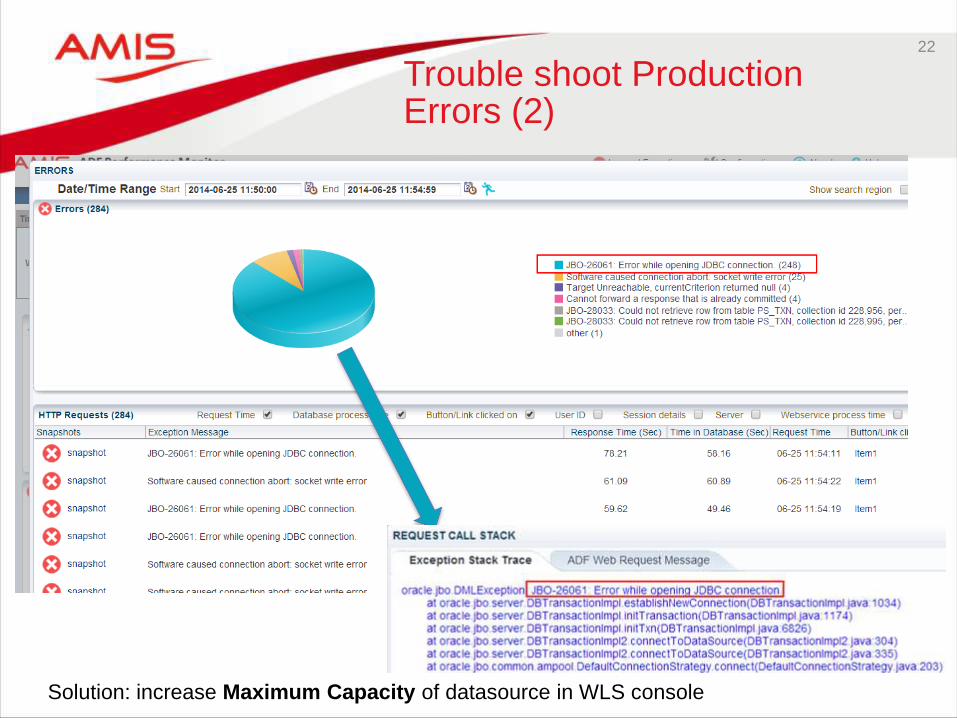
Trouble shoot Production Errors (2)
Solution: increase Maximum Capacity of datasource in WLS console
23
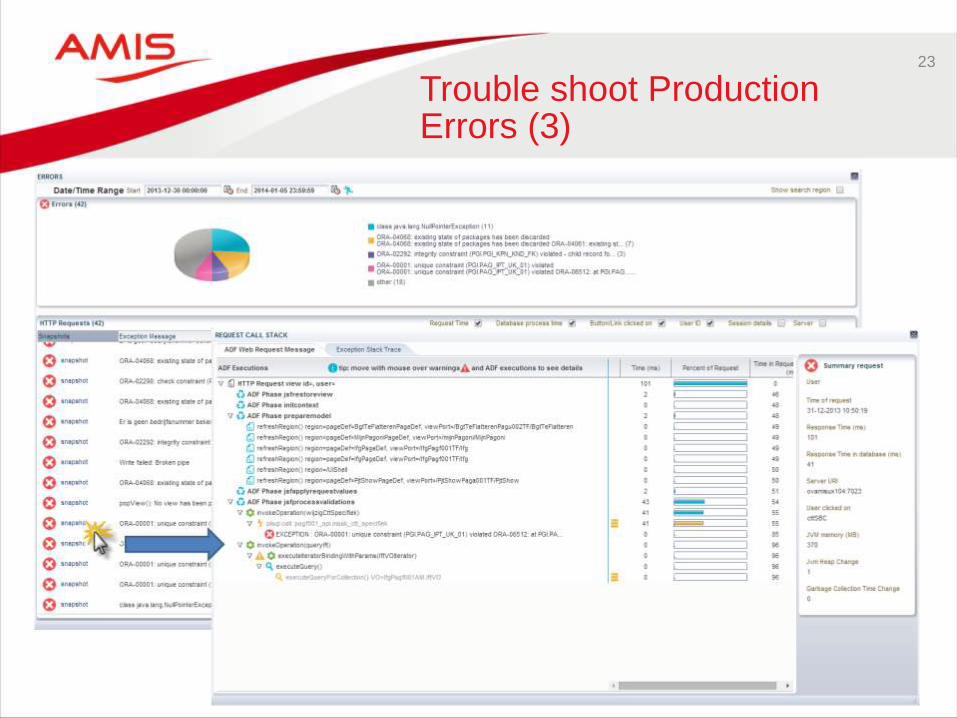
Trouble shoot Production Errors (3)
24
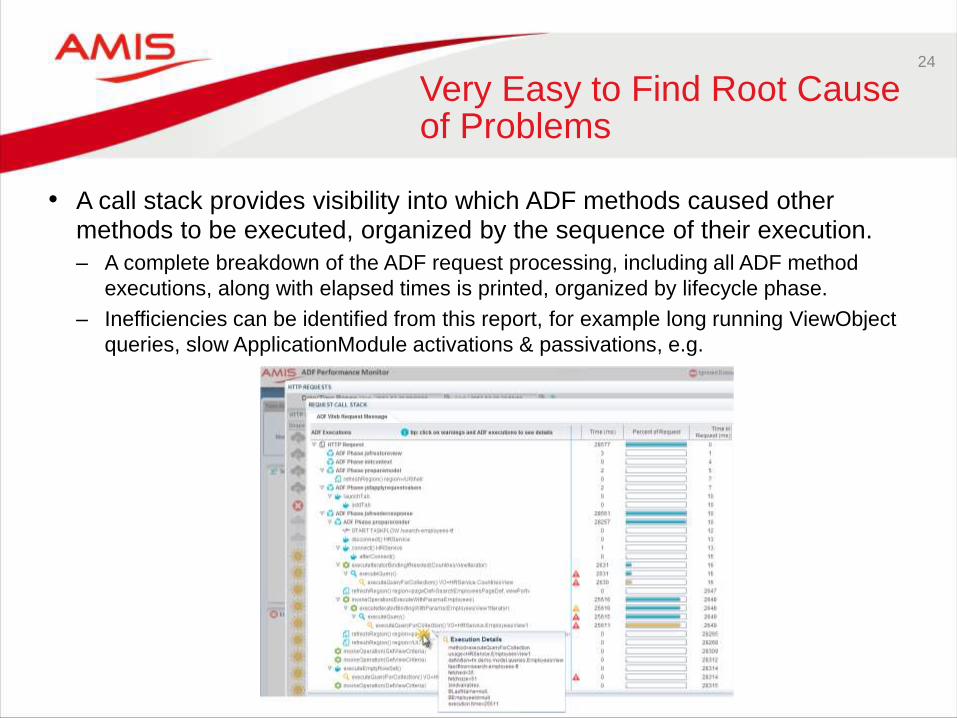
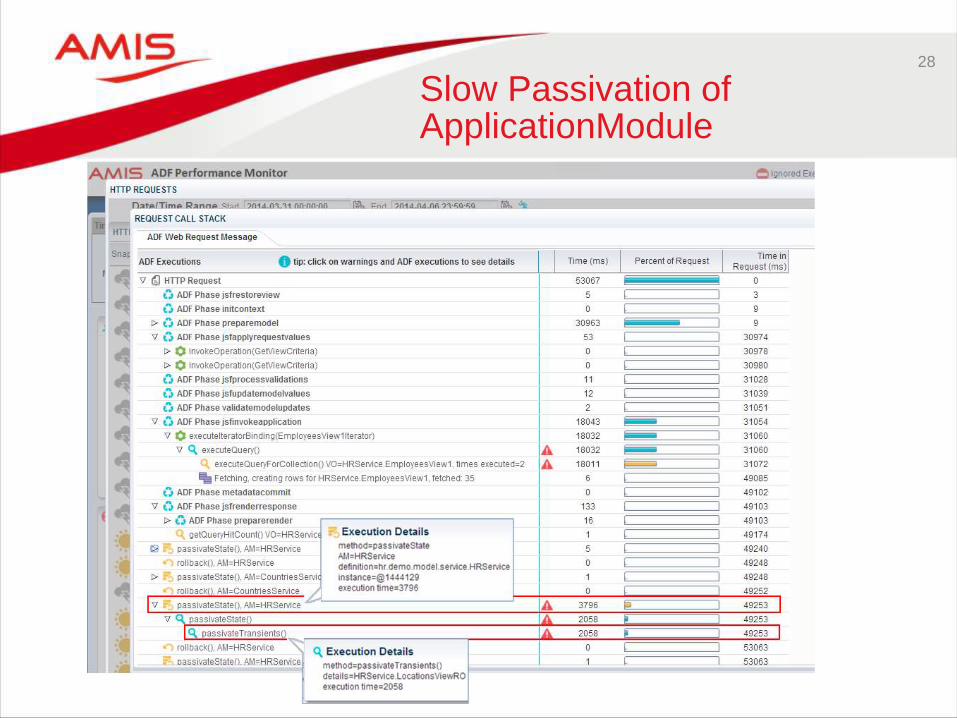
Very Easy to Find Root Cause of Problems
• A call stack provides visibility into which ADF methods caused other methods to be executed, organized by the sequence of their execution.
– A complete breakdown of the ADF request processing, including all ADF method
executions, along with elapsed times is printed, organized by lifecycle phase.
– Inefficiencies can be identified from this report, for example long running ViewObject
queries, slow ApplicationModule activations & passivations, e.g.
25
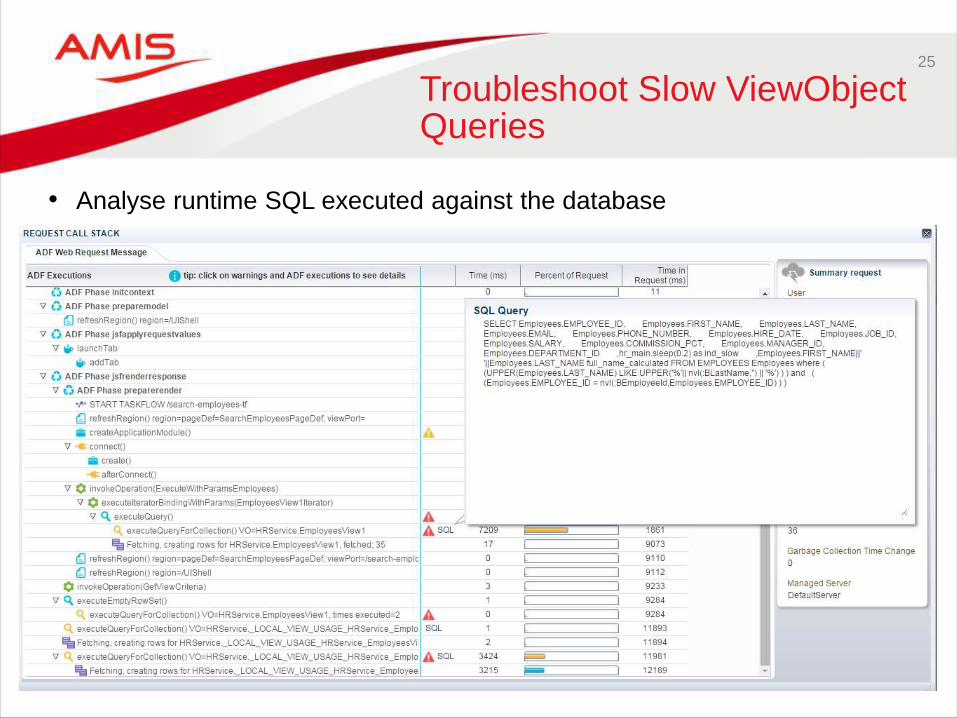
Troubleshoot Slow ViewObjectQueries
• Analyse runtime SQL executed against the database
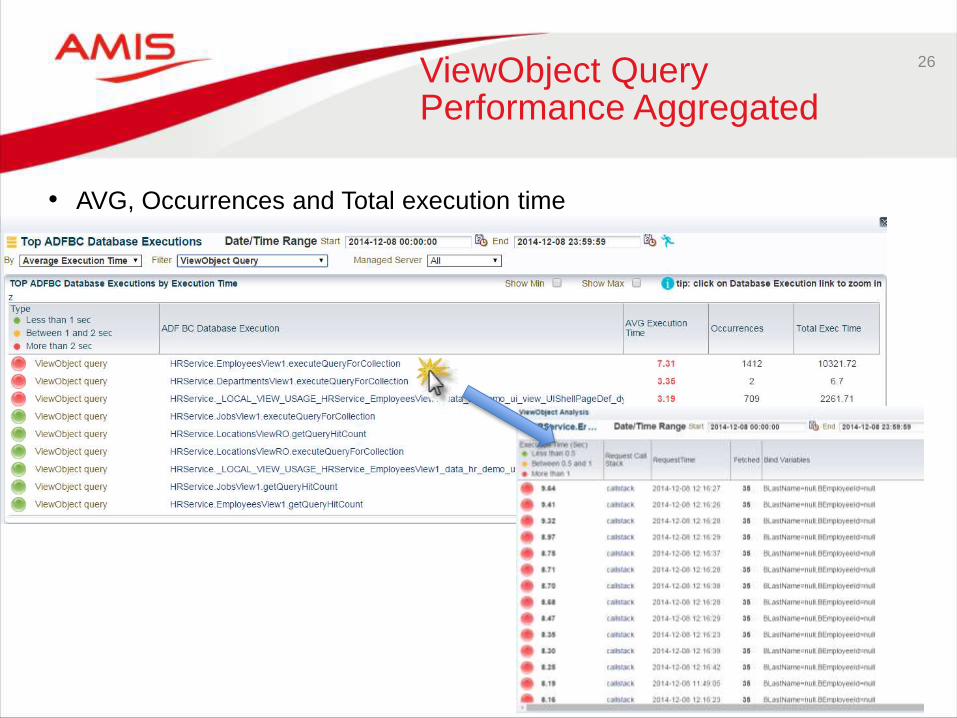
26ViewObject QueryPerformance Aggregated
• AVG, Occurrences and Total execution time
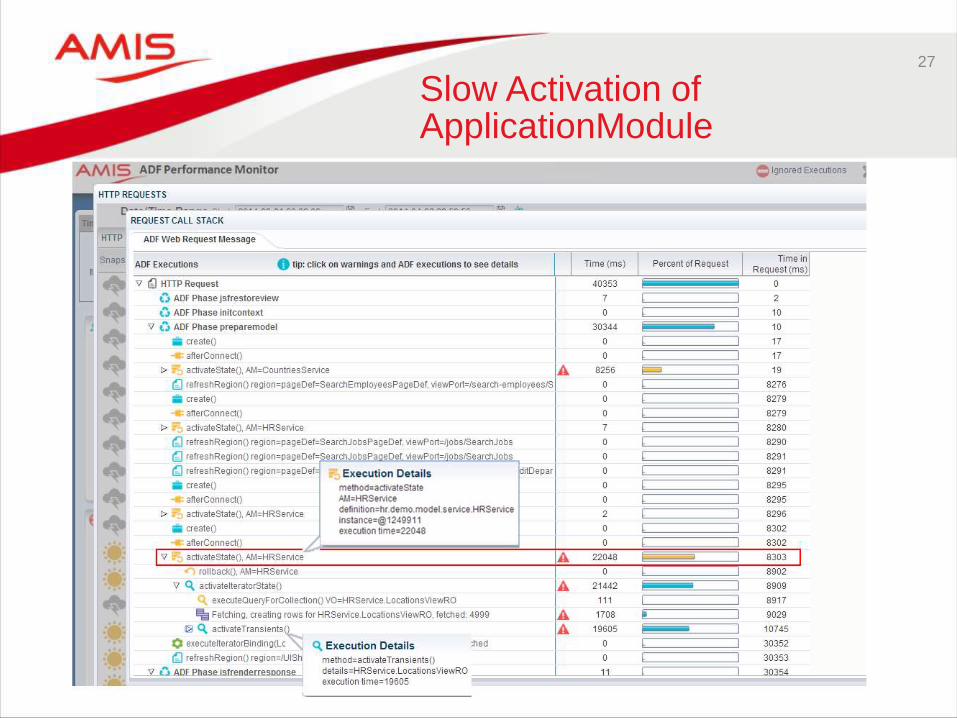
27
Slow Activation of ApplicationModule
28
Slow Passivation of ApplicationModule
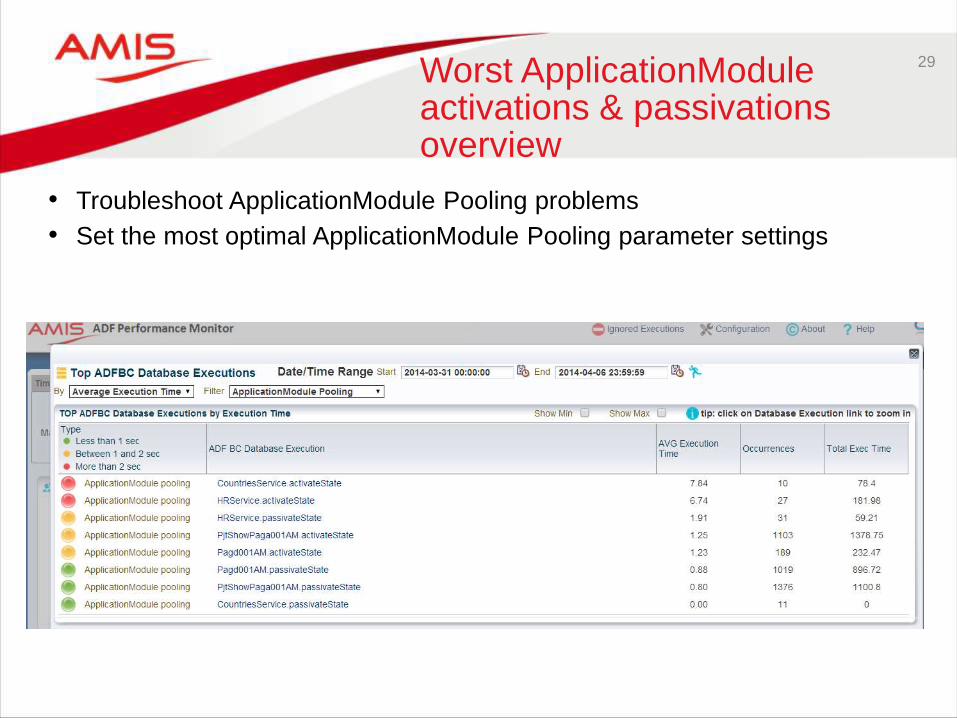
29Worst ApplicationModuleactivations & passivationsoverview
• Troubleshoot ApplicationModule Pooling problems
• Set the most optimal ApplicationModule Pooling parameter settings
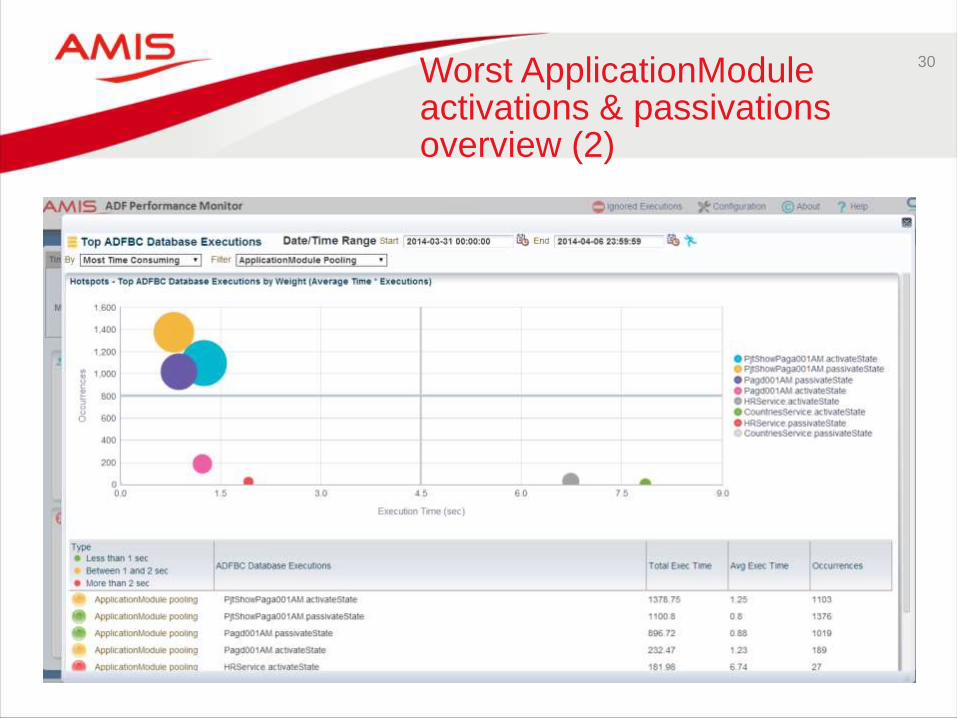
30Worst ApplicationModuleactivations & passivationsoverview (2)
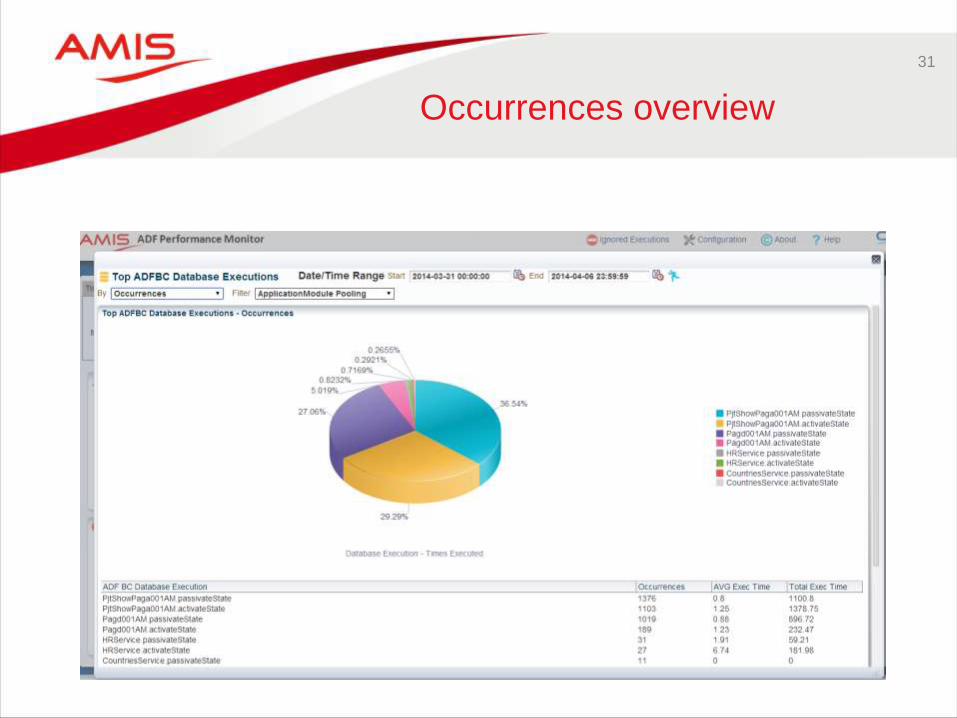
31
Occurrences overview
32
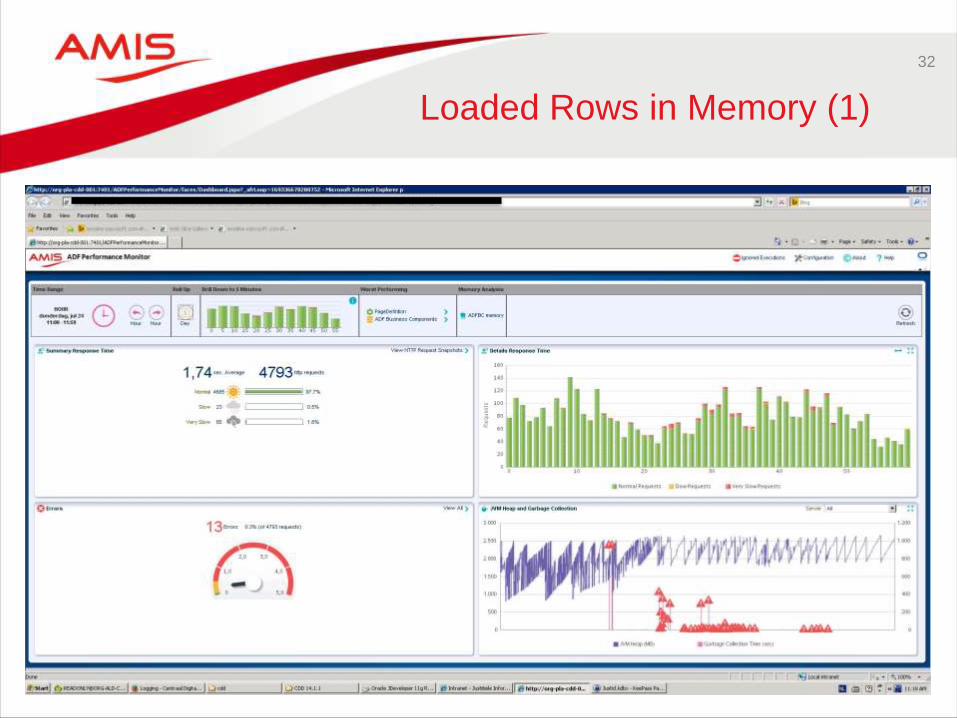
Loaded Rows in Memory (1)
33
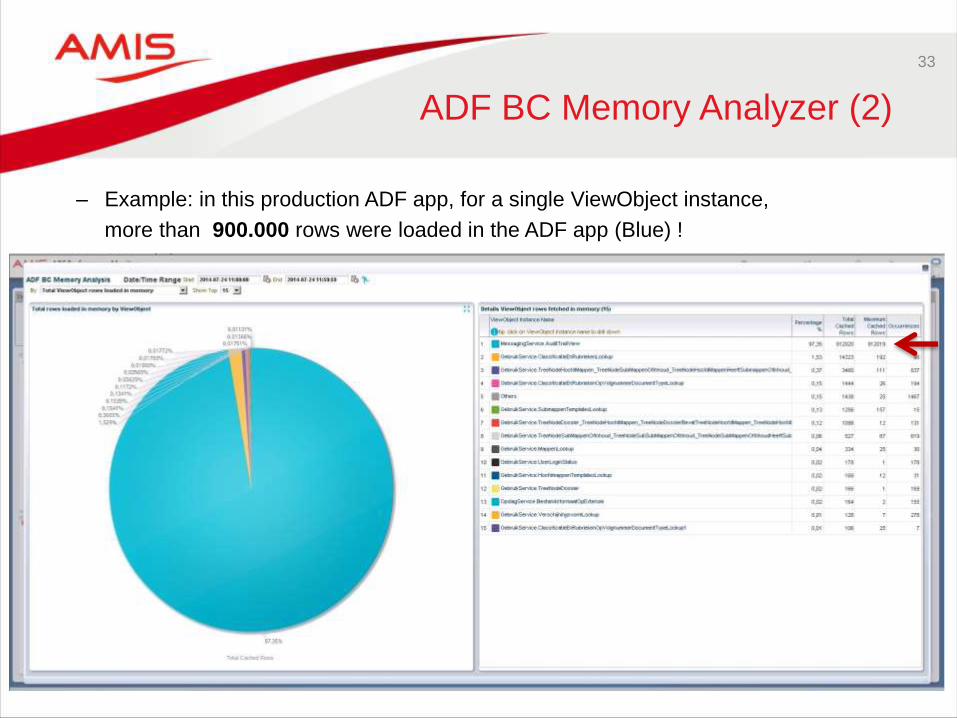
ADF BC Memory Analyzer (2)
– Example: in this production ADF app, for a single ViewObject instance,
more than 900.000 rows were loaded in the ADF app (Blue) !
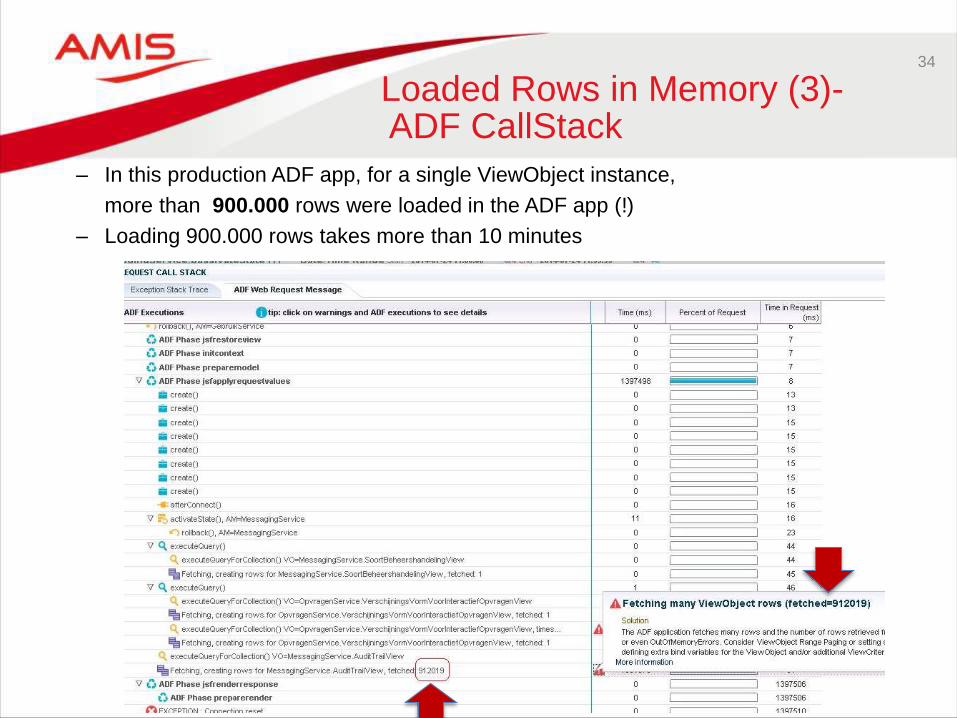
– In this production ADF app, for a single ViewObject instance,
more than 900.000 rows were loaded in the ADF app (!)
– Loading 900.000 rows takes more than 10 minutes
34
Loaded Rows in Memory (3)-ADF CallStack
35
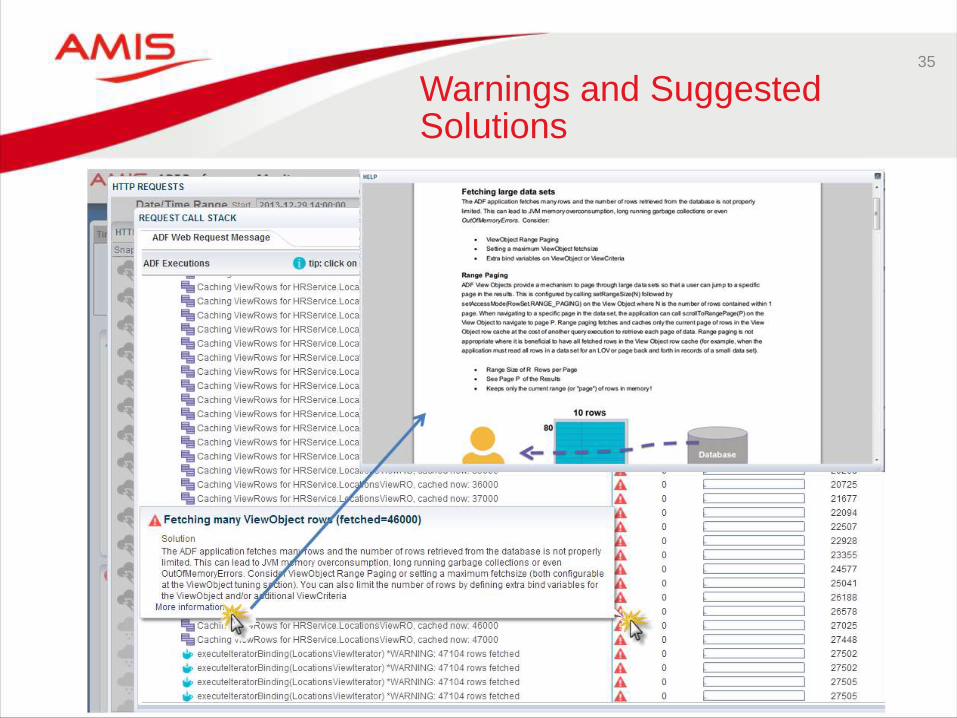
Warnings and Suggested Solutions
36
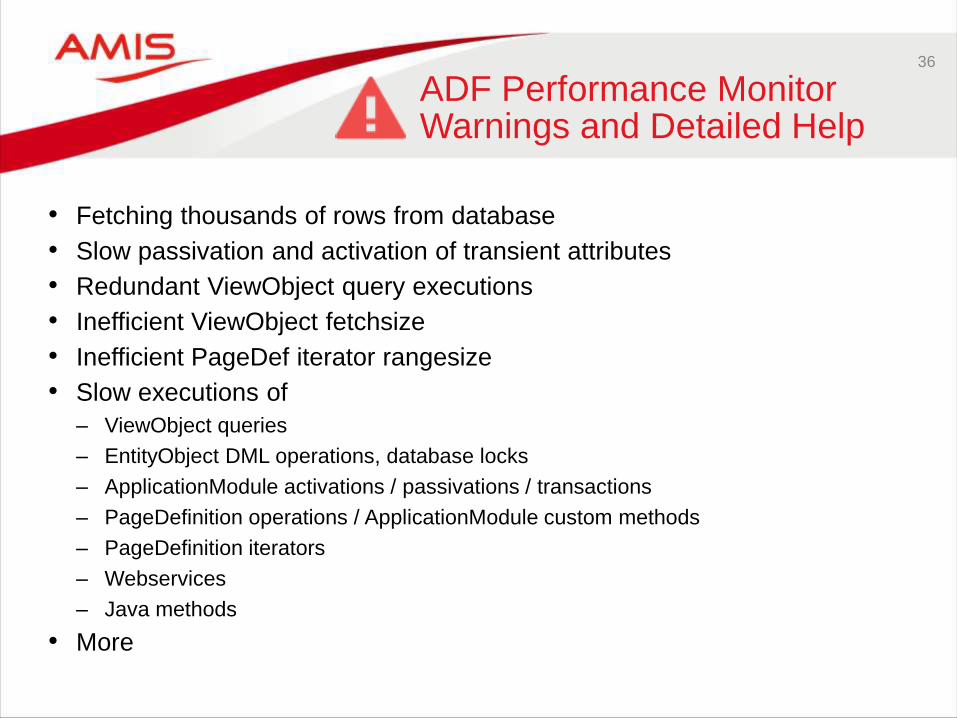
ADF Performance Monitor Warnings and Detailed Help
• Fetching thousands of rows from database
• Slow passivation and activation of transient attributes
• Redundant ViewObject query executions
• Inefficient ViewObject fetchsize
• Inefficient PageDef iterator rangesize
• Slow executions of
– ViewObject queries
– EntityObject DML operations, database locks
– ApplicationModule activations / passivations / transactions
– PageDefinition operations / ApplicationModule custom methods
– PageDefinition iterators
– Webservices
– Java methods
• More
37
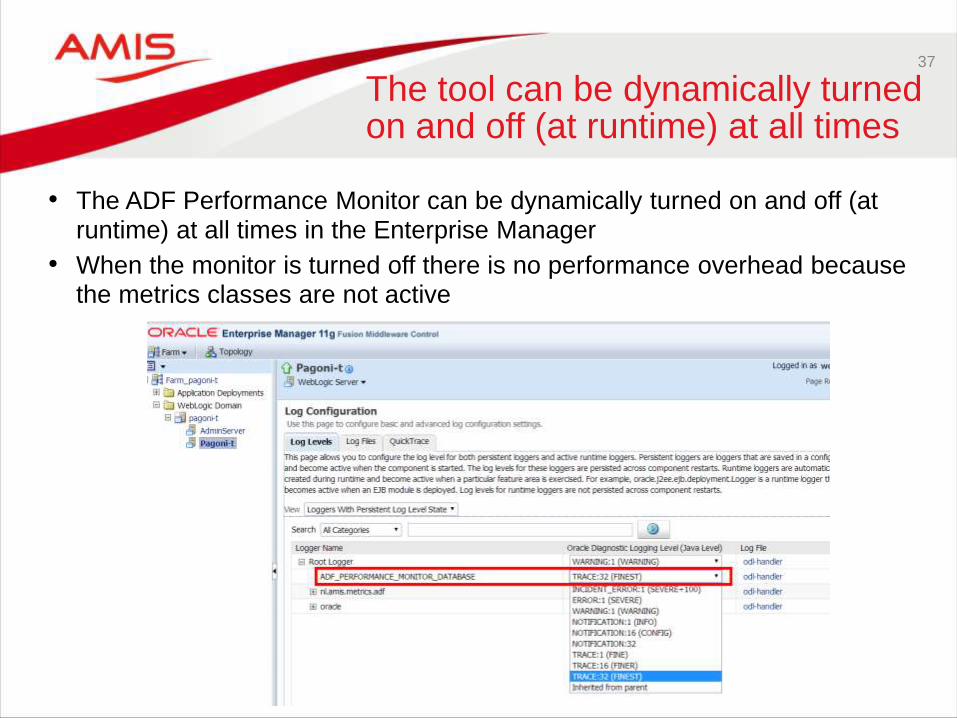
The tool can be dynamically turned on and off (at runtime) at all times
• The ADF Performance Monitor can be dynamically turned on and off (at runtime) at all times in the Enterprise Manager
• When the monitor is turned off there is no performance overhead because the metrics classes are not active
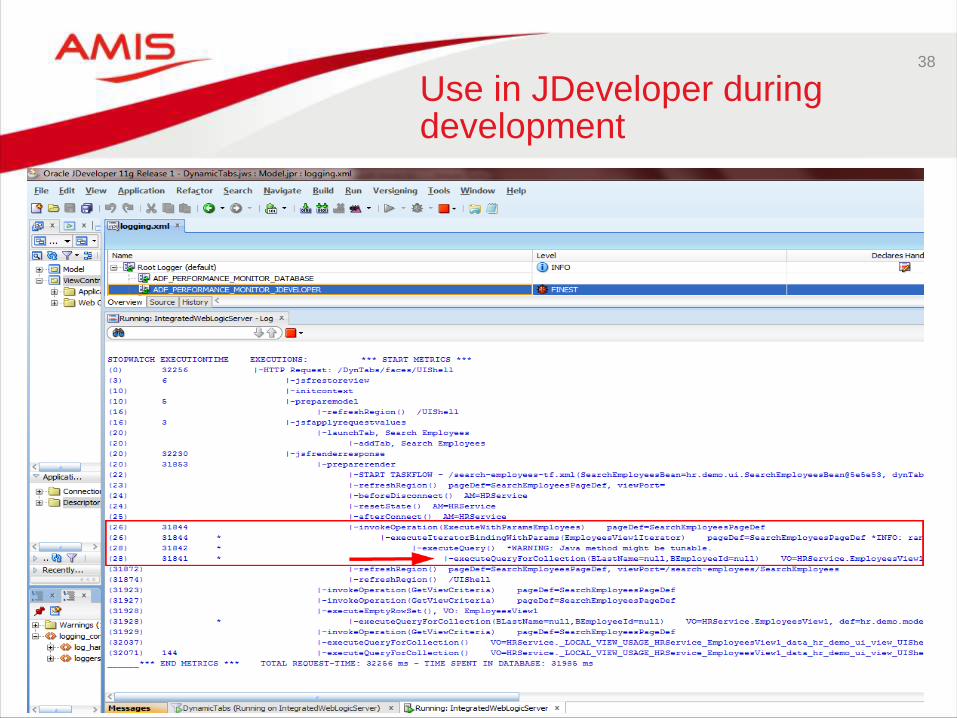
38
Use in JDeveloper during development
39
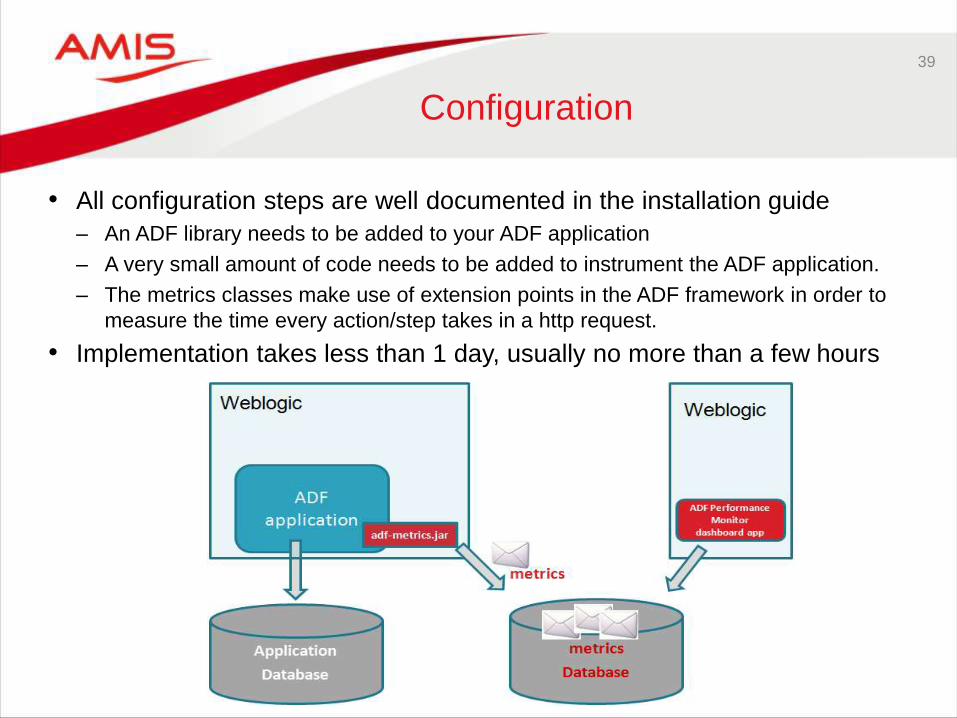
Configuration
• All configuration steps are well documented in the installation guide
– An ADF library needs to be added to your ADF application
– A very small amount of code needs to be added to instrument the ADF application.
– The metrics classes make use of extension points in the ADF framework in order to
measure the time every action/step takes in a http request.
• Implementation takes less than 1 day, usually no more than a few hours
40
Overhead
• Load tests show that the overhead is less than 3 to 4 percent.
• This overhead is caused by the very detailed collection of performance metrics.
• The metrics collection can be dynamically turned on and off (at runtime) at all times.
• When the monitor is turned off there is no performance overhead because the metrics classes are not active.
41
Support
• Standard Oracle stack
– ADF Business Components
– ADF Model
– ADF Controller
– ADF Faces
• JPA/EJB
– EclipseLink/TopLink
• POJO JavaBean DataControl
• JAX-WS Webservices
• It is possible to instrument (calls to) custom Java methods and 3rd party libraries
• Application servers:
– WebLogic
– Glassfish
– Tomcat

42
End-users will be more happy
43
Henri Peters - Project Manager Dutch Ministry of Justice
“For us it is of great value that we can continuously identify the
weakest link, even if there is no actual performance problem (yet)."
“We can even drill down to the level of an individual user.
Sometimes we go so far that we proactively approach end-users:
before they complain we already have contacted them.”
* More quotes of ADF experts and managers at:
http://tinyurl.com/nxgkgr6 or http://www.amis.nl/ADFperformancemonitor
44
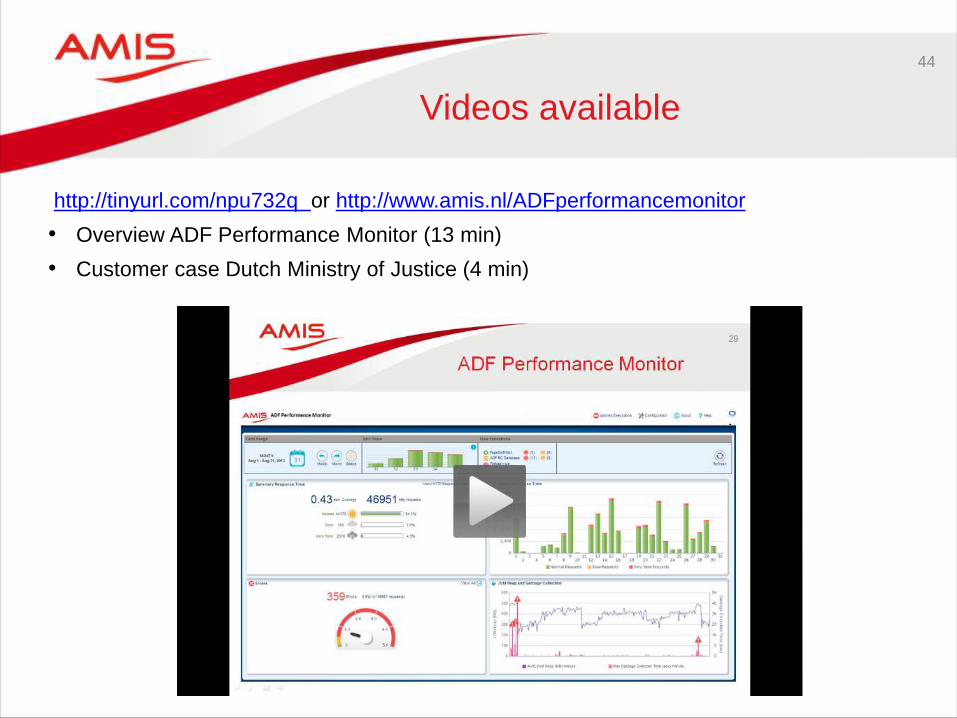
Videos available
http://tinyurl.com/npu732q or http://www.amis.nl/ADFperformancemonitor
• Overview ADF Performance Monitor (13 min)
• Customer case Dutch Ministry of Justice (4 min)

45
Whitepaper
Whitepaper has detailed information about the architecture and implementation
http://tinyurl.com/qgfh22u or http://www.amis.nl/ADFperformancemonitor
Content:Executive overview
Introduction
Oracle ADF applications and performance
ADF Performance Monitor overview
Use in JDeveloper
Use in test and production environment
Dashboard reporting application
Summary and details HTTP response times
ADF framework call stack
Warnings and suggested solutions
Worst performing executions in ADF BC and model layer
Error stacktraces
JVM performance
Product architecture
Configuration
Turn on/off at all times
Prerequisites
Monitored Events
46
More information on
http://www.amis.nl/ADFperformancemonitor
Contact us for more information and pricing.
[email protected] or call +31 30 6016000


