Adhesion-Dependent Modulation of Actin Dynamics in Jurkat T Cells King Lam Hui, 1 Sae In Kwak, 2 and Arpita Upadhyaya 1,3 * 1 Department of Physics, University of Maryland, College Park, Maryland 20742 2 Department of Chemistry and Biochemistry, University of Maryland, College Park, Maryland 20742 3 Institute for Physical Science and Technology, University of Maryland, College Park, Maryland 20742 Received 9 June 2013; Revised 21 October 2013; Accepted 29 October 2013 Monitoring Editor: Pekka Lappalainen Contact formation of T cells with antigen presenting cells results in the engagement of T cell receptors (TCRs), recruitment and aggregation of signaling proteins into microclusters and ultimately, T cell activation. During this process, T cells undergo dramatic changes in cell shape and reorganization of the cytoskeleton. While the impor- tance of the cytoskeleton in T cell activation is well known, the dynamics of the actin cytoskeleton and how it corre- lates with signaling clusters during the early stages of spreading is not well understood. Here, we used total inter- nal reflection fluorescence microscopy to study the dynam- ics of actin reorganization during Jurkat T cell spreading and the role of integrin ligation by the adhesion molecule, vascular cell adhesion molecule (VCAM), in modulating actin dynamics. We found that when T cells spread on anti-CD3 antibody-coated glass surfaces, the cell edge exhibited repeated protrusions and retractions, which were driven by wave like patterns of actin that emerged from signaling microclusters. Addition of VCAM on the activat- ing substrate altered the dynamics of actin both globally and locally, leading to a smooth expansion of the cell edge and the disappearance of waves. Our results suggest that the actin cytoskeleton in Jurkat cells is capable of organiz- ing into spatial patterns initiated by TCR signaling and regulated by integrin signaling. V C 2013 Wiley Periodicals, Inc. Key Words: lymphocytes; actin waves; integrins; total internal reflection fluorescence Introduction C ellular responses to environmental stimuli involve large- scale changes in morphology, primarily driven by reor- ganization of the actin cytoskeleton [Janmey and McCulloch, 2007; Kasza et al., 2007; Kasza and Zallen, 2011]. One strik- ing example of this occurs during cell-cell recognition in immune cells, where T lymphocytes rapidly spread to estab- lish contacts with antigen-presenting cells (APCs) [Monks et al., 1998; Wulfing and Davis, 1998; Grakoui et al., 1999]. These contacts allow T cell receptors (TCRs) to bind antigen molecules displayed on the APC surface. Antigen binding results in the activation of TCRs and the formation of signal- ing microclusters that consist of activated TCR and various downstream signaling molecules [Bunnell et al., 2002; Campi et al., 2005; Douglass and Vale, 2005; Yokosuka et al., 2005; Varma et al., 2006]. TCR activation also ini- tiates signaling pathways, which activate actin nucleation- promoting factors (NPFs) such as WAVE2, HS1, and WASP [Billadeau et al., 2007]. These NPFs in turn activate the Arp2/3 complex, nucleating actin polymerization, which provides the necessary force for membrane deformation, cell spreading, and microcluster transport [Billadeau et al., 2007; Burkhardt et al., 2008; Beemiller and Krummel, 2010; Dus- tin and Groves, 2012]. Previous work demonstrating the importance of the actin cytoskeleton for T cell activation has focused on the later stages of spreading when fully spread cells have established a lamellipodial actin network [Bunnell et al., 2001; Yokosuka et al., 2005; Gomez et al., 2006; Nolz et al., 2006; Kaizuka et al., 2007; Yu et al., 2010; Babich et al., 2012; Beemiller et al., 2012; Smoligovets et al., 2012; Yi et al., 2012]. However, extensive signaling, accompanied by the recruitment of NPFs at nascent microclusters [Barda- Saad et al., 2005] is initiated within a minute of contact [Houtman et al., 2005]. The relationship between Arp2/3- mediated actin dynamics and the spatiotemporal organiza- tion of TCR microclusters during this early phase of spread- ing is not well understood. Arp2/3-nucleated actin polymerization has been intensely studied in many cell types owing to its importance in che- motaxis, cell motility, endocytosis, membrane ruffling, and ventral F-actin waves [Welch and Mullins, 2002; Goley and Welch, 2006; Soderling, 2009]. These studies show that Additional Supporting Information may be found in the online version of this article. *Address correspondence to: Arpita Upadhyaya; Institute for Physi- cal Science and Technology, Bldg. 85, University of Maryland, College Park MD 20742. E-mail: [email protected]Published online 31 December 2013 in Wiley Online Library (wileyonlinelibrary.com). RESEARCH ARTICLE Cytoskeleton, February 2014 71:119–135 (doi: 10.1002/cm.21156) V C 2013 Wiley Periodicals, Inc. 119
Transcript
Adhesion-Dependent Modulation of Actin Dynamics inJurkat T Cells
King Lam Hui,1 Sae In Kwak,2 and Arpita Upadhyaya1,3*1Department of Physics, University of Maryland, College Park, Maryland 207422Department of Chemistry and Biochemistry, University of Maryland, College Park, Maryland 207423Institute for Physical Science and Technology, University of Maryland, College Park, Maryland 20742
Received 9 June 2013; Revised 21 October 2013; Accepted 29 October 2013Monitoring Editor: Pekka Lappalainen
Contact formation of T cells with antigen presenting cellsresults in the engagement of T cell receptors (TCRs),recruitment and aggregation of signaling proteins intomicroclusters and ultimately, T cell activation. During thisprocess, T cells undergo dramatic changes in cell shapeand reorganization of the cytoskeleton. While the impor-tance of the cytoskeleton in T cell activation is well known,the dynamics of the actin cytoskeleton and how it corre-lates with signaling clusters during the early stages ofspreading is not well understood. Here, we used total inter-nal reflection fluorescence microscopy to study the dynam-ics of actin reorganization during Jurkat T cell spreadingand the role of integrin ligation by the adhesion molecule,vascular cell adhesion molecule (VCAM), in modulatingactin dynamics. We found that when T cells spread onanti-CD3 antibody-coated glass surfaces, the cell edgeexhibited repeated protrusions and retractions, which weredriven by wave like patterns of actin that emerged fromsignaling microclusters. Addition of VCAM on the activat-ing substrate altered the dynamics of actin both globallyand locally, leading to a smooth expansion of the cell edgeand the disappearance of waves. Our results suggest thatthe actin cytoskeleton in Jurkat cells is capable of organiz-ing into spatial patterns initiated by TCR signaling andregulated by integrin signaling. VC 2013 Wiley Periodicals, Inc.
Cellular responses to environmental stimuli involve large-scale changes in morphology, primarily driven by reor-
ganization of the actin cytoskeleton [Janmey and McCulloch,2007; Kasza et al., 2007; Kasza and Zallen, 2011]. One strik-ing example of this occurs during cell-cell recognition inimmune cells, where T lymphocytes rapidly spread to estab-lish contacts with antigen-presenting cells (APCs) [Monkset al., 1998; Wulfing and Davis, 1998; Grakoui et al., 1999].These contacts allow T cell receptors (TCRs) to bind antigenmolecules displayed on the APC surface. Antigen bindingresults in the activation of TCRs and the formation of signal-ing microclusters that consist of activated TCR and variousdownstream signaling molecules [Bunnell et al., 2002;Campi et al., 2005; Douglass and Vale, 2005; Yokosukaet al., 2005; Varma et al., 2006]. TCR activation also ini-tiates signaling pathways, which activate actin nucleation-promoting factors (NPFs) such as WAVE2, HS1, and WASP[Billadeau et al., 2007]. These NPFs in turn activate theArp2/3 complex, nucleating actin polymerization, whichprovides the necessary force for membrane deformation, cellspreading, and microcluster transport [Billadeau et al., 2007;Burkhardt et al., 2008; Beemiller and Krummel, 2010; Dus-tin and Groves, 2012]. Previous work demonstrating theimportance of the actin cytoskeleton for T cell activation hasfocused on the later stages of spreading when fully spreadcells have established a lamellipodial actin network [Bunnellet al., 2001; Yokosuka et al., 2005; Gomez et al., 2006; Nolzet al., 2006; Kaizuka et al., 2007; Yu et al., 2010; Babichet al., 2012; Beemiller et al., 2012; Smoligovets et al., 2012;Yi et al., 2012]. However, extensive signaling, accompaniedby the recruitment of NPFs at nascent microclusters [Barda-Saad et al., 2005] is initiated within a minute of contact[Houtman et al., 2005]. The relationship between Arp2/3-mediated actin dynamics and the spatiotemporal organiza-tion of TCR microclusters during this early phase of spread-ing is not well understood.
Arp2/3-nucleated actin polymerization has been intenselystudied in many cell types owing to its importance in che-motaxis, cell motility, endocytosis, membrane ruffling, andventral F-actin waves [Welch and Mullins, 2002; Goley andWelch, 2006; Soderling, 2009]. These studies show that
Additional Supporting Information may be found in the onlineversion of this article.*Address correspondence to: Arpita Upadhyaya; Institute for Physi-
cal Science and Technology, Bldg. 85, University of Maryland,College Park MD 20742. E-mail: [email protected]
Published online 31 December 2013 in Wiley Online Library(wileyonlinelibrary.com).
RESEARCH ARTICLECytoskeleton, February 2014 71:119–135 (doi: 10.1002/cm.21156)VC 2013 Wiley Periodicals, Inc.
119 �
polymerizing actin can form stationary or moving spots, orpropagate as waves under a broad variety of conditions. Inparticular, ventral F-actin waves have been extensivelyobserved in neutrophils [Weiner et al., 2007], Dictyostelium[Vicker, 2002; Bretschneider et al. 2004, 2009; Gerischet al., 2009; Schroth-Diez et al., 2009] and adherent cells[Case and Waterman, 2011] suggesting that the underlyingmechanisms of their formation are largely conserved. Inadherent cells, these actin structures facilitate integrin bind-ing to the extracellular matrix and the assembly of integrin-associated protein clusters, highlighting their potential toorganize membrane receptors and associated signaling pro-teins at cell-substrate contacts. However, despite the engage-ment of a similar complement of actin regulators as othercells, it is not known if T cells exhibit such dynamic struc-tures and whether these play a role in microclusterassembly.
Here, we have used multimodal live cell imaging toquantitatively study the dynamics of actin in relation to sig-naling microclusters during early spreading in Jurkat Tcells. We find that actin organizes into spatiotemporal pat-terns such as traveling waves and spirals, which are drivenby polymerization. We find several distinct features of actinstructures in T cells. First, TCR activation is required fortheir generation. Consequently, we find that the waves arisefrom discrete foci, marked by microclusters. Second, theactin waves in T cells appear to be associated with movingmembrane folds suggesting that a coupling between chemi-cal and mechanical factors is required to generate thesewaves. Finally, these waves appear to be regulated by thelevel of adhesion, as integrin-mediated adhesion to stimula-tory substrates suppressed wave formation, restricting nas-cent actin polymerization to the cell periphery. In additionto global changes in actin dynamics, integrin-mediatedadhesion also altered the assembly and disassembly kineticsof actin in the vicinity of signaling clusters. The alterationsin actin dynamics correlated with changes in amplitudes ofsignaling clusters. Our studies demonstrate an intricate rela-tionship between F-actin dynamics, local signaling, andintegrin-mediated adhesion during activation and spreadingof Jurkat T cells and may have implications for theoreticalmodels of actin dynamics.
Results
Cell Membrane Dynamics during Jurkat T CellSpreading
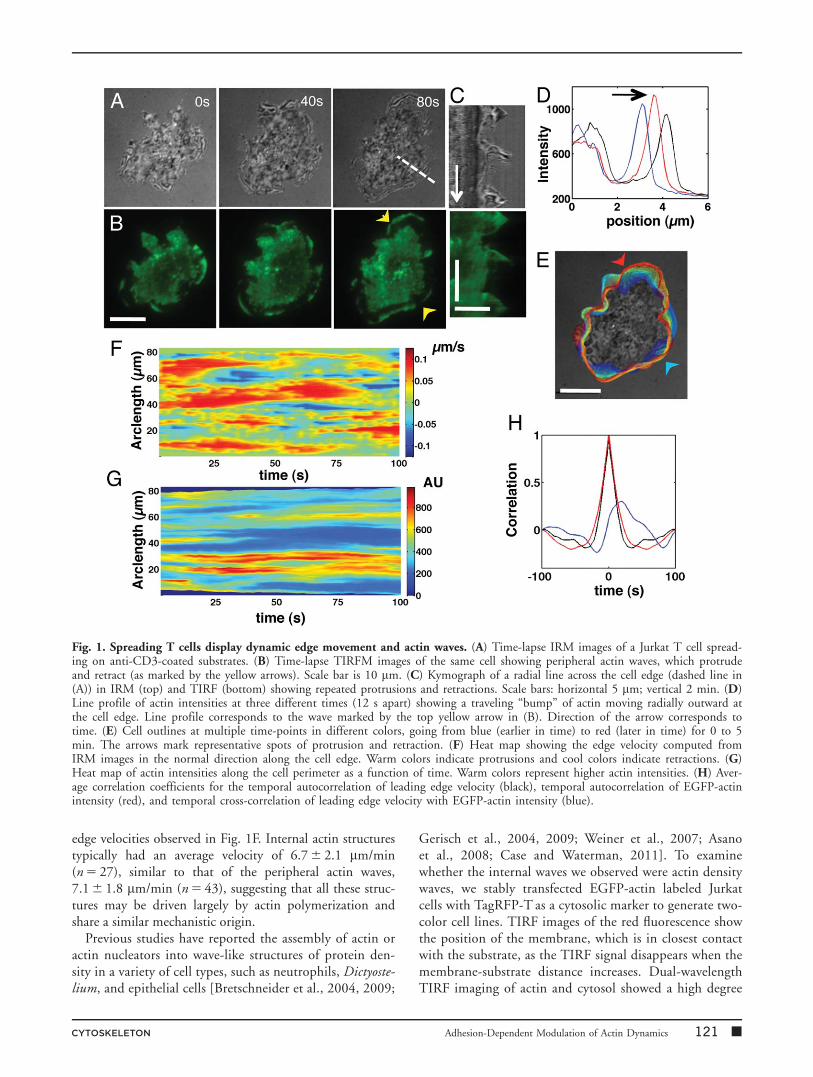
Jurkat T cells expressing EGFP-actin were allowed to con-tact a glass substrate coated with anti-CD3 antibody andimaged with interference reflection microscopy (IRM) andtotal internal reflection fluorescence (TIRF) microscopy.Within seconds of incubation, cells formed contacts withthe coated substrate, which could be identified as fluctuat-ing light and dark IRM patterns and interference rings. Fol-
lowing initial contact, the cells spread, rapidly increasingtheir contact area (Fig. 1A). Simultaneously collected time-lapse TIRF images of EGFP-actin (Fig. 1B) showed thatthe leading edge was associated with radially moving frontsof actin. Figure 1D shows a traveling bump of actin inten-sity at the cell periphery as it moved radially outwards.Kymographs (Fig. 1C) show that the cell edge underwentrepeated protrusions and retractions throughout spreadingbefore establishing a clear lamellipodium, which wasmarked by the formation of a ring of actin and the estab-lishment of retrograde flow. The protrusion-retractionevents were not strictly periodic, and the average time inter-val between successive protrusion peaks was 80 6 17s(N 5 56 intervals from 10 cells). Successive cell contoursextracted from the IRM images (Fig. 1E) also show that thecell edge around the entire cell periphery was dynamic withextensive protrusions and retractions. The time evolution ofthe leading-edge position as obtained from the IRM imageswas tracked using a level-set method [Machacek and Dan-user, 2006] to determine the local protrusion and retractionvelocities normal to the leading edge. A relatively irregularsequence of protrusion and retraction events was observedwith typical velocities on the order of 100–120 nm/s (Fig.1F).
While similar oscillations have been observed in primaryT cells spreading on stimulatory bilayer substrates [Dober-einer et al., 2006], the relationship between actin and edgedynamics is not well understood. To quantify this, we cal-culated the intensity profile of EGFP-actin by summing theintensity of pixels within a 2 mm band around the cell edgeobtained from the IRM images (Fig. 1G). Brighter F-actinintensities appeared to weakly correlate with slower protru-sion velocities while lower intensities were associated withlarger protrusion velocities. To further quantify the relation-ship, we computed auto- and cross-correlations of the edgevelocity and the local actin signal. While the temporal auto-correlation of the leading edge velocity and actin intensityshowed a pronounced dip, the cross-correlation indicated aslight offset of �15 s (Fig. 1H). This indicates that theleading edge velocity peaks several seconds (15 6 4s, n 5 5cells) earlier than the actin intensity, similar to observationsin adherent cells [Ryan et al., 2012a].
Actin Waves during Early Spreading of Jurkat TCells
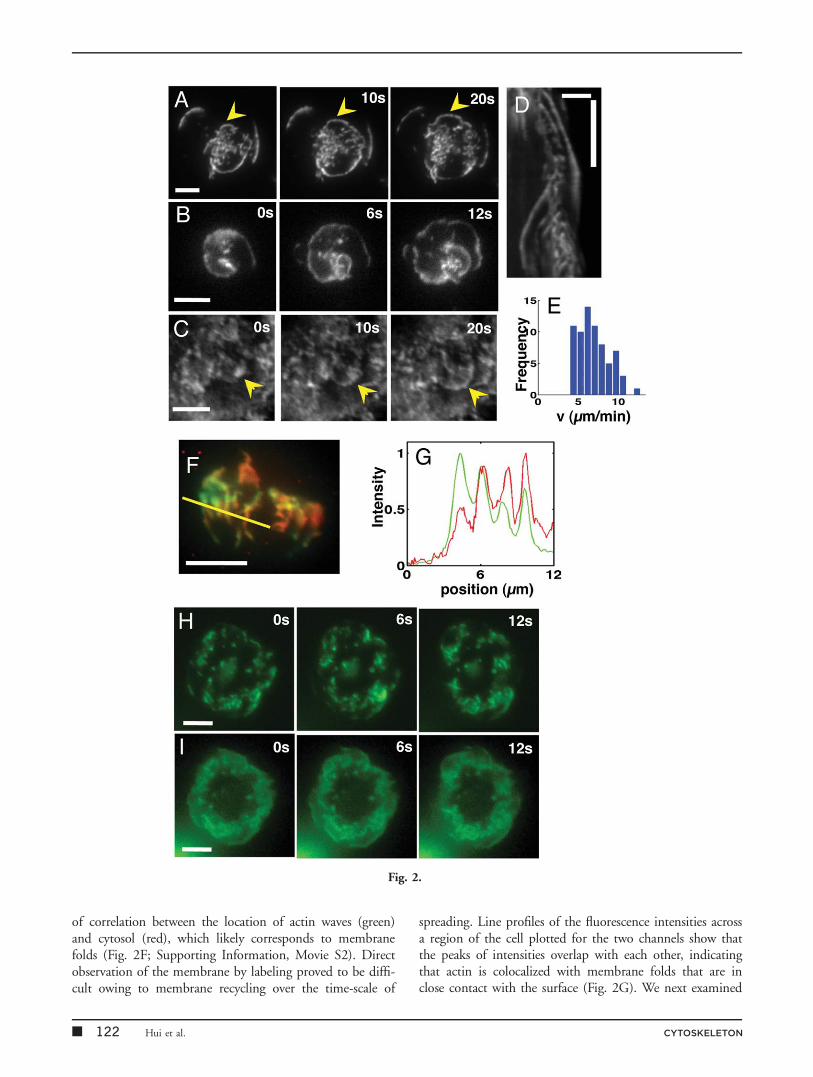
In addition to the peripheral actin waves (Fig. 2A), we alsoobserved dynamic actin structures interior to the cellperiphery, such as traveling waves moving radially outwardsand inwards towards the cell center (Figs. 2B and 2C), aswell as spiral patterns (Fig. 2C; Supporting Information,Movie S1). The movement of these structures was visual-ized as shown in a representative kymograph (Fig. 2D).The average velocity for the entire population was7.1 6 2.0 mm/min (n 5 80, Fig. 2E) consistent with the
� 120 Hui et al. CYTOSKELETON
edge velocities observed in Fig. 1F. Internal actin structurestypically had an average velocity of 6.7 6 2.1 mm/min(n 5 27), similar to that of the peripheral actin waves,7.1 6 1.8 mm/min (n 5 43), suggesting that all these struc-tures may be driven largely by actin polymerization andshare a similar mechanistic origin.
Previous studies have reported the assembly of actin oractin nucleators into wave-like structures of protein den-sity in a variety of cell types, such as neutrophils, Dictyoste-lium, and epithelial cells [Bretschneider et al., 2004, 2009;
Gerisch et al., 2004, 2009; Weiner et al., 2007; Asanoet al., 2008; Case and Waterman, 2011]. To examinewhether the internal waves we observed were actin densitywaves, we stably transfected EGFP-actin labeled Jurkatcells with TagRFP-T as a cytosolic marker to generate two-color cell lines. TIRF images of the red fluorescence showthe position of the membrane, which is in closest contactwith the substrate, as the TIRF signal disappears when themembrane-substrate distance increases. Dual-wavelengthTIRF imaging of actin and cytosol showed a high degree
Fig. 1. Spreading T cells display dynamic edge movement and actin waves. (A) Time-lapse IRM images of a Jurkat T cell spread-ing on anti-CD3-coated substrates. (B) Time-lapse TIRFM images of the same cell showing peripheral actin waves, which protrudeand retract (as marked by the yellow arrows). Scale bar is 10 mm. (C) Kymograph of a radial line across the cell edge (dashed line in(A)) in IRM (top) and TIRF (bottom) showing repeated protrusions and retractions. Scale bars: horizontal 5 mm; vertical 2 min. (D)Line profile of actin intensities at three different times (12 s apart) showing a traveling “bump” of actin moving radially outward atthe cell edge. Line profile corresponds to the wave marked by the top yellow arrow in (B). Direction of the arrow corresponds totime. (E) Cell outlines at multiple time-points in different colors, going from blue (earlier in time) to red (later in time) for 0 to 5min. The arrows mark representative spots of protrusion and retraction. (F) Heat map showing the edge velocity computed fromIRM images in the normal direction along the cell edge. Warm colors indicate protrusions and cool colors indicate retractions. (G)Heat map of actin intensities along the cell perimeter as a function of time. Warm colors represent higher actin intensities. (H) Aver-age correlation coefficients for the temporal autocorrelation of leading edge velocity (black), temporal autocorrelation of EGFP-actinintensity (red), and temporal cross-correlation of leading edge velocity with EGFP-actin intensity (blue).
CYTOSKELETON Adhesion-Dependent Modulation of Actin Dynamics 121 �
of correlation between the location of actin waves (green)and cytosol (red), which likely corresponds to membranefolds (Fig. 2F; Supporting Information, Movie S2). Directobservation of the membrane by labeling proved to be diffi-cult owing to membrane recycling over the time-scale of
spreading. Line profiles of the fluorescence intensities acrossa region of the cell plotted for the two channels show thatthe peaks of intensities overlap with each other, indicatingthat actin is colocalized with membrane folds that are inclose contact with the surface (Fig. 2G). We next examined
Fig. 2.
� 122 Hui et al. CYTOSKELETON
whether for some of the folds the actin peaks correspondedto density waves. We drew evenly spaced radial intensity pro-files (6 per cell, 10 cells) around the cell perimeter and nor-malized the radial intensity profiles for both the actin andTag-RFP channels to their respective local maxima along theprofile and computed the ratio of the relative actin intensityto that of the cytosol. A ratio greater than 1 would indicatean actin density wave. We found that across multiple cells,each radial profile was associated with at least one peak wherethe ratio was greater than 1, that is, the relative actin inten-sity was higher than the relative cytosolic intensity. Acrossthe population, we observed that 50% of the actin peaks hada relative ratio greater than 1 indicating that these were actindensity peaks. In addition to TIRF, we observed actin/mem-brane structures in simultaneously collected epifluorescenceimages (Fig. 2H and Supporting Information, Movie S3),suggesting that these waves were not a proximity artifact ofTIRF imaging. Taken together, these observations suggestthat the observed waves are a mixture of coupled actin-membrane waves as well as actin density waves traveling on aplanar membrane surface. This is consistent with our previ-ous observations using IRM that the membrane topographyat the cell substrate interface is not entirely flat, rather it hasvertical undulations on the order of 25–50 nm that are abouta micron in length [Lam Hui et al., 2012].
We next verified that these actin waves result from TCRactivation at the surface to formally rule out the possibilitythat these structures accompany passive spreading. Weimaged cells spreading on substrates coated with the proad-hesive ligand, anti-CD43, which leads to non-integrinmediated adhesion, without any stimulatory anti-CD3.While cells spread on this surface (though to a smallerextent than on stimulatory antibody), the actin cytoskeletonas imaged in TIRF remained largely uniform with no visi-ble structures such as the propagating waves observed on anactivating surface (Supporting Information, Figs. S1A andS1B). The advance of the cell periphery was slower and notas smooth and efficient as in the presence of stimulatoryantibody. These results suggest that the actin structures aredynamically stabilized membrane folds that require TCRactivation and signaling for their formation andmaintenance.
Actin Dynamics at Signaling Microclusters
TCR activation leads to the formation of signaling micro-clusters and activation of actin polymerization [Barda-Saadet al., 2005; Nolz et al., 2006; Zipfel et al., 2006]. Toexamine the spatial relation between signaling clusters andactin dynamics, we established Jurkat T cell lines stablyexpressing both EYFP-ZAP70 (a tyrosine kinase thatdirectly binds to phosphorylated zeta-chains on activatedTCRs) and TagRFP-T-actin and used dual-wavelengthTIRF microscopy to visualize actin and microclusterdynamics during the early phase of spreading. We foundthat ZAP70 clusters appeared at the very first points ofcontact that the cell makes with the substrate (Fig. 3A).The initial appearance of ZAP70 was associated with anactin cloud, which moved radially outwards as a wave front(Supporting Information, Movie S4). As the cell spread,new clusters were formed at the actin-rich periphery (Sup-porting Information, Movie S4). We next examinedwhether actin waves emerged in the vicinity of newlyformed clusters. Figure 3B shows a single cluster (yellowarrowhead) from the vicinity of which multiple actin wavesemerge. The intensity profiles corresponding to the dashedline at 0 s show the formation of a cluster (arrowhead) andemergence of actin waves (arrow) near the cluster (Fig.3C). This example is representative of at least 30 suchinstances for 20 cells across four independent experiments.A three-color image showing a wave of actin at three suc-cessive time intervals (R, G, and B successively) separatedby 3 s each clearly shows emerging waves (Fig 3D). Figure3E shows the intensity profiles along the dashed yellowline in Fig. 3D with R, G, and B representing threesuccessive times. The dashed lines correspond to ZAP70fluorescence indicating a cluster, and the solid linesrepresent actin intensity. As in Fig. 3C, we note that awave of actin (a bump in the intensity peak) appears closeto the cluster and propagates outward (arrowhead), while asecond wave of actin emerges (arrow). Figure 3F shows athird similar example. Our observations are consistent withFRET experiments showing the accumulation of Arp2/3regulators and Rho-GTPases that lead to actin nucleation[Barda-Saad et al., 2005].
Fig. 2. Spreading Jurkat T cells display membrane coupled actin waves. (A) Time-lapse image of EGFP-actin expressing cell onanti-CD3-coated substrates showing peripheral actin waves. (B) Time-lapse image showing a spiral wave of actin. (C) Time-lapseTIRF images showing internal actin waves. (D) Kymograph showing multiple types of propagating actin structures. The linear streaksof GFP represent traveling waves. (E) Histogram of actin wave velocities across cell populations. The mean velocity is 7.1 6 2.0 mm/min, N 5 80. (F) Dual-wavelength images showing snapshots of a spreading cell with EGFP-labeled actin (green) and TagRFP-T-labeled cytosol (red). A high degree of correlation between the patterns in the red and green channels show that actin is colocalizedwith membrane structures, indicating that waves correspond to membrane folds. (G) Intensity profiles along the line shown in (F) inthe red and green channels show a close correspondence between the peaks in the two colors further demonstrating colocalizationbetween actin and membrane. Horizontal scale bars are 5 mm and vertical scale bar in (D) is 1 min. (H) Time-lapse TIRF images ofEGFP-actin cell showing propagating actin waves. (I) Corresponding epifluorescence images of the same cell showing that waves arevisible in wide field fluorescence as well. Scale bar is 5 mm.
CYTOSKELETON Adhesion-Dependent Modulation of Actin Dynamics 123 �
Distribution of Actin Regulators during EarlySpreading
Studies in neutrophils and Dictyostelium have shown thatventral F-actin waves contain Arp2/3 and its activator, theWAVE complex, suggesting their involvement in stimulat-ing actin treadmilling [Bretschneider et al., 2004; Weineret al., 2007]. To determine whether members of the WAVEcomplex, which link Rac signaling downstream from acti-vated TCRs to actin nucleation [Zipfel et al., 2006] play arole in generation of the actin structures in T cells, we
focused on Abi1. Abi1 is believed to activate actin polymer-ization through its regulation of N-WASP and WAVE[Innocenti et al., 2005]. Previous studies have shown thatAbi1 accumulates at the leading edge of spreading Jurkatcells [Zipfel et al., 2006] but whether it is involved in thegeneration and maintenance of actin waves is not known.We transiently transfected E6-1 Jurkat cells, wildtype or sta-bly expressing TagRFP-T-actin, with EYFP-Abi1 andimaged them on anti-CD3-coated coverslips duringspreading.
Fig. 3. Actin waves at signaling microclusters. (A) Time-lapse TIRF images of cells dual-labeled with EYFP-ZAP70 (green) andTagRFP-T-actin (red) spreading on an anti-CD3-coated substrate at the indicated times. The first three images show waves emergingfrom the earliest clusters. The white arrow at 12 s shows the emergence of a second and third successive actin wave from the sameinitial clusters. Yellow arrowheads show the formation of clusters at the edges of a propagating actin wave. Scale bar: 5 mm. (B) Azoomed in section of a dual labeled cell showing multiple actin waves emerging from a ZAP70 cluster (yellow arrowhead). Scale bar:5 mm. (C) Line profile along the dashed line in panel 1 of (C) with EYFP intensity in green and TagRFP-T intensity in red. Imagesare 6 s apart. Arrowhead in panel 3 marks the appearance of a nascent ZAP70 cluster that grows in intensity. An actin wave emergesfrom the cluster as seen by the appearance of a new peak in actin intensity in the last panel in (C). (D) A pseudocolor image show-ing a wave of actin at three times (R, G, and B successively) separated by 3 s each. The asterisk represents the position of a ZAP70cluster. Scale bar is 5 mm. (E) Intensity profiles of EYFP-ZAP70 fluorescence (dashed lines) and TagRFP-T-actin fluorescence (solidlines) along the dashed yellow line in D with R, G, and B representing three successive times 9 s apart. Arrowhead marks the firstactin wave and arrow marks the second actin wave emerging near the cluster. (F) Intensity profiles along of EYFP-ZAP70 andTagRFP-T-actin fluorescence along another radial section of a cell showing the emergence of actin waves near a cluster.
� 124 Hui et al. CYTOSKELETON
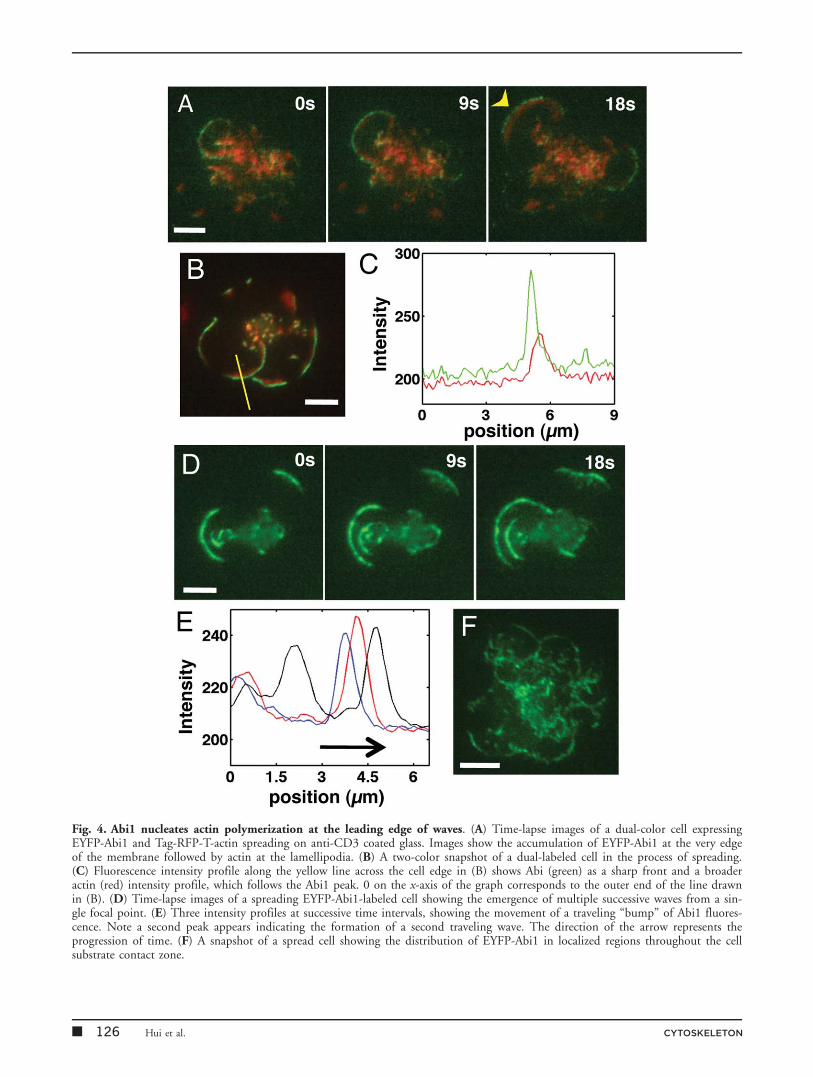
EYFP-Abi1 rapidly accumulated at the leading edge ofspreading cells and localized to a thin region at the tips ofthe advancing lamellipod, followed by actin dense regions(Fig. 4A, Supporting Information, Movie S5). Abi1 waslocalized more proximal to the cell leading edge, as shownby the line profile of Abi1 (green) and actin (red) takenfrom a representative snapshot of a spreading cell (Figs. 4Band 4C). Often multiple fronts of traveling waves wereobserved to originate from the same location and propagateoutwards (Figs. 4D and 4E). The intensity profile showsthe progression of the first wavefront in time and theappearance of a second one. In addition to being localizedat the leading front of waves, Abi1 was observed in discretelocations distributed throughout the cell contact zone inclusters from which the waves emerged (Fig. 4F, SupportingInformation, Movie S6). These results indicate that thestructures that we observe are likely membrane folds thatare dynamically stabilized by Arp-2/3-mediated actin poly-merization activated by the WAVE complex.
Perturbations of the Acto-Myosin Cytoskeleton
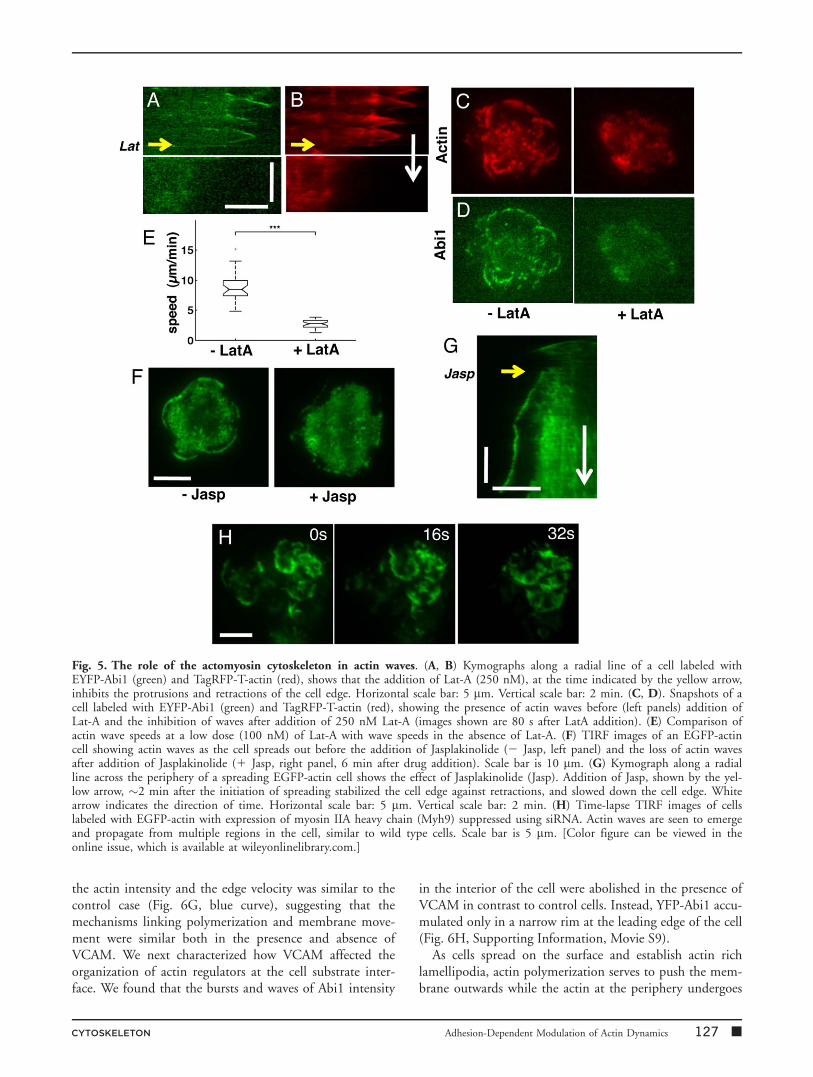
To more directly implicate the active contribution of actinpolymerization to the propagation of these waves, wetreated cells (labeled with EYFP-Abi1 and TagRFP-T-actin)with the drug Latrunculin-A (Lat-A), which sequesters actinmonomers and hence inhibits actin polymerization. Addi-tion of 250 nM or more Lat-A to cells 1–2 min after theinitiation of spreading arrested the leading edge advanceand caused a loss of repeated protrusion/retraction activities(Figs. 5A and 5B). This was accompanied by an overallreduction in the levels of Abi1 and actin fluorescence as theactin and Abi1 waves were disrupted (Figs. 5C and 5D).Low doses of Lat-A (100 nM) reduced the wave speedsfrom 8.8 6 1.9 mm/min (control) to 2.7 6 0.7 mm/min(Fig. 5E), suggesting that actin polymerization drives thewave movement. When cells were treated with 1 mM Jaspla-kinolide (Jasp), which stabilizes actin filaments and inhibitsboth polymerization and depolymerization [Bubb et al.,1994], the peripheral and internal waves were abolished(Fig. 5F). The repeated protrusion and retraction dynamicsof the cell edge was also inhibited in the presence of Jasp.The cell periphery continued to expand outwards but at aslower rate than in the absence of the drug (Fig. 5G). Theseobservations suggest that actin waves are driven by poly-merization and depolymerization of actin originating fromlocalized regions enriched in actin regulatory proteins.
We next examined the role of myosin contractility in thegeneration or propagation of these waves. The primaryform of myosin II present in T cells is myosin IIA with avery small fraction of myosin IIB [Jacobelli et al., 2004;Ilani et al., 2009]. We used siRNA to suppress the expres-sion of myosin IIA heavy chain (Myh9) in EGFP-actinexpressing Jurkat cells. We found that these cells depletedin Myosin IIA activity spread similar to wild-type cells. The
formation, propagation, and duration of actin waves inthese cells were qualitatively similar to wild type cells (Fig.5H, Supporting Information, Movie S7), and the speed ofactin waves was measured to be 8.2 6 3.5 mm/min, not sig-nificantly different from control EGFP-actin cells (P> 0.1,Wilcoxon rank-sum test). Consistent with this, we foundthat addition of 50 mM blebbistatin (an inhibitor of non-muscle myosin IIA activity) to TagRFP-T-actin expressingcells also did not inhibit actin waves.
Vascular Cell Adhesion Molecule Modulates theDynamics of the Cell Membrane and ActinWaves
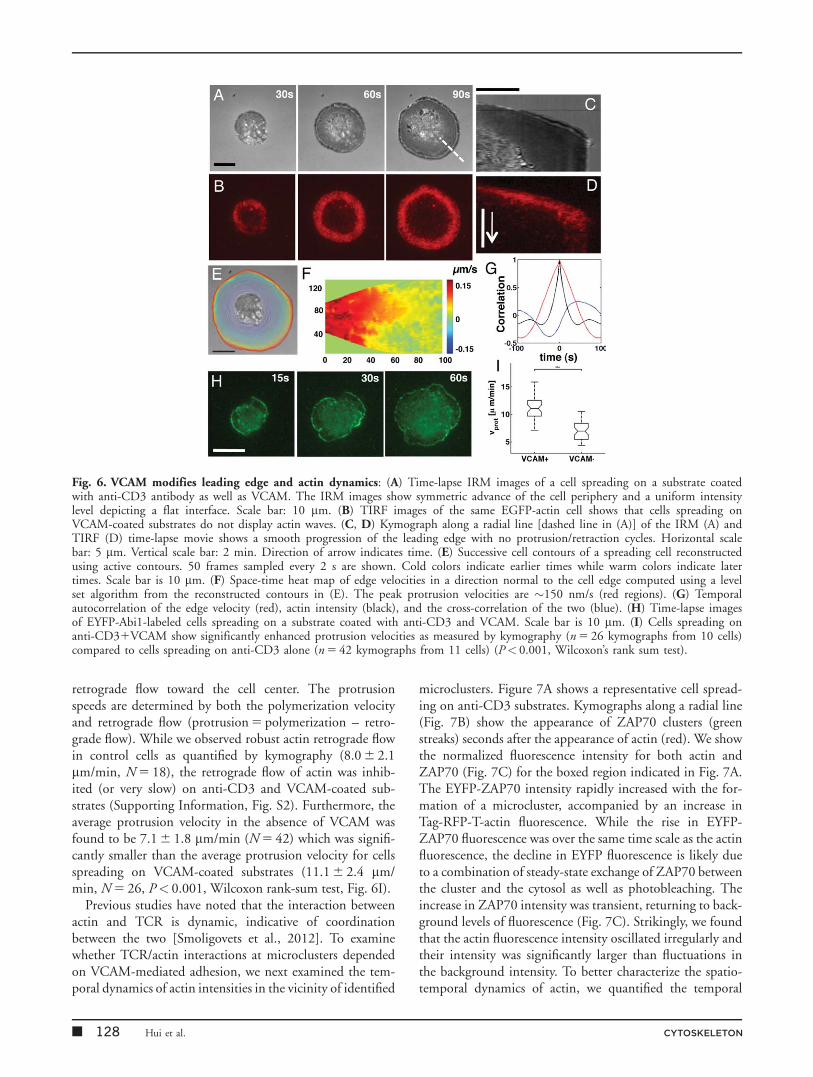
While TCR activation generates rapid signaling, theseevents are transient. Sustained activation of T cells requiresadditional costimulatory signals such as through integrins.In particular, the integrin, VLA-4 (a4b1), facilitates T celladhesion and binding with its ligand vascular cell adhesionmolecule (VCAM)21 leads to costimulation of T cell acti-vation [Udagawa et al., 1996; Doucey et al., 2003; Nguyenet al., 2008]. VLA-4 ligation may regulate actin dynamicsthrough its effect on the adaptor protein, SLP-76 and theRac-GTPase, Vav [Wu et al., 1996; Nguyen et al., 2008].To examine the role of VCAM in actin reorganization andsignaling dynamics during early spreading, we coated glasscoverslips with 5 mg/mL VCAM in addition to 10 mg/mLanti-CD3 antibody. Cells dropped onto these substratesformed contacts as seen in IRM and spread out over thesurface (Fig. 6A). In contrast to control cells, the cellperiphery advanced smoothly outwards without undergoingprotrusions and retractions. Furthermore, the cell substrateinterface was much flatter on VCAM-coated substrates asseen by the uniform gray intensity of the IRM images dif-fering from the control cells that exhibit large variations inIRM intensity at the contact zone. Finally, TIRF imagingshowed a smooth accumulation of actin at lamellipodia,which formed a ring at the periphery as the cell edgeadvanced (Fig. 6B; Supporting Information, Movie S8). Wenoted that the rich dynamics of peripheral and internalactin waves as described for the control case were notobserved in the presence of VCAM. Kymograph analysis ofboth the IRM and TIRF images further emphasized thesmoothness of the edge progression (Figs. 6C and 6D).Data shown are representative of at least 20 cells across fiveindependent experiments.
A plot of successive cell contours showed that the cellperiphery moved out in a uniform manner (Fig. 6E) with-out protrusions and retractions. Accordingly, the heat mapplot of velocities shows a uniform outward protrusion ofthe cell edge (Fig. 6F) but with a larger overall edge velocitycompared to control cells. The temporal autocorrelation(Fig. 6G red curve) of the edge velocity showed a long cor-relation time, consistent with the smooth expansion of thecell edge while the actin intensity (Fig. 6G black curve)became uncorrelated within 20 s. The relationship between
CYTOSKELETON Adhesion-Dependent Modulation of Actin Dynamics 125 �
Fig. 4. Abi1 nucleates actin polymerization at the leading edge of waves. (A) Time-lapse images of a dual-color cell expressingEYFP-Abi1 and Tag-RFP-T-actin spreading on anti-CD3 coated glass. Images show the accumulation of EYFP-Abi1 at the very edgeof the membrane followed by actin at the lamellipodia. (B) A two-color snapshot of a dual-labeled cell in the process of spreading.(C) Fluorescence intensity profile along the yellow line across the cell edge in (B) shows Abi (green) as a sharp front and a broaderactin (red) intensity profile, which follows the Abi1 peak. 0 on the x-axis of the graph corresponds to the outer end of the line drawnin (B). (D) Time-lapse images of a spreading EYFP-Abi1-labeled cell showing the emergence of multiple successive waves from a sin-gle focal point. (E) Three intensity profiles at successive time intervals, showing the movement of a traveling “bump” of Abi1 fluores-cence. Note a second peak appears indicating the formation of a second traveling wave. The direction of the arrow represents theprogression of time. (F) A snapshot of a spread cell showing the distribution of EYFP-Abi1 in localized regions throughout the cellsubstrate contact zone.
� 126 Hui et al. CYTOSKELETON
the actin intensity and the edge velocity was similar to thecontrol case (Fig. 6G, blue curve), suggesting that themechanisms linking polymerization and membrane move-ment were similar both in the presence and absence ofVCAM. We next characterized how VCAM affected theorganization of actin regulators at the cell substrate inter-face. We found that the bursts and waves of Abi1 intensity
in the interior of the cell were abolished in the presence ofVCAM in contrast to control cells. Instead, YFP-Abi1 accu-mulated only in a narrow rim at the leading edge of the cell(Fig. 6H, Supporting Information, Movie S9).
As cells spread on the surface and establish actin richlamellipodia, actin polymerization serves to push the mem-brane outwards while the actin at the periphery undergoes
Fig. 5. The role of the actomyosin cytoskeleton in actin waves. (A, B) Kymographs along a radial line of a cell labeled withEYFP-Abi1 (green) and TagRFP-T-actin (red), shows that the addition of Lat-A (250 nM), at the time indicated by the yellow arrow,inhibits the protrusions and retractions of the cell edge. Horizontal scale bar: 5 mm. Vertical scale bar: 2 min. (C, D). Snapshots of acell labeled with EYFP-Abi1 (green) and TagRFP-T-actin (red), showing the presence of actin waves before (left panels) addition ofLat-A and the inhibition of waves after addition of 250 nM Lat-A (images shown are 80 s after LatA addition). (E) Comparison ofactin wave speeds at a low dose (100 nM) of Lat-A with wave speeds in the absence of Lat-A. (F) TIRF images of an EGFP-actincell showing actin waves as the cell spreads out before the addition of Jasplakinolide (2 Jasp, left panel) and the loss of actin wavesafter addition of Jasplakinolide (1 Jasp, right panel, 6 min after drug addition). Scale bar is 10 mm. (G) Kymograph along a radialline across the periphery of a spreading EGFP-actin cell shows the effect of Jasplakinolide (Jasp). Addition of Jasp, shown by the yel-low arrow, �2 min after the initiation of spreading stabilized the cell edge against retractions, and slowed down the cell edge. Whitearrow indicates the direction of time. Horizontal scale bar: 5 mm. Vertical scale bar: 2 min. (H) Time-lapse TIRF images of cellslabeled with EGFP-actin with expression of myosin IIA heavy chain (Myh9) suppressed using siRNA. Actin waves are seen to emergeand propagate from multiple regions in the cell, similar to wild type cells. Scale bar is 5 mm. [Color figure can be viewed in theonline issue, which is available at wileyonlinelibrary.com.]
CYTOSKELETON Adhesion-Dependent Modulation of Actin Dynamics 127 �
retrograde flow toward the cell center. The protrusionspeeds are determined by both the polymerization velocityand retrograde flow (protrusion 5 polymerization – retro-grade flow). While we observed robust actin retrograde flowin control cells as quantified by kymography (8.0 6 2.1mm/min, N 5 18), the retrograde flow of actin was inhib-ited (or very slow) on anti-CD3 and VCAM-coated sub-strates (Supporting Information, Fig. S2). Furthermore, theaverage protrusion velocity in the absence of VCAM wasfound to be 7.1 6 1.8 mm/min (N 5 42) which was signifi-cantly smaller than the average protrusion velocity for cellsspreading on VCAM-coated substrates (11.1 6 2.4 mm/min, N 5 26, P< 0.001, Wilcoxon rank-sum test, Fig. 6I).
Previous studies have noted that the interaction betweenactin and TCR is dynamic, indicative of coordinationbetween the two [Smoligovets et al., 2012]. To examinewhether TCR/actin interactions at microclusters dependedon VCAM-mediated adhesion, we next examined the tem-poral dynamics of actin intensities in the vicinity of identified
microclusters. Figure 7A shows a representative cell spread-ing on anti-CD3 substrates. Kymographs along a radial line(Fig. 7B) show the appearance of ZAP70 clusters (greenstreaks) seconds after the appearance of actin (red). We showthe normalized fluorescence intensity for both actin andZAP70 (Fig. 7C) for the boxed region indicated in Fig. 7A.The EYFP-ZAP70 intensity rapidly increased with the for-mation of a microcluster, accompanied by an increase inTag-RFP-T-actin fluorescence. While the rise in EYFP-ZAP70 fluorescence was over the same time scale as the actinfluorescence, the decline in EYFP fluorescence is likely dueto a combination of steady-state exchange of ZAP70 betweenthe cluster and the cytosol as well as photobleaching. Theincrease in ZAP70 intensity was transient, returning to back-ground levels of fluorescence (Fig. 7C). Strikingly, we foundthat the actin fluorescence intensity oscillated irregularly andtheir intensity was significantly larger than fluctuations inthe background intensity. To better characterize the spatio-temporal dynamics of actin, we quantified the temporal
Fig. 6. VCAM modifies leading edge and actin dynamics: (A) Time-lapse IRM images of a cell spreading on a substrate coatedwith anti-CD3 antibody as well as VCAM. The IRM images show symmetric advance of the cell periphery and a uniform intensitylevel depicting a flat interface. Scale bar: 10 mm. (B) TIRF images of the same EGFP-actin cell shows that cells spreading onVCAM-coated substrates do not display actin waves. (C, D) Kymograph along a radial line [dashed line in (A)] of the IRM (A) andTIRF (D) time-lapse movie shows a smooth progression of the leading edge with no protrusion/retraction cycles. Horizontal scalebar: 5 mm. Vertical scale bar: 2 min. Direction of arrow indicates time. (E) Successive cell contours of a spreading cell reconstructedusing active contours. 50 frames sampled every 2 s are shown. Cold colors indicate earlier times while warm colors indicate latertimes. Scale bar is 10 mm. (F) Space-time heat map of edge velocities in a direction normal to the cell edge computed using a levelset algorithm from the reconstructed contours in (E). The peak protrusion velocities are �150 nm/s (red regions). (G) Temporalautocorrelation of the edge velocity (red), actin intensity (black), and the cross-correlation of the two (blue). (H) Time-lapse imagesof EYFP-Abi1-labeled cells spreading on a substrate coated with anti-CD3 and VCAM. Scale bar is 10 mm. (I) Cells spreading onanti-CD31VCAM show significantly enhanced protrusion velocities as measured by kymography (n 5 26 kymographs from 10 cells)compared to cells spreading on anti-CD3 alone (n 5 42 kymographs from 11 cells) (P< 0.001, Wilcoxon’s rank sum test).
� 128 Hui et al. CYTOSKELETON
autocorrelation of TagRFP-T-actin intensity fluctuations inthe vicinity of ZAP70 clusters. We found that the meanpixel-wise autocorrelation of the actin intensity fluctuationsin a 1.5 3 1.5 micron region in the vicinity of the clusters.The computed autocorrelation clearly reflected the oscilla-tory nature of actin intensity fluctuations, as it was best fit bya damped cosine function (time constant �30 s) and aperiod of �72s, consistent with the observed edge oscilla-tions (Fig. 7D, black curve). In contrast, the intensity fluctu-
ations in regions with no discernable ZAP70 clusters andlocated away from clusters (Fig. 7D, red curve) showed nolong-range temporal correlations. This pattern of correlationlends further support to our observations that actin oscilla-tions emerge in the vicinity of signaling microclusters.
While VLA-4 ligation resulted in global alterations ofactin dynamics (Fig. 6), it may also have an effect on actindynamics near signaling clusters, by virtue of its effect onSLP-76 signaling [Nguyen et al., 2008]. We therefore
Fig. 7. Actin dynamics near signaling microclusters in the absence and presence of VCAM. (A) Representative image of a cellexpressing EYFP-ZAP70 (green) and TagRFP-T-actin (red) 3 min after plating on anti-CD3 coated substrate. Boxed region shows amicrocluster of ZAP70. (B) Representative kymograph along the radial dashed line in (A) indicating successive actin waves (redstreaks), and clusters being formed at wave edges. Scale bars are: horizontal 5 mm; vertical 2 min. (C) Normalized integrated fluores-cence intensity of ZAP70 (green) and actin (red) for the boxed region in (A) as a function of time. ZAP70 shows a rapid onset coin-cident with the formation of the microcluster. Actin intensity peaks at the same time but shows pronounced oscillations whileZAP70 fluorescence decays over 1 min. (D) Black curve shows the temporal autocorrelation of the actin intensity profile in (C). Redcurve shows the autocorrelation of a region adjacent to the boxed region devoid of ZAP 70 clusters and the shaded regions show the95% confidence interval for the correlation of the background intensity. The dashed line is a best fit to a damped cosine functione2t=scos xt with s 5 30 s and x 5 72 s. The secondary peaks and dips are above the 95% confidence region of the background,indicating significant oscillatory correlations. (E) Representative image of a cell expressing EYFP-ZAP70 and TagRFP-T-actin spread-ing on VCAM and anti-CD3 coated substrate 3 min after plating. (F) A representative kymograph along the radial dashed line showsa smoothly advancing actin-rich lamellipodia (red), and clusters (green) forming at the cell periphery. Scale bars are: horizontal 5mm; vertical 2 min. (G) Normalized integrated fluorescence intensity for ZAP70 (green) and actin (red) for the boxed region shownin (E). (H) Temporal autocorrelation of actin fluorescence region shown in (E): black curve; background region: red and 95% confi-dence interval: pink-shaded region. The fluorescence is best fit by an exponentially decaying function with a time constant of 30 s.(I) TIRF image of a dual-labeled cell spread on a substrate coated with VCAM and anti-CD3 showing EYFP-ZAP70 fluorescence.(J) TIRF image of a dual-labeled cell spread on a substrate coated with anti-CD3 showing EYFP-ZAP70 fluorescence. Scale bar is 5mm for I, J. (K) Cumulative histogram of the ratio of cluster intensity to the mean ZAP70 fluorescence intensity in the cell contactzone for cells on substrates coated with anti-CD3 1 VCAM (blue) and cells on substrates with anti-CD3 alone (red).
CYTOSKELETON Adhesion-Dependent Modulation of Actin Dynamics 129 �
investigated the role of VCAM on the formation of signal-ing microclusters and the associated actin dynamics on sub-strates coated with both VCAM as well as anti-CD3. Thefluorescence intensity of actin around the site of a clusterincreased rapidly as the actin rich periphery advanced intothe region (Figs. 7E and 7F). However, the actin fluores-cence intensity rapidly decreased in time rather than displaythe oscillatory behavior observed in the absence of VCAM(Fig. 7G). Because TagRFP-T is considerably more photo-stable than EYFP [Shaner et al., 2008], this decline isunlikely to be due to photobleaching. A temporal autocor-relation plot of intensity fluctuations showed an exponentialdecay with a characteristic timescale of 30 s (Fig. 7H, blackcurve). Across the population (n 5 15 cells for each sub-strate), we found that the actin intensity fluctuations in cellsspreading on substrates coated with anti-CD3 alone werebetter fit by a damped cosine function, indicative of irregu-lar oscillations in actin intensity, whereas a single exponen-tial served as a better fit for cells spreading on anti-CD31VCAM substrates, suggestive of transient accumula-tions of actin that rapidly dissipated. Note that in bothcases, the actin fluorescence in regions devoid of clustersfluctuated on a much smaller scale around a backgroundvalue. Finally, we examined whether the modulation ofactin dynamics in the presence of VCAM results fromintegrin signaling or enhanced adhesion. We studied cellsspreading on substrates coated with both anti-CD3 andanti-CD43 (a nonstimulatory adhesive ligand). TIRF imag-ing of TagRFP-T-actin and EYFP-ZAP70 showed waves ofactin emerging from ZAP70 microclusters in spreading cells(Supporting Information, Fig. S3). This suggests that themodulation of actin dynamics, including inhibition ofwaves and oscillations, is specific to VCAM and likely atleast in part mediated by signaling downstream of integrins.
Given our observations of differences in actin dynamics inthe vicinity of microclusters on the two types of substrates(anti-CD3 1/2 VCAM), and as actin dynamics is essentialfor proper microcluster assembly [Varma et al., 2006; Babichet al., 2012], we reasoned that the accumulation of signalingmolecules in the microclusters would also be distinct. Toquantify this, we computed the ratio of integrated fluores-cence intensities of ZAP70 clusters (Fig. 7I, J) to the meanfluorescence intensity of the cell-substrate contact zone, aneffective measure of the efficiency of cluster formation. Onanti-CD31 VCAM substrates, on which actin accumulationwas transient, we found that ZAP70 clusters had a signifi-cantly higher intensity ratio, compared to those in cellsspreading on substrates with anti-CD3 alone (Fig. 7K).Given the rough membrane topography of these cells onanti-CD3 alone, TIRF illumination would result in a higherintensity ratio, contrary to what we observe. Thus, it is likelythat the differences are not due to imaging conditions. Thissuggests that the observed differences are due to distinctaccumulation pattern of ZAP70 within the microclustersand correlated with the distinct pattern of actin dynamics.
Discussion
We have used live cell imaging and quantitative analysis tocharacterize actin dynamics during early stages of activationand microcluster formation. We found that actin and theregulatory protein Abi1 organize into rich spatiotemporalpatterns such as traveling waves, moving spots, and spiralsthat originate at signaling microclusters. These structuresrequire actin polymerization and depolymerization for theirmaintenance. Remarkably, these structures only occur whenthe membrane interface is rough, as adhesion to VCAM,which results in a smooth interface, abolished the waves,and actin intensity oscillations. We also found that integrinsignaling resulted in distinct effects on actin dynamics inthe vicinity of microclusters, suggesting the patterning ofthe actin network by TCR signaling may depend on thestimulatory environment. Without integrin engagement,repeated rounds of actin assembly accompanied the forma-tion of microclusters, whereas in the presence of VCAM,actin enrichment was more transient. These differenceswere correlated with the accumulation of signaling proteinsat microclusters, suggesting that actin dynamics may inturn serve to modulate signaling assemblies.
Actin waves have been observed in Dictyostelium[Vicker, 2002; Bretschneider et al., 2004; Gerisch et al.,2004] and in motile neutrophils during chemotaxis[Weiner et al., 2007]. However, the mobile actin struc-tures we have characterized here in Jurkat cells appear tobe distinct from those previously observed. First, TCRactivation is obligatory for the formation of the propagat-ing actin waves, unlike in Dictyostelium where waves aregenerated in the absence of G-protein signaling [Bretsch-neider et al., 2009]. Second, inhibition of actin polymer-ization arrests and disassembles the propagating waves ofAbi1. In contrast, in neutrophils, the accumulation ofHem-1 (a component of the WAVE complex of proteinsin hematopoetic cells) is enhanced on inhibition of actinpolymerization, indicating that actin assembly leads to thedetachment of the Hem-1 complex [Weiner et al., 2007],thus acting as a negative feedback for wave formation andpropagation. Third, actin waves in Jurkat cells appear tobe associated with membrane undulations and correlatedwith moving membrane folds suggesting that a couplingbetween chemical and mechanical factors is required togenerate these waves. Finally, integrin signaling appears toabolish these waves. Previous studies on Jurkat, mouse,and human T cells have not reported such patterns, possi-bly because these studies either focused on well spreadcells in the later stages of spreading or imaged the actinfluorescence using confocal microscopy which has loweraxial resolution than TIRF microscopy [Bunnell et al.,2001; Gomez et al., 2006; Kaizuka et al., 2007; Babichet al., 2012]. Moreover, most studies of T cell spreadingon lipid bilayers used ICAM-1 as an adhesive ligand,which may have suppressed such waves.
� 130 Hui et al. CYTOSKELETON
Modeling studies have suggested that actin-nucleatingfactors and filamentous actin can self-organize to form spa-tiotemporal structures such as waves, spots, and spirals[Gov and Gopinathan, 2006; Shlomovitz and Gov, 2008;Whitelam et al., 2009; Carlsson, 2010; Doubrovinski andKruse, 2011; Ryan et al., 2012b]. Our results place specificconstraints on models that can describe these phenomena.Specifically, given our observations that the membraneundulations at the cell substrate interface are severelyreduced while waves are abolished on VCAM-coated sub-strates, we suggest that the regulation of membrane topog-raphy by adhesion may play a critical role in establishingthese dynamic actin structures. The highly curved regionsof the membrane may accumulate curvature-sensitive acti-vators of Rho-GTPases [Aspenstrom, 2009; Suetsugu andGautreau, 2012]. We hypothesize that the resulting actinpolymerization may sustain or enhance membrane curva-ture, leading to a positive feedback between actin and itsregulators [Rohatgi et al., 2001; Eden et al., 2002]. Mem-brane curvature may also lead to the accumulation of pro-teins that suppress actin regulators [Soderling et al., 2002]providing the negative feedback required for the formationof waves [Ryan et al., 2012b]. Another factor that mightinfluence membrane curvature would be the membranetension [Gov and Gopinathan, 2006; Shlomovitz and Gov,2007]. Large values of tension would suppress membranedeformations, but intermediate values of tension may affectthe wave velocity. Doubrovinski and Kruse [2011] haverecently proposed a unified model that incorporates mem-brane elasticity, adhesion, and a dynamic actin cytoskeletonthat exhibits traveling waves and moving spots of actin den-sities for certain choice of parameters as well as oscillationsof the leading edge in spreading cells. Another model moredirectly linking membrane curvature to waves has beenrecently proposed for circular dorsal ruffles [Peleg et al.,2011]. Extending these models to include adhesion and sig-naling clusters as localized sources of activation may providefurther insights into the actin dynamics in Jurkat T cells.
In addition to actin waves, we also observed dynamicprotrusions and retractions of the cell edge, which weremodulated by the presence of integrin mediated adhesion.Theoretical models of leading edge fluctuations [Ryanet al., 2012b] and propagating actin patterns have impli-cated actin polymerization as the main driver of the protru-sions while the retractions are postulated to arise as a resultof myosin contraction [Shlomovitz and Gov, 2007], globaldepolymerization, or the inhibition of actin nucleators byF-actin [Carlsson, 2012; Holmes et al., 2012]. However,the involvement of cell-substrate adhesion in the generationof the protrusion-retraction cycle is not very clear. Wolge-muth [2005] proposed a stick-slip model wherein contrac-tion triggered by the buildup of osmotic stress resultingfrom actin depolymerization is opposed by cell-substrateadhesion. Weakly adhesive substrates offer minimal resist-ance resulting in the slippage of the cell edge, whereas
stronger adhesion keeps the leading edge in place while theactin gel reassembles. Accordingly, we find that the a4b1
integrin ligand, VCAM, leads to a persistent expansion ofthe cell edge, lending support to this model. Also consistentwith the model, stabilization of the actin filaments againstdepolymerization by Jasplakinolide abolishes the edgeretraction and leads to a stably moving lamellipodium atslightly reduced velocities. These differences may contributeto hematopoetic cell function. Thymocytes expressingVLA-4 exhibit less-centralized multifocal synapses [Bala-muth et al., 2001; Leitenberg et al., 2001; Hailman et al.,2002], which may result from differences in actin dynam-ics. Similarly, VLA-4/VCAM ligation allows leukocytes tostabilize adhesion and resist detachment forces in an actin-dependent manner [Rullo et al., 2012]. Consistent withthis, we found that the protrusion velocity was enhancedwhile actin retrograde flow was dramatically reduced onVLA-4/VCAM ligation. We suggest that similar to otheradherent cells, integrins may provide a “clutch” like mecha-nism, which when engaged, can utilize all the force gener-ated by actin polymerization to drive protrusion [Pontiet al., 2005; Hu et al., 2007].
The central role played by the actin cytoskeleton in Tcell signaling has been demonstrated by pharmacological,physical, and genetic perturbations [Yu et al., 2013]. Col-lectively, these studies suggest that a dynamic actin networkis required for effective TCR-ligand interaction as well asthe formation and transport of kinases, scaffolds, and otherproteins into micron-sized signaling assemblies around acti-vated TCRs, but the coordinated behavior of the cytos-keletal network and signaling components is not wellunderstood. Our quantitative analysis of actin dynamicsduring the very early stages of junction formation betweena T lymphocyte and a stimulatory surface shows that thesignaling microclusters intricately regulate actin dynamicsboth locally, in the vicinity of the cluster, and globallyacross the entire cell. A combination of TCR stimulationand VLA-4 mediated integrin signaling (costimulation)potentially creates an optimal balance of actin dynamicsand signaling activation. Our results show that the actincytoskeleton and regulatory proteins in Jurkat T cells cou-ple with membrane undulations to lead to traveling waves,which are modulated by TCR and integrin signaling duringactivation. The dynamic edge oscillations under conditionsof low adhesion and the actin coupled membrane wavesmay be helpful in the search for antigens on the relativelyrough surface of an antigen presenting cell.
Materials and Methods
Cell Culture and Reagents
E6-1 Jurkat T cells (WT, stably transfected with EGFP-actin, Zap70-EYFP) were a gift from the lab of L. Samelson(NCI, NIH). TagRFP-T sequence was cloned from pcass
CYTOSKELETON Adhesion-Dependent Modulation of Actin Dynamics 131 �
TagRFP-T (a gift from Dr. Morgan Huse, Rockefeller) intopEGFP-actin (Clontech, Mountain View, CA), using NheIand BspEI restrictions, to create pTagRFP-T-actin. Theresultant construct was then digested by NotI and BamHIand cloned into Z4-MSCV-TagRFP-T (a gift from Dr.Morgan Huse, Rockefeller) to create Z4-MSCV-TagRFP-T-actin, allowing retroviral bicistronic expression of TagRFP-T-actin and a zeocin resistant gene. Retroviruses were gener-ated according to standard protocol with Phoenix Ampho-tropic cells and were transduced into Jurkat cells by spininfection. The cells were then selected in 200 mg/mL zeocinfor 2 weeks, and sorted with FACS to obtain high expres-sion clones. Monoclonal cell lines were finally generated bylimiting dilution of the sorted polyclonal population.TagRFP-T was introduced into WT E6-1 cells to generateTagRFP-T-actin cell line, and into Zap70-EYFP E6-1 cellsto generate stable dual-color cell lines. pEYFP-Abi1 was akind gift of Dr. Orion Weiner (UCSF). The plasmid waselectroporated into E6-1 cells according to manufacturer’sinstructions.
E6-1 Jurkat T cells were cultured using standard proto-cols [Bunnell et al., 2001; Barda-Saad et al., 2005; Nguyenet al., 2008]. Briefly, cells were grown in RPMI 1640medium supplemented with 10% fetal bovine serum at37�C in a CO2 incubator. Before imaging, 1 mL of cellswas centrifuged at 240 3 g for 5 min. The supernatant wasremoved and the cells were resuspended in imaging buffersimilar to published protocols (4, 11; L-15 CO2-independ-ent medium, Invitrogen, Carlsbad, CA supplemented with10% FBS). For drug inhibitions and treatments, the appro-priate amount of reagent: Latrunculin-A, Jasplakinolide,and Blebbistatin (all purchased from Sigma-Aldrich, St.Louis, MO) was added to the imaging buffer. Cells wereincubated at 37�C for 10 min before imaging.
Substrate Preparation and Imaging
Chambered coverslips were cleaned with 1 M HCl and70% Ethanol for 30 min and dried at 37�C for 1 h. Cham-bers were treated for 10 min with 0.01% (weight/volume)poly-L-lysine solution (Sigma-Aldrich, St. Louis, MO),drained and dried for 1 h at 37�C. Chambers were coatedwith 10 mg/mL anti-CD3 antibody (Hit-3a, eBiosciences,San Diego, CA) for 2 h at 37�C. Excess antibody wasremoved by extensive washing with PBS. For coating withintegrin ligands, VCAM was added to the dish at the indi-cated concentrations after antibody coating was completed.Cells were seeded on to chambers in the appropriate imag-ing medium. Fluorescence and IRM images were collectedusing an inverted microscope (TE2000 PFS, Nikon, Mel-ville, NY) with a cooled CCD camera (Coolsnap HQ2,Photometrics, Tucson, AZ). TIRF imaging was done with a60 3 1.49 NA objective lens, a 491-nm laser (100 mW,Andor, South Windsor, CT) for EGFP/EYFP excitationand a 561-nm laser (75 mW, Andor) for Tag-RFP excita-
tion. Typical exposure times used for TIRF imaging was200 ms, and time intervals for movies ranged from 1 to 3 sbetween frames.
Image Analysis
Cell Boundary Extraction
Cell boundaries were extracted using techniques detailedearlier [Lam Hui et al., 2012]. An active contour (snakealgorithm) was applied to perform curvature-drivensmoothing of the perimeter of the binary image and anyself-intersections were removed.
Calculation of Edge Velocities
The level-set method offers a powerful way to extract lead-ing edge normal velocities from successively sampled cellcontours, while ensuring that the computed contours andedge velocities are topologically accurate [Machacek andDanuser, 2006]. However, high spatial resolution of imagesrequires the solution of hyperbolic partial differential equa-tions on very fine spatial grids, which can be computation-ally prohibitive. We used a simplified version of theMachacek–Danuser algorithm while maintaining the basiclevel set framework. First, coarse distance maps, whichassign the distance of every grid point from successivelysampled cell contours at time t and t 1 dt were computedusing the MATLAB (Mathworks, Natick, MA) functionbwdist. A signed distance map was computed from the dif-ference of these two distance functions using the fastmarching method [Sethian, 1999]. A reinitialization proce-dure was performed to ensure that the signed distance mapremained a true distance function. The resulting distancemap is the normal distance from the contour at time t tothat at t1dt, that is, the amount that marker points on thecontour at t need to be advected by in order to lie on thenext contour. We ensured that the Frobenius norm r of thedifference between the distance function computed fromthe advected marker points (the computed contour at t1dt)and the original contour at t1dt lay below a fixed thresh-old. As a cross-check, we verified that the direct solution ofthe level set PDEs using a fourth-order total variationdiminishing Runge–Kutta scheme [Osher and Fedkiw,2003] using a speed function computed above yielded simi-lar results to our simplified procedure.
Actin Intensity Correlations
For analysis of ZAP70 clusters, the image was denoisedusing Wiener filtering and clusters were isolated using theatrous wavelet algorithm [Jaqaman et al., 2008]. A five-point rolling average was used to detrend the data. The pix-elwise autocorrelation of the temporal intensity fluctuationswas computed for an 11 3 11 pixel (1.2 mm2) regionaround cluster centroids and averaged. For each cell, 20–50clusters were used for the computation. A similar windowwas placed over regions with no identified ZAP70 clusters
� 132 Hui et al. CYTOSKELETON
to calculate temporal autocorrelations in sites with no TCRsignaling. Jacknife statistics (33 variance of leave-one-out�95% confidence interval) were used to generate confi-dence intervals for autocorrelation functions.
Acknowledgments
The authors thank L. Samelson for providing the cell linesused here and useful discussions, Lakshmi Balagopalan-Bhise for help with the cell culture protocols, and PayamFathi for technical assistance. This work was supported bythe NSF (Grant numbers 1121710 and 1206060 to AU).
References
Asano Y, Nagasaki A, Uyeda TQ. 2008. Correlated waves of actinfilaments and PIP3 in Dictyostelium cells. Cell Motil Cytoskeleton65(12):923–934.
Aspenstrom P. 2009. Roles of F-BAR/PCH proteins in the regula-tion of membrane dynamics and actin reorganization. Int Rev CellMol Biol 272:1–31.
Babich A, Li S, O’Connor RS, Milone MC, Freedman BD,Burkhardt JK. 2012. F-actin polymerization and retrograde flowdrive sustained PLCgamma1 signaling during T cell activation. JCell Biol 197(6):775–787.
Balamuth F, Leitenberg D, Unternaehrer J, Mellman I, Bottomly K.2001. Distinct patterns of membrane microdomain partitioning inTh1 and th2 cells. Immunity 15(5):729–738.
Barda-Saad M, Braiman A, Titerence R, Bunnell SC, Barr VA,Samelson LE. 2005. Dynamic molecular interactions linking the Tcell antigen receptor to the actin cytoskeleton. Nat Immunol 6(1):80–89.
Beemiller P, Krummel MF. 2010. Mediation of T-cell activation byactin meshworks. Cold Spring Harb Perspect Biol 2(9):a002444.
Beemiller P, Jacobelli J, Krummel MF. 2012. Integration of themovement of signaling microclusters with cellular motility inimmunological synapses. Nat Immunol 13(8):787–795.
Billadeau DD, Nolz JC, Gomez TS. 2007. Regulation of T-cellactivation by the cytoskeleton. Nat Rev Immunol 7(2):131–143.
Bretschneider T, Diez S, Anderson K, Heuser J, Clarke M, Muller-Taubenberger A, Kohler J, Gerisch G. 2004. Dynamic actin pat-terns and Arp2/3 assembly at the substrate-attached surface ofmotile cells. Curr Biol 14(1):1–10.
Bretschneider T, Anderson K, Ecke M, Muller-Taubenberger A,Schroth-Diez B, Ishikawa-Ankerhold HC, Gerisch G. 2009. Thethree-dimensional dynamics of actin waves, a model of cytoskeletalself-organization. Biophys J 96(7):2888–2900.
Bubb MR, Senderowicz AM, Sausville EA, Duncan KL, Korn ED.1994. Jasplakinolide, a cytotoxic natural product, induces actinpolymerization and competitively inhibits the binding of phalloidinto F-actin. J Biol Chem 269(21):14869–14871.
Bunnell SC, Kapoor V, Trible RP, Zhang W, Samelson LE. 2001.Dynamic actin polymerization drives T cell receptor-inducedspreading: a role for the signal transduction adaptor LAT. Immunity14(3):315–329.
Bunnell SC, Hong DI, Kardon JR, Yamazaki T, McGlade CJ, BarrVA, Samelson LE. 2002. T cell receptor ligation induces the forma-tion of dynamically regulated signaling assemblies. J Cell Biol158(7):1263–1275.
Burkhardt JK, Carrizosa E, Shaffer MH. 2008. The actin cytoskele-ton in T cell activation. Annu Rev Immunol 26:233–259.
Campi G, Varma R, Dustin ML. 2005. Actin and agonist MHC-peptide complex-dependent T cell receptor microclusters as scaffoldsfor signaling. J Exp Med 202(8):1031–1036.
Carlsson AE. 2010. Dendritic actin filament nucleation causes trav-eling waves and patches. Phys Rev Lett 104(22):228102.
Case LB, Waterman CM. 2011. Adhesive F-actin waves: a novelintegrin-mediated adhesion complex coupled to ventral actin poly-merization. PLoS One 6(11):e26631.
Doubrovinski K, Kruse K. 2011. Cell motility resulting from spon-taneous polymerization waves. Phys Rev Lett 107(25):258103.
Doucey MA, Legler DF, Faroudi M, Boucheron N, BaumgaertnerP, Naeher D, Cebecauer M, Hudrisier D, Ruegg C, Palmer E,et al.2003. The beta1 and beta3 integrins promote T cell receptor-mediated cytotoxic T lymphocyte activation. J Biol Chem 278(29):26983–26991.
Douglass AD, Vale RD. 2005. Single-molecule microscopy revealsplasma membrane microdomains created by protein-protein net-works that exclude or trap signaling molecules in T cells. Cell121(6):937–950.
Dustin ML, Groves JT. 2012. Receptor signaling clusters in theimmune synapse. Annu Rev Biophys 41:543–556.
Eden S, Rohatgi R, Podtelejnikov AV, Mann M, Kirschner MW.2002. Mechanism of regulation of WAVE1-induced actin nuclea-tion by Rac1 and Nck. Nature 418(6899):790–793.
Gerisch G, Bretschneider T, Muller-Taubenberger A, Simmeth E,Ecke M, Diez S, Anderson K. 2004. Mobile actin clusters and trav-eling waves in cells recovering from actin depolymerization. BiophysJ 87(5):3493–3503.
Gerisch G, Ecke M, Schroth-Diez B, Gerwig S, Engel U, MadderaL, Clarke M. 2009. Self-organizing actin waves as planar phagocyticcup structures. Cell Adh Migr 3(4):373–382.
Goley ED, Welch MD. 2006. The ARP2/3 complex: an actinnucleator comes of age. Nat Rev Mol Cell Biol 7(10):713–726.
Gomez TS, McCarney SD, Carrizosa E, Labno CM, ComiskeyEO, Nolz JC, Zhu P, Freedman BD, Clark MR, Rawlings DJ,et al. 2006. HS1 functions as an essential actin-regulatory adaptorprotein at the immune synapse. Immunity 24(6):741–752.
Gov NS, Gopinathan A. 2006. Dynamics of membranes driven byactin polymerization. Biophys J 90(2):454–469.
Grakoui A, Bromley SK, Sumen C, Davis MM, Shaw AS, AllenPM, Dustin ML. 1999. The immunological synapse: a molecularmachine controlling T cell activation. Science 285(5425):221–227.
Hailman E, Burack WR, Shaw AS, Dustin ML, Allen PM. 2002.Immature CD4(1)CD8(1) thymocytes form a multifocal immu-nological synapse with sustained tyrosine phosphorylation. Immu-nity 16(6):839–848.
Holmes WR, Carlsson AE, Edelstein-Keshet L. 2012. Regimes of wavetype patterning driven by refractory actin feedback: transition fromstatic polarization to dynamic wave behaviour. Phys Biol 9(4):046005.
Houtman JC, Houghtling RA, Barda-Saad M, Toda Y, SamelsonLE. 2005. Early phosphorylation kinetics of proteins involved inproximal TCR-mediated signaling pathways. J Immunol 175(4):2449–2458.
CYTOSKELETON Adhesion-Dependent Modulation of Actin Dynamics 133 �
Hu K, Ji L, Applegate KT, Danuser G, Waterman-Storer CM.2007. Differential transmission of actin motion within focal adhe-sions. Science 315(5808):111–115.
Ilani T, Vasiliver-Shamis G, Vardhana S, Bretscher A, Dustin ML.2009. T cell antigen receptor signaling and immunological synapsestability require myosin IIA. Nat Immunol 10(5):531–539.
Innocenti M, Gerboth S, Rottner K, Lai FP, Hertzog M, StradalTE, Frittoli E, Didry D, Polo S, Disanza A, et al. 2005. Abi1 regu-lates the activity of N-WASP and WAVE in distinct actin-basedprocesses. Nat Cell Biol 7(10):969–976.
Jacobelli J, Chmura SA, Buxton DB, Davis MM, Krummel MF.2004. A single class II myosin modulates T cell motility and stop-ping, but not synapse formation. Nat Immunol 5(5):531–538.
Janmey PA, McCulloch CA. 2007. Cell mechanics: integrating cellresponses to mechanical stimuli. Annu Rev Biomed Eng 9:1–34.
Jaqaman K, Loerke D, Mettlen M, Kuwata H, Grinstein S, SchmidSL, Danuser G. 2008. Robust single-particle tracking in live-celltime-lapse sequences. Nature methods 5(8):695–702.
Kaizuka Y, Douglass AD, Varma R, Dustin ML, Vale RD. 2007.Mechanisms for segregating T cell receptor and adhesion moleculesduring immunological synapse formation in Jurkat T cells. ProcNatl Acad Sci USA 104(51):20296–20301.
Kasza KE, Zallen JA. 2011. Dynamics and regulation of contractileactin-myosin networks in morphogenesis. Curr Opin Cell Biol23(1):30–38.
Kasza KE, Rowat AC, Liu J, Angelini TE, Brangwynne CP,Koenderink GH, Weitz DA. 2007. The cell as a material. CurrOpin Cell Biol 19(1):101–107.
Lam Hui K, Wang C, Grooman B, Wayt J, Upadhyaya A. 2012.Membrane dynamics correlate with formation of signaling clustersduring cell spreading. Biophys J 102(7):1524–1533.
Leitenberg D, Balamuth F, Bottomly K. 2001. Changes in the Tcell receptor macromolecular signaling complex and membranemicrodomains during T cell development and activation. SeminImmunol 13(2):129–138.
Machacek M, Danuser G. 2006. Morphodynamic profiling of pro-trusion phenotypes. Biophys J 90(4):1439–1452.
Monks CR, Freiberg BA, Kupfer H, Sciaky N, Kupfer A. 1998.Three-dimensional segregation of supramolecular activation clustersin T cells. Nature 395(6697):82–86.
Nguyen K, Sylvain NR, Bunnell SC. 2008. T cell costimulation viathe integrin VLA-4 inhibits the actin-dependent centralization ofsignaling microclusters containing the adaptor SLP-76. Immunity28(6):810–821.
Nolz JC, Gomez TS, Zhu P, Li S, Medeiros RB, Shimizu Y,Burkhardt JK, Freedman BD, Billadeau DD. 2006. The WAVE2complex regulates actin cytoskeletal reorganization and CRAC-mediated calcium entry during T cell activation. Curr Biol 16(1):24–34.
Osher S, Fedkiw RP. 2003. Level Set Methods and DynamicImplicit Surfaces. New York: Springer. xiii, 273 p., 16 p. of platesp.
Peleg B, Disanza A, Scita G, Gov N. 2011. Propagating cell-membrane waves driven by curved activators of actin polymeriza-tion. PLoS One 6(4):e18635.
Ponti A, Matov A, Adams M, Gupton S, Waterman-Storer CM,Danuser G. 2005. Periodic patterns of actin turnover in lamellipo-dia and lamellae of migrating epithelial cells analyzed by quantita-tive Fluorescent Speckle Microscopy. Biophys J 89(5):3456–3469.
Rohatgi R, Nollau P, Ho HY, Kirschner MW, Mayer BJ. 2001.Nck and phosphatidylinositol 4,5-bisphosphate synergistically acti-
vate actin polymerization through the N-WASP-Arp2/3 pathway. JBiol Chem 276(28):26448–26452.
Ryan GL, Petroccia HM, Watanabe N, Vavylonis D. 2012a. Excita-ble actin dynamics in lamellipodial protrusion and retraction. Bio-phys J 102(7):1493–1502.
Ryan GL, Watanabe N, Vavylonis D. 2012b. A review of models offluctuating protrusion and retraction patterns at the leading edge ofmotile cells. Cytoskeleton (Hoboken) 69(4):195–206.
Schroth-Diez B, Gerwig S, Ecke M, Hegerl R, Diez S, Gerisch G.2009. Propagating waves separate two states of actin organization inliving cells. HFSP J 3(6):412–427.
Sethian JA. 1999. Level set methods and fast marching methods :evolving interfaces in computational geometry, fluid mechanics,computer vision, and materials science. Cambridge, New York:Cambridge University Press. xx, 378 p.
Shaner NC, Lin MZ, McKeown MR, Steinbach PA, HazelwoodKL, Davidson MW, Tsien RY. 2008. Improving the photostabilityof bright monomeric orange and red fluorescent proteins. NatMethods 5(6):545–551.
Shlomovitz R, Gov NS. 2007. Membrane waves driven by actinand Myosin. Phys Rev Lett 98(16):168103.
Shlomovitz R, Gov NS. 2008. Exciting cytoskeleton-membranewaves. Phys Rev E Stat Nonlin Soft Matter Phys 78(4 Pt 1):041911.
Smoligovets AA, Smith AW, Wu HJ, Petit RS, Groves JT. 2012.Characterization of dynamic actin associations with T-cell receptormicroclusters in primary T cells. J Cell Sci 125(Pt 3):735–742.
Soderling SH. 2009. Grab your partner with both hands: cytos-keletal remodeling by Arp2/3 signaling. Sci Signal 2(55):pe5.
Soderling SH, Binns KL, Wayman GA, Davee SM, Ong SH,Pawson T, Scott JD. 2002. The WRP component of the WAVE-1complex attenuates Rac-mediated signalling. Nat Cell Biol 4(12):970–975.
Udagawa T, Woodside DG, McIntyre BW. 1996. Alpha 4 beta 1(CD49d/CD29) integrin costimulation of human T cells enhancestranscription factor and cytokine induction in the absence ofaltered sensitivity to anti-CD3 stimulation. J Immunol 157(5):1965–1972.
Varma R, Campi G, Yokosuka T, Saito T, Dustin ML. 2006. T cellreceptor-proximal signals are sustained in peripheral microclustersand terminated in the central supramolecular activation cluster.Immunity 25(1):117–127.
Vicker MG. 2002. Eukaryotic cell locomotion depends on thepropagation of self-organized reaction-diffusion waves and oscilla-tions of actin filament assembly. Exp Cell Res 275(1):54–66.
Wu J, Motto DG, Koretzky GA, Weiss A. 1996. Vav and SLP-76interact and functionally cooperate in IL-2 gene activation. Immu-nity 4(6):593–602.
Wulfing C, Davis MM. 1998. A receptor/cytoskeletal movementtriggered by costimulation during T cell activation. Science282(5397):2266–2269.
Yi J, Wu XS, Crites T, Hammer JA 3rd. 2012. Actin retrogradeflow and actomyosin II arc contraction drive receptor clusterdynamics at the immunological synapse in Jurkat T cells. Mol BiolCell 23(5):834–852.
Yokosuka T, Sakata-Sogawa K, Kobayashi W, Hiroshima M,Hashimoto-Tane A, Tokunaga M, Dustin ML, Saito T. 2005.
Newly generated T cell receptor microclusters initiate and sustain Tcell activation by recruitment of Zap70 and SLP-76. Nat Immunol6(12):1253–1262.
Yu CH, Wu HJ, Kaizuka Y, Vale RD, Groves JT. 2010. Alteredactin centripetal retrograde flow in physically restricted immunolog-ical synapses. PLoS One 5(7):e11878.
Yu Y, Smoligovets AA, Groves JT. 2013. Modulation of T cellsignaling by the actin cytoskeleton. J Cell Sci 126(Pt 5):1049–1058.
Zipfel PA, Bunnell SC, Witherow DS, Gu JJ, Chislock EM, RingC, Pendergast AM. 2006. Role for the Abi/wave protein complex inT cell receptor-mediated proliferation and cytoskeletal remodeling.Curr Biol 16(1):35–46.
CYTOSKELETON Adhesion-Dependent Modulation of Actin Dynamics 135 �


![Actin cytoskeleton and cell motility - Indico [Home] ?· Actin cytoskeleton and cell motility Julie…](https://static.documents.pub/doc/80x56/5bcc339f09d3f232618dcbfd/actin-cytoskeleton-and-cell-motility-indico-home-actin-cytoskeleton-and.jpg)


