39
1 Adhesive mortars properties: Squeeze Flow and Contact Visualization Alessandra L. Fujii Yamagata, F. A. Cardoso, A. Daubresse, E. Prat, M. Chaouche Regensburg, March 13th

1
Adhesive mortars properties: Squeeze Flow and Contact Visualization
Alessandra L. Fujii Yamagata, F. A. Cardoso, A. Daubresse, E. Prat, M. Chaouche
Regensburg, March 13th

Outline
• Context
• Objective
• Previous Research Summary • MRI
• Interfacial rheology
• Methods and Results • Squeeze flow
• Microtomography
• Optical microscopy
• Conclusion
2

Context
Swimming Pools
Facades
Bathrooms
Adhesive mortars
3
Context
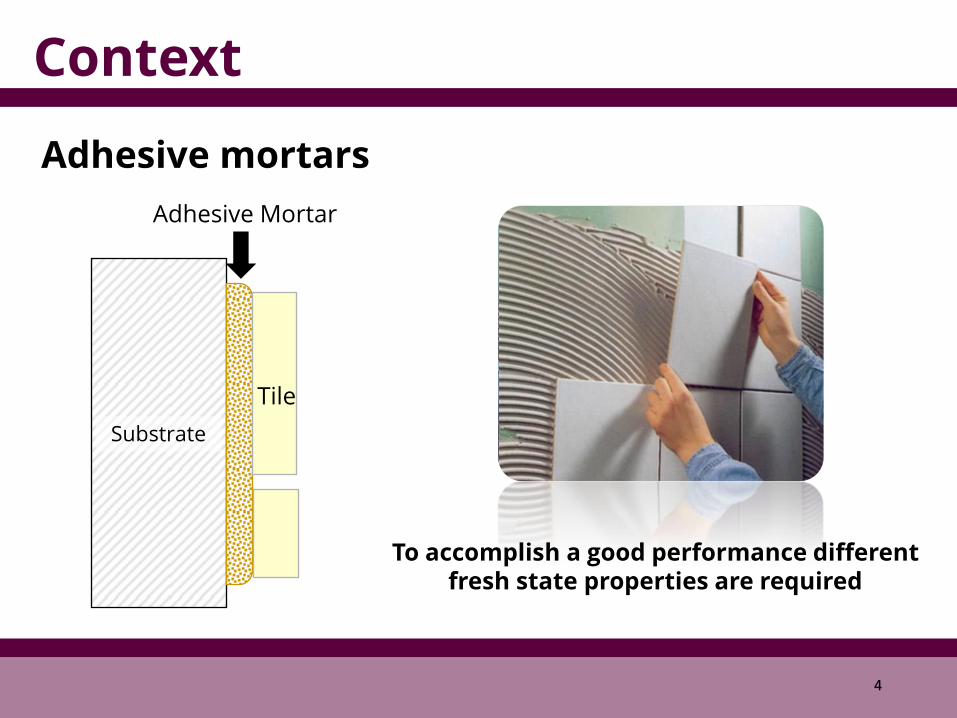
Adhesive mortars
Substrate
Adhesive Mortar
Tile
To accomplish a good performance different fresh state properties are required
4
Context
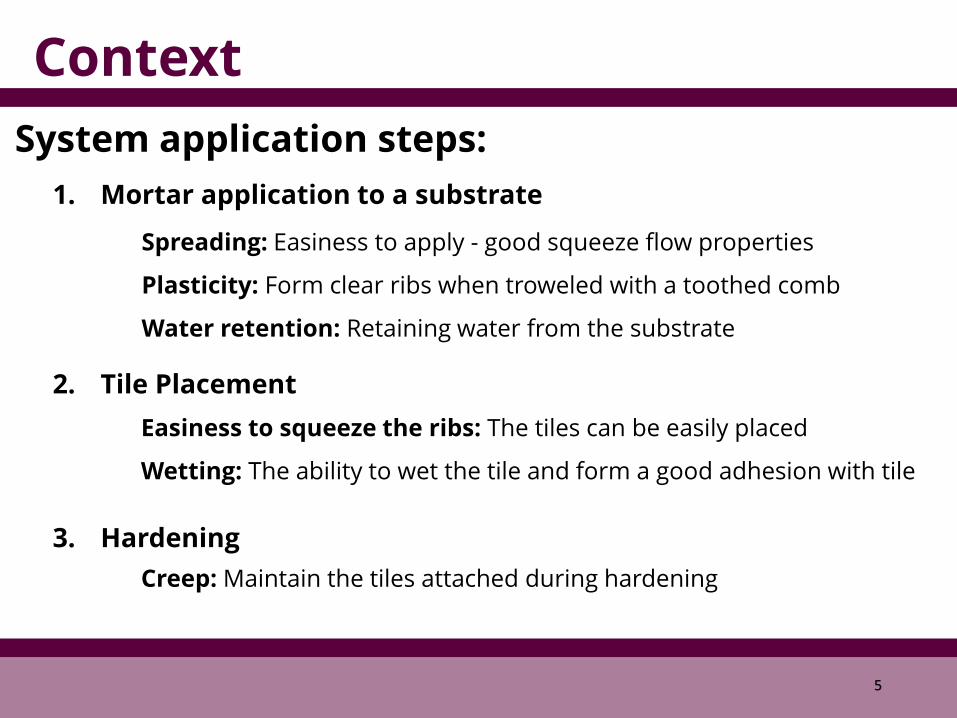
1. Mortar application to a substrate
Spreading: Easiness to apply - good squeeze flow properties
Plasticity: Form clear ribs when troweled with a toothed comb
Water retention: Retaining water from the substrate
2. Tile Placement
Easiness to squeeze the ribs: The tiles can be easily placed
Wetting: The ability to wet the tile and form a good adhesion with tile
3. Hardening
Creep: Maintain the tiles attached during hardening
System application steps:
5

Context
Redispersible polymer powder (RPP): Redispersible form of a polymeric colloidal suspension which improves flexibility, adhesion, tension properties
Dow, 2012
6

Context
Surfactant
Associative polymer
Network through hydrophobic associations
Cellulose Ether in the formulation
Undesired side effect (skin formation)
Cellulose ether: associative polymer mainly used as a thickening agent and to improve water retention.
Hhydrophobic group
7
Context
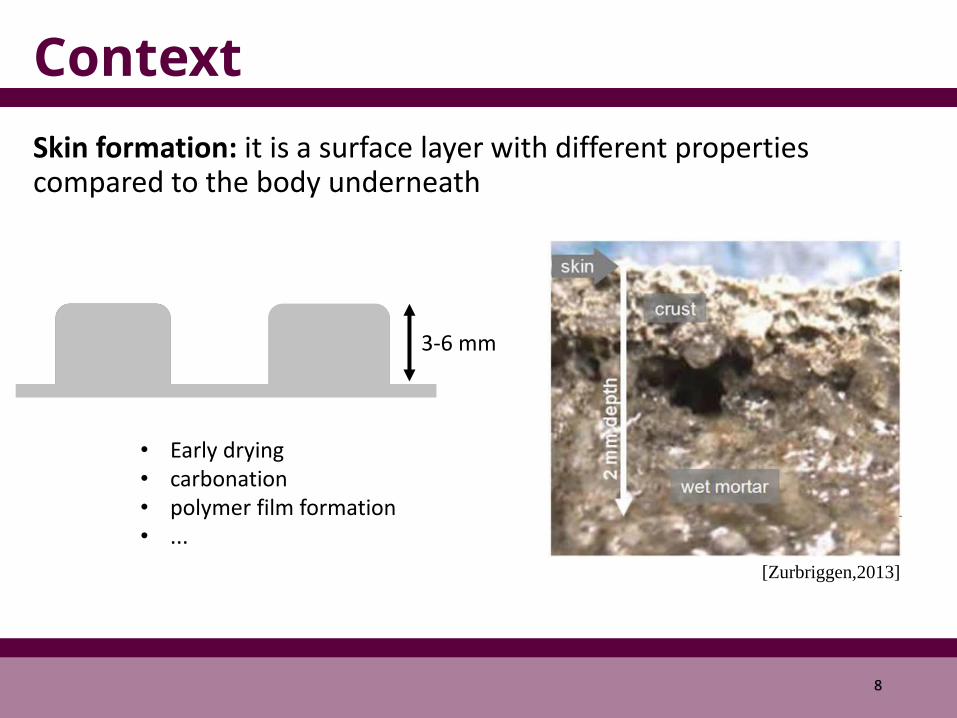
Skin formation: it is a surface layer with different properties compared to the body underneath
• Early drying • carbonation • polymer film formation • ...
3-6 mm
[Zurbriggen,2013]
8

Context
How the skin rheological properties affect adhesive properties?
PINI, 2016
9
Objective
Characterize the rheological properties of the skin and understand its influence on adhesive properties.
10

Scope of the study
• Oscillatory Rheometry • MRI • Interfacial Rheology
• Squeeze Flow • Tomography • Optical Microscopy
Previous research on skin characterization
Squeeze behavior and Microsctructure/Contact generation and adhesion
11
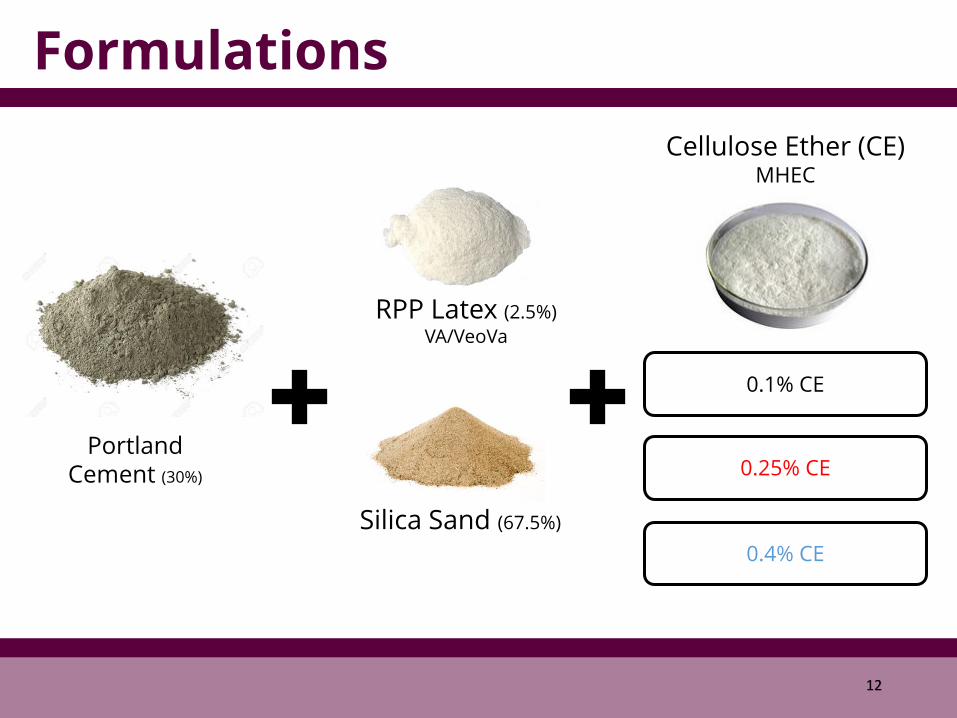
Formulations
Silica Sand (67.5%)
Portland Cement (30%)
RPP Latex (2.5%)
VA/VeoVa
Cellulose Ether (CE) MHEC
0.1% CE
0.25% CE
0.4% CE
12

Bulk Properties - Oscillatory Rheometry
As CE content is increased, the initial values of G’ firstly decrease due to entrained air and then increased by CE’s thickening effect. Over time,the tendency is that for higher CE content, the lower the G’ du to the CE’s ability to delay structuring of cement particles.
Effect of CE content of storage modulus (G’) evolution over time
0
2
4
6
8
10
12
0 20 40 60 80 100 120Time (min)
0.1% CE
0.25% CE
0.4% CE
16% Air
24% Air
25% Air
Sto
rage
modulu
s (P
a)
x
13
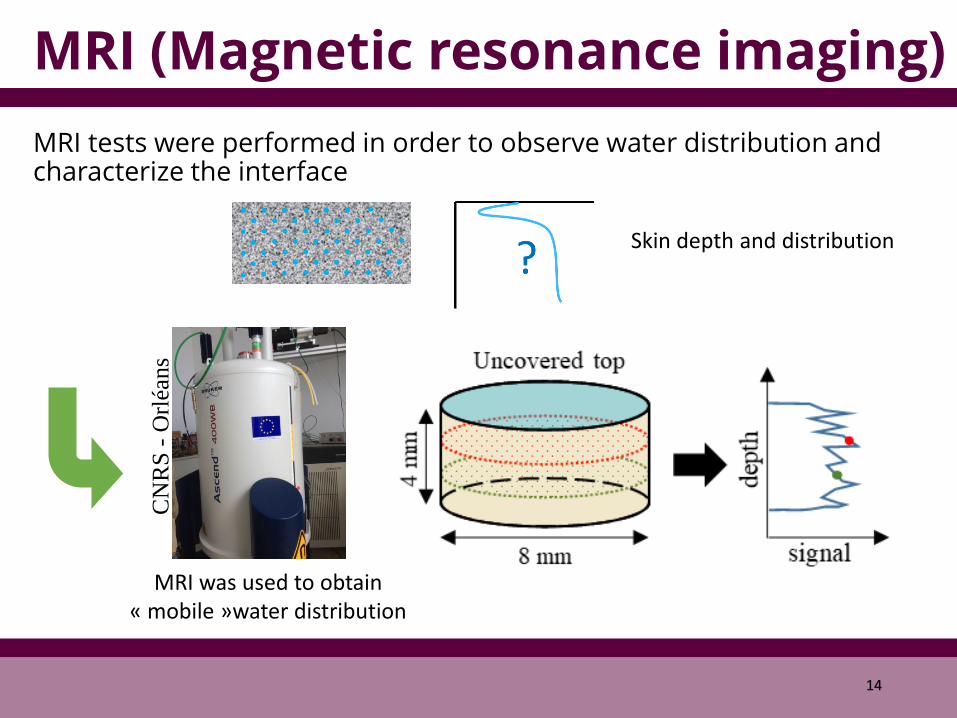
MRI (Magnetic resonance imaging)
MRI tests were performed in order to observe water distribution and characterize the interface
Skin depth and distribution
MRI was used to obtain « mobile »water distribution
CN
RS
- O
rléa
ns
14
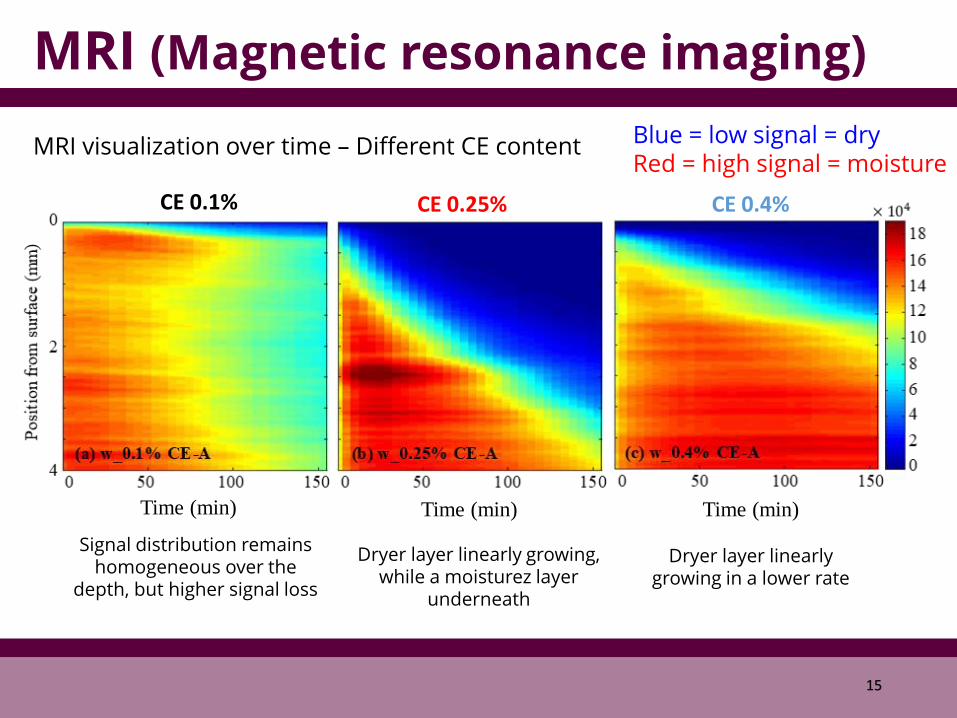
MRI (Magnetic resonance imaging)
MRI visualization over time – Different CE content Blue = low signal = dry Red = high signal = moisture
Signal distribution remains homogeneous over the
depth, but higher signal loss
Dryer layer linearly growing, while a moisturez layer
underneath
Dryer layer linearly growing in a lower rate
15
Time (min) Time (min) Time (min)
CE 0.1% CE 0.25% CE 0.4%
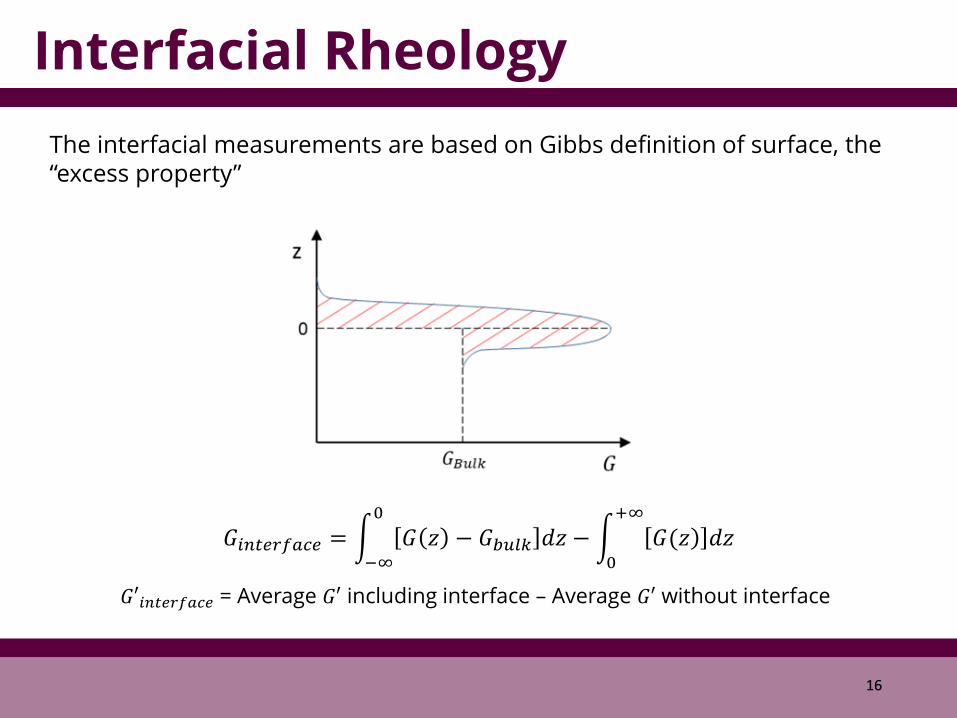
Interfacial Rheology
𝐺𝑖𝑛𝑡𝑒𝑟𝑓𝑎𝑐𝑒 = 𝐺 𝑧 − 𝐺𝑏𝑢𝑙𝑘 𝑑𝑧0
−∞
− 𝐺(𝑧 𝑑𝑧+∞
0
𝐺′𝑖𝑛𝑡𝑒𝑟𝑓𝑎𝑐𝑒 = Average 𝐺′ including interface – Average 𝐺′ without interface
The interfacial measurements are based on Gibbs definition of surface, the “excess property”
16
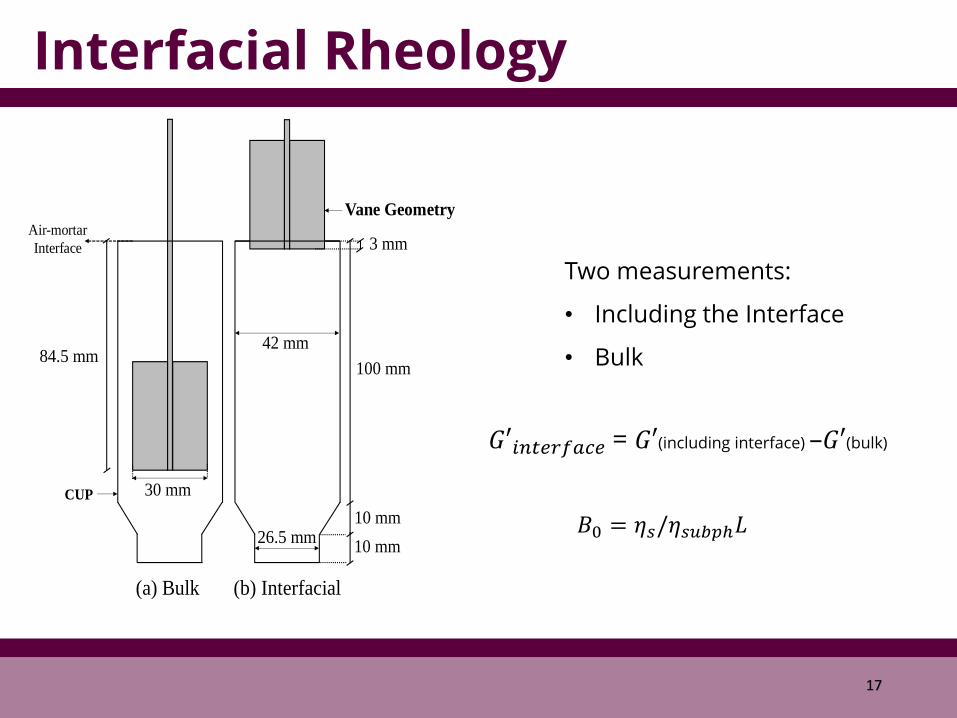
Interfacial Rheology
(a) Bulk (b) Interfacial
3 mm
100 mm
30 mm
42 mm
10 mm
10 mm26.5 mm
84.5 mm
CUP
Vane GeometryAir-mortar
Interface
Two measurements:
• Including the Interface
• Bulk
𝐺′𝑖𝑛𝑡𝑒𝑟𝑓𝑎𝑐𝑒 = 𝐺′(including interface) –𝐺′(bulk)
17
𝐵0 = 𝜂𝑠/𝜂𝑠𝑢𝑏𝑝ℎ𝐿
Interfacial Rheology: Gray PC
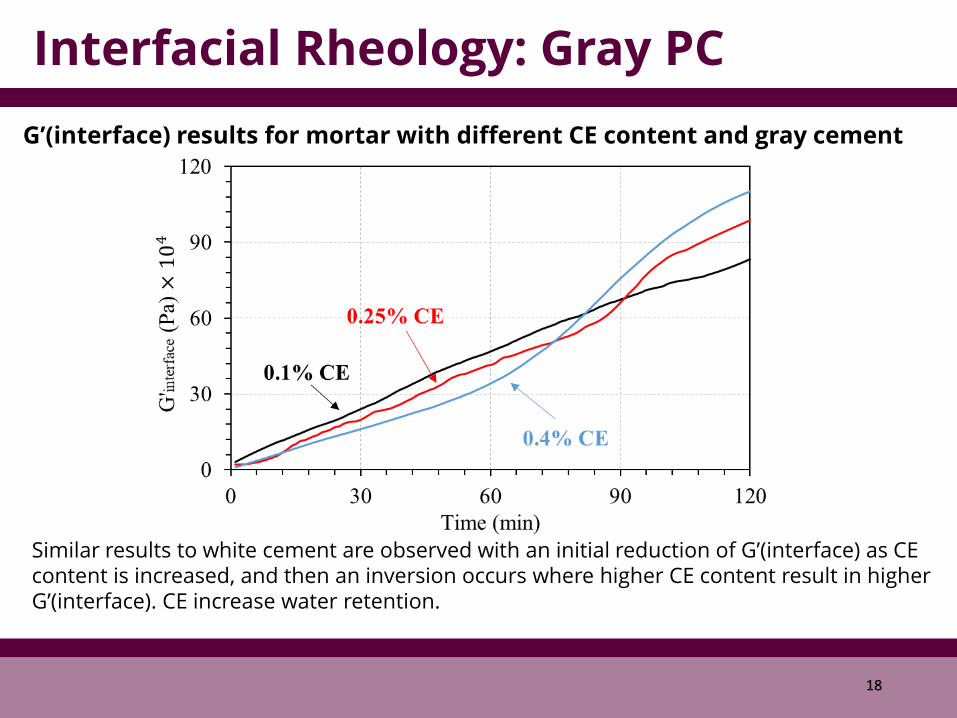
G’(interface) results for mortar with different CE content and gray cement
Similar results to white cement are observed with an initial reduction of G’(interface) as CE content is increased, and then an inversion occurs where higher CE content result in higher G’(interface). CE increase water retention.
18
Interfacial Rheology: Gray PC
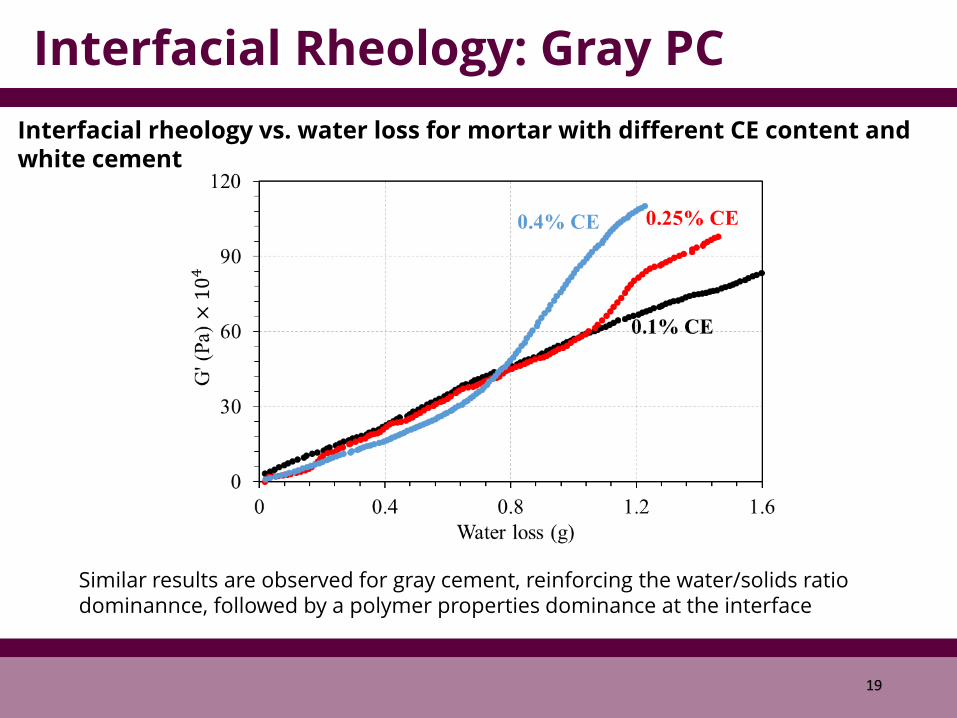
Interfacial rheology vs. water loss for mortar with different CE content and white cement
Similar results are observed for gray cement, reinforcing the water/solids ratio dominannce, followed by a polymer properties dominance at the interface
19
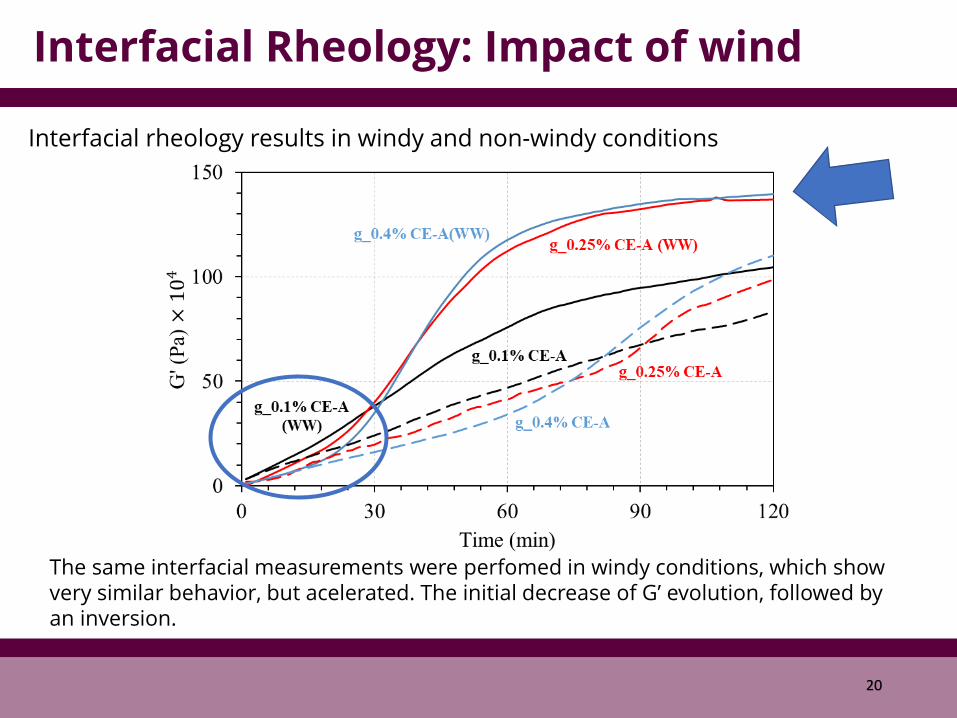
Interfacial rheology results in windy and non-windy conditions
The same interfacial measurements were perfomed in windy conditions, which show very similar behavior, but acelerated. The initial decrease of G’ evolution, followed by an inversion.
Interfacial Rheology: Impact of wind
20

21
Interfacial rheology
Contact
Bulk Properties
Squeeze
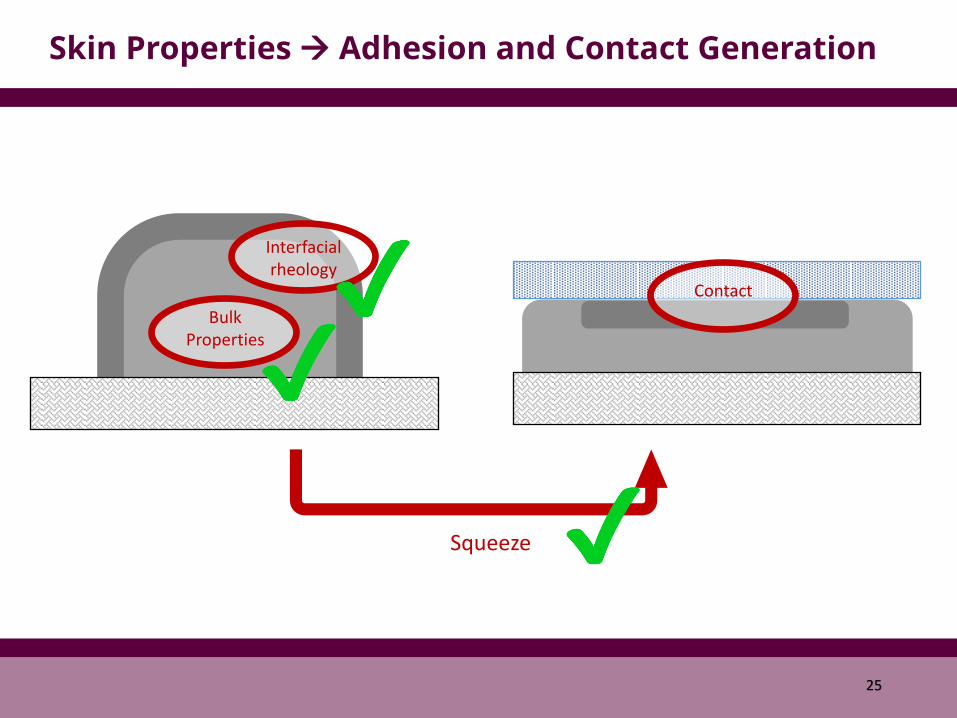
Skin Properties Adhesion and Contact Generation
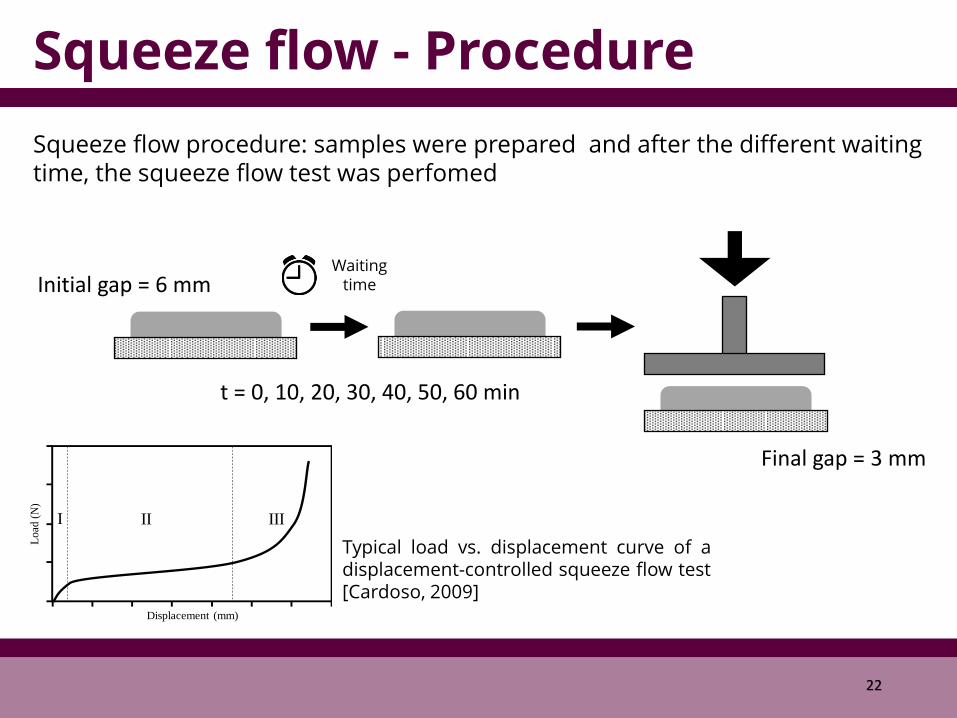
Squeeze flow - Procedure
Waiting time
Squeeze flow procedure: samples were prepared and after the different waiting time, the squeeze flow test was perfomed
t = 0, 10, 20, 30, 40, 50, 60 min
Initial gap = 6 mm
Final gap = 3 mm
22
Load
(N)
Displacement (mm)
I II III
Typical load vs. displacement curve of a displacement-controlled squeeze flow test [Cardoso, 2009]
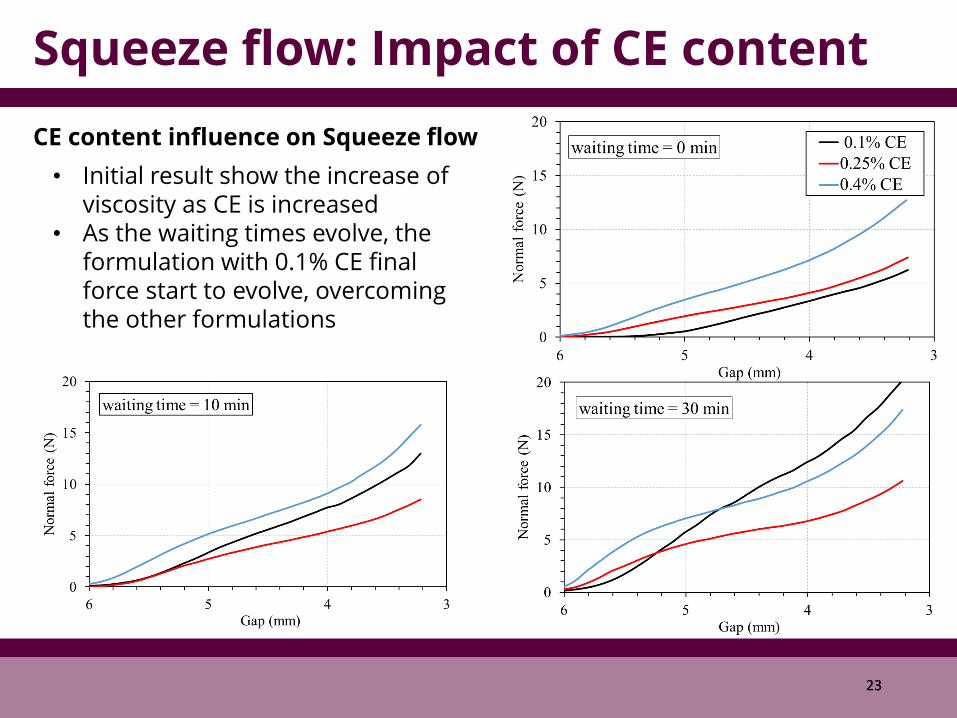
Squeeze flow: Impact of CE content
• Initial result show the increase of viscosity as CE is increased
• As the waiting times evolve, the formulation with 0.1% CE final force start to evolve, overcoming the other formulations
CE content influence on Squeeze flow
23
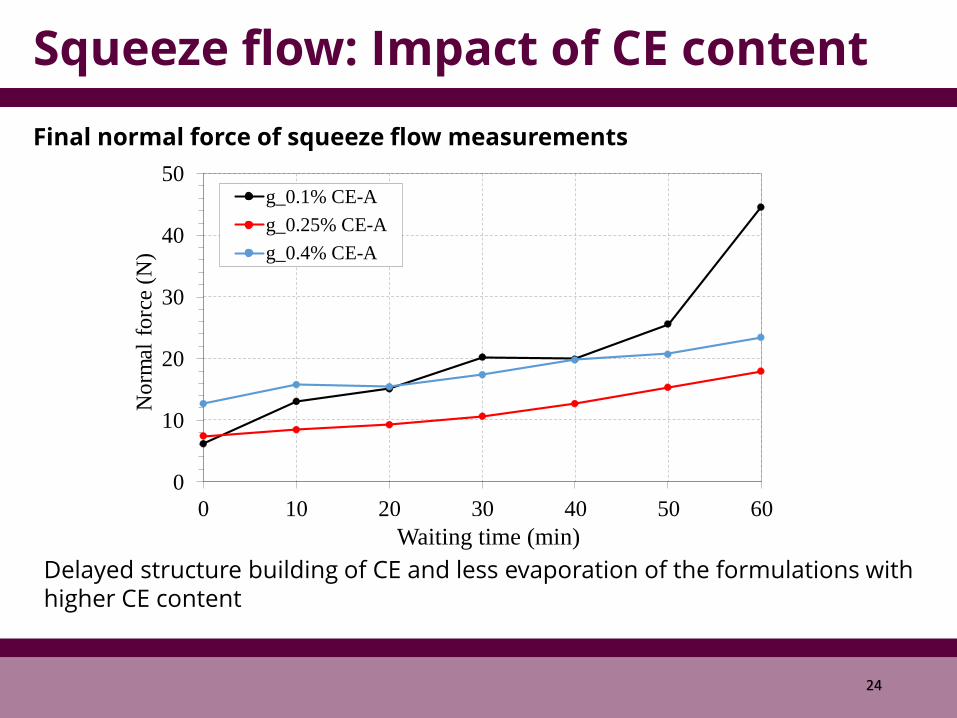
Squeeze flow: Impact of CE content
0
10
20
30
40
50
0 10 20 30 40 50 60
No
rmal
fo
rce
(N)
Open time (min)
g_0.1% CE-A
g_0.25% CE-A
g_0.4% CE-A
Final normal force of squeeze flow measurements
Delayed structure building of CE and less evaporation of the formulations with higher CE content
24
Waiting time (min)
25
Interfacial rheology
Contact
Bulk Properties
Squeeze
Skin Properties Adhesion and Contact Generation

Microtomography
Tomography is imaging technique based on computation reconstruction (CT) of X-ray images.
26

Microtomography: Contact
Contact of adhesive mortar and tile
The tomographic 3D images were used to observe the contact at upper interface and bottom interface
Upper interface: contact generated after 5 min waiting
Bottom interface: contact generated directly of fresh material.
27

Microtomography: Contact
Contact of adhesive mortar and tile
The images show a clear differente between the upper and bottom interface. In the upper interface, the region of the strips there are bubbles/poor contact and a better contact between the strips. In the bottom interface, the contact was perfect.
(a) Upper interface (b) Bottom interface
28
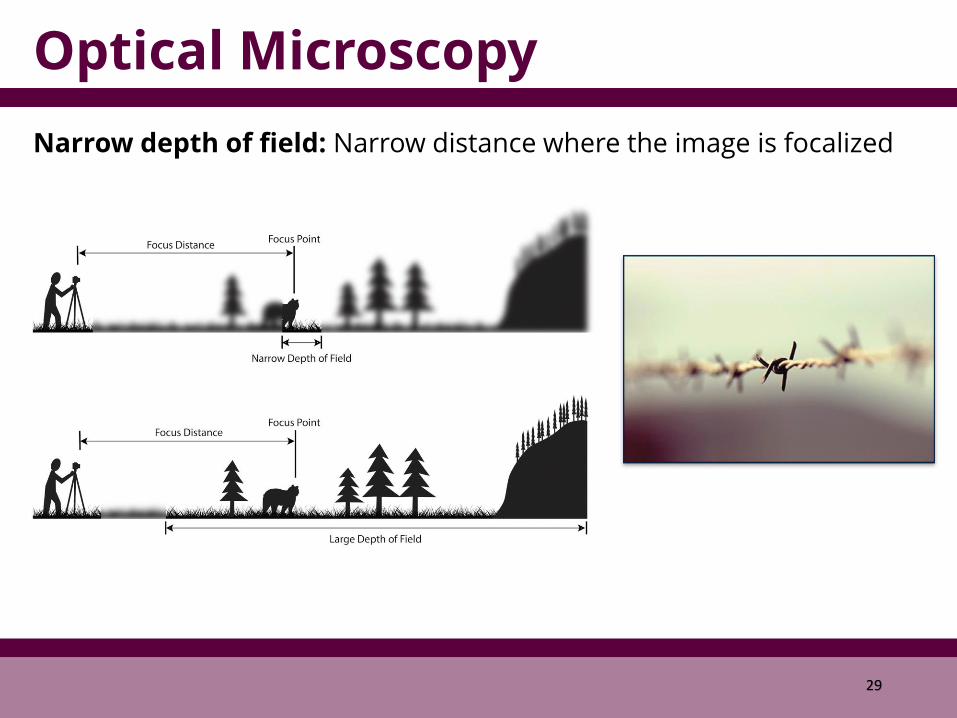
Optical Microscopy
Narrow depth of field: Narrow distance where the image is focalized
29
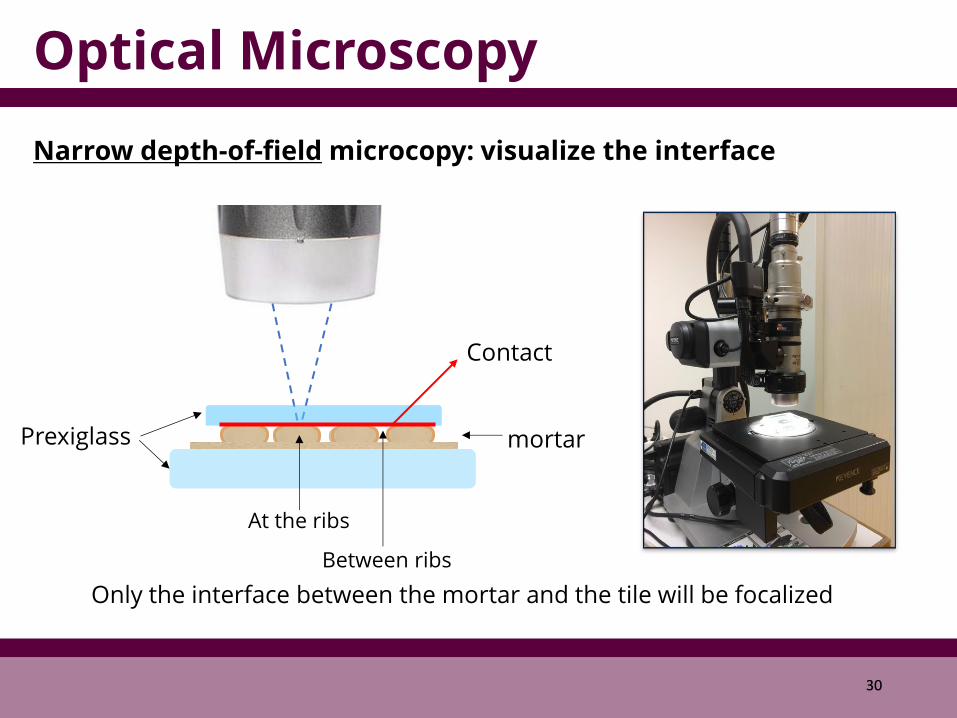
Optical Microscopy
Narrow depth-of-field microcopy: visualize the interface
Prexiglass mortar
Contact
Only the interface between the mortar and the tile will be focalized
At the ribs
Between ribs
30

0 min 5 min 10 min 20 min 30 min
CE 0.25%
CE 0.1%
CE 0.4%
Gain on squeeze capacity
Optical Microscopy
Waiting time
Effect of CE content – samples (equal force – 2kg/30s)
31
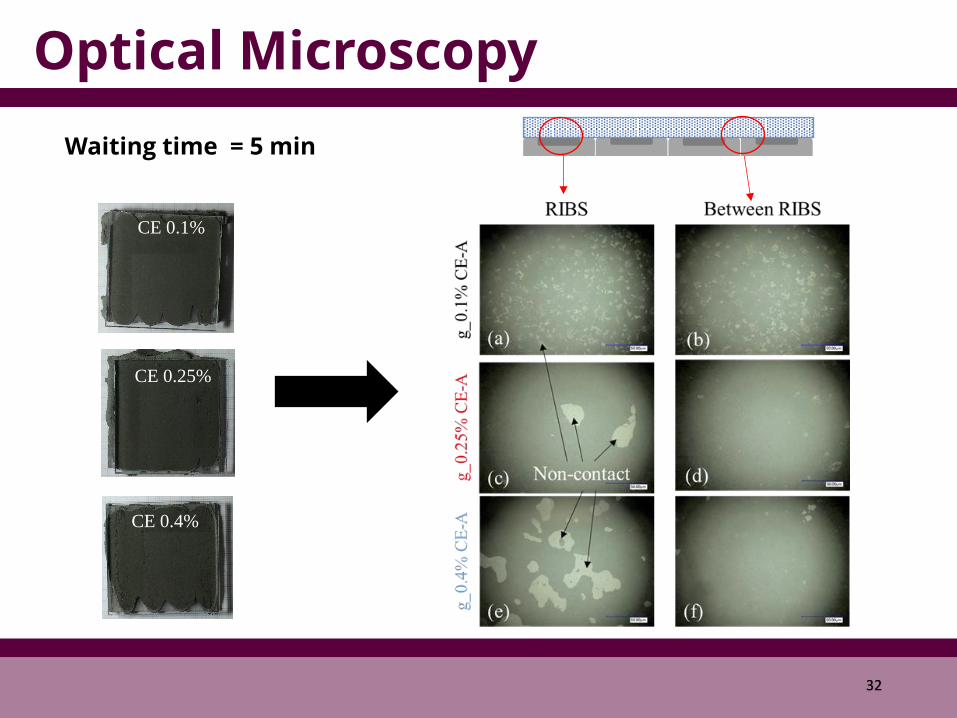
Optical Microscopy
CE 0.25%
CE 0.1%
CE 0.4%
Waiting time = 5 min
32

Optical Microscopy
5 min 10 min 20 min 30 min
No material
between ribs
Glass detachment
Glass detachment
Rib
s B
etw
een
rib
s
space between the ribs
0.1% CE-A
The formulation with low CE content, rapdly loses it ability to deform, not being fully squeezed and generating space between the ribs. After 20 min the glass detaches.
Contact No Contact
33
Optical Microscopy
5 min 10 min 20 min 30 min
Rib
s B
etw
een
rib
s
No material
between ribs
No material
between ribs
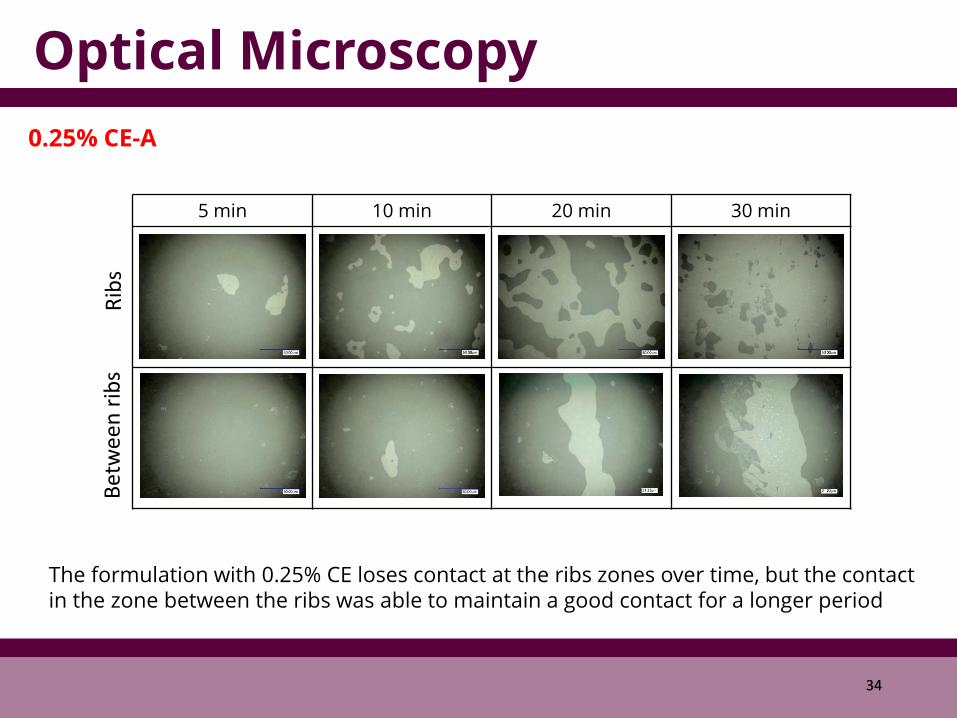
0.25% CE-A
The formulation with 0.25% CE loses contact at the ribs zones over time, but the contact in the zone between the ribs was able to maintain a good contact for a longer period
34

Optical Microscopy
5 min 10 min 20 min 30 min
Rib
s B
etw
een
rib
s
0.4% CE-A
The formulation with 0.4% CE loses contact at the ribs zones over time faster, but the contact in the zone between the ribs was able to maintain a good contact for a longer period than the other formulations
space between the ribs
Entrained air
No contact
35

Optical Microscopy
Formulations with higher CE content, despite the skin formation, fresh material is able to flow and form good contact with the tile.
Formulations with lower CE content do not form a skin, but have worse squeeze flow properties, resulting in lower deformation and poor contact generation
36
Adhesive stress
0
0.5
1
1.5
2
2.5
5 min 20 min 30 min
Adhesi
ve s
tress
(M
pa)
g_0.1% CE-A g_0.25% CE-A g_0.4% CE-A
c
c
c
cc
a a a
c
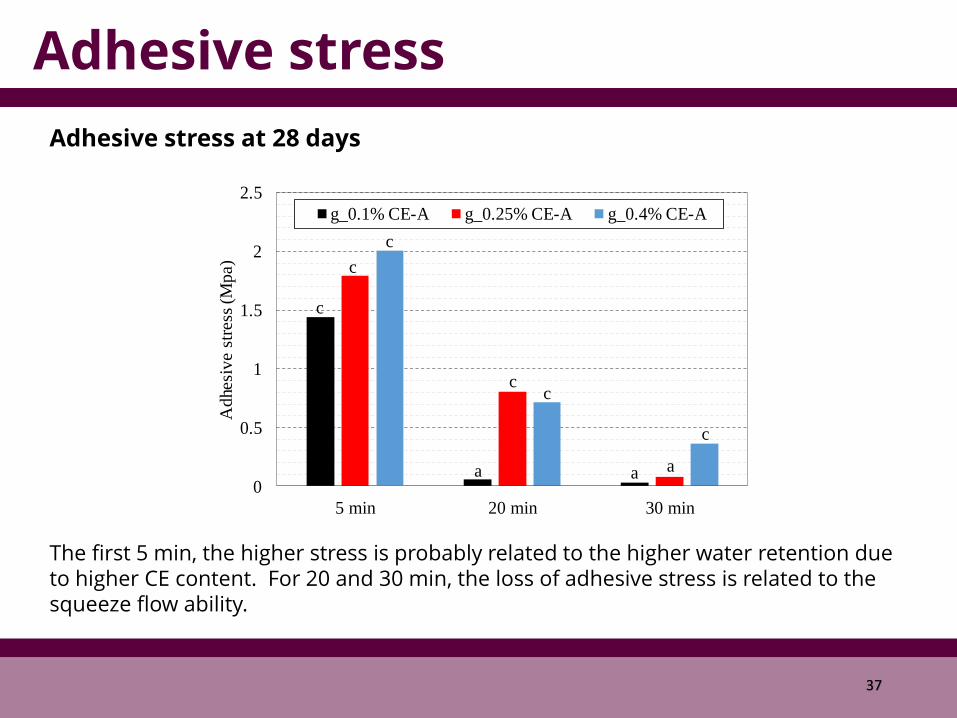
Adhesive stress at 28 days
The first 5 min, the higher stress is probably related to the higher water retention due to higher CE content. For 20 and 30 min, the loss of adhesive stress is related to the squeeze flow ability.
37
Conclusions and Perspectives • Squeeze flow: for low CE content - increase of stress forces occur over the
waiting time
• Micro-tomography: Indication of contact generation impact was observed
• Narrow depth-of-field for contact visualization: despite the skin formation obseved for higher CE content, the fresh material inside the skin is able to generate good contact with the tile.
38
Finally, further comprehension on skin formation was achieved in this study and new questions and perspective possibilities were opened.
• The presence of the skin itself does not represent an issue if it is able to break and release fresh material
• Techniques and analysis of this study could be helpful to formulation engineering
• The impact of other polymer additives and the synergical impact on adhesive properties
• Other mortar’s interfacial properties could have an influence on adhesion, such as extensional behavior of the skin

39
Thank you very much!


