19
Adi Bar-Dagan Meyrav Elad Emanuel Hachamov Achinoam Levy Nocham Ohana Maxim Vainstein Kfir Yadgar Roy Zuckerman
| Date post: | 14-Dec-2015 |
| Category: |
Documents |
| Upload: | hollie-carr |
| View: | 216 times |
| Download: | 0 times |

Adi Bar-Dagan
Meyrav Elad
Emanuel Hachamov
Achinoam Levy
Nocham Ohana
Maxim Vainstein
Kfir Yadgar
Roy Zuckerman

The NeedThe Need
• Low TRP / GRP - $30 Billion Waste
• Unspecific target audience
• Greater competition in Multi-Channel TV
• Studies indicate a need for targeted advertising
from the consumer’s point of view
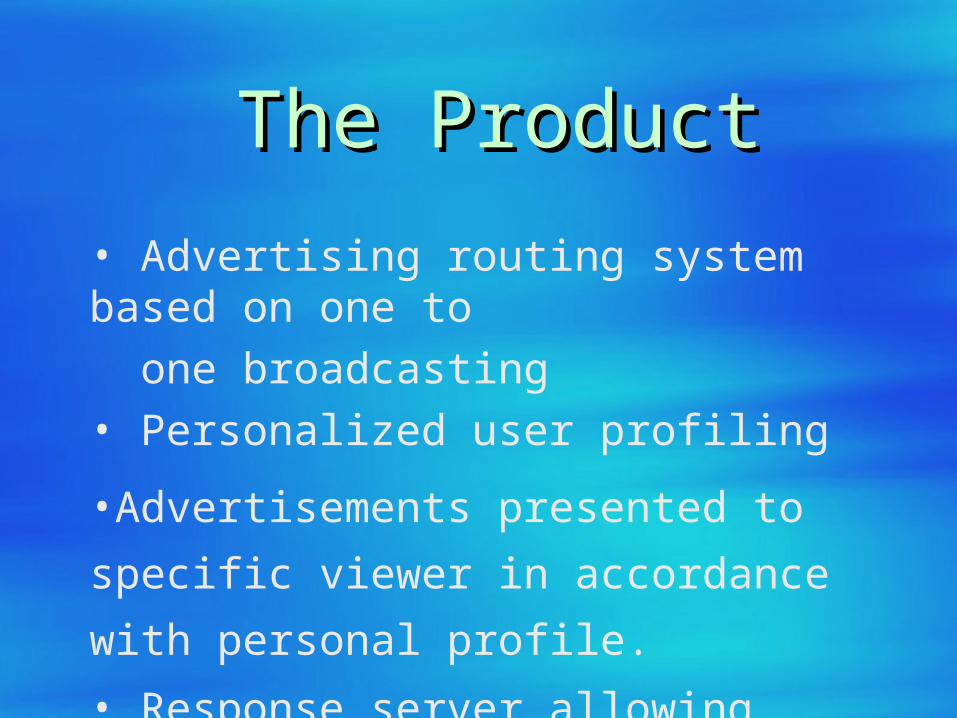
• Advertising routing system based on one to
one broadcasting
• Personalized user profiling
•Advertisements presented to specific viewer
in accordance with personal profile.
• Response server allowing user-advertiser interaction
The ProductThe Product

Data collection and aggregation:
• Interactive questionnaires – demographic data and preliminary viewers preferences.
• User Interaction – Enhancement and tweaking of personalized profile.
• Continuous Analysis of viewing habits.
The ProductThe Product

• STB with substantial storage capacity
• Client-Server connection
• Software installed remotely on viewer’s
digital set top box
• Constant update of set-top Ad database
Technology OverviewTechnology Overview

• Data analysis through learning algorithm
• Response Aggregation through Return
Channel• Compatible with the leading middle-ware
operating systems
Technology OverviewTechnology Overview

The MarketThe Market US Advanced STB ForecastUS Advanced STB Forecast
Forecast: US Digital Cable and Satellite Penetration
* Source : Forrester Research
0
10
20
30
40
50
60
2001 2002 2003 E 2004 E 2005 E 2006 E
Nu
mb
er
of
US
Ho
us
eh
old
s
( in m
illio
ns
)
Satellite
Analog cable
Basic digital cable STBs
Advanced cable STB*
Total advanced digitalSTBs

• By 2006 there will be over 45 millions households (u.s) using interactive TV.
• TV Advertising revenues (2001, in Billions):- Broadcasting Networks – $16.8
- Cable Networks – $10.1
- Infrastructure Companies – $2.7
* source: Forrester research, Jupiter Communications
The MarketThe Market

* Source: People Meter
The MarketThe Market
25%
10%
4%11%
50%
Best TRP/GRP Second Best TRP/GRPThird Best TRP/GRP Fourth Best TRP/GRPOther
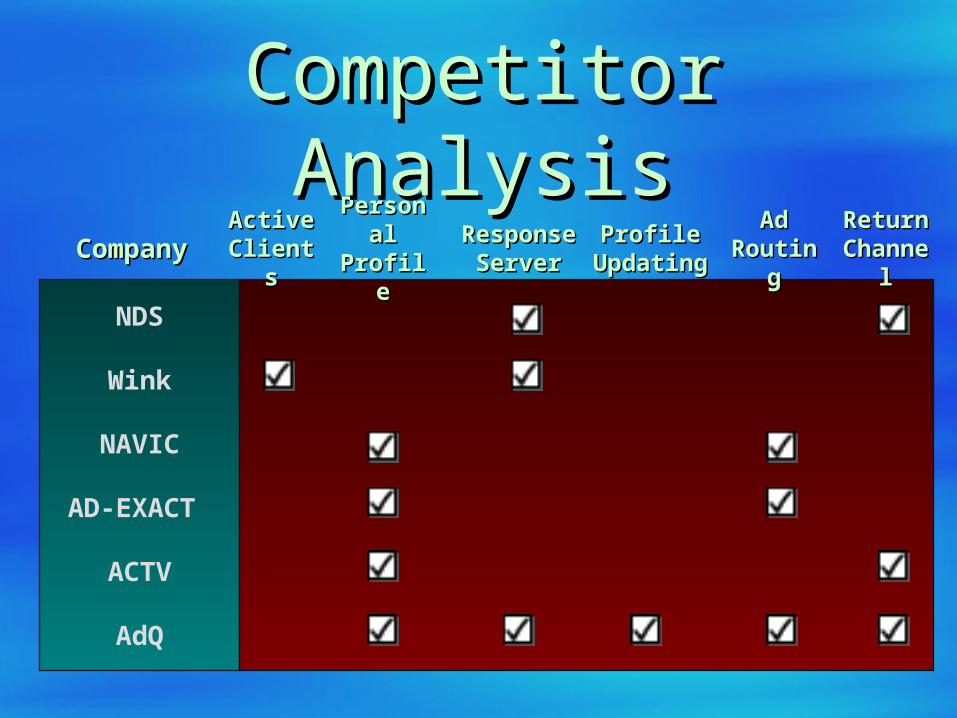
NDS
Wink
NAVIC
AD-EXACT
ACTV
AdQ
CompanyCompany Personal Personal ProfileProfile
Response Response ServerServer
Profile Profile UpdatingUpdating
AdAdRoutingRouting
ReturnReturnChannelChannel
ActiveActiveClientsClients
Competitor AnalysisCompetitor Analysis

Two revenue streams:Two revenue streams:
• Licensing fee from content providers*
• Advertisers fees from “more info” requests
* Profit Sharing with infrastructure companies
Business ModelBusiness Model

* Source: People Meter
Business ModelBusiness Model
25%
10%
4%11%
50%
Best TRP/GRP Second Best TRP/GRPThird Best TRP/GRP Fourth Best TRP/GRPOther

• Expected TRP/GRP – 70% (40% growth)
• 30% expected increase in revenues (Full Deployment)
• Revenue split 10% to each party (Content, Infrastructure, AdQ).
• One–Two year license at predetermined price.
Business Model Business Model assumptionsassumptions

• System initial installment by AdQ
• System maintenance and operation by infrastructure companies
• Long term contracts with infrastructure companies
Business Model AssumptionsBusiness Model Assumptions

Revenues Revenues (in millions US $)(in millions US $)
200620052004
AdQ Market Share
Digital STB Deployment
Total TV Ad Revenues*
Total Added Value by AdQ
45% 55% 65%
5%
$36,300
$245
10% 15%
$43,100 $52,400
$711 $1,533
AdQ Revenues $82 $237 $511
* Source: Financial Times

• Stand Alone Applications – 8/2002
• Prototype – 8/2002
• Beta Version – 2/2003
• Version 1.0 – 8/2003
• Final Release – 10/2003
Development PlanDevelopment Plan

• Direct Sales – US Market first
- Infrastructure companies
- Cable and DBS content companies
- Broadcast Networks
• Area by Area roll-out
Marketing PlanMarketing Plan
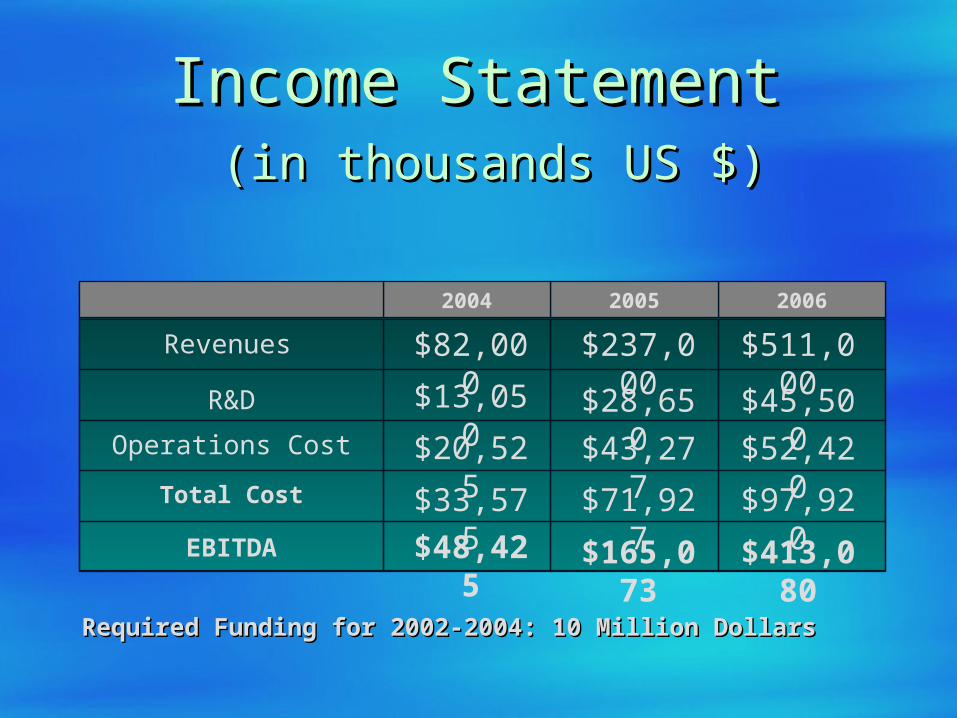
Income StatementIncome Statement (in thousands US $)(in thousands US $)
200620052004
R&D
Revenues
Operations Cost
Total Cost
$82,000 $237,000 $511,000
$13,050
$20,525
$33,575
$28,650 $45,500
$43,277 $52,420
$71,927 $97,920
EBITDA $48,425 $165,073 $413,080
Required Funding for 2002-2004: 10 Million DollarsRequired Funding for 2002-2004: 10 Million Dollars

• Consumer behavior – “couch potato” and “lay-z-boy” phenomena
• Growing variety of content channels• Middleware manufacturers embedding
software features• New technologies (PVR etc.)• Insufficient financial resources
RisksRisks


