68
Archer Daniels Midland Company 2006 ANNUAL REPORT We See Opportunity
| Date post: | 13-Apr-2017 |
| Category: |
Economy & Finance |
| Upload: | finance6 |
| View: | 197 times |
| Download: | 0 times |
A r c h e r D a n i e l s M i d l a n d C o m p a n y
2 0 0 6 A N N U A L R E P O R T
We See Opportunity
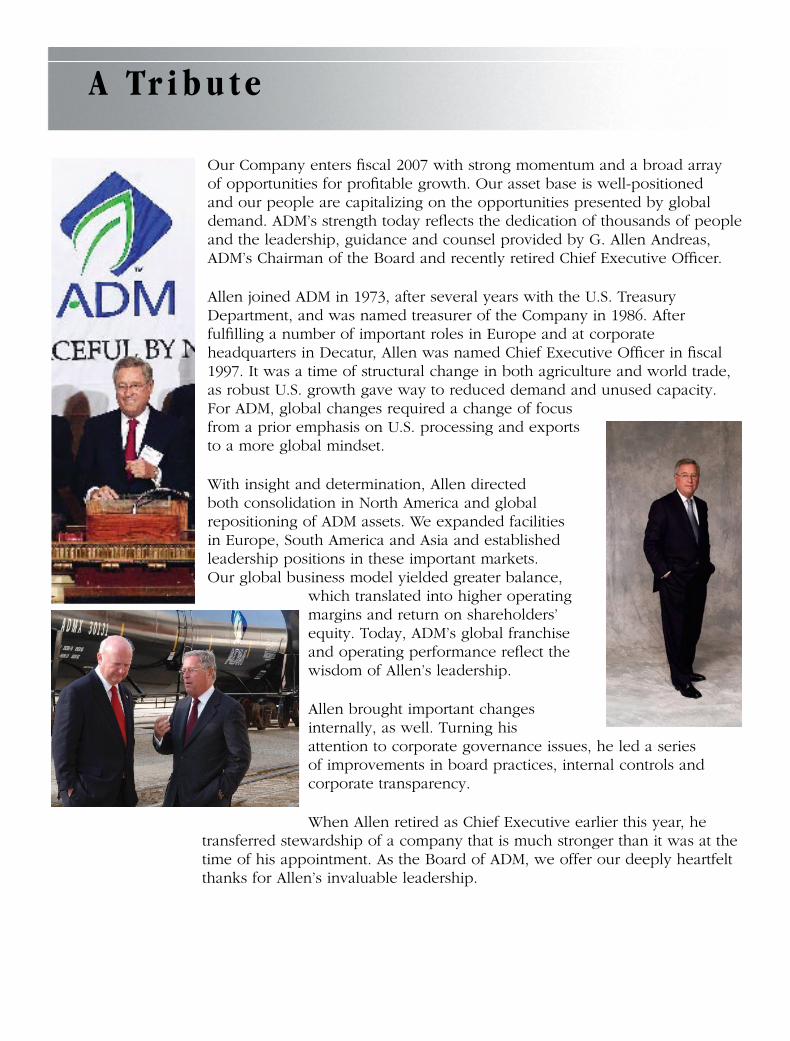
Our Company enters fiscal 2007 with strong momentum and a broad array of opportunities for profitable growth. Our asset base is well-positioned and our people are capitalizing on the opportunities presented by global demand. ADM’s strength today reflects the dedication of thousands of people and the leadership, guidance and counsel provided by G. Allen Andreas, ADM’s Chairman of the Board and recently retired Chief Executive Officer.
Allen joined ADM in 1973, after several years with the U.S. Treasury Department, and was named treasurer of the Company in 1986. After fulfilling a number of important roles in Europe and at corporate headquarters in Decatur, Allen was named Chief Executive Officer in fiscal 1997. It was a time of structural change in both agriculture and world trade, as robust U.S. growth gave way to reduced demand and unused capacity. For ADM, global changes required a change of focus from a prior emphasis on U.S. processing and exports to a more global mindset.
With insight and determination, Allen directed both consolidation in North America and global repositioning of ADM assets. We expanded facilities in Europe, South America and Asia and established leadership positions in these important markets. Our global business model yielded greater balance,
which translated into higher operating margins and return on shareholders’ equity. Today, ADM’s global franchise and operating performance reflect the wisdom of Allen’s leadership.
Allen brought important changes internally, as well. Turning his attention to corporate governance issues, he led a series of improvements in board practices, internal controls and corporate transparency.
When Allen retired as Chief Executive earlier this year, he transferred stewardship of a company that is much stronger than it was at the time of his appointment. As the Board of ADM, we offer our deeply heartfelt thanks for Allen’s invaluable leadership.
A Tr i b u t e
�
Archer Daniels Midland Company / 2006 Annual Report
FINANCIAL HIGHLIGHTS
2006 2005 (Dollarsinthousandsexceptsharedata)
Netsalesandotheroperatingincome . . . . . . . . . . . . . . . . . . . . . . . . . . . . . . . . . . . . . . . . $ 36,596,111 $ 35,943,810Netearnings . . . . . . . . . . . . . . . . . . . . . . . . . . . . . . . . . . . . . . . . . . . . . . . . . . . . . . . . . . . . 1,312,070 1,044,385Cashdividends . . . . . . . . . . . . . . . . . . . . . . . . . . . . . . . . . . . . . . . . . . . . . . . . . . . . . . . . . . 241,995 209,425Grossadditionstoproperty,plant,andequipment . . . . . . . . . . . . . . . . . . . . . . . . . . . . . . 840,569 647,378Depreciation . . . . . . . . . . . . . . . . . . . . . . . . . . . . . . . . . . . . . . . . . . . . . . . . . . . . . . . . . . . . 656,714 664,652Workingcapital . . . . . . . . . . . . . . . . . . . . . . . . . . . . . . . . . . . . . . . . . . . . . . . . . . . . . . . . . 5,661,510 4,343,837Netproperty,plantandequipment . . . . . . . . . . . . . . . . . . . . . . . . . . . . . . . . . . . . . . . . . . 5,293,032 5,184,380Long-termdebt . . . . . . . . . . . . . . . . . . . . . . . . . . . . . . . . . . . . . . . . . . . . . . . . . . . . . . . . . . 4,050,323 3,530,140Shareholders’equity . . . . . . . . . . . . . . . . . . . . . . . . . . . . . . . . . . . . . . . . . . . . . . . . . . . . . . $ 9,806,880 $8,433,472Weightedaveragesharesoutstanding–basic . . . . . . . . . . . . . . . . . . . . . . . . . . . . . . . . . . 653,588,000 654,242,000Weightedaveragesharesoutstanding–diluted . . . . . . . . . . . . . . . . . . . . . . . . . . . . . . . . 656,287,000 656,123,000
Percommonshare Netearnings–basic . . . . . . . . . . . . . . . . . . . . . . . . . . . . . . . . . . . . . . . . . . . . . . . . . . . $ 2.01 $1 .60 Netearnings–diluted . . . . . . . . . . . . . . . . . . . . . . . . . . . . . . . . . . . . . . . . . . . . . . . . . . 2.00 1 .59 Cashdividends . . . . . . . . . . . . . . . . . . . . . . . . . . . . . . . . . . . . . . . . . . . . . . . . . . . . . . . . .37 0 .32 Workingcapital . . . . . . . . . . . . . . . . . . . . . . . . . . . . . . . . . . . . . . . . . . . . . . . . . . . . . . . 8.63 6 .68 Shareholders’equity . . . . . . . . . . . . . . . . . . . . . . . . . . . . . . . . . . . . . . . . . . . . . . . . . . . $ 14.96 $12 .97
Numberofshareholders . . . . . . . . . . . . . . . . . . . . . . . . . . . . . . . . . . . . . . . . . . . . . . . . . . . 19,134 23,091Numberofemployees . . . . . . . . . . . . . . . . . . . . . . . . . . . . . . . . . . . . . . . . . . . . . . . . . . . . . 26,821 25,641
ATribute . . . . . . . . . . . . . . . . . . . . . . . . . . . . . . . . . . . . . . . . . . . . . . . . . . . . . . . . . . . . . . . . . . . . . . . . . . . . . . . InsideFrontCover
FinancialHighlights . . . . . . . . . . . . . . . . . . . . . . . . . . . . . . . . . . . . . . . . . . . . . . . . . . . . . . . . . . . . . . . . . . . . . . . . . . . . . . . . . . . 1
LettertoShareholdersandEmployees . . . . . . . . . . . . . . . . . . . . . . . . . . . . . . . . . . . . . . . . . . . . . . . . . . . . . . . . . . . . . . . . . . . . . 2
WeSeeOpportunity . . . . . . . . . . . . . . . . . . . . . . . . . . . . . . . . . . . . . . . . . . . . . . . . . . . . . . . . . . . . . . . . . . . . . . . . . . . . . . . . . . . . 6
FinancialReview(MD&A) . . . . . . . . . . . . . . . . . . . . . . . . . . . . . . . . . . . . . . . . . . . . . . . . . . . . . . . . . . . . . . . . . . . . . . . . . . . . . 25
FinancialStatementsandNotes . . . . . . . . . . . . . . . . . . . . . . . . . . . . . . . . . . . . . . . . . . . . . . . . . . . . . . . . . . . . . . . . . . . . . . . . . 39
QuarterlyFinancialData . . . . . . . . . . . . . . . . . . . . . . . . . . . . . . . . . . . . . . . . . . . . . . . . . . . . . . . . . . . . . . . . . . . . . . . . . . . . . . . 58
CommonStockMarketPricesandDividends . . . . . . . . . . . . . . . . . . . . . . . . . . . . . . . . . . . . . . . . . . . . . . . . . . . . . . . . . . . . . . . 59
Ten-YearSummary . . . . . . . . . . . . . . . . . . . . . . . . . . . . . . . . . . . . . . . . . . . . . . . . . . . . . . . . . . . . . . . . . . . . . . . . . . . . . . . . . . . 60
Directors . . . . . . . . . . . . . . . . . . . . . . . . . . . . . . . . . . . . . . . . . . . . . . . . . . . . . . . . . . . . . . . . . . . . . . . . . . . . . . . . . . . . . . . . . . . . 62
CorporateOfficers . . . . . . . . . . . . . . . . . . . . . . . . . . . . . . . . . . . . . . . . . . . . . . . . . . . . . . . . . . . . . . . . . . . . . . . . . . . . . . . . . . . . 64
StockholderInformation . . . . . . . . . . . . . . . . . . . . . . . . . . . . . . . . . . . . . . . . . . . . . . . . . . . . . . . . . . . . . . . . . . . InsideBackCover
TABLE OF CONTENTS
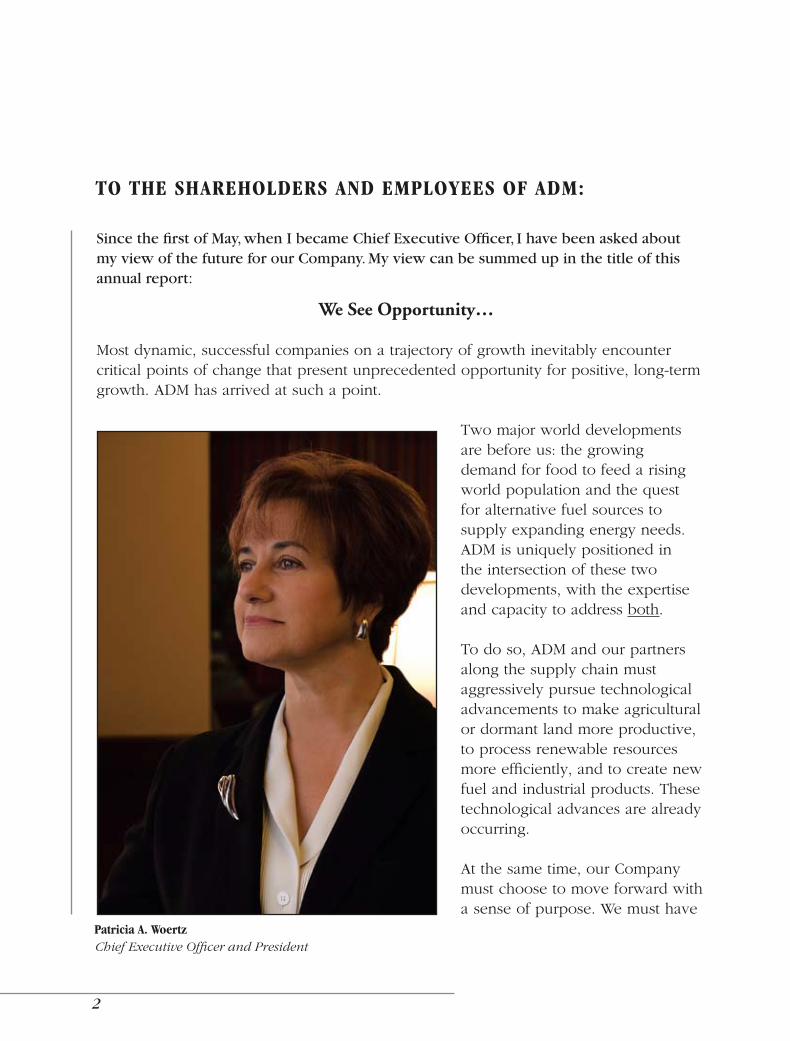
Since the first of May, when I became Chief Executive Officer, I have been asked about my view of the future for our Company. My view can be summed up in the title of this annual report:
We See Opportunity…
Most dynamic, successful companies on a trajectory of growth inevitably encounter critical points of change that present unprecedented opportunity for positive, long-term growth. ADM has arrived at such a point.
Two major world developments are before us: the growing demand for food to feed a rising world population and the quest for alternative fuel sources to supply expanding energy needs. ADM is uniquely positioned in the intersection of these two developments, with the expertise and capacity to address both.
To do so, ADM and our partners along the supply chain must aggressively pursue technological advancements to make agricultural or dormant land more productive, to process renewable resources more efficiently, and to create new fuel and industrial products. These technological advances are already occurring.
At the same time, our Company must choose to move forward with a sense of purpose. We must have
TO THE SHAREHOLDERS AND EMPLOYEES OF ADM:
Patricia A. WoertzChief Executive Officer and President
2
the desire and ability to drive growth simultaneously in both food and biofuels. Without question, we have that desire and ability. Clearly, this is the opportunity we see.
Record PerformanceOur performance last year provides strong momentum to capitalize on these opportunities. In fiscal 2006, we achieved our second consecutive year of record earnings and extended our record of uninterrupted dividends to 74 years. Net earnings increased 26% to $1.3 billion, or $2.00 per share.
Credit for this performance goes to ADM employees. In a year of change, they continued to focus on capturing opportunities through market insight, technological savvy and commitment to customers’ needs. Their efforts—aligned with our Company’s sound strategy, well-positioned portfolio of global assets and strong leadership team—enhanced our foundation for future growth.
Strategic ProgressIn 2006, we executed strongly against our key business strategies.
We announced expansion of our U.S. ethanol capacity to 1.65 billion gallons annually, building new dry-milling facilities adjacent to existing corn wet-milling plants.
Leveraging our experience and success in the biodiesel market in Europe, we are building biodiesel plants in the U.S. and South America.
We continue to increase the flexibility of our processing capabilities to meet changing market conditions. In Europe, we are modifying our Netherlands soybean crushing facility to process both rapeseed and soybeans. We are also building a palm oil refinery at our facility in Hamburg, Germany, which will become Europe’s largest refinery capable of simultaneously refining rapeseed, soy and palm oils.
We continue to enhance our strong, legacy position in food processing through investments to serve growing markets, including building a new cocoa processing facility in the U.S. to meet increasing needs for high-quality cocoa ingredients.
We are also investing in new areas that have the potential to grow into legacy positions. The convergence of factors that is stimulating the quest for renewable fuel
�
Archer Daniels Midland Company / 2006 Annual Report
sources—constrained oil supply, rising energy demand, geopolitical uncertainty and environmental concern—is also creating enhanced opportunities for bio-based industrial products. In partnership with Metabolix, we are building the first commercial plant to produce PHA plastics. And we announced plans to build a propylene glycol facility to create renewable alternatives to petroleum-based industrial chemicals.
We continue to align our assets to balance capacity with demand and rationalize our portfolio. We completed the consolidation of our specialty fats business in the U.K. and closed our citric acid facility in Ireland. In Brazil, we closed two of our oilseed processing plants to adjust to changing market conditions.
As an energy producer, we take seriously our responsibility to be an energy conserver. We are building coal-fired co-generation plants in Nebraska and Iowa to help our corn milling operations become even more energy efficient.
Our planned capital spending program for fiscal years 2007-2008 is over $2.4 billion. This substantially increased level of investment is well-supported by our financial strength and aligned with a strong portfolio of growth projects matched to a remarkable set of opportunities.
Accelerating PerformanceRemarkable opportunities require remarkable people to bring them to fruition. At ADM, we have such people. Their extraordinary range of talents and expertise is a fundamental strength of our Company.
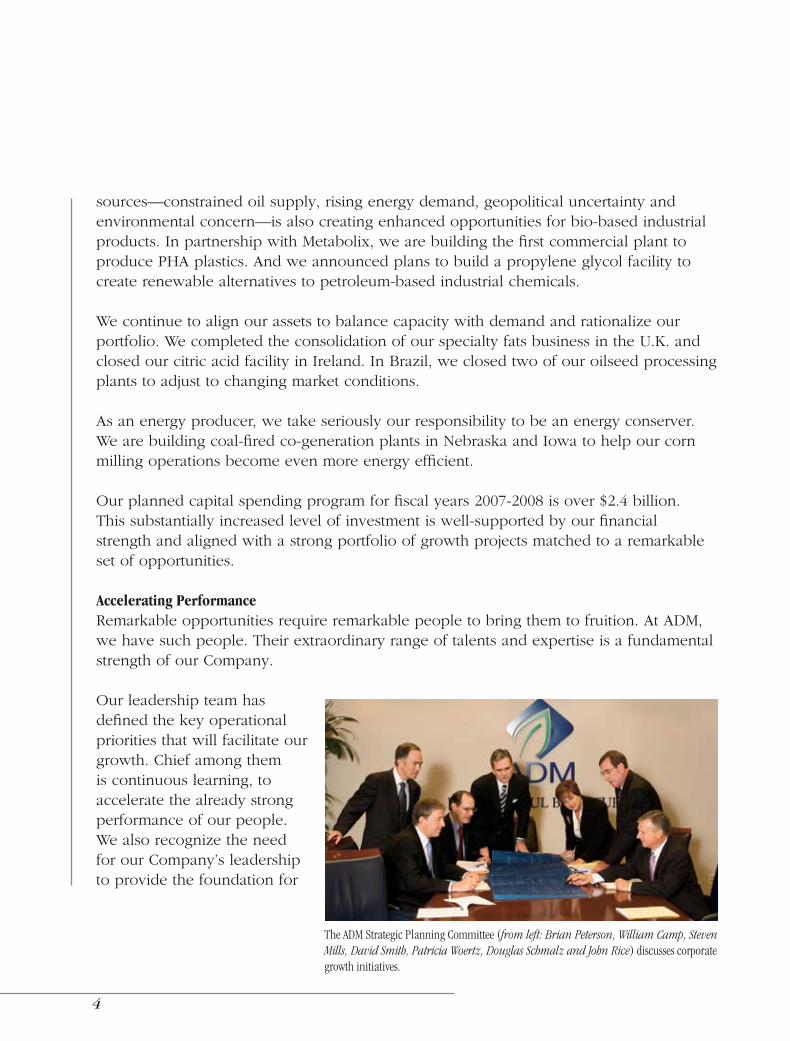
Our leadership team has defined the key operational priorities that will facilitate our growth. Chief among them is continuous learning, to accelerate the already strong performance of our people. We also recognize the need for our Company’s leadership to provide the foundation for
TheADMStrategicPlanningCommittee(fromleft:BrianPeterson,WilliamCamp,StevenMills,DavidSmith,PatriciaWoertz,DouglasSchmalzandJohnRice)discussescorporategrowthinitiatives .
�
a culture that fosters strong ethics. Staying safe, managing costs and enabling capital discipline round out the priorities that will enable us to arrive at our ultimate destination: sustained profitable growth.
I have asked each member of our senior leadership team to champion a key area to drive this progress. Our goal is to create the conditions where our people can contribute the best that is in them, where they unite around deeply held values and a shared view of what we want to accomplish, and where they feel supported, appreciated and inspired to do the best work of their lives.
Looking ForwardAs the world’s need for food and biofuels grows, competitive advantage will go to companies that recognize and are able to respond to the interconnected nature of these needs. We are such a company. Our strengths include: strong relationships with farmers, access to crops, agricultural processing expertise, the ability to produce a variety of products, the agility to align production with changing market needs, innovative partnerships with customers, and the extensive logistical capabilities to link crops to products and products to markets. In the pages of this annual report, you will read about some of the actions we are taking to build on these strengths. More importantly, you will meet some of the people through whom we see and realize opportunity.
A discussion of opportunity would not be complete without expressing our gratitude to Allen Andreas, Chairman of the Board, whose leadership positioned our Company to capitalize on our opportunity. I am grateful for the encouragement and wise counsel he has given me. I also want to thank all of our directors for their support and for the enthusiasm with which they view our future.
Finally, this letter began with the message: We see opportunity. By focusing on the unprecedented opportunity in both food and biofuels and by emphasizing ADM’s historic and emerging strengths, we move forward with a new sense of purpose—one that invigorates the long-running performance of our Company.
Patricia A. Woertz Chief Executive Officer and President
�
Archer Daniels Midland Company / 2006 Annual Report
1516123 Test2.indd 8 8/24/06 1:51:12 PM
6
1516123 Test2.indd 8 8/24/06 1:51:12 PM
�
Archer Daniels Midland Company / 2006 Annual Report
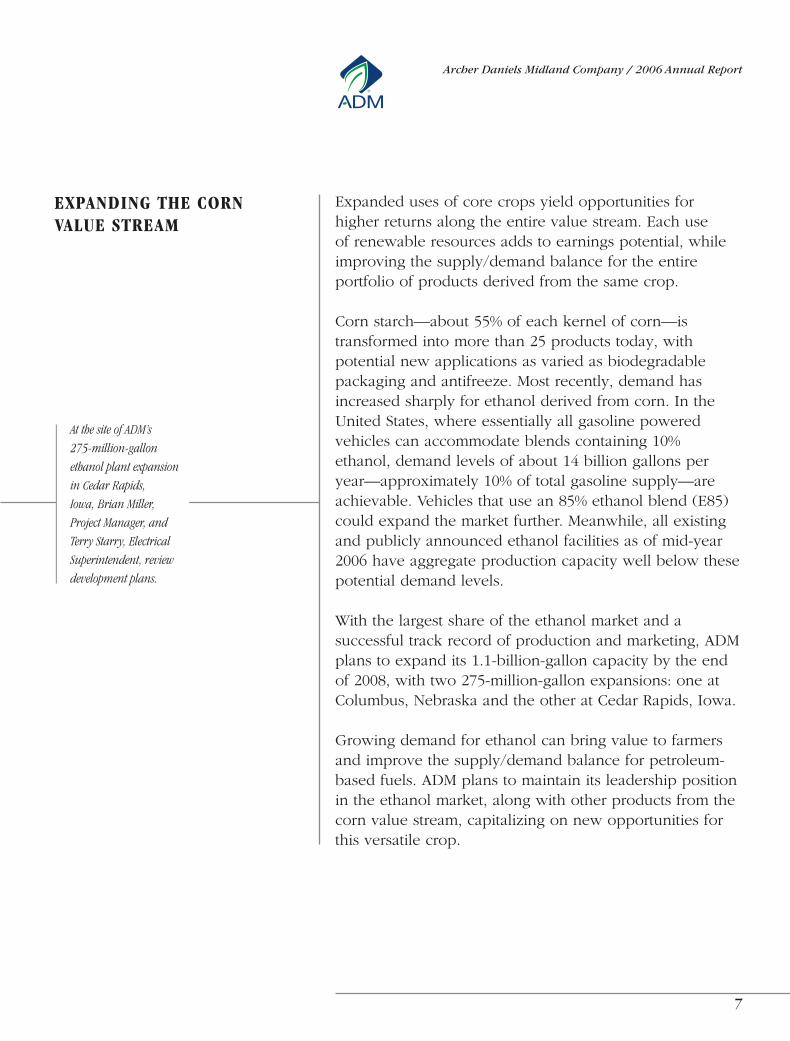
EXPANDING THE CORN VALUE STREAM
Expanded uses of core crops yield opportunities for higher returns along the entire value stream. Each use of renewable resources adds to earnings potential, while improving the supply/demand balance for the entire portfolio of products derived from the same crop.
Corn starch—about 55% of each kernel of corn—is transformed into more than 25 products today, with potential new applications as varied as biodegradable packaging and antifreeze. Most recently, demand has increased sharply for ethanol derived from corn. In the United States, where essentially all gasoline powered vehicles can accommodate blends containing 10% ethanol, demand levels of about 14 billion gallons per year—approximately 10% of total gasoline supply—are achievable. Vehicles that use an 85% ethanol blend (E85) could expand the market further. Meanwhile, all existing and publicly announced ethanol facilities as of mid-year 2006 have aggregate production capacity well below these potential demand levels.
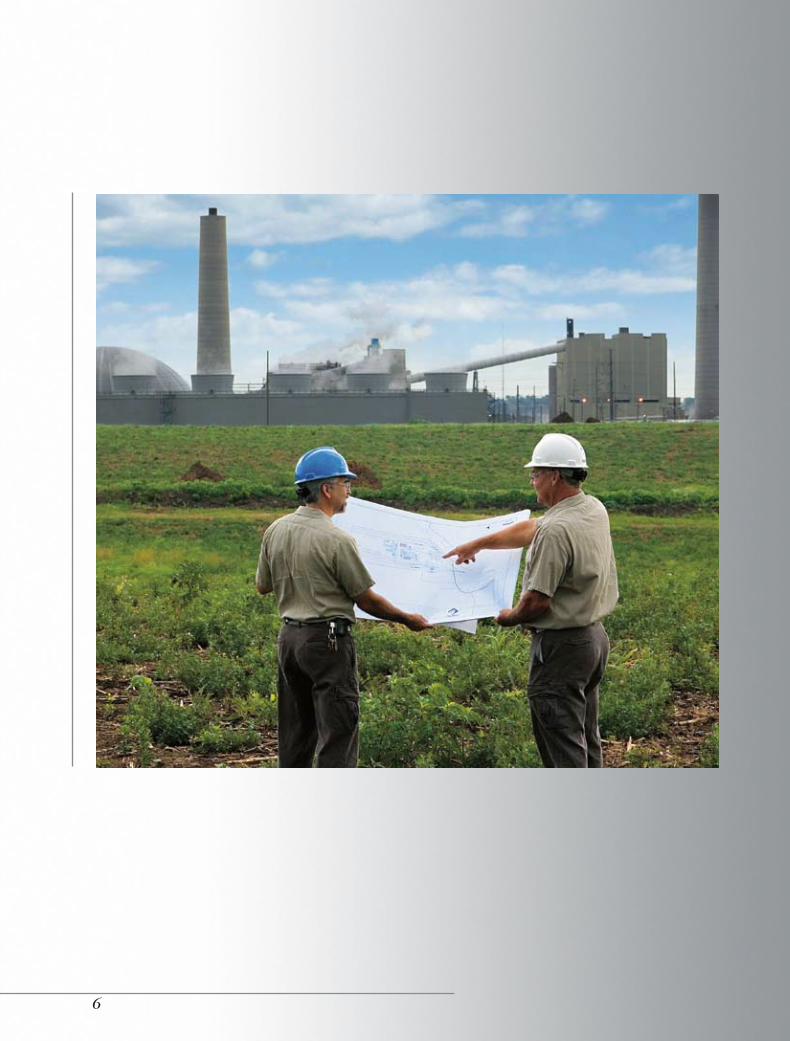
With the largest share of the ethanol market and a successful track record of production and marketing, ADM plans to expand its 1.1-billion-gallon capacity by the end of 2008, with two 275-million-gallon expansions: one at Columbus, Nebraska and the other at Cedar Rapids, Iowa.
Growing demand for ethanol can bring value to farmers and improve the supply/demand balance for petroleum-based fuels. ADM plans to maintain its leadership position in the ethanol market, along with other products from the corn value stream, capitalizing on new opportunities for this versatile crop.
AtthesiteofADM’s
275-million-gallon
ethanolplantexpansion
inCedarRapids,
Iowa,BrianMiller,
ProjectManager,and
TerryStarry,Electrical
Superintendent,review
developmentplans.
1516123 Test2.indd 8 8/24/06 1:51:12 PM
�
1516123 Test2.indd 8 8/24/06 1:51:12 PM
�
Archer Daniels Midland Company / 2006 Annual Report
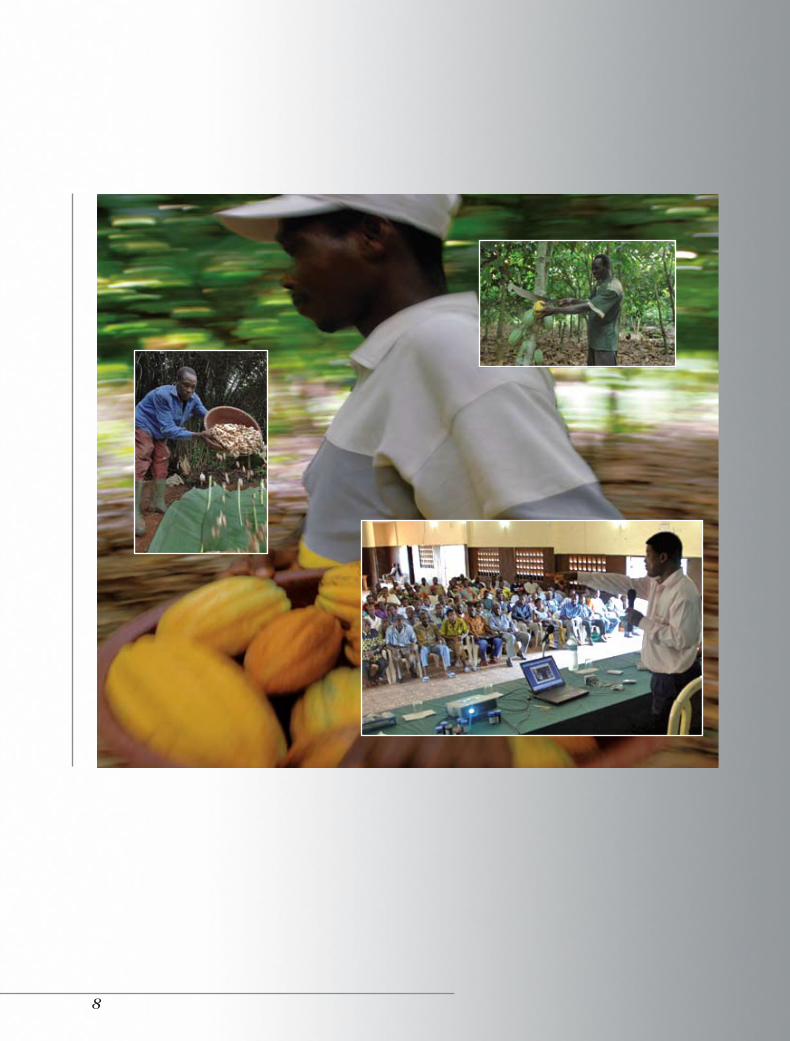
ADDING SUSTAINABILITY TO CROPS—AND FARMS
Commitment to farmers and workers creates the opportunity for enhanced sustainability of both farms and agricultural communities. Healthy, properly trained partners increase success by many measures.
Global businesses must seek growth that is both profit-able and sustainable. Especially in developing nations, where farming is often an arduous task and community resources are scarce, support for the local community is a key adjunct to investment in facilities.
Within the Republic of Côte d’Ivoire (Ivory Coast), where ADM facilities source and process cocoa for an eager world, the Company works with farm cooperatives to help their members become more productive and success-ful. Sustainable farming practices yield both higher-quality cocoa for ADM and a higher living standard for cocoa farmers. In ADM facilities, health and safety programs deliver hygiene awareness and worker protection for both full-time and temporary workers. AIDS awareness and prevention programs teach employees and others about the risk and avoidance of this deadly disease. Benefits from these practices include measurable improve-ment in product quality, efficiency and profitability, along with immeasurable contributions to quality and sustain-ability of life.
As customers rely increasingly on ADM and the taste of chocolate builds its global following, local commitment will continue to include important investments in both facilities and the people who make them work.
IntheRepublicof
Côted’Ivoire,
DavidLoue,
Director,Agricultural
Production–ADMCocoa
Sifca,leadsaclassroom
trainingprogram
forrepresentativesof
regionalcocoafarm
cooperatives.
1516123 Test2.indd 8 8/24/06 1:51:12 PM
�0
1516123 Test2.indd 8 8/24/06 1:51:12 PM
��
Archer Daniels Midland Company / 2006 Annual Report
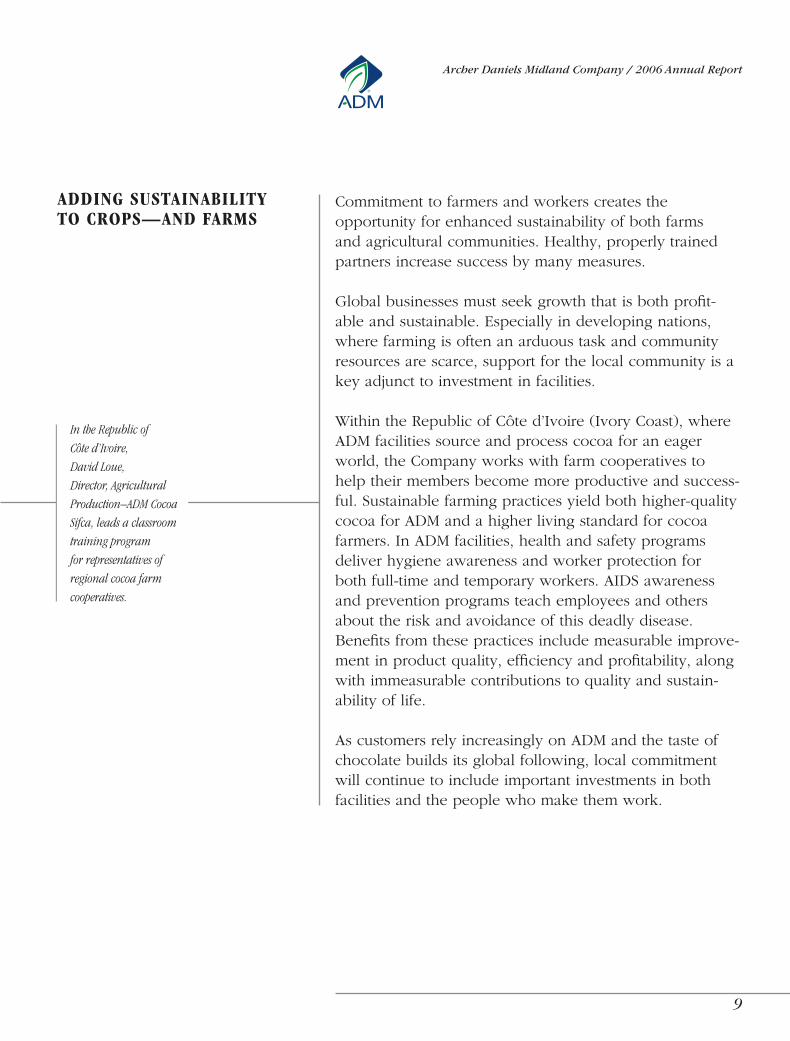
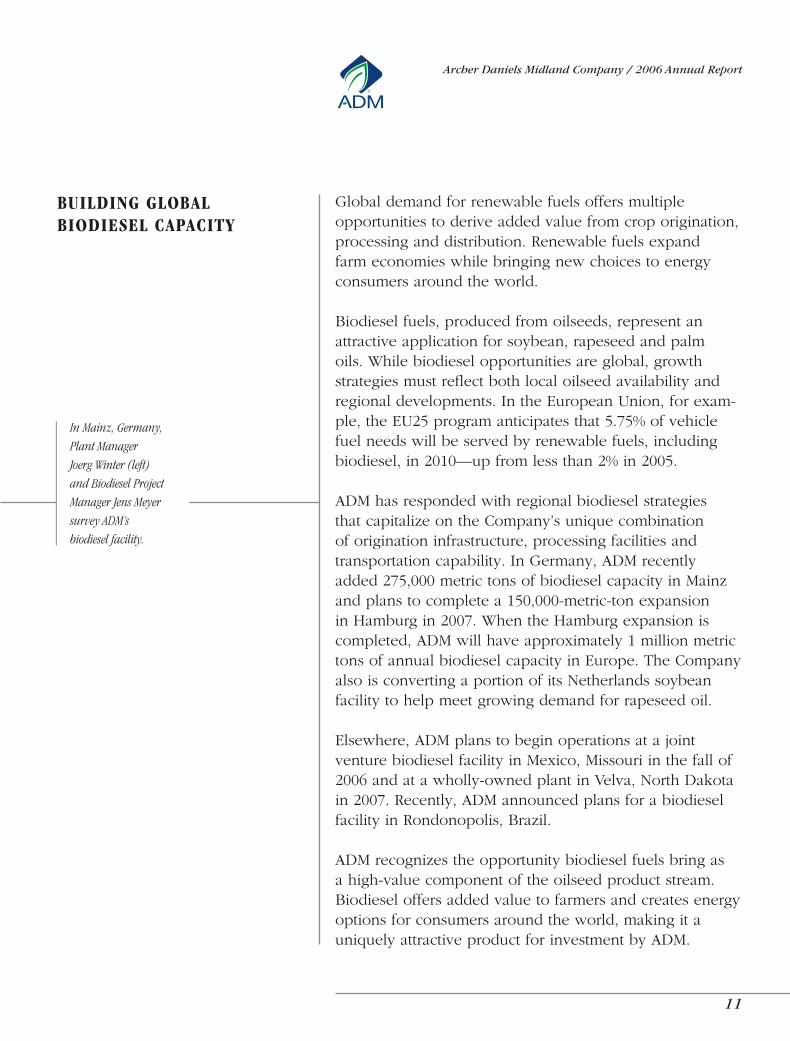
BUILDING GLOBAL BIODIESEL CAPACITY
Global demand for renewable fuels offers multiple opportunities to derive added value from crop origination, processing and distribution. Renewable fuels expand farm economies while bringing new choices to energy consumers around the world.
Biodiesel fuels, produced from oilseeds, represent an attractive application for soybean, rapeseed and palm oils. While biodiesel opportunities are global, growth strategies must reflect both local oilseed availability and regional developments. In the European Union, for exam-ple, the EU25 program anticipates that 5.75% of vehicle fuel needs will be served by renewable fuels, including biodiesel, in 2010—up from less than 2% in 2005.
ADM has responded with regional biodiesel strategies that capitalize on the Company’s unique combination of origination infrastructure, processing facilities and transportation capability. In Germany, ADM recently added 275,000 metric tons of biodiesel capacity in Mainz and plans to complete a 150,000-metric-ton expansion in Hamburg in 2007. When the Hamburg expansion is completed, ADM will have approximately 1 million metric tons of annual biodiesel capacity in Europe. The Company also is converting a portion of its Netherlands soybean facility to help meet growing demand for rapeseed oil.
Elsewhere, ADM plans to begin operations at a joint venture biodiesel facility in Mexico, Missouri in the fall of 2006 and at a wholly-owned plant in Velva, North Dakota in 2007. Recently, ADM announced plans for a biodiesel facility in Rondonopolis, Brazil.
ADM recognizes the opportunity biodiesel fuels bring as a high-value component of the oilseed product stream. Biodiesel offers added value to farmers and creates energy options for consumers around the world, making it a uniquely attractive product for investment by ADM.
InMainz,Germany,
PlantManager
JoergWinter(left)
andBiodieselProject
ManagerJensMeyer
surveyADM’s
biodieselfacility.

1516123 Test2.indd 8 8/24/06 1:51:12 PM
�2
1516123 Test2.indd 8 8/24/06 1:51:12 PM
��
Archer Daniels Midland Company / 2006 Annual Report
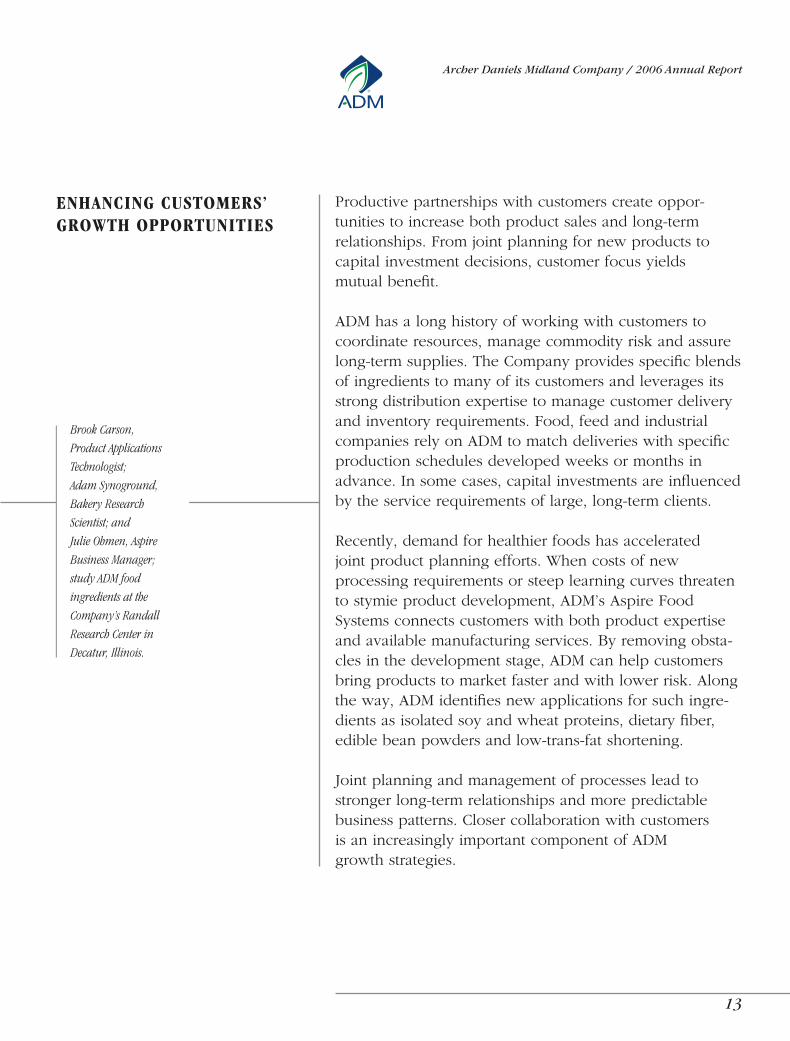
ENHANCING CUSTOMERS’ GROWTH OPPORTUNITIES
Productive partnerships with customers create oppor-tunities to increase both product sales and long-term relationships. From joint planning for new products to capital investment decisions, customer focus yields mutual benefit.
ADM has a long history of working with customers to coordinate resources, manage commodity risk and assure long-term supplies. The Company provides specific blends of ingredients to many of its customers and leverages its strong distribution expertise to manage customer delivery and inventory requirements. Food, feed and industrial companies rely on ADM to match deliveries with specific production schedules developed weeks or months in advance. In some cases, capital investments are influenced by the service requirements of large, long-term clients.
Recently, demand for healthier foods has accelerated joint product planning efforts. When costs of new processing requirements or steep learning curves threaten to stymie product development, ADM’s Aspire Food Systems connects customers with both product expertise and available manufacturing services. By removing obsta-cles in the development stage, ADM can help customers bring products to market faster and with lower risk. Along the way, ADM identifies new applications for such ingre-dients as isolated soy and wheat proteins, dietary fiber, edible bean powders and low-trans-fat shortening.
Joint planning and management of processes lead to stronger long-term relationships and more predictable business patterns. Closer collaboration with customers is an increasingly important component of ADM growth strategies.
BrookCarson,
ProductApplications
Technologist;
AdamSynoground,
BakeryResearch
Scientist;and
JulieOhmen,Aspire
BusinessManager;
studyADMfood
ingredientsatthe
Company’sRandall
ResearchCenterin
Decatur,Illinois.
1516123 Test2.indd 8 8/24/06 1:51:12 PM
��
1516123 Test2.indd 8 8/24/06 1:51:12 PM
��
Archer Daniels Midland Company / 2006 Annual Report
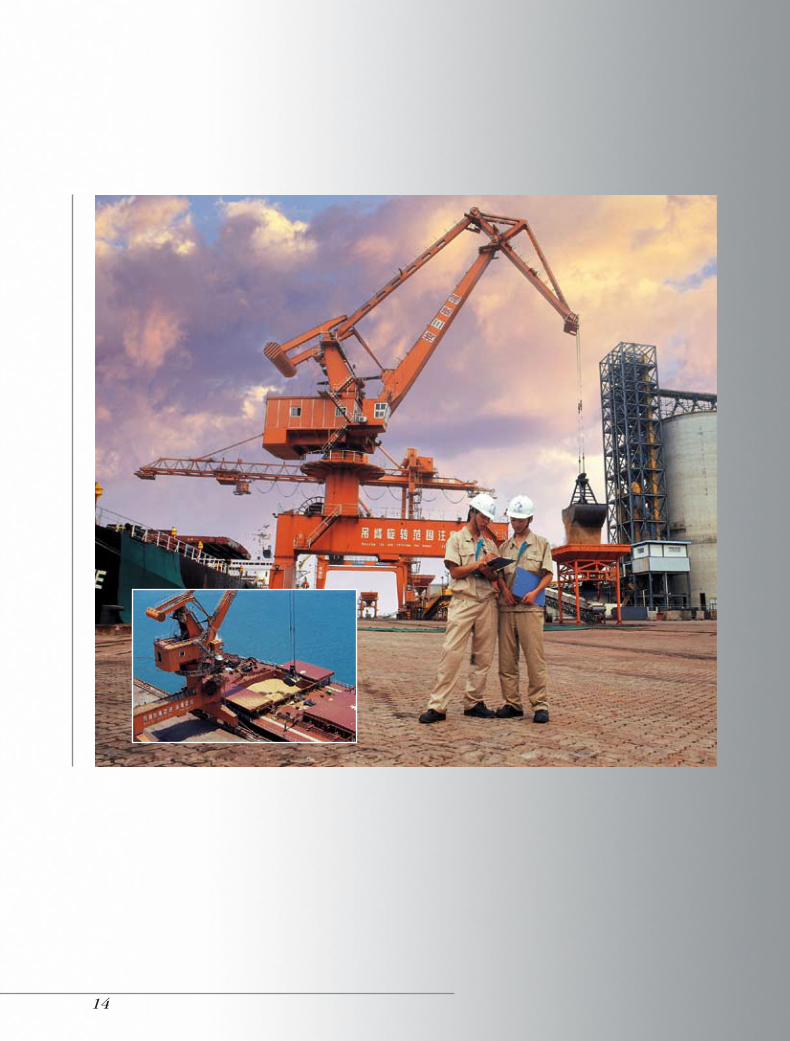
INVESTING TO MEET RISING MARKET DEMAND
Trade and processing opportunities flow from economic expansion, as growing wealth translates into more sophis-ticated dietary demands. When incomes rise, consumers add increasing amounts of meat protein and packaged foods to the dinner table.
This pattern is exemplified by growth in Asian markets, where wealth created by strong export economies drives rising demand for oilseeds—primarily soybeans. Oilseeds from North and South America feed important markets for both animal feeds and vegetable oils in China and other growing economies.
ADM is a major supplier of oilseeds to China and other Asian nations. ADM and its joint venture partners operate 20 facilities in China, where ADM made its first invest-ments in 1994. Soybeans from ADM origination facilities in both North and South America arrive in a steady stream to fuel the growth of food and feed processors who consider ADM a most valuable partner.
As individual income growth facilitates new choices, it also creates new investment opportunities for ADM and its partners. The long-term potential for Asian economic growth is strong and ADM is committed to these markets.
Attheportof
QuanganginChina,
ZhangHuiBin,
GrainSilosOperation
Supervisor,and
LinXiaoBin,Warehouse
MaterialsOperator,
overseethedeliveryof
soybeansforprocessing
plantsoperatedbyADM
jointventurepartners.

1516123 Test2.indd 8 8/24/06 1:51:12 PM
�6
1516123 Test2.indd 8 8/24/06 1:51:12 PM
��
Archer Daniels Midland Company / 2006 Annual Report
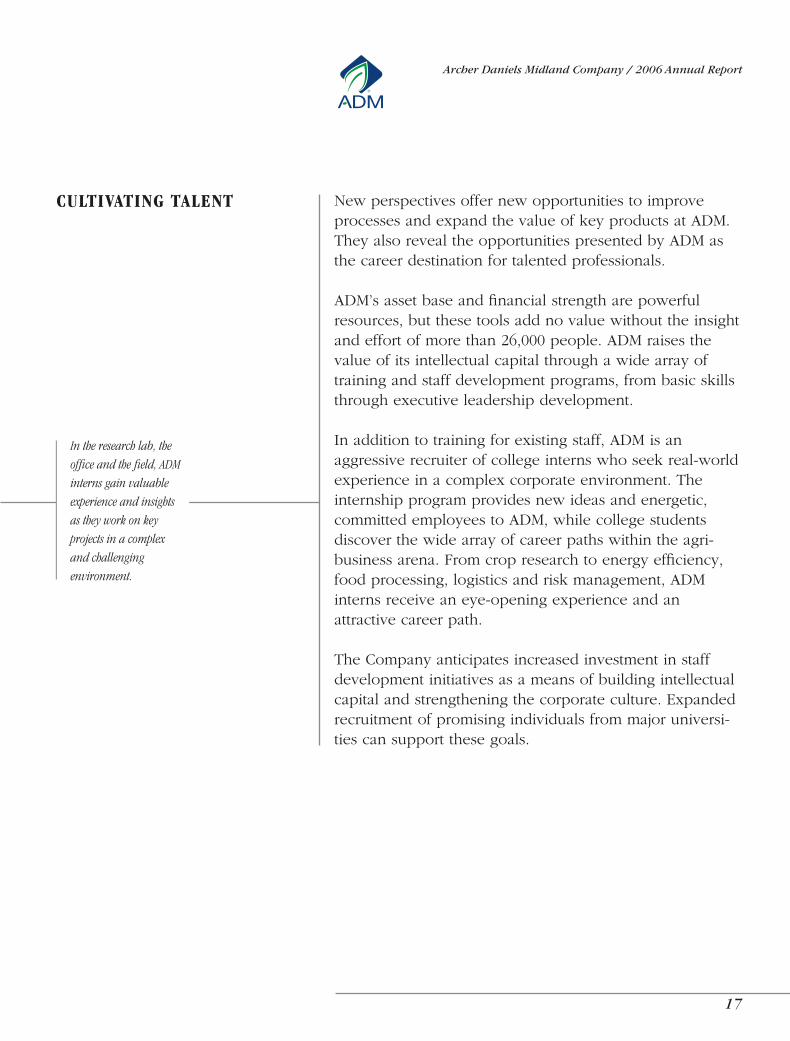
CULTIVATING TALENT New perspectives offer new opportunities to improve processes and expand the value of key products at ADM. They also reveal the opportunities presented by ADM as the career destination for talented professionals.
ADM’s asset base and financial strength are powerful resources, but these tools add no value without the insight and effort of more than 26,000 people. ADM raises the value of its intellectual capital through a wide array of training and staff development programs, from basic skills through executive leadership development.
In addition to training for existing staff, ADM is an aggressive recruiter of college interns who seek real-world experience in a complex corporate environment. The internship program provides new ideas and energetic, committed employees to ADM, while college students discover the wide array of career paths within the agri-business arena. From crop research to energy efficiency, food processing, logistics and risk management, ADM interns receive an eye-opening experience and an attractive career path.
The Company anticipates increased investment in staff development initiatives as a means of building intellectual capital and strengthening the corporate culture. Expanded recruitment of promising individuals from major universi-ties can support these goals.
Intheresearchlab,the
officeandthefield,ADM
internsgainvaluable
experienceandinsights
astheyworkonkey
projectsinacomplex
andchallenging
environment.
1516123 Test2.indd 8 8/24/06 1:51:12 PM
��
1516123 Test2.indd 8 8/24/06 1:51:12 PM
��
Archer Daniels Midland Company / 2006 Annual Report
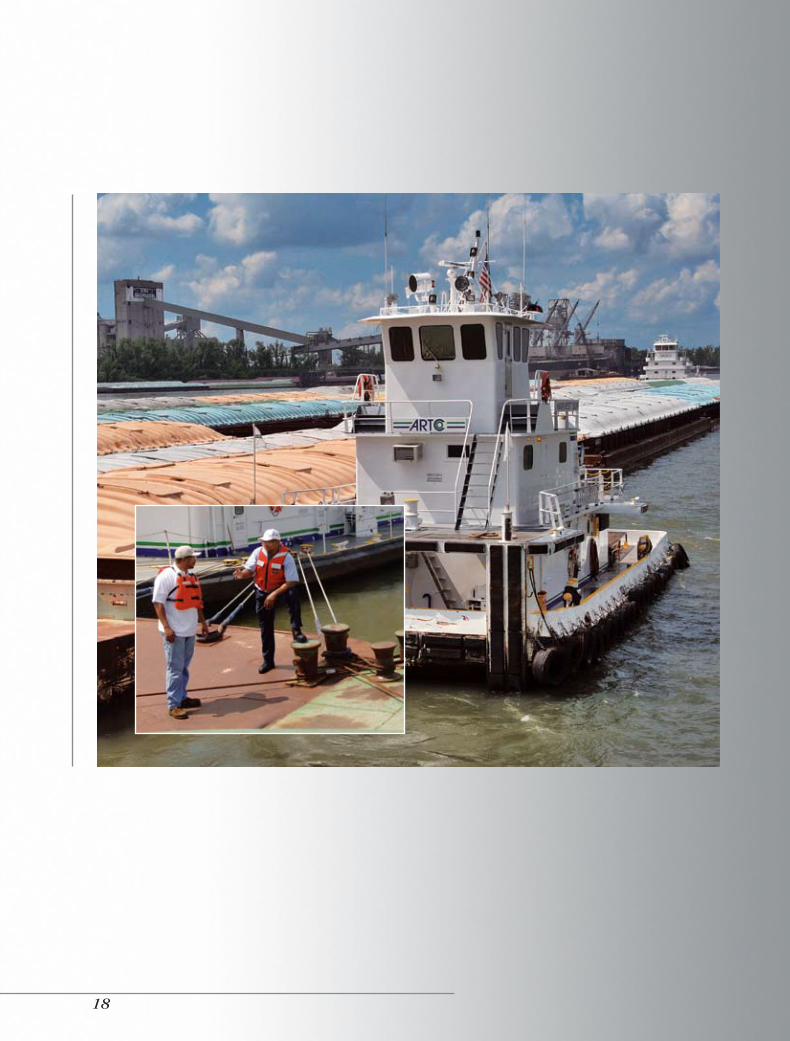
DELIVERING WHAT...WHEN...WHERE IT’S NEEDED
Agricultural markets and the processing of crops are ultimately dependent on physical movement of goods. Transportation capacity and logistics expertise present an ongoing opportunity to control costs, increase flexibility and improve customer service across the world.
ADM’s fleet of more than 20,000 railcars, 2,000 barges and 1,500 tractor-trailers connects with 500 crop storage elevators and over 240 ADM processing facilities to provide a unique competitive advantage in world markets. The Company extends its advantage by leasing and contracting additional equipment to increase capacity while limiting capital investment. ADM’s transportation network and logistics expertise extend the Company’s ability to coordinate origination, processing and distribu-tion of multiple commodities to thousands of customers.
Evidence of ADM’s distribution strength is demonstrated daily as, to cite a few examples: the Company moves hundreds of barges of corn and soybeans down the Mississippi River, bringing iron ore and other commodities back on the return trip; ships laden with soybeans from ADM facilities in South America and the United States cross the Pacific Ocean on their way to ADM joint venture processing operations in China; unit trains of ethanol traverse the Great Plains to California; and both protein meal and biodiesel fuels are delivered across Europe.
Agricultural processing depends on physical movement of commodities, which makes transportation logistics an important competitive advantage at ADM. These strengths will continue to be a focal point of ADM’s strategies for profitable growth across the globe.
OntheMississippiRiver,
PatrickJohnson,Safety
Director,andBeoniaEllis,
watchmanonthem/v
AmericanPillar,discuss
theongoingprocessof
graindeliveriestoADM
exportfacilitiesatthe
PortofNewOrleans
(background).
1516123 Test2.indd 8 8/24/06 1:51:12 PM
20
1516123 Test2.indd 8 8/24/06 1:51:12 PM
2�
Archer Daniels Midland Company / 2006 Annual Report
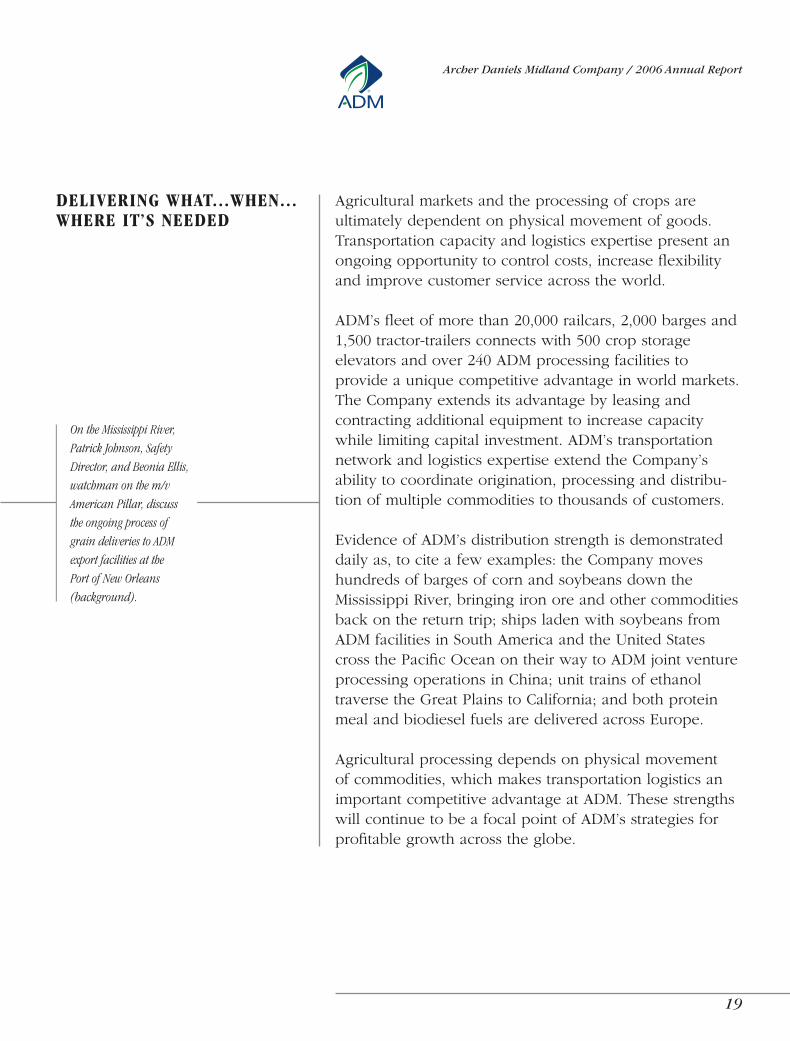
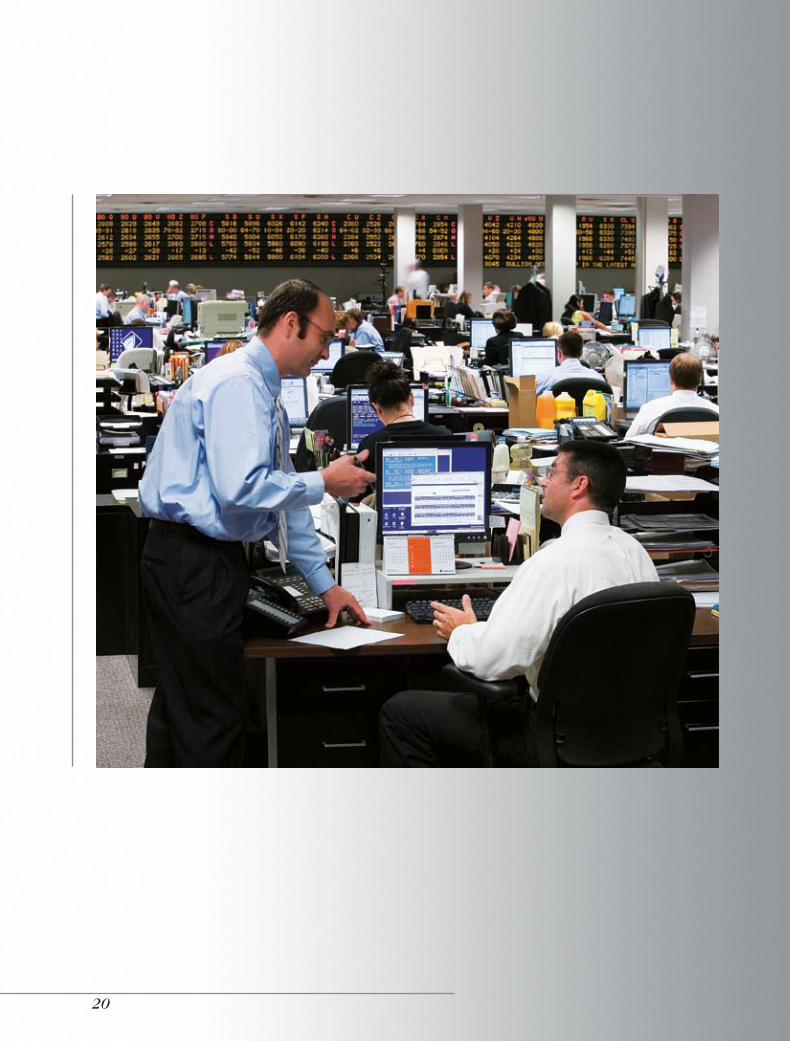
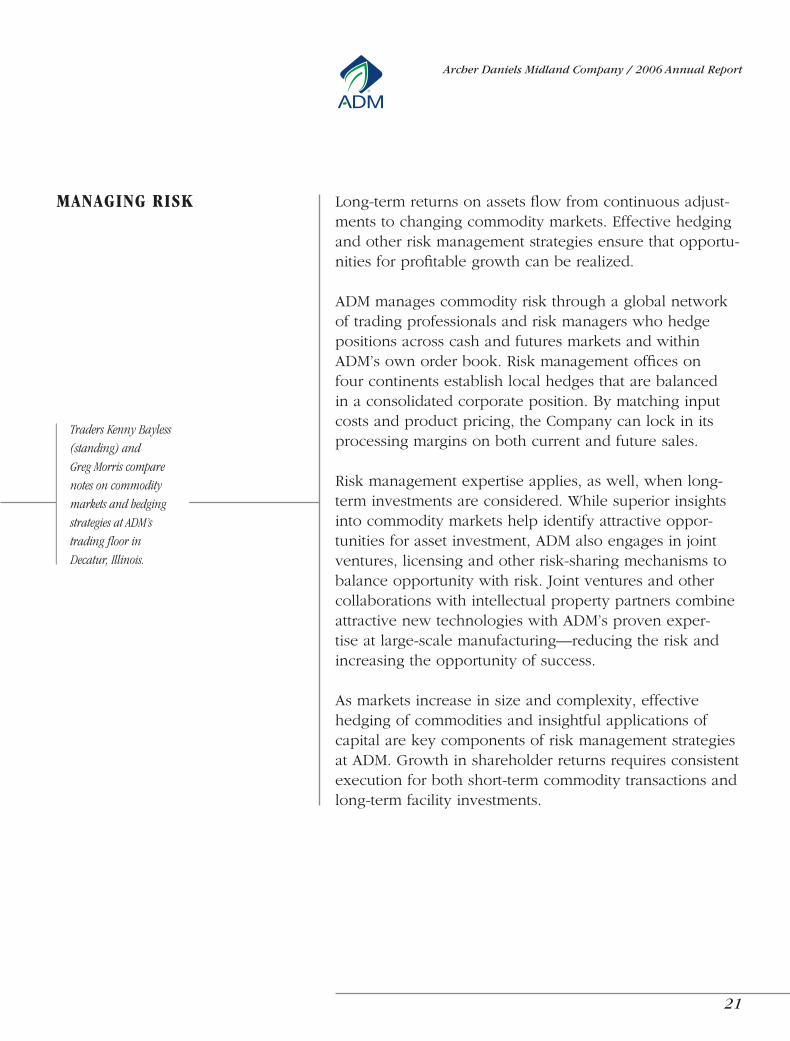
MANAGING RISK Long-term returns on assets flow from continuous adjust-ments to changing commodity markets. Effective hedging and other risk management strategies ensure that opportu-nities for profitable growth can be realized.
ADM manages commodity risk through a global network of trading professionals and risk managers who hedge positions across cash and futures markets and within ADM’s own order book. Risk management offices on four continents establish local hedges that are balanced in a consolidated corporate position. By matching input costs and product pricing, the Company can lock in its processing margins on both current and future sales.
Risk management expertise applies, as well, when long-term investments are considered. While superior insights into commodity markets help identify attractive oppor-tunities for asset investment, ADM also engages in joint ventures, licensing and other risk-sharing mechanisms to balance opportunity with risk. Joint ventures and other collaborations with intellectual property partners combine attractive new technologies with ADM’s proven exper-tise at large-scale manufacturing—reducing the risk and increasing the opportunity of success.
As markets increase in size and complexity, effective hedging of commodities and insightful applications of capital are key components of risk management strategies at ADM. Growth in shareholder returns requires consistent execution for both short-term commodity transactions and long-term facility investments.
TradersKennyBayless
(standing)and
GregMorriscompare
notesoncommodity
marketsandhedging
strategiesatADM’s
tradingfloorin
Decatur,Illinois.
1516123 Test2.indd 8 8/24/06 1:51:12 PM
22
1516123 Test2.indd 8 8/24/06 1:51:12 PM
2�
Archer Daniels Midland Company / 2006 Annual Report
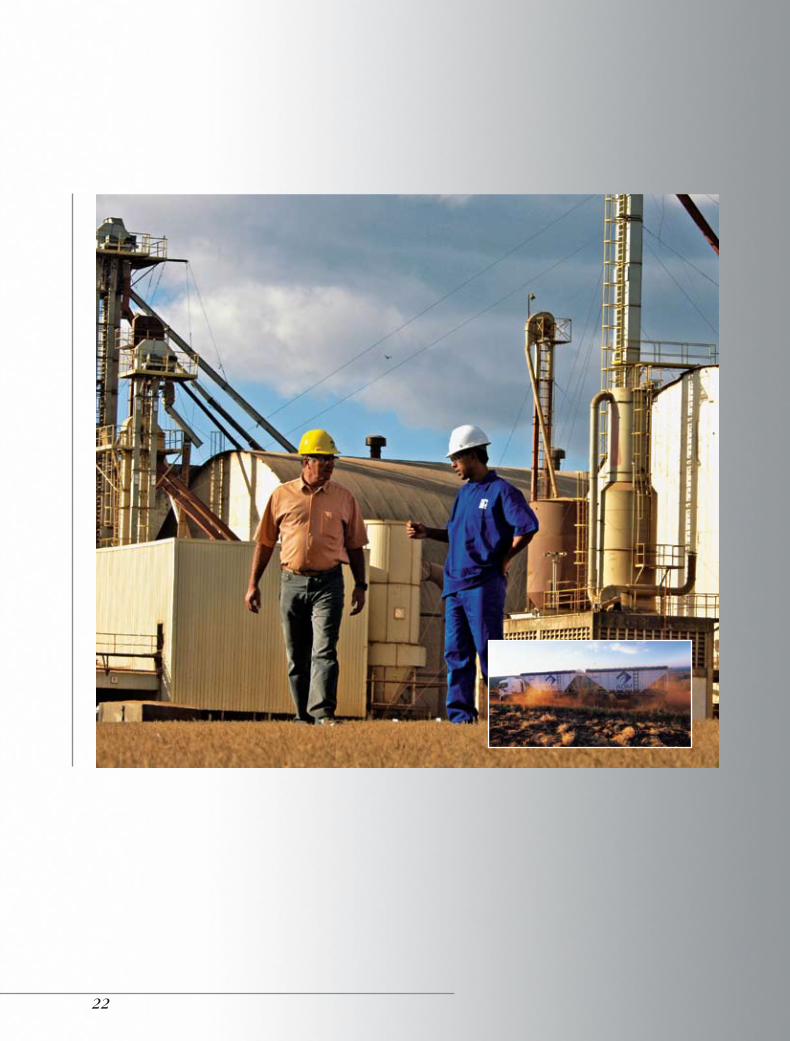
CONNECTING FARMERS WITH THE WORLD
Investments in infrastructure provide attractive opportuni-ties to add value to crops. Effective positioning of assets increases both capacity and flexibility, which facilitate stronger returns on capital.
In the global oilseeds market, South America gained the leading position in soybean production and export several years ago, with ample opportunities for further growth. Land under cultivation can be increased dramatically. Careful stewardship of farmland can create sustain-able agriculture and economic growth for farmers, while expanded soybean exports can meet the needs of millions of people. All these benefits depend, however, on the farmer’s ability to bring crops to market.
ADM is a major participant in South America’s agricultural economy, with origination and export operations in Brazil, Argentina, Paraguay and Bolivia. The Company is facilitat-ing expanded soybean production through investment in river barges and storage elevators. As farms expand in size and productivity, ADM will have assets in place to connect local crops with global commodity markets. A similar pattern of emerging agricultural growth is leading to new ADM investment in Eastern European nations.
Oilseed demand is expected to continue growing to meet rising demand for vegetable oils, animal feeds, biodiesel fuels and other commodities. ADM can support and profit from that growth through investment in well-positioned facilities that connect local farmers to global markets.
AtADM’ssoybean
facilityin
Uberlandia,Brazil,
ADMSupervisor
WellingtondosSantos
(right)discusses
agriculturalissues
withareafarmer
ArmandoMazzutti.
24 Archer Daniels Midland Company
FINANCIAL TABLE OF CONTENTS
Management’sDiscussionofOperationsandFinancialCondition . . . . . . . . . . . . . . . . . . 25
SummaryofSignificantAccountingPolicies . . . . . . . . . . . . . . . . . . . . . . . . . . . . . . . . . . . 36
ConsolidatedStatementsofEarnings . . . . . . . . . . . . . . . . . . . . . . . . . . . . . . . . . . . . . . . . . 39
ConsolidatedBalanceSheets . . . . . . . . . . . . . . . . . . . . . . . . . . . . . . . . . . . . . . . . . . . . . . . . 40
ConsolidatedStatementsofCashFlows . . . . . . . . . . . . . . . . . . . . . . . . . . . . . . . . . . . . . . . . 42
ConsolidatedStatementsofShareholders’Equity . . . . . . . . . . . . . . . . . . . . . . . . . . . . . . . . 43
NotestoConsolidatedFinancialStatements . . . . . . . . . . . . . . . . . . . . . . . . . . . . . . . . . . . . 44
Management’sReportonInternalControlOverFinancialReporting . . . . . . . . . . . . . . . . 55
ReportsofIndependentRegisteredPublicAccountingFirm . . . . . . . . . . . . . . . . . . . . . . . 56
QuarterlyFinancialData(Unaudited) . . . . . . . . . . . . . . . . . . . . . . . . . . . . . . . . . . . . . . . . 58
CommonStockMarketPricesandDividends . . . . . . . . . . . . . . . . . . . . . . . . . . . . . . . . . . . 59
Ten-YearSummary . . . . . . . . . . . . . . . . . . . . . . . . . . . . . . . . . . . . . . . . . . . . . . . . . . . . . . . . 60
2006 Annual Report 25
MANAGEMENT’S DISCUSSION OF OPERATIONS AND FINANCIAL CONDITION - JUNE 30, 2006
COMPANY OVERVIEWTheCompany isprincipallyengaged inprocuring, transporting,storing,processing,andmerchandisingagriculturalcommoditiesandproducts .TheCompany’soperationsareclassified into threereportablebusinesssegments:OilseedsProcessing,CornProcessing,andAgriculturalServices .Eachofthesesegmentsisorganizedbaseduponthenatureofproductsandservicesoffered .TheCompany’sremainingoperationsareaggregatedandclassifiedasOther .
TheOilseedsProcessing segment includesactivities related toprocessingoilseedssuchassoybeans,cottonseed,sunflowerseeds,canola, peanuts, and flaxseed into vegetable oils and mealsprincipallyforthefoodandfeedindustries .Inaddition,oilseedsmayberesoldintothemarketplaceasarawmaterialforotherprocessors .Crudevegetableoilissold“asis”orisfurtherprocessedbyrefining,bleaching,anddeodorizingintosaladoils .Saladoilscanbefurtherprocessedbyhydrogenatingand/orinteresterifyingintomargarine,shortening,andother foodproducts .Partially refinedoil is soldforuseinchemicals,paints,andotherindustrialproducts .Refinedoilcanbefurtherprocessedforuseintheproductionofbiodiesel .Oilseedmealsareprimaryingredientsusedinthemanufactureofcommerciallivestockandpoultryfeeds .
TheCornProcessing segment includesactivities related to theproductionofsweeteners,starches,dextrose,andsyrupsforthefoodandbeverageindustryaswellasactivitiesrelatedtotheproduction,byfermentation,ofbioproductssuchasalcohol,aminoacids,andotherspecialtyfoodandfeedingredients .
TheAgriculturalServicessegmentutilizestheCompany’sextensivegrainelevatorandtransportationnetworktobuy,store,clean,andtransportagriculturalcommodities,suchasoilseeds,corn,wheat,milo,oats,andbarley,andresells thesecommoditiesprimarilyasfeedingredientsandasrawmaterialsfortheagriculturalprocessingindustry .AgriculturalServices’grainsourcingandtransportationnetworkprovidesreliableandefficient services to theCompany’sagriculturalprocessingoperations .Also included inAgriculturalServicesare theactivitiesofA .C .Toepfer International,aglobalmerchandiserofagriculturalcommoditiesandprocessedproducts .
Other includes theCompany’s remainingoperations,consistingprincipallyof foodand feed ingredientbusinessesand financialactivities . Food and feed ingredient businesses include WheatProcessingwithactivitiesrelatedtotheproductionofwheatflour;Cocoa Processing with activities related to the production ofchocolateandcocoaproducts; theproductionofnaturalhealthandnutritionproducts;andtheproductionofotherspecialty foodandfeedingredients .Financialactivities includebanking,captiveinsurance,privateequityfundinvestments,andfuturescommissionmerchantactivities .
Operating Performance IndicatorsTheCompanyisexposedtocertainrisksinherenttoanagricultural-basedcommoditybusiness .These risksare furtherdescribed inthe“Critical AccountingPolicies”and“MarketRiskSensitiveInstrumentsandPositions”sectionsof“Management’sDiscussionofOperationsandFinancialCondition .”
TheCompany’sOilseedsProcessing,AgriculturalServices,andWheatProcessingoperationsareprincipallyagricultural commodity-basedbusinesseswherechanges in segment sellingpricesmovein relationship to changes in prices of the commodity-basedagricultural rawmaterials .Therefore, changes inagriculturalcommoditypriceshaverelativelyequal impactsonbothnetsalesandcostofproductssoldandminimalimpactonthegrossprofitofunderlyingtransactions .Asaresult,changesinnetsalesamountsofthesebusinesssegmentsdonotnecessarilycorrespondtothechangesingrossprofitrealizedbythesebusinesses .
TheCompany’sCornProcessingoperationsandcertainotherfoodandfeedprocessingoperationsalsoutilizeagriculturalcommodities(or products derived from agricultural commodities) as rawmaterials .Intheseoperations,agriculturalcommoditypricechangescanresultinsignificantfluctuationsincostofproductssoldandsuchpricechangescannotnecessarilybepasseddirectlythroughtothesellingpriceofthefinishedproducts .Forproductssuchasethanol,sellingpricesbearnodirectrelationshiptotherawmaterialcostoftheagriculturalcommodityfromwhichitisproduced .
The Company conducts its business in many countries . Forthemajorityof theCompany’s subsidiaries locatedoutside theUnitedStates,thelocalcurrencyisthefunctionalcurrency .Revenuesandexpensesdenominated in foreigncurrenciesare translatedintoU .S .dollarsat theweightedaverageexchangerates for theapplicableperiods .Fluctuations in theexchangeratesof foreigncurrencies,primarilytheEuroandBritishpound,ascomparedtotheU .S .dollarwillresult incorrespondingfluctuationsintherelativeU .S .dollarvalueof theCompany’s revenuesandexpenses .Theimpactofthesecurrencyexchangeratechanges,wheresignificant,isdiscussedbelow .
TheCompanymeasures theperformanceof itsbusinesssegmentsusingkeyoperatingstatisticssuchassegmentoperatingprofitandreturnonfixedcapitalinvestment .TheCompany’soperatingresultscanvarysignificantlyduetochangesinunpredictablefactorssuchasweatherconditions,plantings,government(domesticandforeign)farmprogramsandpolicies,changes inglobaldemandresultingfrompopulationgrowthandchanges instandardsof living,andglobalproductionof similarandcompetitivecrops .Due to theseunpredictable factors, theCompanydoesnotprovide forward-lookinginformationin“Management’sDiscussionofOperationsandFinancialCondition .”
26 Archer Daniels Midland Company
MANAGEMENT’S DISCUSSION OF OPERATIONS AND FINANCIAL CONDITION - JUNE 30, 2006 (CONTINUED)
2006 COMPARED TO 2005Asanagricultural-based commoditybusiness, theCompany issubject toavarietyofmarket factorswhichaffect theCompany’soperatingresults .StrongbiodieseldemandinEuropecontinuedtocreateincreasedvegetableoildemandandhaspositivelyimpactedrapeseedcrushingmargins inEurope .Abundantoilseedsuppliesandstrongproteinmealdemandhavepositively impactedoilseedcrushingmarginsinNorthAmerica .Agoodcornsupplyresultingin lowerprice levels forcorn favorably impactedcornprocessingoperations,whileethanolexperiencedgooddemandduetogasolinerefinersreplacingMTBEwithethanol .Soliddemandforsweetenerand starchproductshasalso improvedcornprocessing results .Duringthefirsthalfof2006,hurricanesinthegulfcoastregionoftheUnitedStatesdisruptedNorthAmericangrainoriginationandagriculturalcommodityexportoperations,negatively impactingexport sales volumes .Thegulf coasthurricanesalsodisruptedrivertransportation,resultinginincreasedbargedemandandbargefreightrates .
Net earnings increasedprincipally due to improvedoperatingresultsofOilseedsProcessingandCornProcessing . Inaddition,net earningsalso increaseddue toa$36million reduction inincome tax expense related to the recognition of federal andstate income tax credits and adjustments resulting from thereconciliation of filed tax returns to the previously estimatedtaxprovision .Earningsbefore income taxes includechargesof$31millionresultingfromtheCompany’sadoptionofStatementofFinancialAccountingStandards(SFAS)Number123(R)ShareBased Payment, $15 million resulting from the Company’sadoptionofFinancialAccountingStandardsBoardInterpretationNumber47,Accounting for Conditional Asset RetirementObligations,anInterpretationofFASBStatementNo.143(FIN47),$71millionrelatedtoabandonmentandwrite-downoflong-livedassets,$9millionrepresentingtheCompany’sshareofachargeforabandonmentandwrite-downof long-livedassetsreportedbyanunconsolidatedaffiliateoftheCompany,$12millionfromtheeffectofchangingcommoditypricesonLIFOinventoryvaluations,and$22millionassociatedwith theclosureofacitricacidplantandexitingtheEuropeananimalfeedbusiness .Earningsbeforeincometaxesalsoincludecreditsof$17millionfromthesaleoflong-livedassets,$46millionrelated toBrazilian transactional taxcredits,and$40million related to realized securitiesgains .Last year’searningsbefore income taxes includedcreditsof$114millionfromtheeffectofchangingcommoditypricesonLIFOinventoryvaluations,$114millionofrealizedsecuritiesgainfromthesaleof
Tate&LylePLCshares,and$45millionrepresentingtheCompany’sequityshareofthegainreportedbytheCompany’sunconsolidatedaffiliate, Compagnie Industrielle et Financiere des ProduitsAmylacesSA(CIP),uponthesaleofitsinterestinTate&LylePLC(the“CIPGain”) .Lastyear’searningsbefore income taxesalsoincludea$42millionchargeforabandonmentandwrite-downoflong-livedassets .
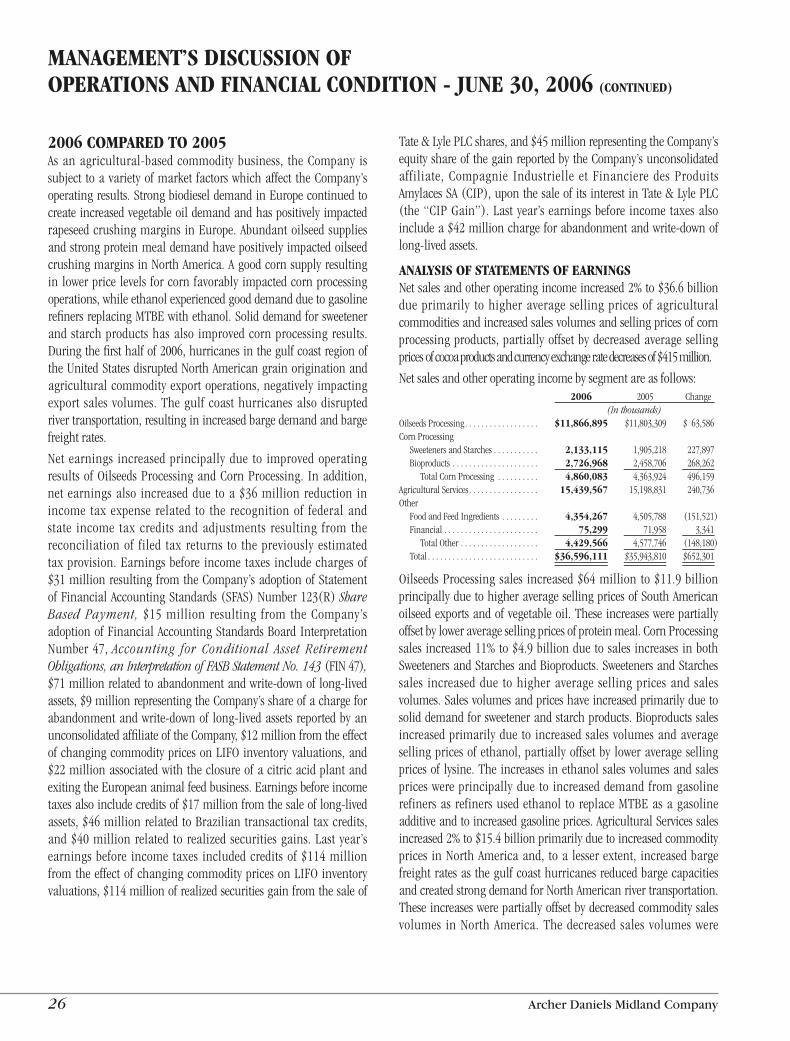
ANALYSIS OF STATEMENTS OF EARNINGSNetsalesandotheroperatingincomeincreased2%to$36 .6billiondueprimarily tohigher average sellingprices of agriculturalcommoditiesandincreasedsalesvolumesandsellingpricesofcornprocessingproducts,partiallyoffsetbydecreasedaveragesellingpricesofcocoaproductsandcurrencyexchangeratedecreasesof$415million .
Netsalesandotheroperatingincomebysegmentareasfollows: 2006 2005 Change (Inthousands)OilseedsProcessing . . . . . . . . . . . . . . . . . . $11,866,895 $11,803,309 $ 63,586CornProcessing SweetenersandStarches . . . . . . . . . . . 2,133,115 1,905,218 227,897 Bioproducts . . . . . . . . . . . . . . . . . . . . . 2,726,968 2,458,706 268,262 TotalCornProcessing . . . . . . . . . . 4,860,083 4,363,924 496,159AgriculturalServices . . . . . . . . . . . . . . . . . 15,439,567 15,198,831 240,736Other FoodandFeedIngredients . . . . . . . . . 4,354,267 4,505,788 (151,521) Financial . . . . . . . . . . . . . . . . . . . . . . . 75,299 71,958 3,341 TotalOther . . . . . . . . . . . . . . . . . . . 4,429,566 4,577,746 (148,180) Total . . . . . . . . . . . . . . . . . . . . . . . . . . . $36,596,111 $35,943,810 $652,301
OilseedsProcessing sales increased$64million to$11 .9billionprincipallyduetohigheraveragesellingpricesofSouthAmericanoilseedexportsandofvegetableoil .Theseincreaseswerepartiallyoffsetbyloweraveragesellingpricesofproteinmeal .CornProcessingsales increased11%to$4 .9billiondue tosales increases inbothSweetenersandStarchesandBioproducts .SweetenersandStarchessales increaseddue tohigher average sellingprices and salesvolumes .Salesvolumesandpriceshaveincreasedprimarilyduetosoliddemandforsweetenerandstarchproducts .Bioproductssalesincreasedprimarilydue to increasedsalesvolumesandaveragesellingpricesofethanol,partiallyoffsetby loweraveragesellingpricesof lysine .Theincreases inethanolsalesvolumesandsalespriceswereprincipallydue to increaseddemand fromgasolinerefinersas refinersusedethanol to replaceMTBEasagasolineadditiveandtoincreasedgasolineprices .AgriculturalServicessalesincreased2%to$15 .4billionprimarilyduetoincreasedcommodityprices inNorthAmericaand, toa lesserextent, increasedbargefreightratesas thegulfcoasthurricanesreducedbargecapacitiesandcreatedstrongdemandforNorthAmericanrivertransportation .Theseincreaseswerepartiallyoffsetbydecreasedcommoditysalesvolumes inNorthAmerica . Thedecreased sales volumeswere
2006 Annual Report 27
primarilyduetodisruptionsinNorthAmericangrainoriginationandexportactivitiescausedby thehurricanes in thegulfcoastregion .Othersalesdecreased3%to$4 .4billionprimarilyduetodecreasedaveragesellingpricesofcocoaproductsandlowersalesvolumesof formulafeedproducts .Thesedecreaseswerepartiallyoffsetbyincreasedaveragesellingpricesofwheatflourproductsduetohighercommodityprices .
Costofproductssoldincreased$118millionto$33 .6billiondueprimarilytohigheraveragepricesofagriculturalcommoditiesandincreasedmanufacturingcosts,partiallyoffsetbycurrencyexchangeratedecreasesof$389million .Manufacturingcosts increased$399millionprimarilyduetoincreasedenergycosts,achargeforabandonmentandwrite-downof long-livedassets,andincreasedemployee-relatedcosts .
Selling, general, and administrative expenses increased$112millionto$1 .2billionprincipallyduetoincreasedemployee-relatedcosts,includinga$31millionchargerelatedtotheadoptionofSFAS123(R),$20millionof severancecostsassociatedwiththeclosureofa citricacidplant,and increasedprovisions fordoubtfulaccounts .
Other income decreased $84 million due primarily to a$73milliondecrease inrealizedsecuritiesgains,a$55milliondecrease inequity in earningsofaffiliates,anda$39millionincrease in interest expense, partially offset bya$69millionincreaseininvestmentincome .Thedecreaseinrealizedsecuritiesgainsisprimarilyduetolastyear’s$114millionrealizedsecuritiesgain fromthesaleofTate&LylePLCshares,partiallyoffsetby$40millionofrealizedsecuritiesgainsduring2006 .Thedecreaseinequityinearningsofaffiliatesisprimarilyduetolastyear’sCIPGainandlowervaluationsof theCompany’sprivateequity fundinvestments,partiallyoffsetbyimprovedearningsoftheCompany’sAsianoilseedcrushingventures .Interestexpenseincreasedprimarilyduetohigheraverageborrowinglevelsandinterestrates .Investmentincomeincreasedprimarilydue to thereversalof$19millionofBrazilian transactional taxespreviouslyassessedon investmentincomeuponpositiveresolutionintheBrazilianSupremeCourt,higherlevelsofinvestedfunds,andhigherinterestrates .
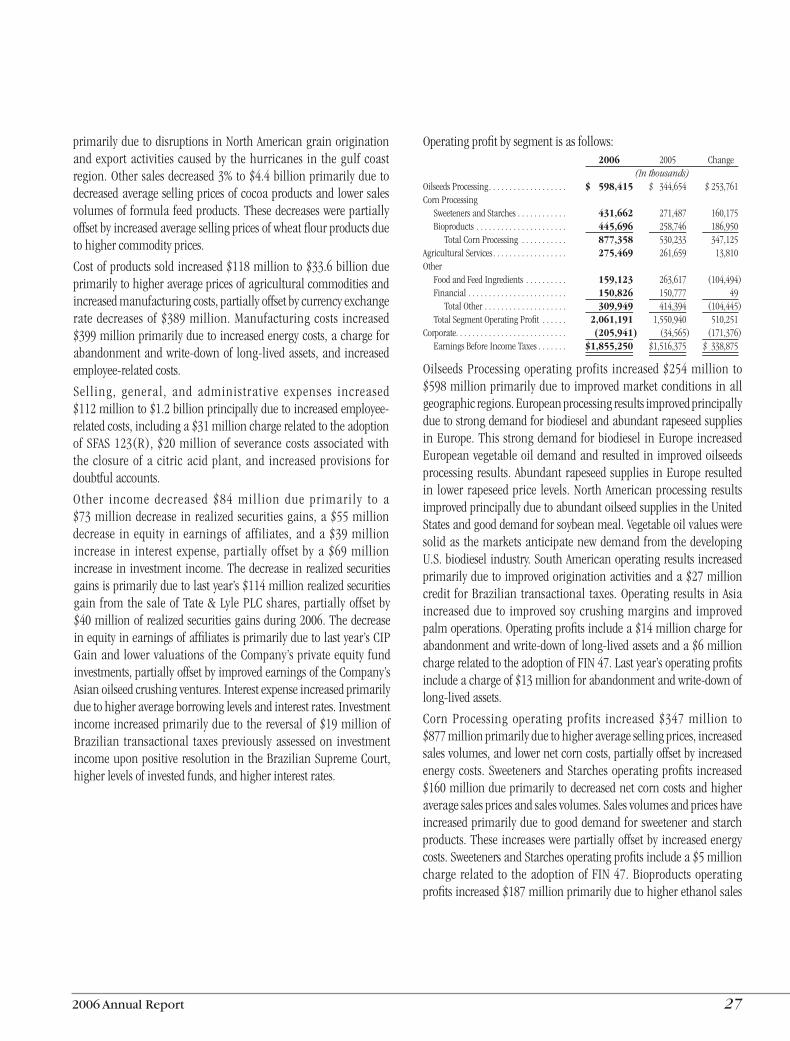
Operatingprofitbysegmentisasfollows: 2006 2005 Change (Inthousands)OilseedsProcessing . . . . . . . . . . . . . . . . . . . $ 598,415 $ 344,654 $253,761CornProcessing SweetenersandStarches . . . . . . . . . . . . 431,662 271,487 160,175 Bioproducts . . . . . . . . . . . . . . . . . . . . . . 445,696 258,746 186,950 TotalCornProcessing . . . . . . . . . . . 877,358 530,233 347,125AgriculturalServices . . . . . . . . . . . . . . . . . . 275,469 261,659 13,810Other FoodandFeedIngredients . . . . . . . . . . 159,123 263,617 (104,494) Financial . . . . . . . . . . . . . . . . . . . . . . . . 150,826 150,777 49 TotalOther . . . . . . . . . . . . . . . . . . . . 309,949 414,394 (104,445) TotalSegmentOperatingProfit . . . . . . 2,061,191 1,550,940 510,251Corporate . . . . . . . . . . . . . . . . . . . . . . . . . . . (205,941) (34,565) (171,376) EarningsBeforeIncomeTaxes . . . . . . . $1,855,250 $1,516,375 $ 338,875
OilseedsProcessingoperatingprofits increased$254million to$598millionprimarilydue to improvedmarketconditions inallgeographicregions .EuropeanprocessingresultsimprovedprincipallyduetostrongdemandforbiodieselandabundantrapeseedsuppliesinEurope .Thisstrongdemandforbiodiesel inEurope increasedEuropeanvegetableoildemandandresultedinimprovedoilseedsprocessingresults .Abundantrapeseedsupplies inEuroperesultedin lowerrapeseedprice levels .NorthAmericanprocessingresultsimprovedprincipallyduetoabundantoilseedsuppliesintheUnitedStatesandgooddemandforsoybeanmeal .Vegetableoilvaluesweresolidas themarketsanticipatenewdemandfromthedevelopingU .S .biodieselindustry .SouthAmericanoperatingresultsincreasedprimarilyduetoimprovedoriginationactivitiesanda$27millioncredit forBrazilian transactional taxes .Operatingresults inAsiaincreaseddue to improved soycrushingmarginsand improvedpalmoperations .Operatingprofitsincludea$14millionchargeforabandonmentandwrite-downoflong-livedassetsanda$6millionchargerelatedtotheadoptionofFIN47 .Lastyear’soperatingprofitsincludeachargeof$13millionforabandonmentandwrite-downoflong-livedassets .
Corn Processing operating profits increased $347 million to$877millionprimarilyduetohigheraveragesellingprices,increasedsalesvolumes,andlowernetcorncosts,partiallyoffsetbyincreasedenergycosts .SweetenersandStarchesoperatingprofits increased$160milliondueprimarilytodecreasednetcorncostsandhigheraveragesalespricesandsalesvolumes .Salesvolumesandpriceshaveincreasedprimarilyduetogooddemandforsweetenerandstarchproducts .Theseincreaseswerepartiallyoffsetby increasedenergycosts .SweetenersandStarchesoperatingprofitsincludea$5millionchargerelated to theadoptionofFIN47 .Bioproductsoperatingprofitsincreased$187millionprimarilyduetohigherethanolsales
28 Archer Daniels Midland Company
MANAGEMENT’S DISCUSSION OF OPERATIONS AND FINANCIAL CONDITION - JUNE 30, 2006 (CONTINUED)
volumesandaveragesellingpricesanddecreasednetcorncosts,partiallyoffsetby increasedenergycostsandlower lysineaveragesellingprices .Theincreasesinethanolsalesvolumesandaveragesalespriceswereprincipallyduetoincreaseddemandfromgasolinerefinersas refinersusedethanol to replaceMTBEasagasolineadditiveandfromincreasedgasolineprices .Bioproductsoperatingprofitsincludea$6millionchargeforabandonmentandwrite-downoflong-livedassets,a$2millionchargerelatedtotheadoptionofFIN47,and$6millionofcostsrelatedtotheclosureofacitricacidplant .Lastyear’sBioproductsoperatingprofitsincludea$16millionchargeforabandonmentandwrite-downoflong-livedassets .
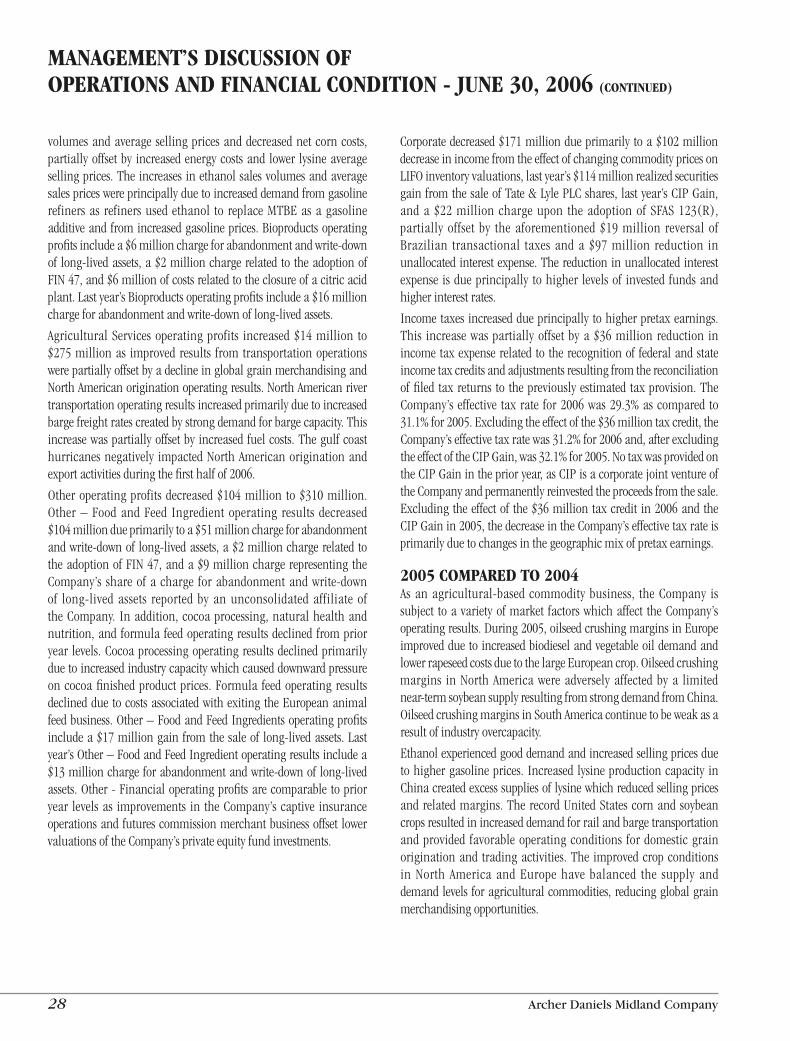
AgriculturalServicesoperatingprofits increased$14million to$275millionas improvedresults fromtransportationoperationswerepartiallyoffsetbyadeclineinglobalgrainmerchandisingandNorthAmericanoriginationoperatingresults .NorthAmericanrivertransportationoperatingresultsincreasedprimarilyduetoincreasedbargefreightratescreatedbystrongdemandforbargecapacity .Thisincreasewaspartiallyoffsetbyincreasedfuelcosts .Thegulfcoasthurricanesnegatively impactedNorthAmericanoriginationandexportactivitiesduringthefirsthalfof2006 .
Otheroperatingprofitsdecreased$104million to$310million .Other–FoodandFeed Ingredientoperating results decreased$104milliondueprimarilytoa$51millionchargeforabandonmentandwrite-downoflong-livedassets,a$2millionchargerelatedtotheadoptionofFIN47,anda$9millionchargerepresentingtheCompany’s shareofacharge forabandonmentandwrite-downof long-livedassets reportedbyanunconsolidatedaffiliate oftheCompany . Inaddition,cocoaprocessing,naturalhealthandnutrition,andformulafeedoperatingresultsdeclinedfromprioryear levels .Cocoaprocessingoperatingresultsdeclinedprimarilyduetoincreasedindustrycapacitywhichcauseddownwardpressureoncocoafinishedproductprices .Formula feedoperatingresultsdeclinedduetocostsassociatedwithexitingtheEuropeananimalfeedbusiness .Other–FoodandFeedIngredientsoperatingprofitsincludea$17milliongainfromthesaleof long-livedassets .Lastyear’sOther–FoodandFeedIngredientoperatingresultsincludea$13millionchargeforabandonmentandwrite-downoflong-livedassets .Other-Financialoperatingprofitsarecomparabletoprioryear levelsas improvements in theCompany’scaptive insuranceoperationsandfuturescommissionmerchantbusinessoffsetlowervaluationsoftheCompany’sprivateequityfundinvestments .
Corporatedecreased$171milliondueprimarilytoa$102milliondecreaseinincomefromtheeffectofchangingcommoditypricesonLIFOinventoryvaluations,lastyear’s$114millionrealizedsecuritiesgainfromthesaleofTate&LylePLCshares,lastyear’sCIPGain,anda$22million chargeupon theadoptionofSFAS123(R),partially offset by theaforementioned$19million reversal ofBrazilian transactional taxes and a $97 million reduction inunallocatedinterestexpense .Thereductioninunallocatedinterestexpense isdueprincipally tohigher levelsof invested fundsandhigherinterestrates .
Incometaxesincreaseddueprincipallytohigherpretaxearnings .This increasewaspartiallyoffsetbya$36millionreduction inincometaxexpenserelatedtotherecognitionof federalandstateincometaxcreditsandadjustmentsresultingfromthereconciliationoffiled taxreturns to thepreviouslyestimatedtaxprovision .TheCompany’seffective taxrate for2006was29 .3%ascompared to31 .1%for2005 .Excludingtheeffectofthe$36milliontaxcredit,theCompany’seffectivetaxratewas31 .2%for2006and,afterexcludingtheeffectoftheCIPGain,was32 .1%for2005 .NotaxwasprovidedontheCIPGainintheprioryear,asCIPisacorporatejointventureoftheCompanyandpermanentlyreinvestedtheproceedsfromthesale .Excludingtheeffectof the$36milliontaxcredit in2006andtheCIPGainin2005,thedecreaseintheCompany’seffectivetaxrateisprimarilyduetochangesinthegeographicmixofpretaxearnings .
2005 COMPARED TO 2004Asanagricultural-basedcommoditybusiness, theCompany issubject toavarietyofmarket factorswhichaffect theCompany’soperatingresults .During2005,oilseedcrushingmarginsinEuropeimprovedduetoincreasedbiodieselandvegetableoildemandandlowerrapeseedcostsduetothelargeEuropeancrop .Oilseedcrushingmargins inNorthAmericawereadverselyaffectedbya limitednear-termsoybeansupplyresultingfromstrongdemandfromChina .OilseedcrushingmarginsinSouthAmericacontinuetobeweakasaresultofindustryovercapacity .
Ethanolexperiencedgooddemandandincreasedsellingpricesduetohighergasolineprices .Increasedlysineproductioncapacity inChinacreatedexcesssuppliesoflysinewhichreducedsellingpricesandrelatedmargins .TherecordUnitedStatescornandsoybeancropsresultedinincreaseddemandforrailandbargetransportationandprovided favorableoperatingconditions fordomesticgrainoriginationandtradingactivities .The improvedcropconditionsin North America and Europe have balanced the supply anddemandlevelsforagriculturalcommodities,reducingglobalgrainmerchandisingopportunities .
2006 Annual Report 29
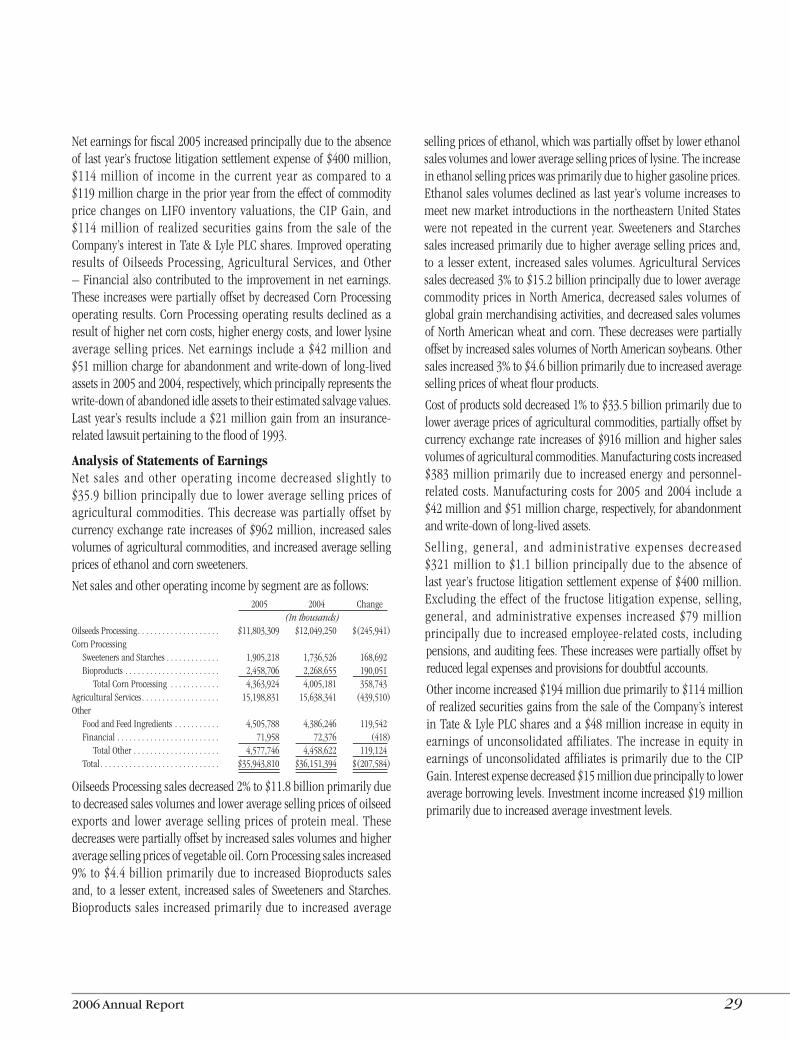
Netearningsforfiscal2005increasedprincipallyduetotheabsenceoflastyear’sfructoselitigationsettlementexpenseof$400million,$114millionof income in the current yearas compared toa$119millionchargeintheprioryearfromtheeffectofcommoditypricechangesonLIFO inventoryvaluations, theCIPGain,and$114 million of realized securities gains from the sale of theCompany’sinterest inTate&LylePLCshares .ImprovedoperatingresultsofOilseedsProcessing,AgriculturalServices,andOther–Financialalsocontributedto theimprovementinnetearnings .TheseincreaseswerepartiallyoffsetbydecreasedCornProcessingoperatingresults .CornProcessingoperatingresultsdeclinedasaresultofhighernetcorncosts,higherenergycosts,andlowerlysineaverage sellingprices .Net earnings includea$42millionand$51millionchargeforabandonmentandwrite-downoflong-livedassetsin2005and2004,respectively,whichprincipallyrepresentsthewrite-downofabandonedidleassetstotheirestimatedsalvagevalues .Lastyear’sresults includea$21milliongainfromaninsurance-relatedlawsuitpertainingtothefloodof1993 .
Analysis of Statements of EarningsNet sales and other operating income decreased slightly to$35 .9billionprincipallydue to loweraverage sellingpricesofagricultural commodities .Thisdecreasewaspartiallyoffsetbycurrencyexchangerate increasesof$962million, increasedsalesvolumesofagriculturalcommodities,andincreasedaveragesellingpricesofethanolandcornsweeteners .
Netsalesandotheroperatingincomebysegmentareasfollows: 2005 2004 Change (Inthousands)OilseedsProcessing . . . . . . . . . . . . . . . . . . . . $11,803,309 $12,049,250 $(245,941)CornProcessing SweetenersandStarches . . . . . . . . . . . . . 1,905,218 1,736,526 168,692 Bioproducts . . . . . . . . . . . . . . . . . . . . . . . 2,458,706 2,268,655 190,051 TotalCornProcessing . . . . . . . . . . . . 4,363,924 4,005,181 358,743AgriculturalServices . . . . . . . . . . . . . . . . . . . 15,198,831 15,638,341 (439,510)Other FoodandFeedIngredients . . . . . . . . . . . 4,505,788 4,386,246 119,542 Financial . . . . . . . . . . . . . . . . . . . . . . . . . 71,958 72,376 (418) TotalOther . . . . . . . . . . . . . . . . . . . . . 4,577,746 4,458,622 119,124 Total . . . . . . . . . . . . . . . . . . . . . . . . . . . . . $35,943,810 $36,151,394 $(207,584)
OilseedsProcessingsalesdecreased2%to$11 .8billionprimarilyduetodecreasedsalesvolumesandloweraveragesellingpricesofoilseedexportsand loweraverage sellingpricesofproteinmeal .Thesedecreaseswerepartiallyoffsetbyincreasedsalesvolumesandhigheraveragesellingpricesofvegetableoil .CornProcessingsalesincreased9% to$4 .4billionprimarilydue to increasedBioproducts salesand,toalesserextent, increasedsalesofSweetenersandStarches .Bioproducts sales increasedprimarilydue to increasedaverage
sellingpricesofethanol,whichwaspartiallyoffsetbylowerethanolsalesvolumesandloweraveragesellingpricesoflysine .Theincreaseinethanolsellingpriceswasprimarilyduetohighergasolineprices .Ethanolsalesvolumesdeclinedas lastyear’svolumeincreases tomeetnewmarket introductionsinthenortheasternUnitedStateswerenot repeated in thecurrentyear .SweetenersandStarchessalesincreasedprimarilyduetohigheraveragesellingpricesand,toa lesserextent, increasedsalesvolumes .AgriculturalServicessalesdecreased3%to$15 .2billionprincipallyduetoloweraveragecommodityprices inNorthAmerica,decreasedsalesvolumesofglobalgrainmerchandisingactivities,anddecreasedsalesvolumesofNorthAmericanwheatandcorn .ThesedecreaseswerepartiallyoffsetbyincreasedsalesvolumesofNorthAmericansoybeans .Othersalesincreased3%to$4 .6billionprimarilyduetoincreasedaveragesellingpricesofwheatflourproducts .
Costofproductssolddecreased1%to$33 .5billionprimarilyduetoloweraveragepricesofagriculturalcommodities,partiallyoffsetbycurrencyexchangerateincreasesof$916millionandhighersalesvolumesofagriculturalcommodities .Manufacturingcostsincreased$383millionprimarilydue to increasedenergyandpersonnel-relatedcosts .Manufacturingcosts for2005and2004 includea$42millionand$51millioncharge,respectively,forabandonmentandwrite-downoflong-livedassets .
Selling, general, and administrative expenses decreased$321million to$1 .1billionprincipallydue to theabsenceoflastyear’s fructose litigationsettlementexpenseof$400million .Excluding theeffectof the fructose litigationexpense, selling,general, and administrative expenses increased $79 millionprincipallydue to increasedemployee-related costs, includingpensions,andauditingfees .Theseincreaseswerepartiallyoffsetbyreducedlegalexpensesandprovisionsfordoubtfulaccounts .
Otherincomeincreased$194milliondueprimarilyto$114millionofrealizedsecuritiesgainsfromthesaleoftheCompany’sinterestinTate&LylePLCsharesanda$48millionincreaseinequityinearningsofunconsolidatedaffiliates .The increase inequity inearningsofunconsolidatedaffiliates isprimarilydue to theCIPGain .Interestexpensedecreased$15milliondueprincipallytoloweraverageborrowinglevels .Investmentincomeincreased$19millionprimarilyduetoincreasedaverageinvestmentlevels .
30 Archer Daniels Midland Company
MANAGEMENT’S DISCUSSION OF OPERATIONS AND FINANCIAL CONDITION - JUNE 30, 2006 (CONTINUED)
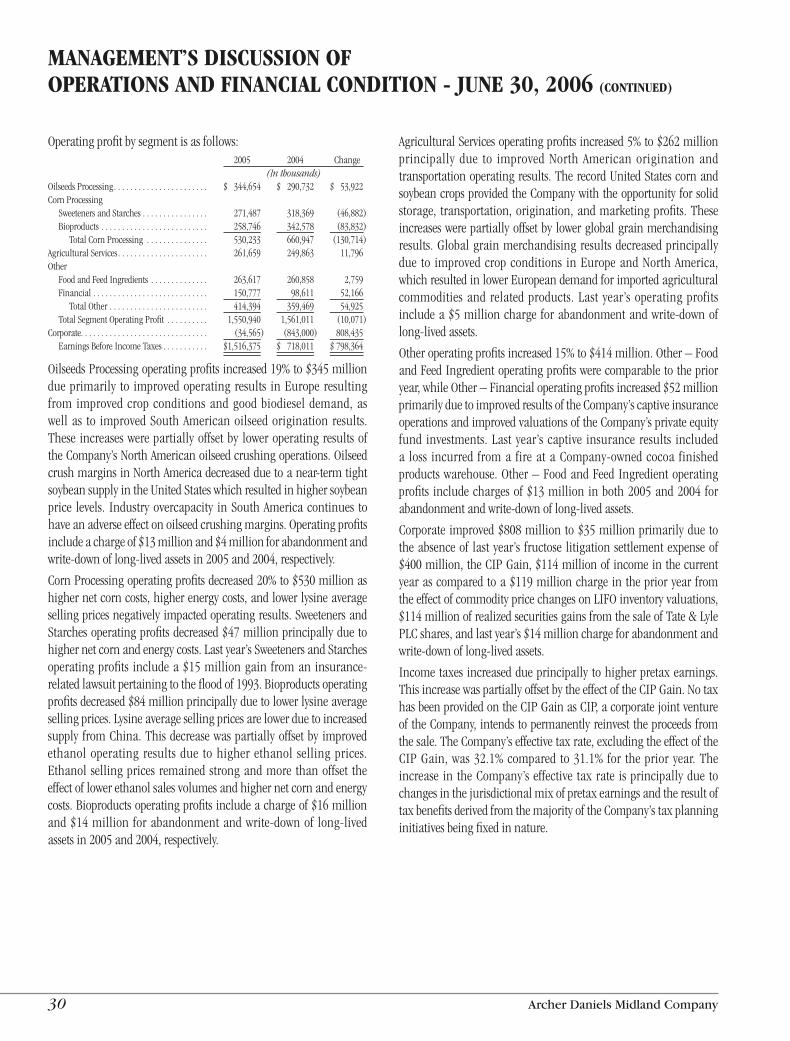
Operatingprofitbysegmentisasfollows: 2005 2004 Change (Inthousands)OilseedsProcessing . . . . . . . . . . . . . . . . . . . . . . . $ 344,654 $ 290,732 $ 53,922CornProcessing SweetenersandStarches . . . . . . . . . . . . . . . . 271,487 318,369 (46,882) Bioproducts . . . . . . . . . . . . . . . . . . . . . . . . . . 258,746 342,578 (83,832) TotalCornProcessing . . . . . . . . . . . . . . . 530,233 660,947 (130,714)AgriculturalServices . . . . . . . . . . . . . . . . . . . . . . 261,659 249,863 11,796Other FoodandFeedIngredients . . . . . . . . . . . . . . 263,617 260,858 2,759 Financial . . . . . . . . . . . . . . . . . . . . . . . . . . . . 150,777 98,611 52,166 TotalOther . . . . . . . . . . . . . . . . . . . . . . . . 414,394 359,469 54,925 TotalSegmentOperatingProfit . . . . . . . . . . 1,550,940 1,561,011 (10,071)Corporate . . . . . . . . . . . . . . . . . . . . . . . . . . . . . . . (34,565) (843,000) 808,435 EarningsBeforeIncomeTaxes . . . . . . . . . . . $1,516,375 $ 718,011 $798,364
OilseedsProcessingoperatingprofitsincreased19%to$345milliondueprimarily to improvedoperatingresults inEuroperesultingfrom improvedcropconditionsandgoodbiodieseldemand,aswellas to improvedSouthAmericanoilseedoriginationresults .These increaseswerepartiallyoffsetby loweroperatingresultsoftheCompany’sNorthAmericanoilseedcrushingoperations .OilseedcrushmarginsinNorthAmericadecreasedduetoanear-termtightsoybeansupplyintheUnitedStateswhichresultedinhighersoybeanprice levels . Industryovercapacity inSouthAmericacontinues tohaveanadverseeffectonoilseedcrushingmargins .Operatingprofitsincludeachargeof$13millionand$4millionforabandonmentandwrite-downoflong-livedassetsin2005and2004,respectively .
CornProcessingoperatingprofitsdecreased20%to$530millionashighernetcorncosts,higherenergycosts,andlowerlysineaveragesellingpricesnegativelyimpactedoperatingresults .SweetenersandStarchesoperatingprofitsdecreased$47millionprincipallyduetohighernetcornandenergycosts .Lastyear’sSweetenersandStarchesoperatingprofits includea$15milliongain fromaninsurance-relatedlawsuitpertainingtothefloodof1993 .Bioproductsoperatingprofitsdecreased$84millionprincipallyduetolowerlysineaveragesellingprices .LysineaveragesellingpricesarelowerduetoincreasedsupplyfromChina .Thisdecreasewaspartiallyoffsetbyimprovedethanoloperating resultsdue tohigher ethanol sellingprices .Ethanolsellingpricesremainedstrongandmore thanoffset theeffectoflowerethanolsalesvolumesandhighernetcornandenergycosts .Bioproductsoperatingprofitsincludeachargeof$16millionand$14million forabandonmentandwrite-downof long-livedassetsin2005and2004,respectively .
AgriculturalServicesoperatingprofitsincreased5%to$262millionprincipally due to improved North American origination andtransportationoperatingresults .TherecordUnitedStatescornandsoybeancropsprovidedtheCompanywiththeopportunityforsolidstorage, transportation,origination,andmarketingprofits .Theseincreaseswerepartiallyoffsetbylowerglobalgrainmerchandisingresults .Globalgrainmerchandisingresultsdecreasedprincipallydue to improvedcropconditions inEuropeandNorthAmerica,whichresultedinlowerEuropeandemandforimportedagriculturalcommoditiesand relatedproducts .Last year’soperatingprofitsincludea$5millioncharge forabandonmentandwrite-downoflong-livedassets .
Otheroperatingprofitsincreased15%to$414million .Other–FoodandFeedIngredientoperatingprofitswerecomparabletotheprioryear,whileOther–Financialoperatingprofitsincreased$52millionprimarilyduetoimprovedresultsoftheCompany’scaptiveinsuranceoperationsandimprovedvaluationsoftheCompany’sprivateequityfund investments .Lastyear’scaptive insurance results includeda loss incurred froma fireataCompany-ownedcocoa finishedproductswarehouse .Other–FoodandFeedIngredientoperatingprofits includechargesof$13millioninboth2005and2004forabandonmentandwrite-downoflong-livedassets .
Corporate improved$808millionto$35millionprimarilyduetotheabsenceof lastyear’s fructose litigationsettlementexpenseof$400million,theCIPGain,$114millionofincomeinthecurrentyearascomparedtoa$119millionchargeintheprioryearfromtheeffectofcommoditypricechangesonLIFOinventoryvaluations,$114millionofrealizedsecuritiesgainsfromthesaleofTate&LylePLCshares,andlastyear’s$14millionchargeforabandonmentandwrite-downoflong-livedassets .
Incometaxesincreaseddueprincipally tohigherpretaxearnings .ThisincreasewaspartiallyoffsetbytheeffectoftheCIPGain .NotaxhasbeenprovidedontheCIPGainasCIP,acorporatejointventureoftheCompany,intendstopermanentlyreinvesttheproceedsfromthesale .TheCompany’seffectivetaxrate,excludingtheeffectoftheCIPGain,was32 .1%compared to31 .1% for theprioryear .Theincrease in theCompany’seffective taxrate isprincipallydue tochangesinthejurisdictionalmixofpretaxearningsandtheresultoftaxbenefitsderivedfromthemajorityoftheCompany’staxplanninginitiativesbeingfixedinnature .
2006 Annual Report 3�
LIQUIDITY AND CAPITAL RESOURCESTheCompany’sobjective is tohavesufficient liquidity,balancesheetstrength,andfinancialflexibility to fundtheoperatingandcapitalrequirementsofacapitalintensiveagricultural-basedcommoditybusiness .
AtJune30,2006,theCompanycontinuedtoshowsubstantialliquiditywithworkingcapitalof$5 .7billionandacurrentratio,definedascurrentassetsdividedbycurrentliabilities,of1 .9to1 .Includedinworkingcapitalis$1 .1billionofcash,cashequivalents,andshort-termmarketablesecuritiesaswellas$3 .2billionofreadilymarketablecommodityinventories .Cashgeneratedfromoperatingactivitiestotaled$1 .4billionfortheyearcomparedto$2 .1billionlastyear .Thisdecreasewasprimarilyduetoanincreaseinworkingcapitalprincipallyrelatedtotheimpactofincreasedinventorylevelsofcommodity-basedagriculturalrawmaterialsanda$186millionincreaseinpensioncontributions .Cashusedininvestingactivitiesincreased$767millionfortheyearto$1 .1billiondueprimarilytolastyear’ssaleofTate&LylePLCsharesandincreasedinvestmentsinacquiredbusinesses,affiliates,andcapitalexpenditures .Cashgeneratedbyfinancingactivitieswas$283millioncomparedtocashusedinfinancingactivitiesof$1 .8billionlastyear .Netlong-termborrowingsincreasedprimarilyasaresultoftheissuanceof$600millionof30-yeardebenturesinSeptember2005 .Borrowingsunderlineofcreditagreementswere$105millionin2006comparedtopaymentsof$1 .4billionin2005dueprincipallytoincreasedworkingcapitalrequirementsresultingfromincreasedlevelsofcommodity-basedagriculturalrawmaterials .PurchasesoftheCompany’scommonstockdecreased$137million .Cashdividendspaidin2006were$242millionascomparedto$209millionin2005 .
CapitalresourceswerestrengthenedasshownbytheincreaseintheCompany’snetworthfrom$8 .4billionto$9 .8billion .TheCompany’sratiooflong-termdebttototalcapital(thesumoftheCompany’slong-termdebtandshareholders’equity)was29%atJune30,2006and30%atJune30,2005 .ThisratioisameasureoftheCompany’slong-termliquidityandisanindicatoroffinancialflexibility .TheCompanycurrentlyhas$3 .6billionofcommercialpaperandcommercialbanklinesavailabletomeetseasonalcashrequirementsofwhich$2 .4billionarecommittedand$1 .2billionareuncommitted .AtJune30,2006,theCompanyhad$549millionofshort-termdebtoutstanding .Standard&Poor’sandMoody’sratetheCompany’scommercialpaperasA-1andP-1,respectively,andratetheCompany’slong-termdebtasA+andA2,respectively .Inadditiontothecashflowgeneratedfromoperations,theCompanyhasaccesstoequityanddebtcapitalthroughnumerousalternativesfrompublicandprivatesourcesindomesticandinternationalmarkets .
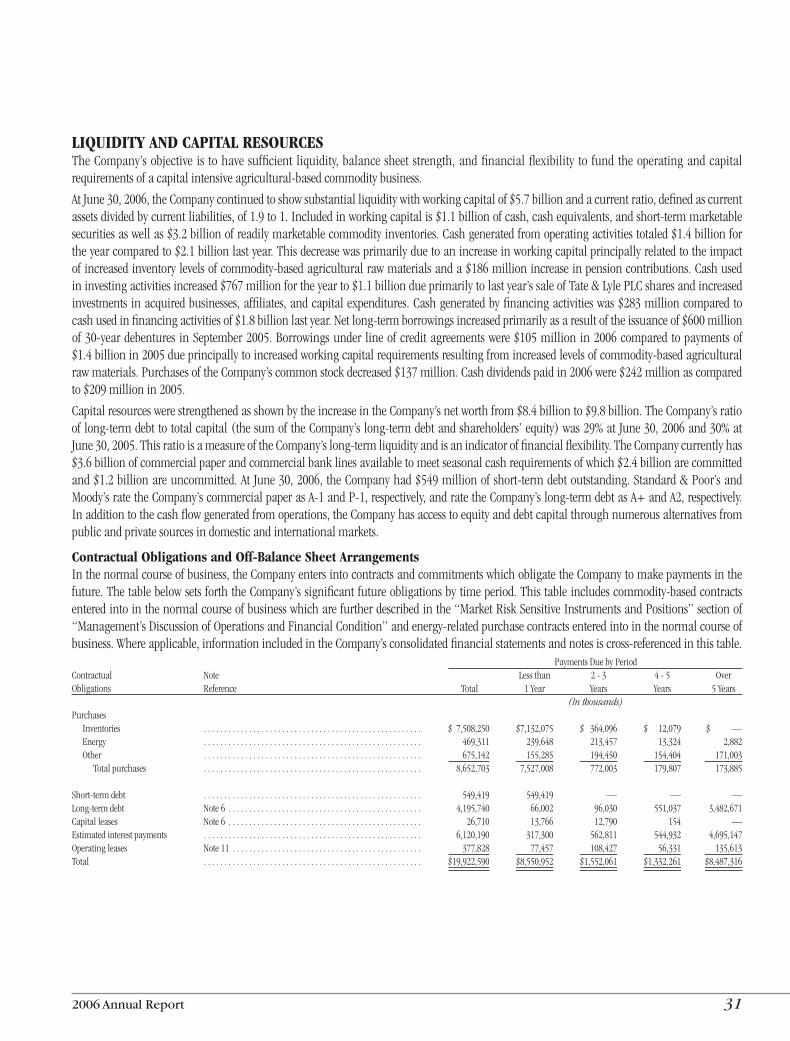
Contractual Obligations and Off-Balance Sheet ArrangementsInthenormalcourseofbusiness,theCompanyentersintocontractsandcommitmentswhichobligatetheCompanytomakepaymentsinthefuture .ThetablebelowsetsforththeCompany’ssignificantfutureobligationsbytimeperiod .Thistableincludescommodity-basedcontractsenteredintointhenormalcourseofbusinesswhicharefurtherdescribedinthe“MarketRiskSensitiveInstrumentsandPositions”sectionof“Management’sDiscussionofOperationsandFinancialCondition”andenergy-relatedpurchasecontractsenteredintointhenormalcourseofbusiness .Whereapplicable,informationincludedintheCompany’sconsolidatedfinancialstatementsandnotesiscross-referencedinthistable . PaymentsDuebyPeriodContractual Note Lessthan 2-3 4-5 OverObligations Reference Total 1Year Years Years 5Years (Inthousands)Purchases Inventories . . . . . . . . . . . . . . . . . . . . . . . . . . . . . . . . . . . . . . . . . . . . . . . . . . . . . $ 7,508,250 $7,132,075 $ 364,096 $ 12,079 $ — Energy . . . . . . . . . . . . . . . . . . . . . . . . . . . . . . . . . . . . . . . . . . . . . . . . . . . . . 469,311 239,648 213,457 13,324 2,882 Other . . . . . . . . . . . . . . . . . . . . . . . . . . . . . . . . . . . . . . . . . . . . . . . . . . . . . 675,142 155,285 194,450 154,404 171,003 Totalpurchases . . . . . . . . . . . . . . . . . . . . . . . . . . . . . . . . . . . . . . . . . . . . . . . . . . . . . 8,652,703 7,527,008 772,003 179,807 173,885
Short-termdebt . . . . . . . . . . . . . . . . . . . . . . . . . . . . . . . . . . . . . . . . . . . . . . . . . . . . . 549,419 549,419 — — —Long-termdebt Note6 . . . . . . . . . . . . . . . . . . . . . . . . . . . . . . . . . . . . . . . . . . . . . . . 4,195,740 66,002 96,030 551,037 3,482,671Capitalleases Note6 . . . . . . . . . . . . . . . . . . . . . . . . . . . . . . . . . . . . . . . . . . . . . . . 26,710 13,766 12,790 154 —Estimatedinterestpayments . . . . . . . . . . . . . . . . . . . . . . . . . . . . . . . . . . . . . . . . . . . . . . . . . . . . . 6,120,190 317,300 562,811 544,932 4,695,147Operatingleases Note11 . . . . . . . . . . . . . . . . . . . . . . . . . . . . . . . . . . . . . . . . . . . . . . 377,828 77,457 108,427 56,331 135,613Total . . . . . . . . . . . . . . . . . . . . . . . . . . . . . . . . . . . . . . . . . . . . . . . . . . . . . $19,922,590 $8,550,952 $1,552,061 $1,332,261 $8,487,316
32 Archer Daniels Midland Company
MANAGEMENT’S DISCUSSION OF OPERATIONS AND FINANCIAL CONDITION - JUNE 30, 2006 (CONTINUED)
AtJune30,2006,theCompanyestimatesitwillspendapproximately$3 .1billionover thenext fouryears tocompleteapprovedcapitalprojectsandacquisitions .TheCompany isa limitedpartner invariousprivateequity fundswhich investprimarily inemergingmarkets .At June30,2006, theCompany’scarryingvalueof theselimitedpartnership investmentswas$224million .TheCompanyhas futurecapitalcommitments related to thesepartnershipsof$138millionandexpects themajorityof theseadditionalcapitalcommitments,ifcalledfor,tobefundedbycashflowsgeneratedbythepartnerships .TheCompanyalsohasoutstandinglettersofcreditandsuretybondsof$334millionatJune30,2006 .
Inaddition, theCompanyhasenteredintoagreements,primarilydebtguaranteeagreements related to equity-method investees,whichcouldobligatetheCompanytomakefuturepayments .TheCompany’sliabilityundertheseagreementsarisesonlyiftheprimaryentity fails toperform its contractualobligation .TheCompanyhas collateral foraportionof these contingentobligations .AtJune30,2006, thesecontingentobligationstotaledapproximately$250 million . Amounts outstanding under these contingentobligationswere$159millionatJune30,2006 .
Critical Accounting PoliciesTheprocessofpreparingfinancialstatementsrequiresmanagementtomakeestimatesand judgments thataffect thecarryingvaluesof theCompany’sassetsand liabilitiesaswellas therecognitionof revenuesand expenses .These estimatesand judgmentsarebasedontheCompany’shistoricalexperienceandmanagement’sknowledgeandunderstandingofcurrentfactsandcircumstances .CertainoftheCompany’saccountingpoliciesareconsideredcritical,as thesepoliciesare important to thedepictionof theCompany’sfinancialstatementsandrequiresignificantorcomplexjudgmentbymanagement .Managementhasdiscussedwith theCompany’sAudit Committee the development, selection, disclosure, andapplicationof thesecriticalaccountingpolicies .FollowingaretheaccountingpoliciesmanagementconsiderscriticaltotheCompany’sfinancialstatements .
InventoriesandDerivativesCertainof theCompany’smerchandisableagriculturalcommodityinventories, forwardfixed-pricepurchaseandsalecontracts,andexchange-tradedfuturesandoptionscontractsarevaluedatestimatedmarketvalues .Thesemerchandisableagriculturalcommoditiesarefreelytraded,havequotedmarketprices,andmaybesoldwithoutsignificantadditionalprocessing .Managementestimatesmarketvaluebasedonexchange-quotedprices,adjustedfordifferencesinlocalmarkets .Changesinthemarketvaluesoftheseinventoriesandcontractsarerecognizedinthestatementofearningsasacomponentofcostofproductssold .Ifmanagementuseddifferentmethodsorfactorstoestimatemarketvalue,amountsreportedasinventoriesandcostofproductssoldcoulddiffer .Additionally,ifmarketconditionschangesubsequenttoyear-end,amountsreportedinfutureperiodsasinventoriesandcostofproductssoldcoulddiffer .
TheCompany, fromtime to time,usesderivativecontracts tofixthepurchasepriceofanticipatedvolumesofcommodities tobepurchasedandprocessed ina futuremonth, to fix thepurchasepriceof theCompany’santicipatednaturalgas requirements forcertainproductionfacilities,andtofixthesalespriceofanticipatedvolumesofethanol .Thesederivativecontractsaredesignatedascashflowhedges .Thechangeinthemarketvalueofsuchderivativecontractshashistoricallybeen,andisexpectedtocontinuetobe,highlyeffectiveatoffsettingchanges inpricemovementsof thehedgeditem .Gainsandlossesarisingfromopenandclosedhedgingtransactionsaredeferred inothercomprehensive income,netofapplicableincometaxes,andrecognizedasacomponentofcostofproductssoldinthestatementofearningswhenthehedgeditemisrecognized .If it isdeterminedthatthederivativeinstrumentsusedarenolongereffectiveatoffsettingchangesinthepriceofthehedgeditem,thenthechangesinthemarketvalueoftheseexchange-tradedfuturescontractswouldberecordedinthestatementofearningsasacomponentofcostofproductssold .
2006 Annual Report 33
EmployeeBenefitPlansTheCompanyprovidessubstantiallyalldomesticemployeesandemployees at certain international subsidiaries with pensionbenefits .TheCompanyalsoprovides substantiallyalldomesticsalaried employees with postretirement health care and lifeinsurancebenefits . Inorder tomeasure theexpenseand fundedstatusoftheseemployeebenefitplans,managementmakesseveralestimatesandassumptions,includinginterestratesusedtodiscountcertain liabilities, ratesofreturnonassetssetaside to fundtheseplans, ratesofcompensation increases,employee turnover rates,anticipatedmortality rates, andanticipated futurehealth carecosts .TheseestimatesandassumptionsarebasedontheCompany’shistoricalexperiencecombinedwithmanagement’sknowledgeandunderstandingofcurrent factsandcircumstances .Managementalsousesthird-partyspecialists toassist inmeasuringtheexpenseandfundedstatusoftheseemployeebenefitplans .Ifmanagementuseddifferentestimatesandassumptionsregardingtheseplans,thefundedstatusoftheplanscouldvarysignificantly,andtheCompanycouldrecognizedifferentamountsofexpenseoverfutureperiods .
IncomeTaxesTheCompanyfrequentlyfaceschallengesfromdomesticandforeigntaxauthoritiesregardingtheamountoftaxesdue .Thesechallengesincludequestionsregardingthetimingandamountofdeductionsandtheallocationof incomeamongvarious taxjurisdictions .Inevaluatingtheexposureassociatedwithvarioustaxfilingpositions,theCompanyrecordsreservesforprobableexposures .Deferredtaxassetsrepresentitemstobeusedastaxdeductionsorcreditsinfuturetaxreturns,andtherelatedtaxbenefithasalreadybeenrecognizedintheCompany’sincomestatement .RealizationofcertaindeferredtaxassetsreflectstheCompany’staxplanningstrategies .Valuationallowancesrelatedtothesedeferredtaxassetshavebeenestablishedtotheextenttherealizationofthetaxbenefitisnotprobable .Basedonmanagement’sevaluationof theCompany’s taxposition, it isbelievedtheamountsrelatedtothesetaxexposuresareappropriatelyaccrued .TotheextenttheCompanyweretofavorablyresolvemattersforwhichaccrualshavebeenestablishedorbe required topayamounts inexcessof theaforementionedreserves, theCompany’seffective tax rate in a given financial statement period maybeimpacted .
Undistributedearningsof theCompany’s foreignsubsidiariesandaffiliatedcorporatejointventuresaccountedforontheequitymethodareconsidered tobepermanentlyreinvested,andaccordingly,noprovisionforU .S . incometaxeshasbeenprovidedthereon .If theCompanywere to receivedistributions fromanyof these foreignsubsidiariesoraffiliatesordetermine theundistributedearningsof these foreign subsidiariesoraffiliates tonotbepermanentlyreinvested,theCompanycouldbesubjecttoU .S .taxliabilitieswhichhavenotbeenprovidedforintheconsolidatedfinancialstatements .
AssetAbandonmentsandWrite-DownsTheCompanyisprincipallyengagedinthebusinessofprocuring,transporting,storing,processing,andmerchandisingagriculturalcommoditiesandproducts .Thisbusiness isglobal innatureandishighlycapital-intensive .Boththeavailabilityof theCompany’srawmaterialsandthedemandfortheCompany’sfinishedproductsaredrivenbyunpredictable factors suchasweather,plantings,government(domesticand foreign) farmprogramsandpolicies,changesinpopulationgrowth,changesinstandardsofliving,andproductionofsimilarandcompetitivecrops .Theseaforementionedunpredictable factors, therefore,maycauseashift in thesupply/demanddynamics for theCompany’s rawmaterials and finalproducts .Anysuchshiftwillcausemanagement toevaluate theefficiencyandprofitabilityoftheCompany’sfixedassetbaseintermsofgeographiclocation,size,andageofitsfactories .TheCompany,fromtime to time,willalso invest inequipmentand technologyrelated tonew,value-addedproductsproduced fromagriculturalcommoditiesandproducts .Thesenewproductsarenotalwayssuccessful fromeithera commercial productionormarketingperspective .ManagementevaluatestheCompany’sproperty,plant,andequipmentforimpairmentwheneverindicatorsofimpairmentexist .Assetsareabandonedafter considerationof theability toutilizetheassetsfortheirintendedpurposeortoemploytheassetsinalternativeusesorsell theassets torecover thecarryingvalue .Ifmanagementuseddifferentestimatesandassumptions in itsevaluationofthisfixedassetbase,thentheCompanycouldrecognizedifferentamountsofexpenseoverfutureperiods .
34 Archer Daniels Midland Company
MANAGEMENT’S DISCUSSION OF OPERATIONS AND FINANCIAL CONDITION - JUNE 30, 2006 (CONTINUED)
ValuationofMarketableSecuritiesandInvestmentsinAffiliatesTheCompanyclassifies themajorityof itsmarketable securitiesas available-for-sale and carries these securities at fair value .Investments in affiliates are carried at cost plus equity inundistributedearnings .Forpubliclytradedsecurities,thefairvalueoftheCompany’sinvestmentsisreadilyavailablebasedonquotedmarketprices .Fornon-publicly tradedsecurities,management’sassessment of fair value is based on valuation methodologiesincludingdiscountedcashflowsandestimatesofsalesproceeds .Intheeventofadeclineinfairvalueofaninvestmentbelowcarryingvalue,managementmayberequiredtodetermineifthedeclineinfairvalue isother thantemporary . Inevaluating thenatureofadeclineinthefairvalueofaninvestment,managementconsidersthemarketconditions,trendsofearnings,discountedcashflows,tradingvolumes,andotherkeymeasuresof theinvestmentaswellas theCompany’sabilityandintenttoholdtheinvestment .Whensuchadeclineinvalueisdeemedtobeotherthantemporary,animpairmentlossisrecognizedinthecurrentperiodoperatingresultstotheextentof thedecline .SeeNotes2and4 to theCompany’sconsolidatedfinancial statements for information regarding theCompany’smarketablesecuritiesandinvestmentsinaffiliates .Ifmanagementuseddifferentestimatesandassumptionsinitsevaluationofthesemarketablesecurities, thentheCompanycouldrecognizedifferentamountsofexpenseoverfutureperiods .
TheCompanyisa limitedpartner invariousprivateequity fundswhichinvestprimarilyinemergingmarkets .TheCompanyaccountsfortheselimitedpartnershipsusingtheequitymethodofaccounting .Therefore,theCompanyisrecordingintheconsolidatedstatementofearningsitsproportionalshareofthelimitedpartnerships’netincomeorloss .Thelimitedpartnershipsvaluetheirinvestmentsatfairvalue .Thus,unrealizedgainsand losses related to thechange in fairvalueoftheseinvestmentsarerecordedinthelimitedpartnerships’statementsof earnings .Thevaluationof these investments,asdeterminedbythegeneralpartner,canbesubjective,andthevaluesmayvarysignificantly .Someofthefactorscausingthesubjectivityandvolatilityofthesevaluationsincludetheilliquidityandminoritypositionsoftheseinvestments,currencyexchangeratefluctuations,less-regulatedsecuritiesexchanges,andtheinherentbusinessrisksand limitationspresent in theemergingmarket countries .TheCompanyrecordstheresultsoftheselimitedpartnershipsbasedonthe informationprovided to theCompanyby thegeneralpartner .Duetothesubjectivityandvolatilityinvaluingtheseinvestments,thefairvalueoftheseinvestments,andthustheCompany’sresults,couldvarysignificantlyoverfutureperiods .
MARKET RISK SENSITIVE INSTRUMENTS AND POSITIONSThemarketrisk inherent in theCompany’smarketrisksensitiveinstrumentsandpositionsisthepotentiallossarisingfromadversechangesincommodities futuresprices,marketableequitysecurityprices,marketpricesof limitedpartnerships’ investments, foreigncurrencyexchangerates,andinterestratesasdescribedbelow .
CommoditiesTheavailabilityandpriceofagriculturalcommoditiesaresubjecttowidefluctuationsduetounpredictable factorssuchasweather,plantings, government (domesticand foreign) farmprogramsandpolicies,changesinglobaldemandresultingfrompopulationgrowthandchangesinstandardsof living,andglobalproductionof similarandcompetitivecrops .Toreduceprice riskcausedbymarketfluctuations,theCompanygenerallyfollowsapolicyofusingexchange-tradedfuturesandoptionscontracts tominimizeitsnetpositionofmerchandisableagriculturalcommodityinventoriesandforwardcashpurchaseandsalescontracts .TheCompanywillalsouseexchange-tradedfuturesandoptionscontractsascomponentsofmerchandisingstrategiesdesignedtoenhancemargins .Theresultsof these strategiescanbe significantly impactedby factors suchasthevolatilityoftherelationshipbetweenthevalueofexchange-tradedcommodities futurescontractsand thecashpricesof theunderlying commodities, counterparty contracts defaults, andvolatility of freight markets . In addition, the Company fromtime-to-timeenters intoderivativecontractswhicharedesignatedashedgesofspecificvolumesofcommoditiesthatwillbepurchasedandprocessed,or sold, ina futuremonth .Thechanges in themarketvalueofsuchfuturescontractshavehistoricallybeen,andareexpectedtocontinuetobe,highlyeffectiveatoffsettingchangesinpricemovementsof thehedged item .Gainsandlossesarisingfromopenandclosedhedging transactionsaredeferred inothercomprehensiveincome,netofapplicabletaxes,andrecognizedasacomponentofcostofproductssoldinthestatementofearningswhenthehedgeditemisrecognized .
AsensitivityanalysishasbeenpreparedtoestimatetheCompany’sexposure tomarket riskof itsdailynetcommodityposition .TheCompany’sdailynetcommoditypositionconsistsof inventories,relatedpurchaseandsalecontracts,andexchange-tradedfuturescontracts, including those contractsused tohedgeportionsofproductionrequirements .Thefairvalueofsuchdailynetcommodityposition isa summationof the fair values calculated for eachcommoditybyvaluingeachnetpositionatquotedfuturesprices .Marketriskisestimatedasthepotentiallossinfairvalueresultingfromahypothetical10%adversechangeinsuchprices .Actualresultsmaydiffer .
2006 Annual Report 35
2006 2005 Fair Market Fair Market Value Risk Value Risk (Inmillions)Highestlongposition . . . . . . . . . . . . . . . . . . . $ 510 $ 51 $226 $23Highestshortposition . . . . . . . . . . . . . . . . . . . 574 57 944 94Averagepositionlong(short) . . . . . . . . . . . . . (203) (20) (300) (30)
Thechangeinfairvalueoftheaveragepositionfor2006comparedto2005wasprincipallya result of adecrease in thedailynetcommodityposition,partiallyoffsetbyincreasedcommodityprices .
MarketableEquitySecuritiesMarketableequitysecurities,whicharerecordedatfairvalue,haveexposuretopricerisk .Thefairvalueofmarketableequitysecuritiesisbasedonquotedmarketprices .Riskisestimatedasthepotentiallossinfairvalueresultingfromahypothetical10%adversechangeinquotedmarketprices .Actualresultsmaydiffer . 2006 2005 (Inmillions)Fairvalue . . . . . . . . . . . . . . . . . . . . . . . . . . . . . . . . . . . . . . . . . . . . . . . . . . . $640 $664Marketrisk . . . . . . . . . . . . . . . . . . . . . . . . . . . . . . . . . . . . . . . . . . . . . . . . . . 64 66
Thedecrease in fair value for2006compared to2005 resultedprimarilyfromdisposalsofsecuritiesanddecreasedfairmarketvalueofthesecurities .
LimitedPartnershipsTheCompanyisa limitedpartner invariousprivateequity fundswhichinvestprimarilyinemergingmarkets .TheCompanyaccountsfortheselimitedpartnershipsusingtheequitymethodofaccounting .Therefore,theCompanyisrecordingintheconsolidatedstatementofearnings itsproportionalshareof the limitedpartnerships’netincomeor loss .The limitedpartnershipsvalue their investmentsat fairvalue .Risk isestimatedas thepotential loss in fairvalueresultingfromahypothetical10%adversechangeinmarketpricesofthelimitedpartnerships’investments .Actualresultsmaydiffer . 2006 2005 (Inmillions)Fairvalueofpartnerships’investments . . . . . . . . . . . . . . . . . . . . . . . . . . . . $210 $290Marketrisk . . . . . . . . . . . . . . . . . . . . . . . . . . . . . . . . . . . . . . . . . . . . . . . . . . 21 29
Thedecrease in fair value for2006compared to2005 resultedprimarilyfromreturnsofcapital .
CurrenciesIn order to reduce the risk of foreign currency exchange ratefluctuations,exceptforamountspermanentlyinvestedasdescribedbelow, theCompany followsapolicyofhedgingsubstantiallyalltransactionsdenominatedinacurrencyotherthanthefunctionalcurrenciesapplicabletoeachofitsvariousentities .Theinstrumentsused forhedgingarereadilymarketableexchange-traded futurescontractsandforwardcontractswithbanks .Thechangesinmarketvalueofsuchcontractshaveahighcorrelationtothepricechangesin thecurrencyof therelatedhedged transactions .Thepotentialloss in fairvalue forsuchnetcurrencypositionresulting fromahypothetical10%adversechangeinforeigncurrencyexchangeratesisnotmaterial .
TheamounttheCompanyconsiderspermanentlyinvestedinforeignsubsidiariesandaffiliatesand translated intodollarsusing theyear-end exchange rates is $4 .5 billion at June 30, 2006 and$4 .0billionat June30,2005 .This increase isprincipallydue toan increase in retainedearningsof the foreignsubsidiariesandaffiliates .Thepotentiallossinfairvalueresultingfromahypothetical10%adversechangeinquotedforeigncurrencyexchangerates is$454millionand$397millionfor2006and2005,respectively .Actualresultsmaydiffer .
InterestThefairvalueoftheCompany’slong-termdebtisestimatedusingquotedmarketprices,whereavailable,anddiscountedfuturecashflowsbasedon theCompany’s current incremental borrowingratesforsimilartypesofborrowingarrangements .Suchfairvalueexceededthelong-termdebtcarryingvalue .Marketriskisestimatedasthepotentialincreaseinfairvalueresultingfromahypothetical .5%decreaseininterestrates .Actualresultsmaydiffer . 2006 2005 (Inmillions)Fairvalueoflong-termdebt . . . . . . . . . . . . . . . . . . . . . . . . . . . . . . . . . $4,387 $4,532Excessoffairvalueovercarryingvalue . . . . . . . . . . . . . . . . . . . . . . . . . 257 779Marketrisk . . . . . . . . . . . . . . . . . . . . . . . . . . . . . . . . . . . . . . . . . . . . . . . 218 229
Thedecreaseinfairvalueforthecurrentyearresultedprincipallyfromincreasedinterestrates .
36 Archer Daniels Midland Company
SUMMARY OF SIGNIFICANT ACCOUNTING POLICIES
Nature of BusinessThe Company is principally engaged in procuring, transporting,storing, processing, and merchandising agricultural commoditiesandproducts .
Principles of ConsolidationThe consolidated financial statements as of June 30, 2006 and forthe three years then ended include the accounts of the Companyand its majority-owned subsidiaries . All significant intercompanyaccounts and transactions have been eliminated . Investments inaffiliates are carried at cost plus equity in undistributed earningssinceacquisition .
The Company evaluates its less than majority-owned investmentsforconsolidationpursuanttoFinancialAccountingStandardsBoard(FASB)InterpretationNumber46,ConsolidationofVariableInterestEntities,anInterpretationofAccountingResearchBulletinNo.51(FIN46) .Avariableinterestentity(VIE)isacorporation,partnership,trust,oranyotherlegalstructureusedforbusinesspurposesthatdoesnothaveequityinvestorswithvotingrightsorhasequityinvestorsthatdonotprovidesufficientfinancialresourcesfortheentitytosupportitsactivities .FIN46requiresaVIEtobeconsolidatedbyacompanyif thatcompanyis theprimarybeneficiaryof theVIE .TheprimarybeneficiaryofaVIEisanentitythatissubjecttoamajorityoftheriskoflossfromtheVIE’sactivitiesorentitledtoreceiveamajorityoftheentity’sresidualreturns,orboth .AsofJune30,2006,theCompanyhas $224 million of investments in private equity funds includedin investments in affiliates which are considered VIEs pursuant toFIN46 .TheCompany’sresidualriskandrewardsfromtheseVIEsareproportionaltotheCompany’sownershipinterestandtheCompanyis not the primary beneficiary of any of these VIEs . Therefore, theCompanydoesnotconsolidateanyoftheseVIEs .
Use of EstimatesThepreparationofconsolidatedfinancialstatementsinconformitywithgenerallyacceptedaccountingprinciplesrequiresmanagementtomakeestimatesandassumptionsthataffectamountsreportedinitsconsolidatedfinancialstatementsandaccompanyingnotes .Actualresultscoulddifferfromthoseestimates .
Cash EquivalentsTheCompanyconsidersallnon-segregated,highly-liquidinvestmentswithamaturityofthreemonthsorlessatthetimeofpurchasetobecashequivalents .
Segregated Cash and InvestmentsThe Company segregates certain cash and investment balancesin accordance with certain regulatory requirements, commodityexchange requirements, and insurance arrangements . Thesesegregated balances represent deposits received from customerstrading in exchange-traded commodity instruments, securitiespledged to commodity exchange clearinghouses, and cash andsecuritiespledgedassecurityundercertaininsurancearrangements .Segregated cash and investments primarily consist of cash,U .S .governmentsecurities,andmoney-marketfunds .
ReceivablesThe Company records trade accounts receivable at net realizablevalue . This value includes an appropriate allowance for estimateduncollectible accounts, $54 million at June 30, 2006, to reflectany loss anticipated on the trade accounts receivable balances .The Company calculates this allowance based on its history ofwrite-offs,levelofpast-dueaccounts,anditsrelationshipswith,andtheeconomicstatusof,itscustomers .
CreditriskontradereceivablesisminimizedasaresultofthelargeanddiversifiednatureoftheCompany’sworldwidecustomerbase .TheCompanycontrolsitsexposuretocreditriskthroughcreditapprovals,creditlimits,andmonitoringprocedures .CollateralisgenerallynotrequiredfortheCompany’stradereceivables .
InventoriesInventories of certain merchandisable agricultural commodities,which include amounts acquired under deferred pricing contracts,arestatedatmarketvalue .Inaddition,theCompanyvaluescertaininventoriesusingthelowerofcost,determinedbyeitherthefirst-in,first-out(FIFO)orlast-in,first-out(LIFO)methods,ormarket .
Marketable SecuritiesTheCompanyclassifiesitsmarketablesecuritiesasavailable-for-sale,exceptforcertaindesignatedsecuritieswhichareclassifiedastradingsecurities .Available-for-salesecuritiesarecarriedatfairvalue,withtheunrealizedgainsand losses,netof income taxes, reportedasacomponentofothercomprehensiveincome(loss) .Unrealizedgainsandlossesrelatedtotradingsecuritiesareincludedinincomeonacurrentbasis .TheCompanyusesthespecificidentificationmethodwhen securities are sold or reclassified out of accumulated othercomprehensiveincome(loss)intoearnings .
2006 Annual Report 37
Property, Plant, and EquipmentProperty, plant, and equipment is recorded at cost . Repair andmaintenancecostsareexpensedasincurred .TheCompanygenerallyuses the straight-line method in computing depreciation forfinancialreportingpurposesandgenerallyusesacceleratedmethodsfor income tax purposes . The annual provisions for depreciationhave been computed principally in accordance with the followingranges of asset lives: buildings - 10 to 50 years; machinery andequipment-3to30years .
Asset Abandonments and Write-DownsThe Company recorded a $61 million, a $42 million, and a$51millionchargeincostofproductssoldduring2006,2005,and2004,respectively,principallyrelatedtotheabandonmentandwrite-downofcertainlong-livedassets .Inaddition,theCompanyrecordeda $9 million loss in equity in earnings of affiliates during 2006representingtheCompany’sshareofachargeforabandonmentandwrite-downoflong-livedassetsreportedbyanunconsolidatedaffiliateoftheCompany .Themajorityoftheseassetswereidleorrelatedtounderperforming product lines, and the decision to abandon wasfinalized after consideration of the ability to utilize the assets fortheirintendedpurpose,employtheassetsinalternativeuses,orsellthe assets to recover the carrying value . After the write-downs, thecarryingvalueoftheseassetsisimmaterial .
Net SalesTheCompanyfollowsapolicyofrecognizingsalesrevenueatthetimeofdeliveryoftheproductandwhenallofthefollowinghaveoccurred:asalesagreementis inplace,pricingisfixedordeterminable,andcollectionisreasonablyassured .Freightcostsandhandlingchargesrelated to sales are recorded as a component of cost of productssold .Netsalestounconsolidatedaffiliatesduring2006and2005were$3 .1billionand$2 .9billion,respectively .
Per Share DataBasic earnings per common share are determined by dividingnet earnings by the weighted average number of common sharesoutstanding .Incomputingdilutedearningspershare,theweightedaverage number of common shares outstanding is increased bycommonstockoptionsoutstandingwithexerciseprices lower thanthe average market prices of common shares . During 2006, 2005,and2004,dilutedaveragesharesoutstandingincludedincrementalsharesrelatedtooutstandingcommonstockoptionsof2 .7million,1 .9million,and2 .1million,respectively .
New Accounting StandardsInMarch2005,theFASBissuedFIN47,AccountingforConditionalAssetRetirementObligations,anInterpretationofFASBStatementNo.143.FIN47clarifiesthatthetermconditionalassetretirementobligation as used in SFAS Number 143, Accounting for AssetRetirementObligations,referstoalegalobligationtoperformanassetretirementactivityinwhichthetimingand/ormethodofsettlementareconditionalonafutureeventthatmayormaynotbewithinthecontrol of the entity . However, the obligation to perform the assetretirementactivity isunconditional even thoughuncertainty existsaboutthetimingand/ormethodofsettlement .FIN47clarifieswhenanentitywouldhave sufficient information to reasonablyestimatethefairvalueofanassetretirementobligation .TheCompanyadoptedFIN47onJuly1,2005 .AsaresultofadoptingFIN47,theCompanyrecordedalong-termliabilityrelatedtoassetretirementobligations(ARO)of$18million, increasedproperty,plant,andequipmentby$3million,andrecordedcumulativedepreciationexpenserelatedtoAROsof$15million .
During July 2006, the FASB issued Interpretation Number 48,Accounting for Uncertainty in Income Taxes (FIN 48) . FIN 48clarifiestheaccountingforincometaxesbyprescribingtheminimumrequirements a tax position must meet before being recognizedin the financial statements . In addition, FIN 48 prohibits the useof SFAS Number 5, Accounting for Contingencies, in evaluatingthe recognition and measurement of uncertain tax positions . TheCompanywillberequiredtoadoptFIN48onJuly1,2007,andhasnotyetassessed the impactof theadoptionof this standardon theCompany’sfinancialstatements .
Stock CompensationEffectiveJuly1,2004,theCompanyadoptedthefairvaluerecognitionprovisions of SFAS Number 123, Accounting for Stock-BasedCompensation, for stock-based employee compensation . Priorto July 1, 2004, the Company accounted for stock-based employeecompensationundertherecognitionandmeasurementprovisionsofAPBOpinionNumber25,AccountingforStockIssuedtoEmployees,andrelatedinterpretations .Underthemodifiedprospectivemethodof adoption selected by the Company under the provisions ofSFAS Number 148, Accounting for Stock-Based Compensation–TransitionandDisclosure,stock-basedemployeecompensationexpenserecognizedduring2005wasthesameastheexpensewhichwouldhavebeenrecognizedhadthefairvaluerecognitionprovisionsof SFAS Number 123 been applied to all options granted afterJuly 1, 1995 . Effective July 1, 2005, the Company adopted the fair
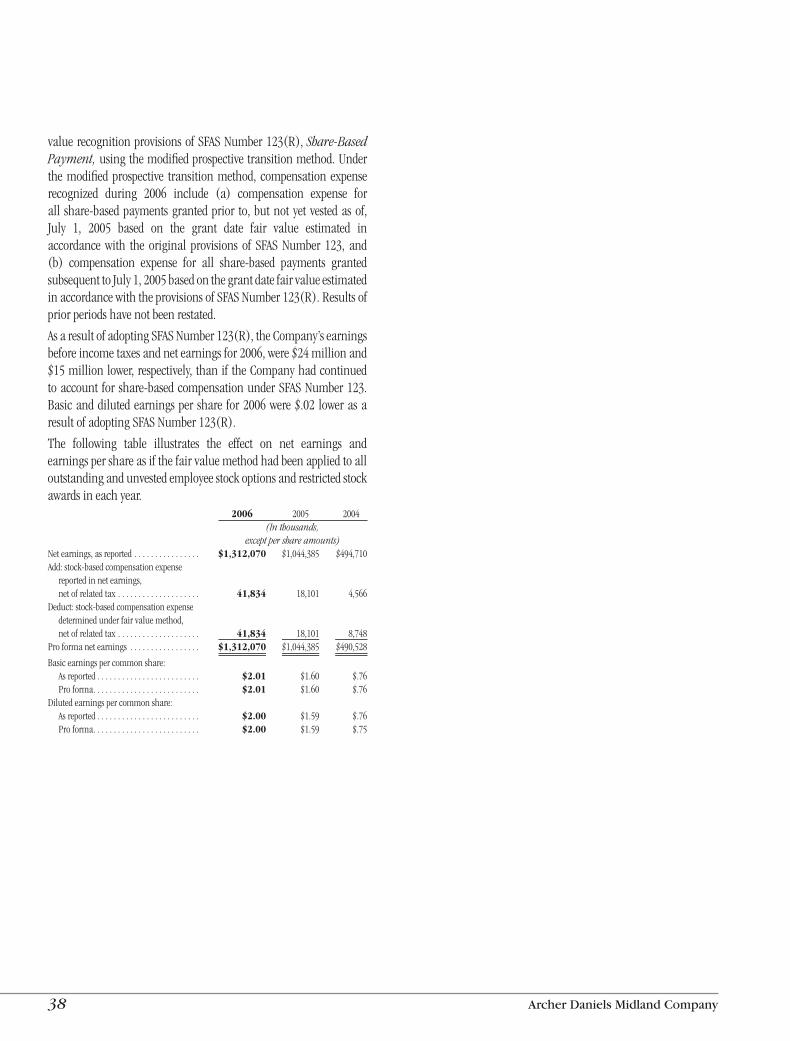
38 Archer Daniels Midland Company
valuerecognitionprovisionsofSFASNumber123(R),Share-BasedPayment,usingthemodifiedprospectivetransitionmethod .Underthemodifiedprospective transitionmethod, compensation expenserecognized during 2006 include (a) compensation expense forall share-basedpaymentsgrantedprior to,butnotyetvestedasof,July 1, 2005 based on the grant date fair value estimated inaccordance with the original provisions of SFAS Number 123, and(b) compensation expense for all share-based payments grantedsubsequenttoJuly1,2005basedonthegrantdatefairvalueestimatedinaccordancewiththeprovisionsofSFASNumber123(R) .Resultsofpriorperiodshavenotbeenrestated .
AsaresultofadoptingSFASNumber123(R),theCompany’searningsbeforeincometaxesandnetearningsfor2006,were$24millionand$15millionlower,respectively,thaniftheCompanyhadcontinuedtoaccountforshare-basedcompensationunderSFASNumber123 .Basicanddilutedearningspersharefor2006were$ .02lowerasaresultofadoptingSFASNumber123(R) .
The following table illustrates the effect on net earnings andearningspershareasifthefairvaluemethodhadbeenappliedtoalloutstandingandunvestedemployeestockoptionsandrestrictedstockawardsineachyear . 2006 2005 2004 (Inthousands, exceptpershareamounts)Netearnings,asreported . . . . . . . . . . . . . . . . $1,312,070 $1,044,385 $494,710Add:stock-basedcompensationexpense reportedinnetearnings, netofrelatedtax . . . . . . . . . . . . . . . . . . . . 41,834 18,101 4,566Deduct:stock-basedcompensationexpense determinedunderfairvaluemethod, netofrelatedtax . . . . . . . . . . . . . . . . . . . . 41,834 18,101 8,748Proformanetearnings . . . . . . . . . . . . . . . . . $1,312,070 $1,044,385 $490,528
Basicearningspercommonshare: Asreported . . . . . . . . . . . . . . . . . . . . . . . . . $2.01 $1 .60 $ .76 Proforma . . . . . . . . . . . . . . . . . . . . . . . . . . $2.01 $1 .60 $ .76Dilutedearningspercommonshare: Asreported . . . . . . . . . . . . . . . . . . . . . . . . . $2.00 $1 .59 $ .76 Proforma . . . . . . . . . . . . . . . . . . . . . . . . . . $2.00 $1 .59 $ .75
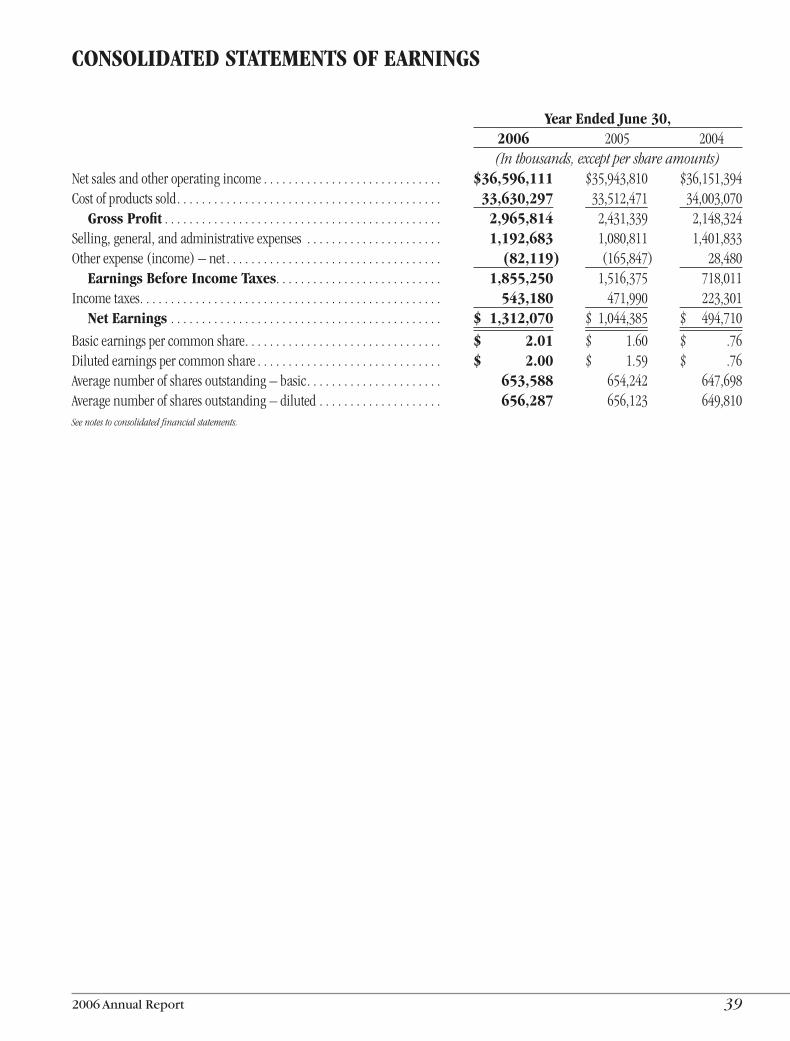
2006 Annual Report 39
CONSOLIDATED STATEMENTS OF EARNINGS
Year Ended June 30, 2006 2005 2004 (Inthousands,exceptpershareamounts)Netsalesandotheroperatingincome . . . . . . . . . . . . . . . . . . . . . . . . . . . . . $36,596,111 $35,943,810 $36,151,394Costofproductssold . . . . . . . . . . . . . . . . . . . . . . . . . . . . . . . . . . . . . . . . . . . 33,630,297 33,512,471 34,003,070 Gross Profit . . . . . . . . . . . . . . . . . . . . . . . . . . . . . . . . . . . . . . . . . . . . . 2,965,814 2,431,339 2,148,324Selling,general,andadministrativeexpenses . . . . . . . . . . . . . . . . . . . . . . 1,192,683 1,080,811 1,401,833Otherexpense(income)–net . . . . . . . . . . . . . . . . . . . . . . . . . . . . . . . . . . . (82,119) (165,847) 28,480 Earnings Before Income Taxes . . . . . . . . . . . . . . . . . . . . . . . . . . . 1,855,250 1,516,375 718,011Incometaxes . . . . . . . . . . . . . . . . . . . . . . . . . . . . . . . . . . . . . . . . . . . . . . . . . 543,180 471,990 223,301 Net Earnings . . . . . . . . . . . . . . . . . . . . . . . . . . . . . . . . . . . . . . . . . . . . $ 1,312,070 $ 1,044,385 $ 494,710
Basicearningspercommonshare . . . . . . . . . . . . . . . . . . . . . . . . . . . . . . . . $ 2.01 $ 1 .60 $ .76Dilutedearningspercommonshare . . . . . . . . . . . . . . . . . . . . . . . . . . . . . . $ 2.00 $ 1 .59 $ .76Averagenumberofsharesoutstanding–basic . . . . . . . . . . . . . . . . . . . . . . 653,588 654,242 647,698Averagenumberofsharesoutstanding–diluted . . . . . . . . . . . . . . . . . . . . 656,287 656,123 649,810Seenotestoconsolidatedfinancialstatements.
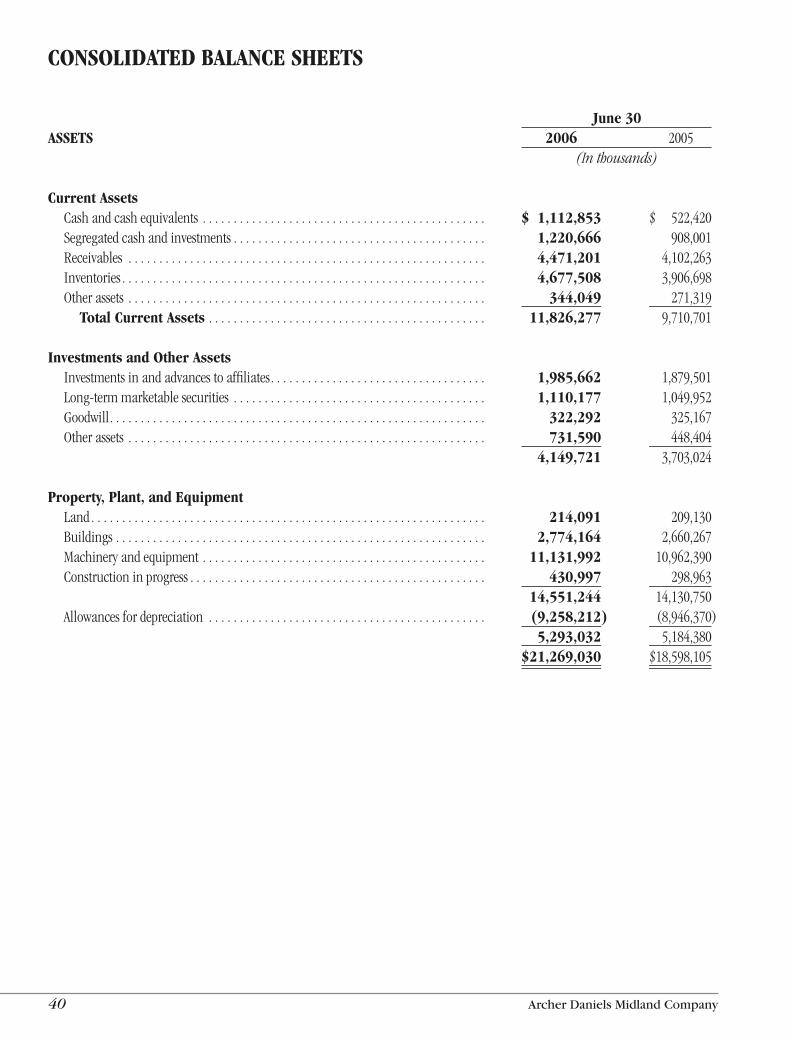
40 Archer Daniels Midland Company
CONSOLIDATED BALANCE SHEETS
June 30ASSETS 2006 2005 (Inthousands)
Current Assets Cashandcashequivalents . . . . . . . . . . . . . . . . . . . . . . . . . . . . . . . . . . . . . . . . . . . . . . $ 1,112,853 $ 522,420 Segregatedcashandinvestments . . . . . . . . . . . . . . . . . . . . . . . . . . . . . . . . . . . . . . . . . 1,220,666 908,001 Receivables . . . . . . . . . . . . . . . . . . . . . . . . . . . . . . . . . . . . . . . . . . . . . . . . . . . . . . . . . . 4,471,201 4,102,263 Inventories . . . . . . . . . . . . . . . . . . . . . . . . . . . . . . . . . . . . . . . . . . . . . . . . . . . . . . . . . . . 4,677,508 3,906,698 Otherassets . . . . . . . . . . . . . . . . . . . . . . . . . . . . . . . . . . . . . . . . . . . . . . . . . . . . . . . . . . 344,049 271,319 Total Current Assets . . . . . . . . . . . . . . . . . . . . . . . . . . . . . . . . . . . . . . . . . . . . . 11,826,277 9,710,701
Investments and Other Assets Investmentsinandadvancestoaffiliates . . . . . . . . . . . . . . . . . . . . . . . . . . . . . . . . . . . 1,985,662 1,879,501 Long-termmarketablesecurities . . . . . . . . . . . . . . . . . . . . . . . . . . . . . . . . . . . . . . . . . 1,110,177 1,049,952 Goodwill . . . . . . . . . . . . . . . . . . . . . . . . . . . . . . . . . . . . . . . . . . . . . . . . . . . . . . . . . . . . . 322,292 325,167 Otherassets . . . . . . . . . . . . . . . . . . . . . . . . . . . . . . . . . . . . . . . . . . . . . . . . . . . . . . . . . . 731,590 448,404 . . . . . . . . . . . . . . . . . . . . . . . . . . . . . . . . . . . . . . . . . . . . . . . . . . . . . . . . . . . . . . . . . . . . . . . 4,149,721 3,703,024
Property, Plant, and Equipment Land . . . . . . . . . . . . . . . . . . . . . . . . . . . . . . . . . . . . . . . . . . . . . . . . . . . . . . . . . . . . . . . . 214,091 209,130 Buildings . . . . . . . . . . . . . . . . . . . . . . . . . . . . . . . . . . . . . . . . . . . . . . . . . . . . . . . . . . . . 2,774,164 2,660,267 Machineryandequipment . . . . . . . . . . . . . . . . . . . . . . . . . . . . . . . . . . . . . . . . . . . . . . 11,131,992 10,962,390 Constructioninprogress . . . . . . . . . . . . . . . . . . . . . . . . . . . . . . . . . . . . . . . . . . . . . . . . 430,997 298,963 . . . . . . . . . . . . . . . . . . . . . . . . . . . . . . . . . . . . . . . . . . . . . . . . . . . . . . . . . . . . . . . . . . . . . . . 14,551,244 14,130,750 Allowancesfordepreciation . . . . . . . . . . . . . . . . . . . . . . . . . . . . . . . . . . . . . . . . . . . . . (9,258,212) (8,946,370) . . . . . . . . . . . . . . . . . . . . . . . . . . . . . . . . . . . . . . . . . . . . . . . . . . . . . . . . . . . . . . . . . . . . . . . 5,293,032 5,184,380 . . . . . . . . . . . . . . . . . . . . . . . . . . . . . . . . . . . . . . . . . . . . . . . . . . . . . . . . . . . . . . . . . . . . . . . $21,269,030 $18,598,105
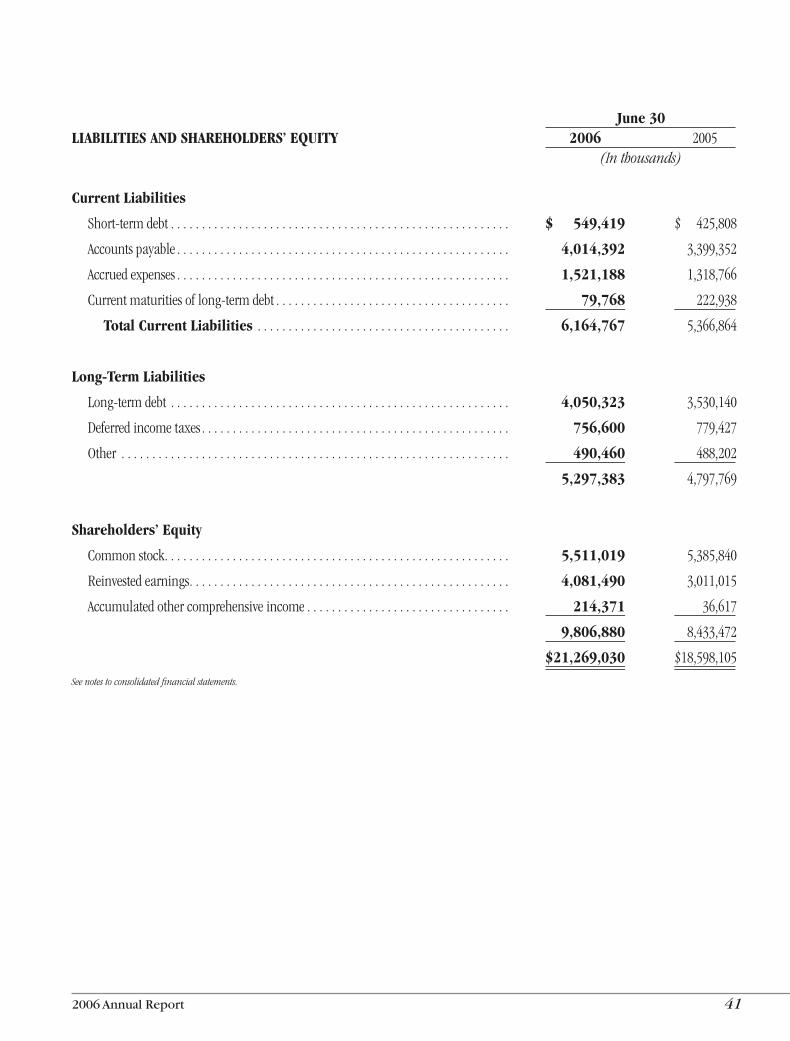
2006 Annual Report 4�
June 30LIABILITIES AND SHAREHOLDERS’ EQUITY 2006 2005 (Inthousands)
Current Liabilities
Short-termdebt . . . . . . . . . . . . . . . . . . . . . . . . . . . . . . . . . . . . . . . . . . . . . . . . . . . . . . . $ 549,419 $ 425,808
Accountspayable . . . . . . . . . . . . . . . . . . . . . . . . . . . . . . . . . . . . . . . . . . . . . . . . . . . . . . 4,014,392 3,399,352
Accruedexpenses . . . . . . . . . . . . . . . . . . . . . . . . . . . . . . . . . . . . . . . . . . . . . . . . . . . . . . 1,521,188 1,318,766
Currentmaturitiesoflong-termdebt . . . . . . . . . . . . . . . . . . . . . . . . . . . . . . . . . . . . . . 79,768 222,938
Total Current Liabilities . . . . . . . . . . . . . . . . . . . . . . . . . . . . . . . . . . . . . . . . . 6,164,767 5,366,864
Long-Term Liabilities
Long-termdebt . . . . . . . . . . . . . . . . . . . . . . . . . . . . . . . . . . . . . . . . . . . . . . . . . . . . . . . 4,050,323 3,530,140
Deferredincometaxes . . . . . . . . . . . . . . . . . . . . . . . . . . . . . . . . . . . . . . . . . . . . . . . . . . 756,600 779,427
Other . . . . . . . . . . . . . . . . . . . . . . . . . . . . . . . . . . . . . . . . . . . . . . . . . . . . . . . . . . . . . . . 490,460 488,202
. . . . . . . . . . . . . . . . . . . . . . . . . . . . . . . . . . . . . . . . . . . . . . . . . . . . . . . . . . . . . . . . . . . . . . . 5,297,383 4,797,769
Shareholders’ Equity
Commonstock . . . . . . . . . . . . . . . . . . . . . . . . . . . . . . . . . . . . . . . . . . . . . . . . . . . . . . . . 5,511,019 5,385,840
Reinvestedearnings . . . . . . . . . . . . . . . . . . . . . . . . . . . . . . . . . . . . . . . . . . . . . . . . . . . . 4,081,490 3,011,015
Accumulatedothercomprehensiveincome . . . . . . . . . . . . . . . . . . . . . . . . . . . . . . . . . 214,371 36,617
. . . . . . . . . . . . . . . . . . . . . . . . . . . . . . . . . . . . . . . . . . . . . . . . . . . . . . . . . . . . . . . . . . . . . . . 9,806,880 8,433,472
. . . . . . . . . . . . . . . . . . . . . . . . . . . . . . . . . . . . . . . . . . . . . . . . . . . . . . . . . . . . . . . . . . . . . . . $21,269,030 $18,598,105
Seenotestoconsolidatedfinancialstatements.
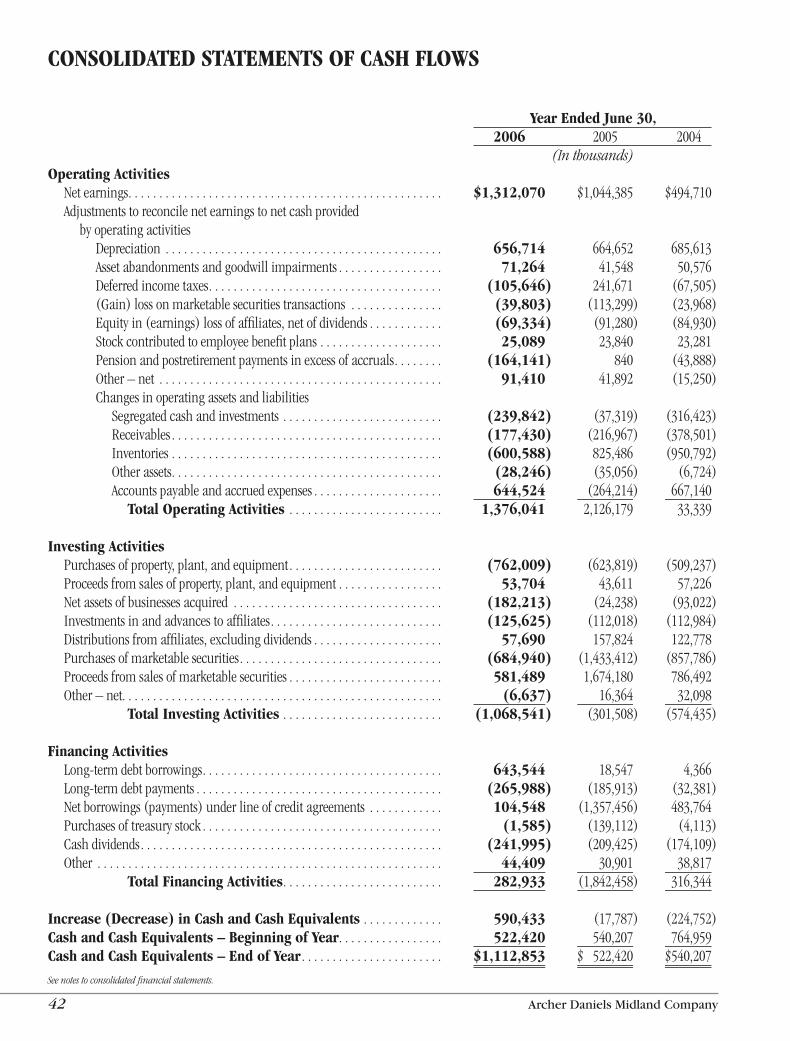
42 Archer Daniels Midland Company
CONSOLIDATED STATEMENTS OF CASH FLOWS
Year Ended June 30, 2006 2005 2004 (Inthousands)Operating Activities Netearnings . . . . . . . . . . . . . . . . . . . . . . . . . . . . . . . . . . . . . . . . . . . . . . . . . . . $1,312,070 $1,044,385 $494,710 Adjustmentstoreconcilenetearningstonetcashprovided byoperatingactivities Depreciation . . . . . . . . . . . . . . . . . . . . . . . . . . . . . . . . . . . . . . . . . . . . . 656,714 664,652 685,613 Assetabandonmentsandgoodwillimpairments . . . . . . . . . . . . . . . . . 71,264 41,548 50,576 Deferredincometaxes . . . . . . . . . . . . . . . . . . . . . . . . . . . . . . . . . . . . . . (105,646) 241,671 (67,505) (Gain)lossonmarketablesecuritiestransactions . . . . . . . . . . . . . . . (39,803) (113,299) (23,968) Equityin(earnings)lossofaffiliates,netofdividends . . . . . . . . . . . . (69,334) (91,280) (84,930) Stockcontributedtoemployeebenefitplans . . . . . . . . . . . . . . . . . . . . 25,089 23,840 23,281 Pensionandpostretirementpaymentsinexcessofaccruals . . . . . . . . (164,141) 840 (43,888) Other–net . . . . . . . . . . . . . . . . . . . . . . . . . . . . . . . . . . . . . . . . . . . . . . 91,410 41,892 (15,250) Changesinoperatingassetsandliabilities Segregatedcashandinvestments . . . . . . . . . . . . . . . . . . . . . . . . . . (239,842) (37,319) (316,423) Receivables . . . . . . . . . . . . . . . . . . . . . . . . . . . . . . . . . . . . . . . . . . . . (177,430) (216,967) (378,501) Inventories . . . . . . . . . . . . . . . . . . . . . . . . . . . . . . . . . . . . . . . . . . . . (600,588) 825,486 (950,792) Otherassets . . . . . . . . . . . . . . . . . . . . . . . . . . . . . . . . . . . . . . . . . . . . (28,246) (35,056) (6,724) Accountspayableandaccruedexpenses . . . . . . . . . . . . . . . . . . . . . 644,524 (264,214) 667,140 Total Operating Activities . . . . . . . . . . . . . . . . . . . . . . . . . 1,376,041 2,126,179 33,339
Investing Activities Purchasesofproperty,plant,andequipment . . . . . . . . . . . . . . . . . . . . . . . . . (762,009) (623,819) (509,237) Proceedsfromsalesofproperty,plant,andequipment . . . . . . . . . . . . . . . . . 53,704 43,611 57,226 Netassetsofbusinessesacquired . . . . . . . . . . . . . . . . . . . . . . . . . . . . . . . . . . (182,213) (24,238) (93,022) Investmentsinandadvancestoaffiliates . . . . . . . . . . . . . . . . . . . . . . . . . . . . (125,625) (112,018) (112,984) Distributionsfromaffiliates,excludingdividends . . . . . . . . . . . . . . . . . . . . . 57,690 157,824 122,778 Purchasesofmarketablesecurities . . . . . . . . . . . . . . . . . . . . . . . . . . . . . . . . . (684,940) (1,433,412) (857,786) Proceedsfromsalesofmarketablesecurities . . . . . . . . . . . . . . . . . . . . . . . . . 581,489 1,674,180 786,492 Other–net . . . . . . . . . . . . . . . . . . . . . . . . . . . . . . . . . . . . . . . . . . . . . . . . . . . . (6,637) 16,364 32,098 Total Investing Activities . . . . . . . . . . . . . . . . . . . . . . . . . . (1,068,541) (301,508) (574,435)
Financing Activities Long-termdebtborrowings . . . . . . . . . . . . . . . . . . . . . . . . . . . . . . . . . . . . . . . 643,544 18,547 4,366 Long-termdebtpayments . . . . . . . . . . . . . . . . . . . . . . . . . . . . . . . . . . . . . . . . (265,988) (185,913) (32,381) Netborrowings(payments)underlineofcreditagreements . . . . . . . . . . . . 104,548 (1,357,456) 483,764 Purchasesoftreasurystock . . . . . . . . . . . . . . . . . . . . . . . . . . . . . . . . . . . . . . . (1,585) (139,112) (4,113) Cashdividends . . . . . . . . . . . . . . . . . . . . . . . . . . . . . . . . . . . . . . . . . . . . . . . . . (241,995) (209,425) (174,109) Other . . . . . . . . . . . . . . . . . . . . . . . . . . . . . . . . . . . . . . . . . . . . . . . . . . . . . . . . 44,409 30,901 38,817 Total Financing Activities . . . . . . . . . . . . . . . . . . . . . . . . . . 282,933 (1,842,458) 316,344
Increase (Decrease) in Cash and Cash Equivalents . . . . . . . . . . . . . 590,433 (17,787) (224,752)Cash and Cash Equivalents – Beginning of Year . . . . . . . . . . . . . . . . . 522,420 540,207 764,959Cash and Cash Equivalents – End of Year . . . . . . . . . . . . . . . . . . . . . . . $1,112,853 $ 522,420 $540,207
Seenotestoconsolidatedfinancialstatements.
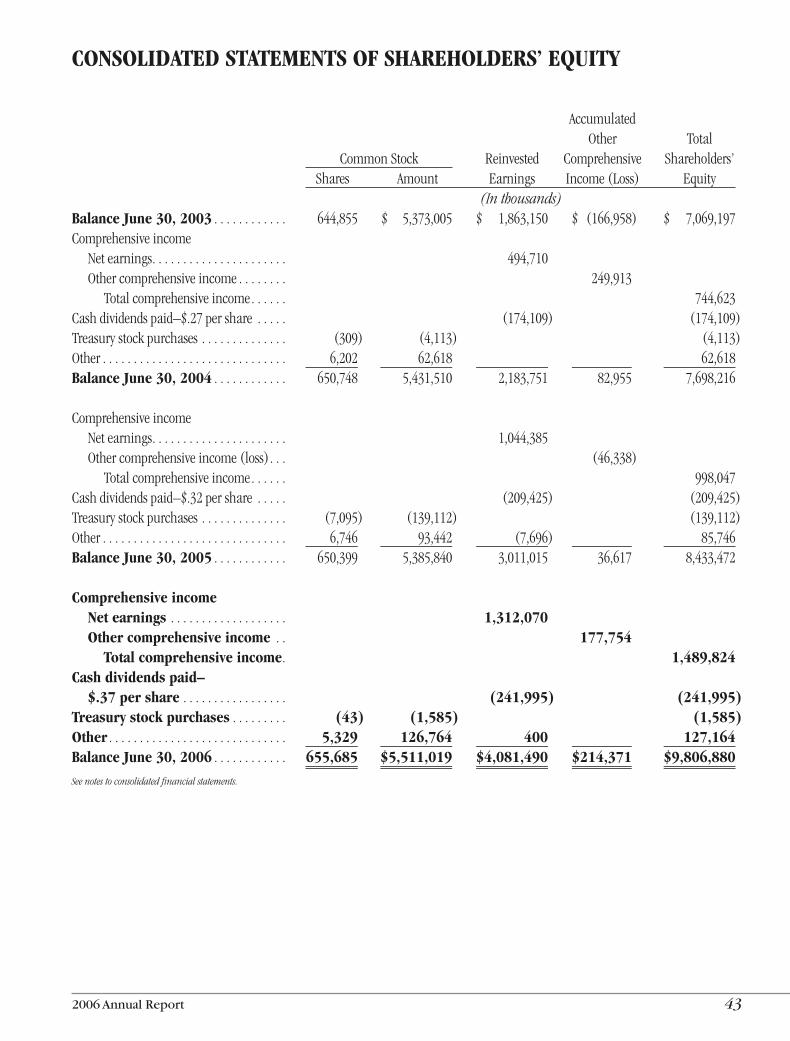
2006 Annual Report 43
CONSOLIDATED STATEMENTS OF SHAREHOLDERS’ EQUITY
Accumulated Other Total CommonStock Reinvested Comprehensive Shareholders’ Shares Amount Earnings Income(Loss) Equity (Inthousands)Balance June 30, 2003 . . . . . . . . . . . . 644,855 $ 5,373,005 $ 1,863,150 $ (166,958) $ 7,069,197Comprehensiveincome Netearnings . . . . . . . . . . . . . . . . . . . . . . 494,710 Othercomprehensiveincome . . . . . . . . 249,913 Totalcomprehensiveincome . . . . . . 744,623Cashdividendspaid–$ .27pershare . . . . . (174,109) (174,109)Treasurystockpurchases . . . . . . . . . . . . . . (309) (4,113) (4,113)Other . . . . . . . . . . . . . . . . . . . . . . . . . . . . . . 6,202 62,618 62,618Balance June 30, 2004 . . . . . . . . . . . . 650,748 5,431,510 2,183,751 82,955 7,698,216
Comprehensiveincome Netearnings . . . . . . . . . . . . . . . . . . . . . . 1,044,385 Othercomprehensiveincome(loss) . . . (46,338) Totalcomprehensiveincome . . . . . . 998,047Cashdividendspaid–$ .32pershare . . . . . (209,425) (209,425)Treasurystockpurchases . . . . . . . . . . . . . . (7,095) (139,112) (139,112)Other . . . . . . . . . . . . . . . . . . . . . . . . . . . . . . 6,746 93,442 (7,696) 85,746Balance June 30, 2005 . . . . . . . . . . . . 650,399 5,385,840 3,011,015 36,617 8,433,472
Comprehensive income Net earnings . . . . . . . . . . . . . . . . . . . 1,312,070 Other comprehensive income . . 177,754 Total comprehensive income . 1,489,824Cash dividends paid– $.37 per share . . . . . . . . . . . . . . . . . (241,995) (241,995)Treasury stock purchases . . . . . . . . . (43) (1,585) (1,585)Other . . . . . . . . . . . . . . . . . . . . . . . . . . . . . 5,329 126,764 400 127,164Balance June 30, 2006 . . . . . . . . . . . . 655,685 $5,511,019 $4,081,490 $214,371 $9,806,880
Seenotestoconsolidatedfinancialstatements.
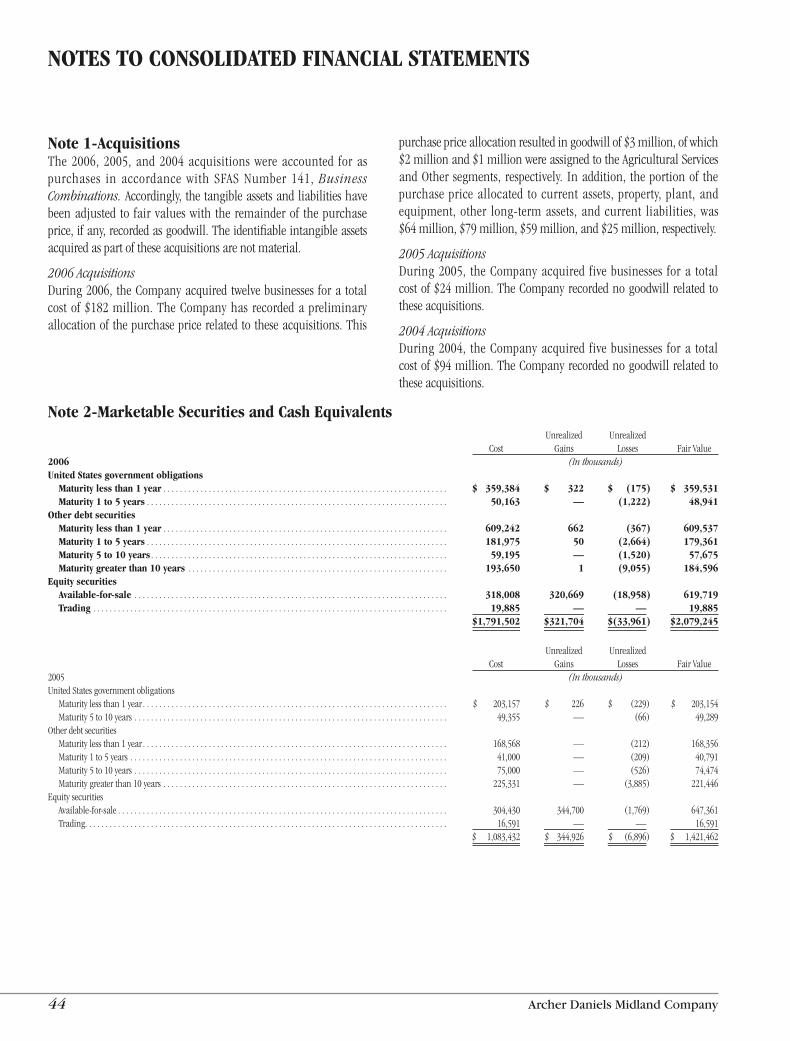
44 Archer Daniels Midland Company
NOTES TO CONSOLIDATED FINANCIAL STATEMENTS
Note 1-AcquisitionsThe 2006, 2005, and 2004 acquisitions were accounted for as purchases in accordance with SFAS Number 141, Business Combinations. Accordingly, the tangible assets and liabilities have been adjusted to fair values with the remainder of the purchase price, if any, recorded as goodwill. The identifiable intangible assets acquired as part of these acquisitions are not material.
2006 AcquisitionsDuring 2006, the Company acquired twelve businesses for a total cost of $182 million. The Company has recorded a preliminary allocation of the purchase price related to these acquisitions. This
Note 2-Marketable Securities and Cash Equivalents Unrealized Unrealized Cost Gains Losses Fair Value2006 (In thousands)United States government obligations Maturity less than 1 year . . . . . . . . . . . . . . . . . . . . . . . . . . . . . . . . . . . . . . . . . . . . . . . . . . . . . . . . . . . . . . . . . . . . . $ 359,384 $ 322 $ (175) $ 359,531 Maturity 1 to 5 years . . . . . . . . . . . . . . . . . . . . . . . . . . . . . . . . . . . . . . . . . . . . . . . . . . . . . . . . . . . . . . . . . . . . . . . . . 50,163 — (1,222) 48,941Other debt securities Maturity less than 1 year . . . . . . . . . . . . . . . . . . . . . . . . . . . . . . . . . . . . . . . . . . . . . . . . . . . . . . . . . . . . . . . . . . . . . 609,242 662 (367) 609,537 Maturity 1 to 5 years . . . . . . . . . . . . . . . . . . . . . . . . . . . . . . . . . . . . . . . . . . . . . . . . . . . . . . . . . . . . . . . . . . . . . . . . . 181,975 50 (2,664) 179,361 Maturity 5 to 10 years . . . . . . . . . . . . . . . . . . . . . . . . . . . . . . . . . . . . . . . . . . . . . . . . . . . . . . . . . . . . . . . . . . . . . . . . 59,195 — (1,520) 57,675 Maturity greater than 10 years . . . . . . . . . . . . . . . . . . . . . . . . . . . . . . . . . . . . . . . . . . . . . . . . . . . . . . . . . . . . . . . 193,650 1 (9,055) 184,596Equity securities Available-for-sale . . . . . . . . . . . . . . . . . . . . . . . . . . . . . . . . . . . . . . . . . . . . . . . . . . . . . . . . . . . . . . . . . . . . . . . . . . . . 318,008 320,669 (18,958) 619,719 Trading . . . . . . . . . . . . . . . . . . . . . . . . . . . . . . . . . . . . . . . . . . . . . . . . . . . . . . . . . . . . . . . . . . . . . . . . . . . . . . . . . . . . . . 19,885 — — 19,885. . . . . . . . . . . . . . . . . . . . . . . . . . . . . . . . . . . . . . . . . . . . . . . . . . . . . . . . . . . . . . . . . . . . . . . . . . . . . . . . . . . . . . . . . . . . . . . . . $1,791,502 $321,704 $(33,961) $2,079,245
Unrealized Unrealized Cost Gains Losses Fair Value2005 (In thousands)United States government obligations Maturity less than 1 year . . . . . . . . . . . . . . . . . . . . . . . . . . . . . . . . . . . . . . . . . . . . . . . . . . . . . . . . . . . . . . . . . . . . . . . . . . $ 203,157 $ 226 $ (229) $ 203,154 Maturity 5 to 10 years . . . . . . . . . . . . . . . . . . . . . . . . . . . . . . . . . . . . . . . . . . . . . . . . . . . . . . . . . . . . . . . . . . . . . . . . . . . . 49,355 — (66) 49,289Other debt securities Maturity less than 1 year . . . . . . . . . . . . . . . . . . . . . . . . . . . . . . . . . . . . . . . . . . . . . . . . . . . . . . . . . . . . . . . . . . . . . . . . . . 168,568 — (212) 168,356 Maturity 1 to 5 years . . . . . . . . . . . . . . . . . . . . . . . . . . . . . . . . . . . . . . . . . . . . . . . . . . . . . . . . . . . . . . . . . . . . . . . . . . . . . 41,000 — (209) 40,791 Maturity 5 to 10 years . . . . . . . . . . . . . . . . . . . . . . . . . . . . . . . . . . . . . . . . . . . . . . . . . . . . . . . . . . . . . . . . . . . . . . . . . . . . 75,000 — (526) 74,474 Maturity greater than 10 years . . . . . . . . . . . . . . . . . . . . . . . . . . . . . . . . . . . . . . . . . . . . . . . . . . . . . . . . . . . . . . . . . . . . . 225,331 — (3,885) 221,446Equity securities Available-for-sale . . . . . . . . . . . . . . . . . . . . . . . . . . . . . . . . . . . . . . . . . . . . . . . . . . . . . . . . . . . . . . . . . . . . . . . . . . . . . . . . 304,430 344,700 (1,769) 647,361 Trading. . . . . . . . . . . . . . . . . . . . . . . . . . . . . . . . . . . . . . . . . . . . . . . . . . . . . . . . . . . . . . . . . . . . . . . . . . . . . . . . . . . . . . . . 16,591 — — 16,591. . . . . . . . . . . . . . . . . . . . . . . . . . . . . . . . . . . . . . . . . . . . . . . . . . . . . . . . . . . . . . . . . . . . . . . . . . . . . . . . . . . . . . . . . . . . . . . . . $ 1,083,432 $ 344,926 $ (6,896) $ 1,421,462
purchase price allocation resulted in goodwill of $3 million, of which $2 million and $1 million were assigned to the Agricultural Services and Other segments, respectively. In addition, the portion of the purchase price allocated to current assets, property, plant, and equipment, other long-term assets, and current liabilities, was $64 million, $79 million, $59 million, and $25 million, respectively.
2005 AcquisitionsDuring 2005, the Company acquired five businesses for a total cost of $24 million. The Company recorded no goodwill related to these acquisitions.
2004 AcquisitionsDuring 2004, the Company acquired five businesses for a total cost of $94 million. The Company recorded no goodwill related to these acquisitions.
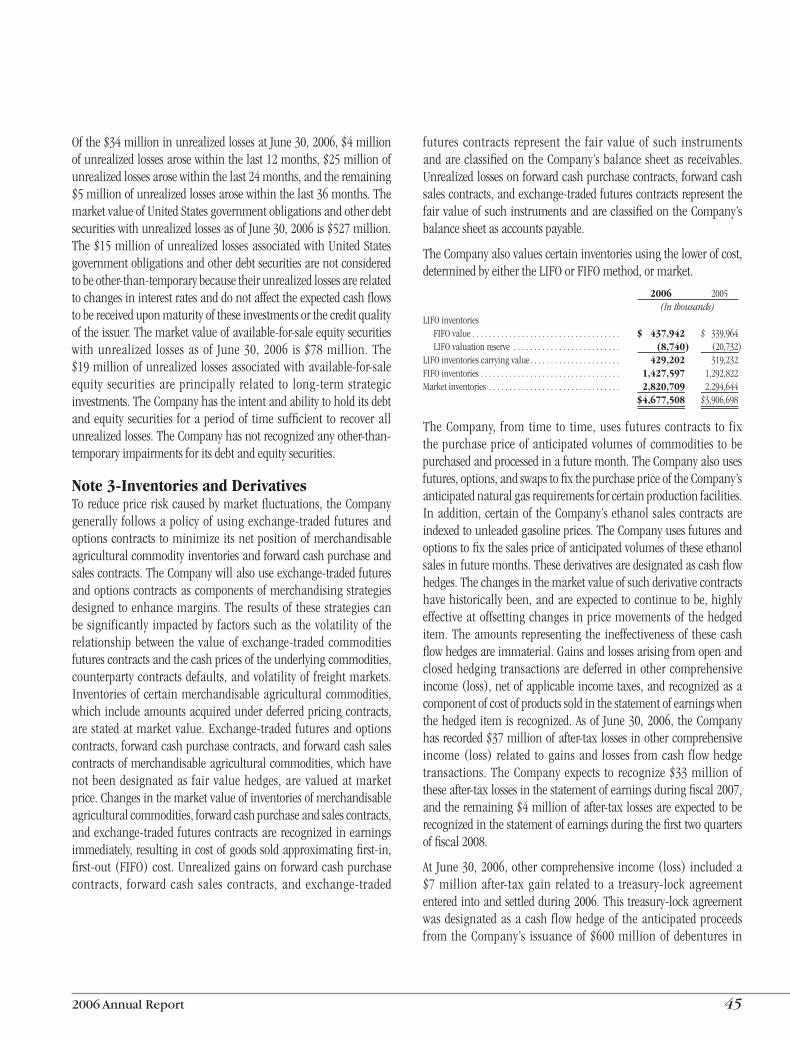
2006 Annual Report 45
Ofthe$34millioninunrealizedlossesatJune30,2006,$4millionofunrealizedlossesarosewithinthelast12months,$25millionofunrealizedlossesarosewithinthelast24months,andtheremaining$5millionofunrealizedlossesarosewithinthelast36months .ThemarketvalueofUnitedStatesgovernmentobligationsandotherdebtsecuritieswithunrealizedlossesasofJune30,2006is$527million .The$15millionofunrealizedlossesassociatedwithUnitedStatesgovernmentobligationsandotherdebtsecuritiesarenotconsideredtobeother-than-temporarybecausetheirunrealizedlossesarerelatedtochangesininterestratesanddonotaffecttheexpectedcashflowstobereceiveduponmaturityoftheseinvestmentsorthecreditqualityoftheissuer .Themarketvalueofavailable-for-saleequitysecuritieswithunrealized lossesasof June30,2006 is$78million .The$19millionofunrealizedlossesassociatedwithavailable-for-saleequity securities areprincipally related to long-term strategicinvestments .TheCompanyhastheintentandabilitytoholditsdebtandequitysecurities foraperiodof timesufficient torecoverallunrealizedlosses .TheCompanyhasnotrecognizedanyother-than-temporaryimpairmentsforitsdebtandequitysecurities .
Note 3-Inventories and DerivativesToreducepriceriskcausedbymarketfluctuations, theCompanygenerally followsapolicyofusingexchange-traded futuresandoptionscontracts tominimize itsnetpositionofmerchandisableagriculturalcommodityinventoriesandforwardcashpurchaseandsalescontracts .TheCompanywillalsouseexchange-tradedfuturesandoptionscontractsascomponentsofmerchandisingstrategiesdesigned toenhancemargins .Theresultsof thesestrategiescanbe significantly impactedby factors suchas thevolatilityof therelationshipbetween thevalueofexchange-tradedcommoditiesfuturescontractsandthecashpricesoftheunderlyingcommodities,counterpartycontractsdefaults,andvolatilityof freightmarkets .Inventoriesofcertainmerchandisableagriculturalcommodities,whichincludeamountsacquiredunderdeferredpricingcontracts,arestatedatmarketvalue .Exchange-traded futuresandoptionscontracts, forwardcashpurchasecontracts,andforwardcashsalescontractsofmerchandisableagriculturalcommodities,whichhavenotbeendesignatedas fair valuehedges,are valuedatmarketprice .Changesinthemarketvalueofinventoriesofmerchandisableagriculturalcommodities,forwardcashpurchaseandsalescontracts,andexchange-tradedfuturescontractsarerecognizedinearningsimmediately,resultingincostofgoodssoldapproximatingfirst-in,first-out(FIFO)cost .Unrealizedgainson forwardcashpurchasecontracts, forward cash sales contracts, and exchange-traded
futures contracts represent the fair valueof such instrumentsandareclassifiedontheCompany’sbalancesheetasreceivables .Unrealizedlossesonforwardcashpurchasecontracts,forwardcashsalescontracts,andexchange-tradedfuturescontractsrepresentthefairvalueofsuchinstrumentsandareclassifiedontheCompany’sbalancesheetasaccountspayable .
TheCompanyalsovaluescertaininventoriesusingthelowerofcost,determinedbyeithertheLIFOorFIFOmethod,ormarket .
2006 2005 (Inthousands)LIFOinventories FIFOvalue . . . . . . . . . . . . . . . . . . . . . . . . . . . . . . . . . . . . $ 437,942 $ 339,964 LIFOvaluationreserve . . . . . . . . . . . . . . . . . . . . . . . . . . (8,740) (20,732)LIFOinventoriescarryingvalue . . . . . . . . . . . . . . . . . . . . . . 429,202 319,232FIFOinventories . . . . . . . . . . . . . . . . . . . . . . . . . . . . . . . . . . 1,427,597 1,292,822Marketinventories . . . . . . . . . . . . . . . . . . . . . . . . . . . . . . . . 2,820,709 2,294,644 . . . . . . . . . . . . . . . . . . . . . . . . . . . . . . . . . . . . . . . . . . . . . . . . $4,677,508 $3,906,698
TheCompany, from time to time,uses futures contracts to fixthepurchasepriceofanticipatedvolumesofcommodities tobepurchasedandprocessedinafuturemonth .TheCompanyalsousesfutures,options,andswapstofixthepurchasepriceoftheCompany’santicipatednaturalgasrequirementsforcertainproductionfacilities .Inaddition,certainof theCompany’sethanolsalescontractsareindexedtounleadedgasolineprices .TheCompanyusesfuturesandoptionstofixthesalespriceofanticipatedvolumesoftheseethanolsalesinfuturemonths .Thesederivativesaredesignatedascashflowhedges .Thechangesinthemarketvalueofsuchderivativecontractshavehistoricallybeen,andareexpectedtocontinuetobe,highlyeffectiveatoffsettingchanges inpricemovementsof thehedgeditem .Theamountsrepresenting the ineffectivenessof thesecashflowhedgesareimmaterial .Gainsandlossesarisingfromopenandclosedhedging transactionsaredeferred inothercomprehensiveincome(loss),netofapplicableincometaxes,andrecognizedasacomponentofcostofproductssoldinthestatementofearningswhenthehedgeditemisrecognized .Asof June30,2006, theCompanyhasrecorded$37millionofafter-taxlossesinothercomprehensiveincome(loss) related togainsand losses fromcash flowhedgetransactions .TheCompanyexpects to recognize$33millionoftheseafter-taxlossesinthestatementofearningsduringfiscal2007,andtheremaining$4millionofafter-taxlossesareexpectedtoberecognizedinthestatementofearningsduringthefirsttwoquartersoffiscal2008 .
At June30,2006,othercomprehensive income(loss) includeda$7millionafter-taxgain related toa treasury-lockagreemententeredintoandsettledduring2006 .Thistreasury-lockagreementwasdesignatedasacash flowhedgeof theanticipatedproceedsfrom theCompany’s issuanceof$600millionofdebentures in
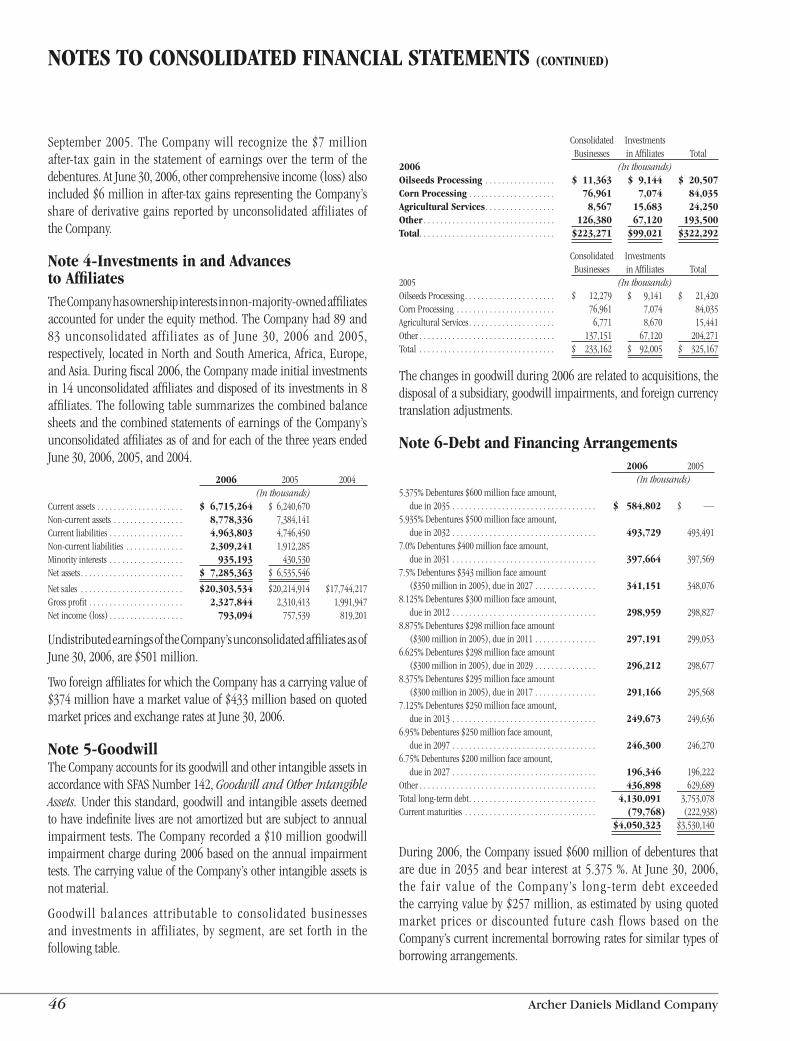
46 Archer Daniels Midland Company
September 2005 . The Company will recognize the $7 millionafter-taxgain in the statementofearningsover the termof thedebentures .AtJune30,2006,othercomprehensiveincome(loss)alsoincluded$6millioninafter-taxgainsrepresentingtheCompany’sshareofderivativegains reportedbyunconsolidatedaffiliatesoftheCompany .
Note 4-Investments in and Advances to AffiliatesTheCompanyhasownershipinterestsinnon-majority-ownedaffiliatesaccountedforundertheequitymethod .TheCompanyhad89and83 unconsolidated affiliates as of June 30, 2006 and 2005,respectively, located inNorthandSouthAmerica,Africa,Europe,andAsia .Duringfiscal2006,theCompanymadeinitialinvestmentsin14unconsolidatedaffiliatesanddisposedofitsinvestmentsin8affiliates .The following tablesummarizes thecombinedbalancesheetsandthecombinedstatementsofearningsof theCompany’sunconsolidatedaffiliatesasofandforeachofthethreeyearsendedJune30,2006,2005,and2004 .
2006 2005 2004 (Inthousands)Currentassets . . . . . . . . . . . . . . . . . . . . . $ 6,715,264 $ 6,240,670Non-currentassets . . . . . . . . . . . . . . . . . 8,778,336 7,384,141Currentliabilities . . . . . . . . . . . . . . . . . . 4,963,803 4,746,450Non-currentliabilities . . . . . . . . . . . . . . 2,309,241 1,912,285Minorityinterests . . . . . . . . . . . . . . . . . . 935,193 430,530Netassets . . . . . . . . . . . . . . . . . . . . . . . . . $ 7,285,363 $ 6,535,546
Netsales . . . . . . . . . . . . . . . . . . . . . . . . . $20,303,534 $20,214,914 $17,744,217Grossprofit . . . . . . . . . . . . . . . . . . . . . . . 2,327,844 2,310,413 1,991,947Netincome(loss) . . . . . . . . . . . . . . . . . . 793,094 757,539 819,201
UndistributedearningsoftheCompany’sunconsolidatedaffiliatesasofJune30,2006,are$501million .
TwoforeignaffiliatesforwhichtheCompanyhasacarryingvalueof$374millionhaveamarketvalueof$433millionbasedonquotedmarketpricesandexchangeratesatJune30,2006 .
Note 5-GoodwillTheCompanyaccountsforitsgoodwillandotherintangibleassetsinaccordancewithSFASNumber142,GoodwillandOtherIntangibleAssets.Underthisstandard,goodwillandintangibleassetsdeemedtohaveindefinitelivesarenotamortizedbutaresubjecttoannualimpairment tests .TheCompanyrecordeda$10milliongoodwillimpairmentchargeduring2006basedontheannualimpairmenttests .ThecarryingvalueoftheCompany’sotherintangibleassetsisnotmaterial .
Goodwill balances attributable to consolidated businessesand investments inaffiliates, by segment, are set forth in thefollowingtable .
Consolidated Investments Businesses inAffiliates Total2006 (Inthousands)Oilseeds Processing . . . . . . . . . . . . . . . . . $ 11,363 $ 9,144 $ 20,507Corn Processing . . . . . . . . . . . . . . . . . . . . . 76,961 7,074 84,035Agricultural Services . . . . . . . . . . . . . . . . . 8,567 15,683 24,250Other . . . . . . . . . . . . . . . . . . . . . . . . . . . . . . . . 126,380 67,120 193,500Total . . . . . . . . . . . . . . . . . . . . . . . . . . . . . . . . . $223,271 $99,021 $322,292
Consolidated Investments Businesses inAffiliates Total2005 (Inthousands)OilseedsProcessing . . . . . . . . . . . . . . . . . . . . . . $ 12,279 $ 9,141 $ 21,420CornProcessing . . . . . . . . . . . . . . . . . . . . . . . . 76,961 7,074 84,035AgriculturalServices . . . . . . . . . . . . . . . . . . . . . 6,771 8,670 15,441Other . . . . . . . . . . . . . . . . . . . . . . . . . . . . . . . . . 137,151 67,120 204,271Total . . . . . . . . . . . . . . . . . . . . . . . . . . . . . . . . . $ 233,162 $ 92,005 $ 325,167
Thechangesingoodwillduring2006arerelatedtoacquisitions,thedisposalofasubsidiary,goodwillimpairments,andforeigncurrencytranslationadjustments .
Note 6-Debt and Financing Arrangements 2006 2005 (Inthousands)5 .375%Debentures$600millionfaceamount, duein2035 . . . . . . . . . . . . . . . . . . . . . . . . . . . . . . . . . . . $ 584,802 $ —5 .935%Debentures$500millionfaceamount, duein2032 . . . . . . . . . . . . . . . . . . . . . . . . . . . . . . . . . . . 493,729 493,4917 .0%Debentures$400millionfaceamount, duein2031 . . . . . . . . . . . . . . . . . . . . . . . . . . . . . . . . . . . 397,664 397,5697 .5%Debentures$343millionfaceamount ($350millionin2005),duein2027 . . . . . . . . . . . . . . . 341,151 348,0768 .125%Debentures$300millionfaceamount, duein2012 . . . . . . . . . . . . . . . . . . . . . . . . . . . . . . . . . . . 298,959 298,8278 .875%Debentures$298millionfaceamount ($300millionin2005),duein2011 . . . . . . . . . . . . . . . 297,191 299,0536 .625%Debentures$298millionfaceamount ($300millionin2005),duein2029 . . . . . . . . . . . . . . . 296,212 298,6778 .375%Debentures$295millionfaceamount ($300millionin2005),duein2017 . . . . . . . . . . . . . . . 291,166 295,5687 .125%Debentures$250millionfaceamount, duein2013 . . . . . . . . . . . . . . . . . . . . . . . . . . . . . . . . . . . 249,673 249,6366 .95%Debentures$250millionfaceamount, duein2097 . . . . . . . . . . . . . . . . . . . . . . . . . . . . . . . . . . . 246,300 246,2706 .75%Debentures$200millionfaceamount, duein2027 . . . . . . . . . . . . . . . . . . . . . . . . . . . . . . . . . . . 196,346 196,222Other . . . . . . . . . . . . . . . . . . . . . . . . . . . . . . . . . . . . . . . . . . . 436,898 629,689Totallong-termdebt . . . . . . . . . . . . . . . . . . . . . . . . . . . . . . . 4,130,091 3,753,078Currentmaturities . . . . . . . . . . . . . . . . . . . . . . . . . . . . . . . . (79,768) (222,938) . . . . . . . . . . . . . . . . . . . . . . . . . . . . . . . . . . . . . . . . . . . . . . . . $4,050,323 $3,530,140
During2006,theCompanyissued$600millionofdebenturesthataredue in2035andbear interestat5 .375% .At June30,2006,the fair value of the Company’s long-term debt exceededthecarryingvalueby$257million,asestimatedbyusingquotedmarket prices or discounted future cash flows based on theCompany’scurrentincrementalborrowingratesforsimilartypesofborrowingarrangements .
NOTES TO CONSOLIDATED FINANCIAL STATEMENTS (CONTINUED)
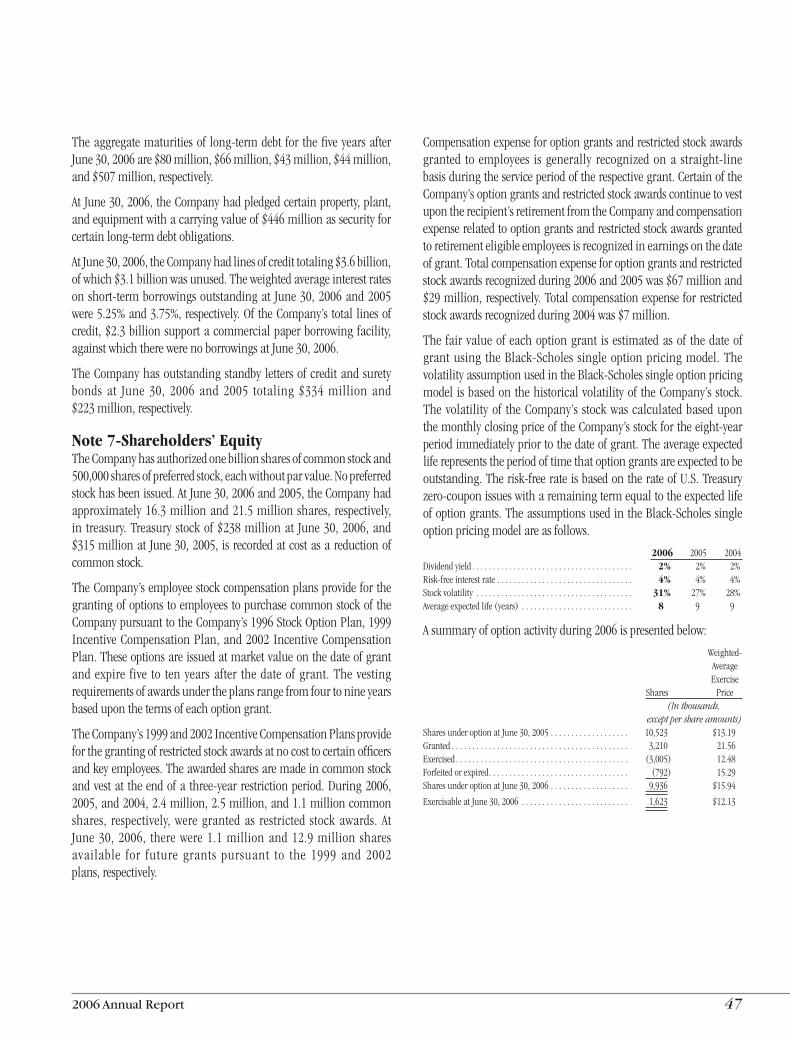
2006 Annual Report 47
Theaggregatematuritiesof long-termdebt for thefiveyearsafterJune30,2006are$80million,$66million,$43million,$44million,and$507million,respectively .
AtJune30,2006,theCompanyhadpledgedcertainproperty,plant,andequipmentwithacarryingvalueof$446millionassecurityforcertainlong-termdebtobligations .
AtJune30,2006,theCompanyhadlinesofcredittotaling$3 .6billion,ofwhich$3 .1billionwasunused .Theweightedaverageinterestratesonshort-termborrowingsoutstandingat June30,2006and2005were5 .25%and3 .75%,respectively .OftheCompany’stotallinesofcredit,$2 .3billionsupportacommercialpaperborrowingfacility,againstwhichtherewerenoborrowingsatJune30,2006 .
TheCompanyhasoutstandingstandbylettersofcreditandsuretybonds at June 30, 2006 and 2005 totaling $334 million and$223million,respectively .
Note 7-Shareholders’ EquityTheCompanyhasauthorizedonebillionsharesofcommonstockand500,000sharesofpreferredstock,eachwithoutparvalue .Nopreferredstockhasbeenissued .AtJune30,2006and2005,theCompanyhadapproximately16 .3millionand21 .5millionshares, respectively,in treasury .Treasurystockof$238millionat June30,2006,and$315millionatJune30,2005,isrecordedatcostasareductionofcommonstock .
TheCompany’semployeestockcompensationplansprovideforthegrantingofoptionstoemployeestopurchasecommonstockoftheCompanypursuanttotheCompany’s1996StockOptionPlan,1999IncentiveCompensationPlan,and2002IncentiveCompensationPlan .Theseoptionsareissuedatmarketvalueonthedateofgrantandexpire five to tenyearsafter thedateofgrant .Thevestingrequirementsofawardsundertheplansrangefromfourtonineyearsbaseduponthetermsofeachoptiongrant .
TheCompany’s1999and2002IncentiveCompensationPlansprovideforthegrantingofrestrictedstockawardsatnocosttocertainofficersandkeyemployees .Theawardedsharesaremadeincommonstockandvestattheendofathree-yearrestrictionperiod .During2006,2005,and2004,2 .4million,2 .5million,and1 .1millioncommonshares, respectively,weregrantedas restricted stockawards .AtJune30,2006, therewere1 .1millionand12 .9million sharesavailable for future grants pursuant to the 1999 and 2002plans,respectively .
Compensationexpenseforoptiongrantsandrestrictedstockawardsgranted toemployees isgenerally recognizedona straight-linebasisduringtheserviceperiodoftherespectivegrant .CertainoftheCompany’soptiongrantsandrestrictedstockawardscontinuetovestupontherecipient’sretirementfromtheCompanyandcompensationexpenserelatedtooptiongrantsandrestrictedstockawardsgrantedtoretirementeligibleemployeesisrecognizedinearningsonthedateofgrant .Totalcompensationexpenseforoptiongrantsandrestrictedstockawardsrecognizedduring2006and2005was$67millionand$29million,respectively .Totalcompensationexpenseforrestrictedstockawardsrecognizedduring2004was$7million .
The fairvalueofeachoptiongrant isestimatedasof thedateofgrantusing theBlack-Scholes singleoptionpricingmodel .ThevolatilityassumptionusedintheBlack-Scholessingleoptionpricingmodel isbasedonthehistoricalvolatilityof theCompany’sstock .Thevolatilityof theCompany’sstockwascalculatedbaseduponthemonthlyclosingpriceoftheCompany’sstockfortheeight-yearperiodimmediatelypriortothedateofgrant .Theaverageexpectedliferepresentstheperiodoftimethatoptiongrantsareexpectedtobeoutstanding .Therisk-freerateisbasedontherateofU .S .Treasuryzero-couponissueswitharemainingtermequaltotheexpectedlifeofoptiongrants .TheassumptionsusedintheBlack-Scholessingleoptionpricingmodelareasfollows .
2006 2005 2004Dividendyield . . . . . . . . . . . . . . . . . . . . . . . . . . . . . . . . . . . . . . . 2% 2% 2%Risk-freeinterestrate . . . . . . . . . . . . . . . . . . . . . . . . . . . . . . . . . 4% 4% 4%Stockvolatility . . . . . . . . . . . . . . . . . . . . . . . . . . . . . . . . . . . . . . 31% 27% 28%Averageexpectedlife(years) . . . . . . . . . . . . . . . . . . . . . . . . . . . 8 9 9
Asummaryofoptionactivityduring2006ispresentedbelow:
Weighted- Average Exercise Shares Price (Inthousands, exceptpershareamounts)SharesunderoptionatJune30,2005 . . . . . . . . . . . . . . . . . . . 10,523 $13 .19Granted . . . . . . . . . . . . . . . . . . . . . . . . . . . . . . . . . . . . . . . . . . . 3,210 21 .56Exercised . . . . . . . . . . . . . . . . . . . . . . . . . . . . . . . . . . . . . . . . . . (3,005) 12 .48Forfeitedorexpired . . . . . . . . . . . . . . . . . . . . . . . . . . . . . . . . . . (792) 15 .29SharesunderoptionatJune30,2006 . . . . . . . . . . . . . . . . . . . 9,936 $15 .94
ExercisableatJune30,2006 . . . . . . . . . . . . . . . . . . . . . . . . . . 1,623 $12 .13
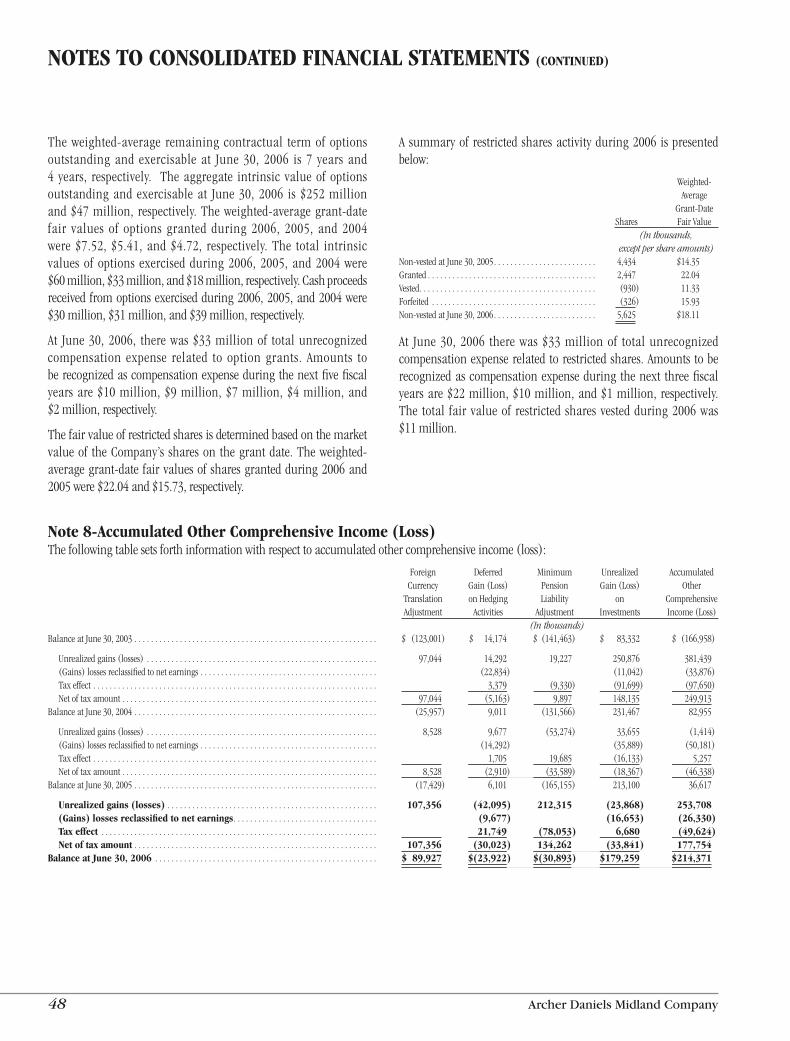
48 Archer Daniels Midland Company
The weighted-average remaining contractual term of optionsoutstanding and exercisable at June 30, 2006 is 7 years and4 years, respectively . Theaggregate intrinsic valueof optionsoutstandingand exercisable at June30, 2006 is $252millionand$47million, respectively .Theweighted-averagegrant-datefair values of options granted during 2006, 2005, and 2004were $7 .52, $5 .41, and $4 .72, respectively . The total intrinsicvaluesof options exercisedduring2006,2005,and2004were$60million,$33million,and$18million,respectively .Cashproceedsreceivedfromoptionsexercisedduring2006,2005,and2004were$30million,$31million,and$39million,respectively .
At June30,2006, therewas$33millionof totalunrecognizedcompensation expense related to option grants . Amounts toberecognizedascompensationexpenseduringthenextfivefiscalyearsare$10million,$9million,$7million,$4million,and$2million,respectively .
Thefairvalueofrestrictedsharesisdeterminedbasedonthemarketvalueof theCompany’s shareson thegrantdate .Theweighted-averagegrant-date fairvaluesofsharesgrantedduring2006and2005were$22 .04and$15 .73,respectively .
A summaryof restrictedsharesactivityduring2006 ispresentedbelow:
Weighted- Average Grant-Date Shares FairValue (Inthousands, exceptpershareamounts)Non-vestedatJune30,2005 . . . . . . . . . . . . . . . . . . . . . . . . . 4,434 $14 .35Granted . . . . . . . . . . . . . . . . . . . . . . . . . . . . . . . . . . . . . . . . . 2,447 22 .04Vested . . . . . . . . . . . . . . . . . . . . . . . . . . . . . . . . . . . . . . . . . . . (930) 11 .33Forfeited . . . . . . . . . . . . . . . . . . . . . . . . . . . . . . . . . . . . . . . . (326) 15 .93Non-vestedatJune30,2006 . . . . . . . . . . . . . . . . . . . . . . . . . 5,625 $18 .11
At June30, 2006 therewas$33millionof totalunrecognizedcompensationexpenserelated torestrictedshares .Amounts toberecognizedascompensationexpenseduring thenext threefiscalyearsare$22million,$10million,and$1million, respectively .The total fair valueof restricted sharesvestedduring2006was$11million .
Note 8-Accumulated Other Comprehensive Income (Loss)Thefollowingtablesetsforthinformationwithrespecttoaccumulatedothercomprehensiveincome(loss):
Foreign Deferred Minimum Unrealized Accumulated Currency Gain(Loss) Pension Gain(Loss) Other Translation onHedging Liability on Comprehensive Adjustment Activities Adjustment Investments Income(Loss) (Inthousands)BalanceatJune30,2003 . . . . . . . . . . . . . . . . . . . . . . . . . . . . . . . . . . . . . . . . . . . . . . . . . . . . . . . . . . . $ (123,001) $ 14,174 $ (141,463) $ 83,332 $ (166,958)
Unrealizedgains(losses) . . . . . . . . . . . . . . . . . . . . . . . . . . . . . . . . . . . . . . . . . . . . . . . . . . . . . . . . 97,044 14,292 19,227 250,876 381,439 (Gains)lossesreclassifiedtonetearnings . . . . . . . . . . . . . . . . . . . . . . . . . . . . . . . . . . . . . . . . . . . (22,834) (11,042) (33,876) Taxeffect . . . . . . . . . . . . . . . . . . . . . . . . . . . . . . . . . . . . . . . . . . . . . . . . . . . . . . . . . . . . . . . . . . . . . 3,379 (9,330) (91,699) (97,650) Netoftaxamount . . . . . . . . . . . . . . . . . . . . . . . . . . . . . . . . . . . . . . . . . . . . . . . . . . . . . . . . . . . . . . 97,044 (5,163) 9,897 148,135 249,913BalanceatJune30,2004 . . . . . . . . . . . . . . . . . . . . . . . . . . . . . . . . . . . . . . . . . . . . . . . . . . . . . . . . . . . (25,957) 9,011 (131,566) 231,467 82,955
Unrealizedgains(losses) . . . . . . . . . . . . . . . . . . . . . . . . . . . . . . . . . . . . . . . . . . . . . . . . . . . . . . . . 8,528 9,677 (53,274) 33,655 (1,414) (Gains)lossesreclassifiedtonetearnings . . . . . . . . . . . . . . . . . . . . . . . . . . . . . . . . . . . . . . . . . . . (14,292) (35,889) (50,181) Taxeffect . . . . . . . . . . . . . . . . . . . . . . . . . . . . . . . . . . . . . . . . . . . . . . . . . . . . . . . . . . . . . . . . . . . . . 1,705 19,685 (16,133) 5,257 Netoftaxamount . . . . . . . . . . . . . . . . . . . . . . . . . . . . . . . . . . . . . . . . . . . . . . . . . . . . . . . . . . . . . . 8,528 (2,910) (33,589) (18,367) (46,338)BalanceatJune30,2005 . . . . . . . . . . . . . . . . . . . . . . . . . . . . . . . . . . . . . . . . . . . . . . . . . . . . . . . . . . . (17,429) 6,101 (165,155) 213,100 36,617
Unrealized gains (losses) . . . . . . . . . . . . . . . . . . . . . . . . . . . . . . . . . . . . . . . . . . . . . . . . . . . 107,356 (42,095) 212,315 (23,868) 253,708 (Gains) losses reclassified to net earnings . . . . . . . . . . . . . . . . . . . . . . . . . . . . . . . . . . . (9,677) (16,653) (26,330) Tax effect . . . . . . . . . . . . . . . . . . . . . . . . . . . . . . . . . . . . . . . . . . . . . . . . . . . . . . . . . . . . . . . . . . . 21,749 (78,053) 6,680 (49,624) Net of tax amount . . . . . . . . . . . . . . . . . . . . . . . . . . . . . . . . . . . . . . . . . . . . . . . . . . . . . . . . . . . 107,356 (30,023) 134,262 (33,841) 177,754Balance at June 30, 2006 . . . . . . . . . . . . . . . . . . . . . . . . . . . . . . . . . . . . . . . . . . . . . . . . . . . . . . $ 89,927 $(23,922) $(30,893) $179,259 $214,371
NOTES TO CONSOLIDATED FINANCIAL STATEMENTS (CONTINUED)
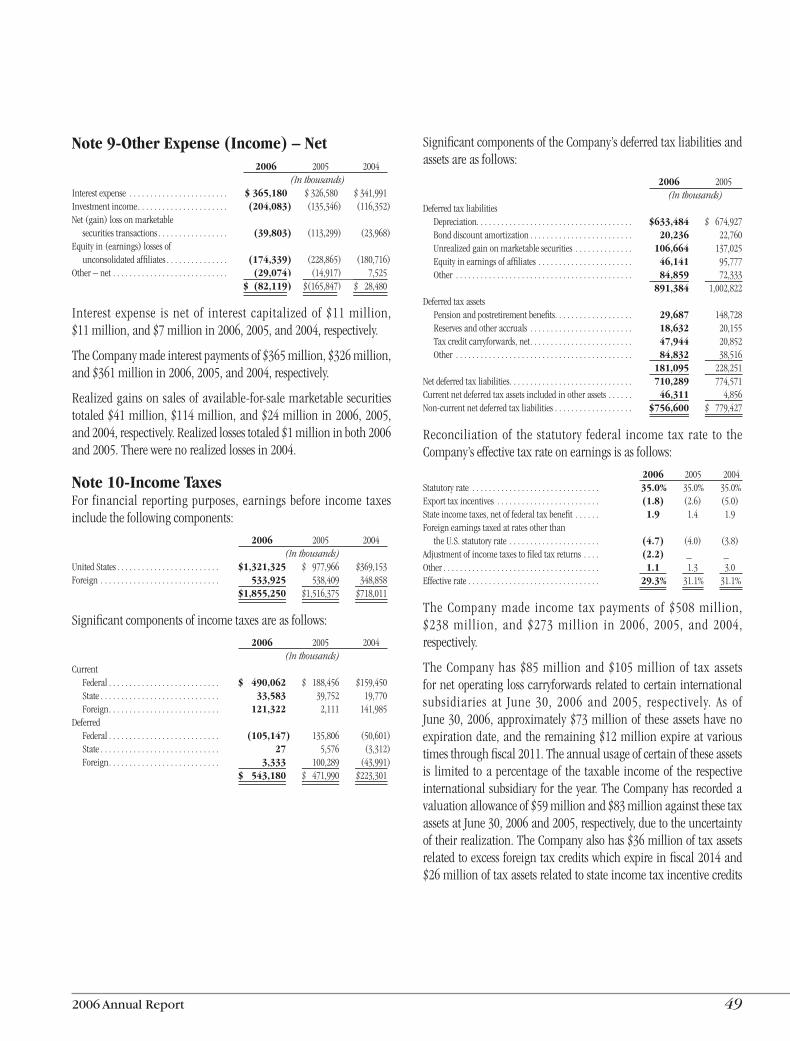
2006 Annual Report 49
Note 9-Other Expense (Income) – Net 2006 2005 2004 (Inthousands)Interestexpense . . . . . . . . . . . . . . . . . . . . . . . . $ 365,180 $326,580 $341,991Investmentincome . . . . . . . . . . . . . . . . . . . . . . (204,083) (135,346) (116,352)Net(gain)lossonmarketable securitiestransactions . . . . . . . . . . . . . . . . . (39,803) (113,299) (23,968)Equityin(earnings)lossesof unconsolidatedaffiliates . . . . . . . . . . . . . . . (174,339) (228,865) (180,716)Other–net . . . . . . . . . . . . . . . . . . . . . . . . . . . . (29,074) (14,917) 7,525 . . . . . . . . . . . . . . . . . . . . . . . . . . . . . . . . . . . . . . $ (82,119) $(165,847) $ 28,480
Interest expense is net of interest capitalized of $11 million,$11million,and$7millionin2006,2005,and2004,respectively .
TheCompanymadeinterestpaymentsof$365million,$326million,and$361millionin2006,2005,and2004,respectively .
Realizedgainsonsalesofavailable-for-salemarketablesecuritiestotaled$41million,$114million,and$24millionin2006,2005,and2004,respectively .Realizedlossestotaled$1millioninboth2006and2005 .Therewerenorealizedlossesin2004 .
Note 10-Income TaxesFor financial reportingpurposes, earningsbefore income taxesincludethefollowingcomponents:
2006 2005 2004 (Inthousands)UnitedStates . . . . . . . . . . . . . . . . . . . . . . . . . $1,321,325 $ 977,966 $369,153Foreign . . . . . . . . . . . . . . . . . . . . . . . . . . . . . 533,925 538,409 348,858 . . . . . . . . . . . . . . . . . . . . . . . . . . . . . . . . . . . . $1,855,250 $1,516,375 $718,011
Significantcomponentsofincometaxesareasfollows:
2006 2005 2004 (Inthousands)Current Federal . . . . . . . . . . . . . . . . . . . . . . . . . . . $ 490,062 $ 188,456 $159,450 State . . . . . . . . . . . . . . . . . . . . . . . . . . . . . 33,583 39,752 19,770 Foreign . . . . . . . . . . . . . . . . . . . . . . . . . . . 121,322 2,111 141,985Deferred Federal . . . . . . . . . . . . . . . . . . . . . . . . . . . (105,147) 135,806 (50,601) State . . . . . . . . . . . . . . . . . . . . . . . . . . . . . 27 5,576 (3,312) Foreign . . . . . . . . . . . . . . . . . . . . . . . . . . . 3,333 100,289 (43,991) . . . . . . . . . . . . . . . . . . . . . . . . . . . . . . . . . . . . $ 543,180 $ 471,990 $223,301
SignificantcomponentsoftheCompany’sdeferredtaxliabilitiesandassetsareasfollows:
2006 2005 (Inthousands)Deferredtaxliabilities Depreciation . . . . . . . . . . . . . . . . . . . . . . . . . . . . . . . . . . . . . . $633,484 $ 674,927 Bonddiscountamortization . . . . . . . . . . . . . . . . . . . . . . . . . 20,236 22,760 Unrealizedgainonmarketablesecurities . . . . . . . . . . . . . . 106,664 137,025 Equityinearningsofaffiliates . . . . . . . . . . . . . . . . . . . . . . . 46,141 95,777 Other . . . . . . . . . . . . . . . . . . . . . . . . . . . . . . . . . . . . . . . . . . . 84,859 72,333 . . . . . . . . . . . . . . . . . . . . . . . . . . . . . . . . . . . . . . . . . . . . . . . . . . . 891,384 1,002,822Deferredtaxassets Pensionandpostretirementbenefits . . . . . . . . . . . . . . . . . . . 29,687 148,728 Reservesandotheraccruals . . . . . . . . . . . . . . . . . . . . . . . . . 18,632 20,155 Taxcreditcarryforwards,net . . . . . . . . . . . . . . . . . . . . . . . . . 47,944 20,852 Other . . . . . . . . . . . . . . . . . . . . . . . . . . . . . . . . . . . . . . . . . . . 84,832 38,516 . . . . . . . . . . . . . . . . . . . . . . . . . . . . . . . . . . . . . . . . . . . . . . . . . . . 181,095 228,251Netdeferredtaxliabilities . . . . . . . . . . . . . . . . . . . . . . . . . . . . . . 710,289 774,571Currentnetdeferredtaxassetsincludedinotherassets . . . . . . 46,311 4,856Non-currentnetdeferredtaxliabilities . . . . . . . . . . . . . . . . . . . $756,600 $ 779,427
Reconciliation of the statutory federal income tax rate to theCompany’seffectivetaxrateonearningsisasfollows:
2006 2005 2004Statutoryrate . . . . . . . . . . . . . . . . . . . . . . . . . . . . . . . 35.0% 35 .0% 35 .0%Exporttaxincentives . . . . . . . . . . . . . . . . . . . . . . . . . (1.8) (2 .6) (5 .0)Stateincometaxes,netoffederaltaxbenefit . . . . . . 1.9 1 .4 1 .9Foreignearningstaxedatratesotherthan theU .S .statutoryrate . . . . . . . . . . . . . . . . . . . . . . (4.7) (4 .0) (3 .8)Adjustmentofincometaxestofiledtaxreturns . . . . (2.2) _ _Other . . . . . . . . . . . . . . . . . . . . . . . . . . . . . . . . . . . . . . 1.1 1 .3 3 .0Effectiverate . . . . . . . . . . . . . . . . . . . . . . . . . . . . . . . . 29.3% 31 .1% 31 .1%
The Company made income tax payments of $508 million,$238 million, and $273 million in 2006, 2005, and 2004,respectively .
TheCompanyhas$85millionand$105millionof taxassetsfornetoperatinglosscarryforwardsrelatedtocertaininternationalsubsidiaries at June 30, 2006 and 2005, respectively . As ofJune30,2006,approximately$73millionof theseassetshavenoexpirationdate,andtheremaining$12millionexpireatvarioustimesthroughfiscal2011 .Theannualusageofcertainoftheseassetsis limited toapercentageof the taxable incomeof therespectiveinternationalsubsidiaryfortheyear .TheCompanyhasrecordedavaluationallowanceof$59millionand$83millionagainstthesetaxassetsatJune30,2006and2005,respectively,duetotheuncertaintyoftheirrealization .TheCompanyalsohas$36millionoftaxassetsrelatedtoexcessforeigntaxcreditswhichexpireinfiscal2014and$26millionoftaxassetsrelatedtostateincometaxincentivecredits
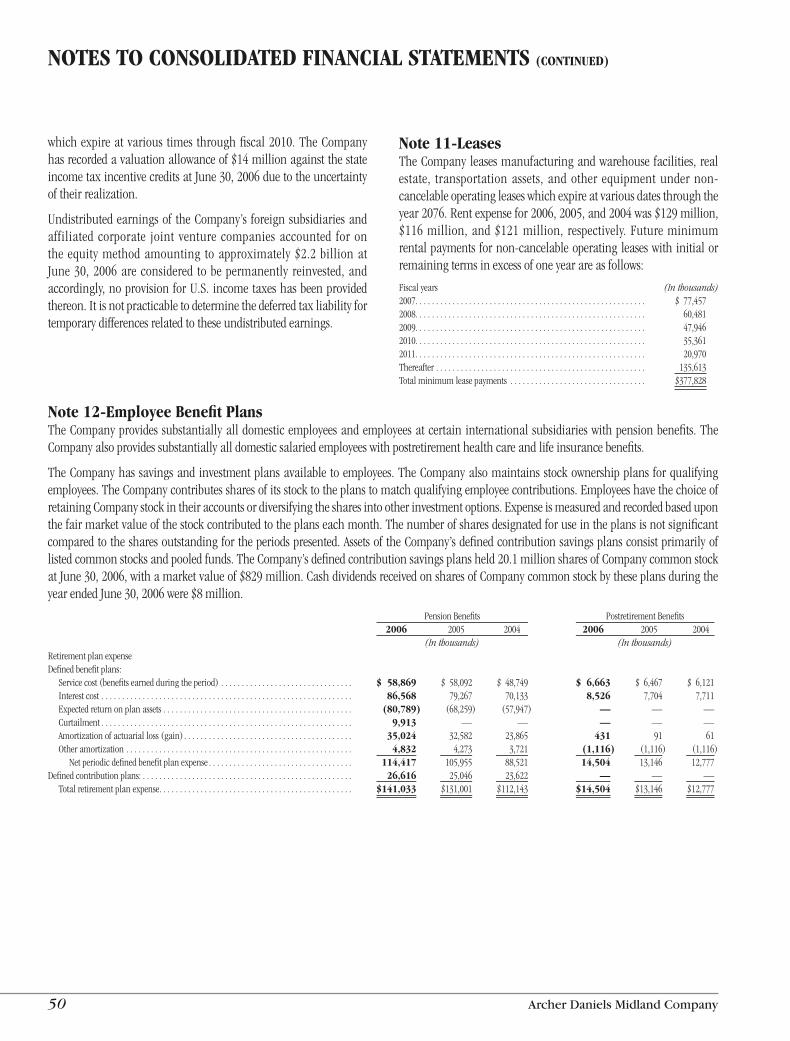
50 Archer Daniels Midland Company
whichexpireatvarious times throughfiscal2010 .TheCompanyhasrecordedavaluationallowanceof$14millionagainstthestateincometaxincentivecreditsatJune30,2006duetotheuncertaintyoftheirrealization .
Undistributedearningsof theCompany’s foreignsubsidiariesandaffiliated corporate joint venture companiesaccounted forontheequitymethodamounting toapproximately$2 .2billionatJune30,2006areconsidered tobepermanently reinvested,andaccordingly,noprovisionforU .S . incometaxeshasbeenprovidedthereon .Itisnotpracticabletodeterminethedeferredtaxliabilityfortemporarydifferencesrelatedtotheseundistributedearnings .
Note 11-LeasesTheCompanyleasesmanufacturingandwarehousefacilities,realestate, transportationassets, andother equipmentundernon-cancelableoperatingleaseswhichexpireatvariousdatesthroughtheyear2076 .Rentexpensefor2006,2005,and2004was$129million,$116million,and$121million, respectively .Futureminimumrentalpaymentsfornon-cancelableoperatingleaseswithinitialorremainingtermsinexcessofoneyearareasfollows:
Fiscalyears (Inthousands)2007 . . . . . . . . . . . . . . . . . . . . . . . . . . . . . . . . . . . . . . . . . . . . . . . . . . . . . . . . $ 77,4572008 . . . . . . . . . . . . . . . . . . . . . . . . . . . . . . . . . . . . . . . . . . . . . . . . . . . . . . . . 60,4812009 . . . . . . . . . . . . . . . . . . . . . . . . . . . . . . . . . . . . . . . . . . . . . . . . . . . . . . . . 47,9462010 . . . . . . . . . . . . . . . . . . . . . . . . . . . . . . . . . . . . . . . . . . . . . . . . . . . . . . . . 35,3612011 . . . . . . . . . . . . . . . . . . . . . . . . . . . . . . . . . . . . . . . . . . . . . . . . . . . . . . . . 20,970Thereafter . . . . . . . . . . . . . . . . . . . . . . . . . . . . . . . . . . . . . . . . . . . . . . . . . . . 135,613Totalminimumleasepayments . . . . . . . . . . . . . . . . . . . . . . . . . . . . . . . . . $377,828
NOTES TO CONSOLIDATED FINANCIAL STATEMENTS (CONTINUED)
Note 12-Employee Benefit PlansTheCompanyprovidessubstantiallyalldomesticemployeesandemployeesatcertaininternationalsubsidiarieswithpensionbenefits .TheCompanyalsoprovidessubstantiallyalldomesticsalariedemployeeswithpostretirementhealthcareandlifeinsurancebenefits .
TheCompanyhassavingsandinvestmentplansavailabletoemployees .TheCompanyalsomaintainsstockownershipplansforqualifyingemployees .TheCompanycontributessharesofitsstocktotheplanstomatchqualifyingemployeecontributions .EmployeeshavethechoiceofretainingCompanystockintheiraccountsordiversifyingthesharesintootherinvestmentoptions .Expenseismeasuredandrecordedbaseduponthefairmarketvalueofthestockcontributedtotheplanseachmonth .Thenumberofsharesdesignatedforuseintheplansisnotsignificantcomparedtothesharesoutstandingfortheperiodspresented .AssetsoftheCompany’sdefinedcontributionsavingsplansconsistprimarilyoflistedcommonstocksandpooledfunds .TheCompany’sdefinedcontributionsavingsplansheld20 .1millionsharesofCompanycommonstockatJune30,2006,withamarketvalueof$829million .CashdividendsreceivedonsharesofCompanycommonstockbytheseplansduringtheyearendedJune30,2006were$8million .
PensionBenefits PostretirementBenefits 2006 2005 2004 2006 2005 2004 (Inthousands) (Inthousands)RetirementplanexpenseDefinedbenefitplans: Servicecost(benefitsearnedduringtheperiod) . . . . . . . . . . . . . . . . . . . . . . . . . . . . . . . . $ 58,869 $ 58,092 $ 48,749 $ 6,663 $ 6,467 $ 6,121 Interestcost . . . . . . . . . . . . . . . . . . . . . . . . . . . . . . . . . . . . . . . . . . . . . . . . . . . . . . . . . . . . . 86,568 79,267 70,133 8,526 7,704 7,711 Expectedreturnonplanassets . . . . . . . . . . . . . . . . . . . . . . . . . . . . . . . . . . . . . . . . . . . . . . (80,789) (68,259) (57,947) — — — Curtailment . . . . . . . . . . . . . . . . . . . . . . . . . . . . . . . . . . . . . . . . . . . . . . . . . . . . . . . . . . . . . 9,913 — — — — — Amortizationofactuarialloss(gain) . . . . . . . . . . . . . . . . . . . . . . . . . . . . . . . . . . . . . . . . . 35,024 32,582 23,865 431 91 61 Otheramortization . . . . . . . . . . . . . . . . . . . . . . . . . . . . . . . . . . . . . . . . . . . . . . . . . . . . . . . 4,832 4,273 3,721 (1,116) (1,116) (1,116) Netperiodicdefinedbenefitplanexpense . . . . . . . . . . . . . . . . . . . . . . . . . . . . . . . . . . . 114,417 105,955 88,521 14,504 13,146 12,777Definedcontributionplans: . . . . . . . . . . . . . . . . . . . . . . . . . . . . . . . . . . . . . . . . . . . . . . . . . . . 26,616 25,046 23,622 — — — Totalretirementplanexpense . . . . . . . . . . . . . . . . . . . . . . . . . . . . . . . . . . . . . . . . . . . . . . . $141,033 $131,001 $112,143 $14,504 $13,146 $12,777
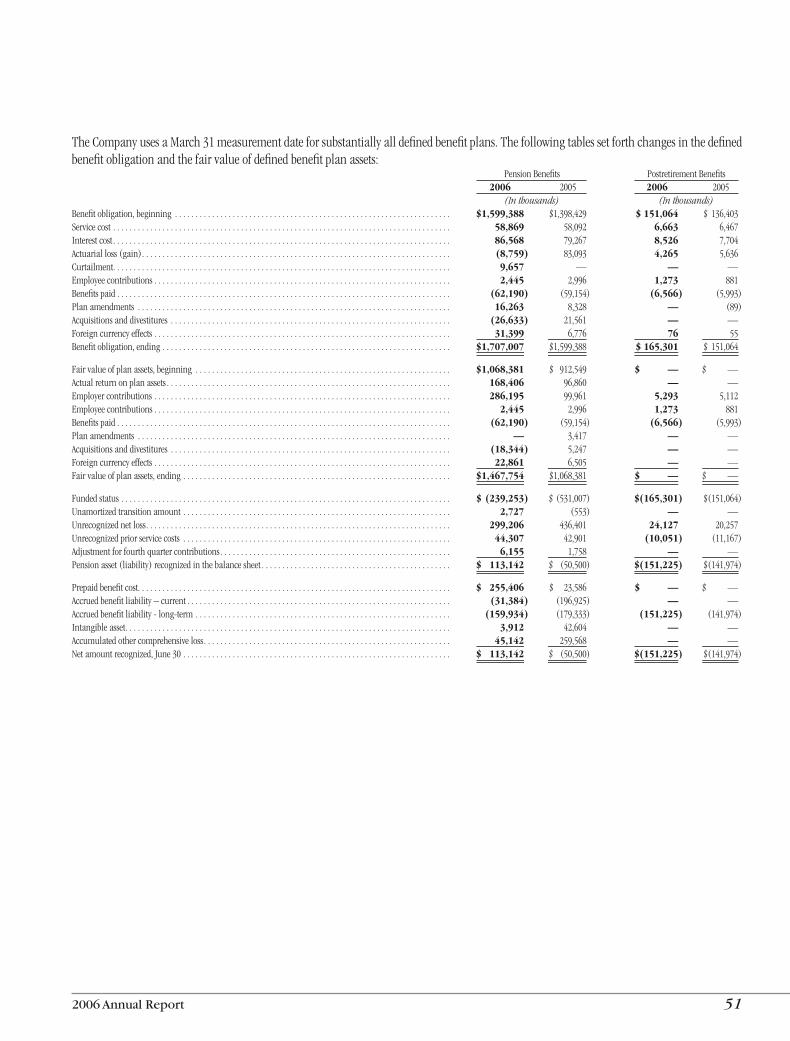
2006 Annual Report 5�
TheCompanyusesaMarch31measurementdateforsubstantiallyalldefinedbenefitplans .Thefollowingtablessetforthchangesinthedefinedbenefitobligationandthefairvalueofdefinedbenefitplanassets: PensionBenefits PostretirementBenefits 2006 2005 2006 2005 (Inthousands) (Inthousands)Benefitobligation,beginning . . . . . . . . . . . . . . . . . . . . . . . . . . . . . . . . . . . . . . . . . . . . . . . . . . . . . . . . . . . . . . . . . . . $1,599,388 $1,398,429 $ 151,064 $(136,403Servicecost . . . . . . . . . . . . . . . . . . . . . . . . . . . . . . . . . . . . . . . . . . . . . . . . . . . . . . . . . . . . . . . . . . . . . . . . . . . . . . . . . . 58,869 58,092 6,663 6,467Interestcost . . . . . . . . . . . . . . . . . . . . . . . . . . . . . . . . . . . . . . . . . . . . . . . . . . . . . . . . . . . . . . . . . . . . . . . . . . . . . . . . . . 86,568 79,267 8,526 7,704Actuarialloss(gain) . . . . . . . . . . . . . . . . . . . . . . . . . . . . . . . . . . . . . . . . . . . . . . . . . . . . . . . . . . . . . . . . . . . . . . . . . . . (8,759) 83,093 4,265 5,636Curtailment . . . . . . . . . . . . . . . . . . . . . . . . . . . . . . . . . . . . . . . . . . . . . . . . . . . . . . . . . . . . . . . . . . . . . . . . . . . . . . . . . . 9,657 — — —Employeecontributions . . . . . . . . . . . . . . . . . . . . . . . . . . . . . . . . . . . . . . . . . . . . . . . . . . . . . . . . . . . . . . . . . . . . . . . . 2,445 2,996 1,273 881Benefitspaid . . . . . . . . . . . . . . . . . . . . . . . . . . . . . . . . . . . . . . . . . . . . . . . . . . . . . . . . . . . . . . . . . . . . . . . . . . . . . . . . . (62,190) (59,154) (6,566) (5,993)Planamendments . . . . . . . . . . . . . . . . . . . . . . . . . . . . . . . . . . . . . . . . . . . . . . . . . . . . . . . . . . . . . . . . . . . . . . . . . . . . 16,263 8,328 — (89)Acquisitionsanddivestitures . . . . . . . . . . . . . . . . . . . . . . . . . . . . . . . . . . . . . . . . . . . . . . . . . . . . . . . . . . . . . . . . . . . . (26,633) 21,561 — —Foreigncurrencyeffects . . . . . . . . . . . . . . . . . . . . . . . . . . . . . . . . . . . . . . . . . . . . . . . . . . . . . . . . . . . . . . . . . . . . . . . . 31,399 6,776 76 55Benefitobligation,ending . . . . . . . . . . . . . . . . . . . . . . . . . . . . . . . . . . . . . . . . . . . . . . . . . . . . . . . . . . . . . . . . . . . . . . $1,707,007 $1,599,388 $ 165,301 $(151,064
Fairvalueofplanassets,beginning . . . . . . . . . . . . . . . . . . . . . . . . . . . . . . . . . . . . . . . . . . . . . . . . . . . . . . . . . . . . . . $1,068,381 $ 912,549 $ — $ —Actualreturnonplanassets . . . . . . . . . . . . . . . . . . . . . . . . . . . . . . . . . . . . . . . . . . . . . . . . . . . . . . . . . . . . . . . . . . . . . 168,406 96,860 — —Employercontributions . . . . . . . . . . . . . . . . . . . . . . . . . . . . . . . . . . . . . . . . . . . . . . . . . . . . . . . . . . . . . . . . . . . . . . . . 286,195 99,961 5,293 5,112Employeecontributions . . . . . . . . . . . . . . . . . . . . . . . . . . . . . . . . . . . . . . . . . . . . . . . . . . . . . . . . . . . . . . . . . . . . . . . . 2,445 2,996 1,273 881Benefitspaid . . . . . . . . . . . . . . . . . . . . . . . . . . . . . . . . . . . . . . . . . . . . . . . . . . . . . . . . . . . . . . . . . . . . . . . . . . . . . . . . . (62,190) (59,154) (6,566) (5,993)Planamendments . . . . . . . . . . . . . . . . . . . . . . . . . . . . . . . . . . . . . . . . . . . . . . . . . . . . . . . . . . . . . . . . . . . . . . . . . . . . — 3,417 — —Acquisitionsanddivestitures . . . . . . . . . . . . . . . . . . . . . . . . . . . . . . . . . . . . . . . . . . . . . . . . . . . . . . . . . . . . . . . . . . . . (18,344) 5,247 — —Foreigncurrencyeffects . . . . . . . . . . . . . . . . . . . . . . . . . . . . . . . . . . . . . . . . . . . . . . . . . . . . . . . . . . . . . . . . . . . . . . . . 22,861 6,505 — —Fairvalueofplanassets,ending . . . . . . . . . . . . . . . . . . . . . . . . . . . . . . . . . . . . . . . . . . . . . . . . . . . . . . . . . . . . . . . . . $1,467,754 $1,068,381 $ — $ —
Fundedstatus . . . . . . . . . . . . . . . . . . . . . . . . . . . . . . . . . . . . . . . . . . . . . . . . . . . . . . . . . . . . . . . . . . . . . . . . . . . . . . . . $ (239,253) $ (531,007) $(165,301) $(151,064)Unamortizedtransitionamount . . . . . . . . . . . . . . . . . . . . . . . . . . . . . . . . . . . . . . . . . . . . . . . . . . . . . . . . . . . . . . . . . 2,727 (553) — —Unrecognizednetloss . . . . . . . . . . . . . . . . . . . . . . . . . . . . . . . . . . . . . . . . . . . . . . . . . . . . . . . . . . . . . . . . . . . . . . . . . . 299,206 436,401 24,127 20,257Unrecognizedpriorservicecosts . . . . . . . . . . . . . . . . . . . . . . . . . . . . . . . . . . . . . . . . . . . . . . . . . . . . . . . . . . . . . . . . . 44,307 42,901 (10,051) (11,167)Adjustmentforfourthquartercontributions . . . . . . . . . . . . . . . . . . . . . . . . . . . . . . . . . . . . . . . . . . . . . . . . . . . . . . . . 6,155 1,758 — —Pensionasset(liability)recognizedinthebalancesheet . . . . . . . . . . . . . . . . . . . . . . . . . . . . . . . . . . . . . . . . . . . . . . $ 113,142 $ (50,500) $(151,225) $(141,974)
Prepaidbenefitcost . . . . . . . . . . . . . . . . . . . . . . . . . . . . . . . . . . . . . . . . . . . . . . . . . . . . . . . . . . . . . . . . . . . . . . . . . . . . $ 255,406 $ 23,586 $ — $ —Accruedbenefitliability–current . . . . . . . . . . . . . . . . . . . . . . . . . . . . . . . . . . . . . . . . . . . . . . . . . . . . . . . . . . . . . . . . (31,384) (196,925) — —Accruedbenefitliability-long-term . . . . . . . . . . . . . . . . . . . . . . . . . . . . . . . . . . . . . . . . . . . . . . . . . . . . . . . . . . . . . . (159,934) (179,333) (151,225) (141,974)Intangibleasset . . . . . . . . . . . . . . . . . . . . . . . . . . . . . . . . . . . . . . . . . . . . . . . . . . . . . . . . . . . . . . . . . . . . . . . . . . . . . . . 3,912 42,604 — —Accumulatedothercomprehensiveloss . . . . . . . . . . . . . . . . . . . . . . . . . . . . . . . . . . . . . . . . . . . . . . . . . . . . . . . . . . . . 45,142 259,568 — —Netamountrecognized,June30 . . . . . . . . . . . . . . . . . . . . . . . . . . . . . . . . . . . . . . . . . . . . . . . . . . . . . . . . . . . . . . . . . $ 113,142 $ (50,500) $(151,225) $(141,974)
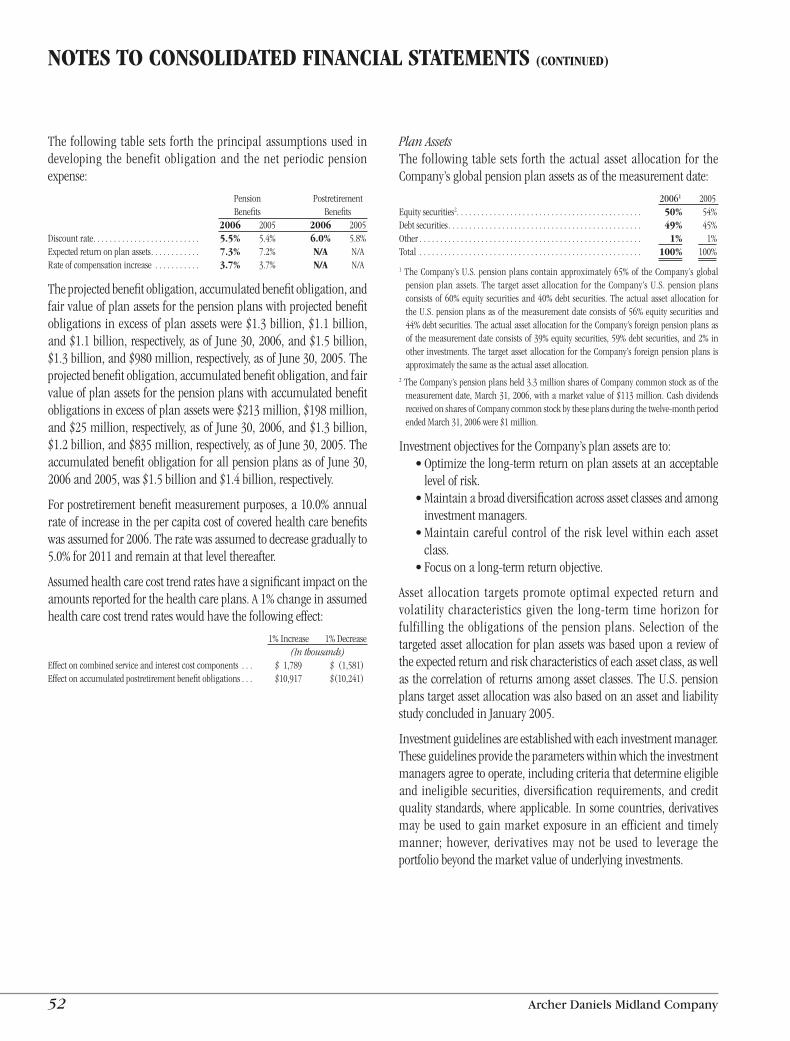
52 Archer Daniels Midland Company
The following table sets forth theprincipalassumptionsused indeveloping thebenefitobligationand thenetperiodicpensionexpense:
Pension Postretirement Benefits Benefits 2006 2005 2006 2005Discountrate . . . . . . . . . . . . . . . . . . . . . . . . . . 5.5% 5 .4% 6.0% 5 .8%Expectedreturnonplanassets . . . . . . . . . . . . 7.3% 7 .2% N/A N/ARateofcompensationincrease . . . . . . . . . . . 3.7% 3 .7% N/A N/A
Theprojectedbenefitobligation,accumulatedbenefitobligation,andfairvalueofplanassetsforthepensionplanswithprojectedbenefitobligationsinexcessofplanassetswere$1 .3billion,$1 .1billion,and$1 .1billion,respectively,asofJune30,2006,and$1 .5billion,$1 .3billion,and$980million,respectively,asofJune30,2005 .Theprojectedbenefitobligation,accumulatedbenefitobligation,andfairvalueofplanassetsforthepensionplanswithaccumulatedbenefitobligationsinexcessofplanassetswere$213million,$198million,and$25million,respectively,asofJune30,2006,and$1 .3billion,$1 .2billion,and$835million,respectively,asofJune30,2005 .TheaccumulatedbenefitobligationforallpensionplansasofJune30,2006and2005,was$1 .5billionand$1 .4billion,respectively .
Forpostretirementbenefitmeasurementpurposes,a10 .0%annualrateofincreaseinthepercapitacostofcoveredhealthcarebenefitswasassumedfor2006 .Theratewasassumedtodecreasegraduallyto5 .0%for2011andremainatthatlevelthereafter .
Assumedhealthcarecosttrendrateshaveasignificantimpactontheamountsreportedforthehealthcareplans .A1%changeinassumedhealthcarecosttrendrateswouldhavethefollowingeffect:
1%Increase 1%Decrease (Inthousands)Effectoncombinedserviceandinterestcostcomponents . . . $ 1,789 $ (1,581)Effectonaccumulatedpostretirementbenefitobligations . . . $10,917 $(10,241)
PlanAssetsThe following table sets forth theactualassetallocation for theCompany’sglobalpensionplanassetsasofthemeasurementdate:
20061 2005Equitysecurities2 . . . . . . . . . . . . . . . . . . . . . . . . . . . . . . . . . . . . . . . . . . . . . 50% 54%Debtsecurities . . . . . . . . . . . . . . . . . . . . . . . . . . . . . . . . . . . . . . . . . . . . . . . 49% 45%Other . . . . . . . . . . . . . . . . . . . . . . . . . . . . . . . . . . . . . . . . . . . . . . . . . . . . . . 1% 1%Total . . . . . . . . . . . . . . . . . . . . . . . . . . . . . . . . . . . . . . . . . . . . . . . . . . . . . . 100% 100%
1TheCompany’sU .S .pensionplanscontainapproximately65%of theCompany’sglobalpensionplanassets .The targetassetallocation for theCompany’sU .S .pensionplansconsistsof60%equitysecuritiesand40%debtsecurities .TheactualassetallocationfortheU .S .pensionplansasof themeasurementdateconsistsof56%equitysecuritiesand44%debtsecurities .TheactualassetallocationfortheCompany’sforeignpensionplansasofthemeasurementdateconsistsof39%equitysecurities,59%debtsecurities,and2%inotherinvestments .ThetargetassetallocationfortheCompany’sforeignpensionplansisapproximatelythesameastheactualassetallocation .
2TheCompany’spensionplansheld3 .3millionsharesofCompanycommonstockasofthemeasurementdate,March31,2006,withamarketvalueof$113million .CashdividendsreceivedonsharesofCompanycommonstockbytheseplansduringthetwelve-monthperiodendedMarch31,2006were$1million .
InvestmentobjectivesfortheCompany’splanassetsareto:Optimizethelong-termreturnonplanassetsatanacceptablelevelofrisk .Maintainabroaddiversificationacrossassetclassesandamonginvestmentmanagers .Maintaincarefulcontrolof the risk levelwithineachassetclass .Focusonalong-termreturnobjective .
Asset allocation targets promote optimal expected return andvolatility characteristics given the long-term timehorizon forfulfilling theobligationsof thepensionplans .Selectionof thetargetedassetallocationforplanassetswasbaseduponareviewoftheexpectedreturnandriskcharacteristicsofeachassetclass,aswellasthecorrelationofreturnsamongassetclasses .TheU .S .pensionplanstargetassetallocationwasalsobasedonanassetandliabilitystudyconcludedinJanuary2005 .
Investmentguidelinesareestablishedwitheachinvestmentmanager .Theseguidelinesprovidetheparameterswithinwhichtheinvestmentmanagersagreetooperate,includingcriteriathatdetermineeligibleand ineligiblesecurities,diversificationrequirements,andcreditqualitystandards,whereapplicable .Insomecountries,derivativesmaybeused togainmarketexposure inanefficientand timelymanner;however, derivativesmaynotbeused to leverage theportfoliobeyondthemarketvalueofunderlyinginvestments .
•
•
•
•
NOTES TO CONSOLIDATED FINANCIAL STATEMENTS (CONTINUED)
2006 Annual Report 53
ExternalconsultantsmonitortheinvestmentstrategyandassetmixfortheCompany’splanassets .TodeveloptheCompany’sexpectedlong-termrateofreturnassumptiononplanassets, theCompanygenerallyuses long-termhistorical return information for thetargetedassetmixidentifiedinassetandliabilitystudies .Adjustmentsaremade to the expected long-termrateof returnassumptionwhendeemednecessarybaseduponrevisedexpectationsof futureinvestmentperformanceof theoverall investmentmarkets .Theexpected long-termrateofreturnassumptionused incomputing2006netperiodicpensioncostforthepensionplanswas7 .3% .
ContributionsandExpectedFutureBenefitPaymentsTheCompanyexpectstocontribute$31milliontothepensionplansand$6milliontothepostretirementbenefitplanduring2007 .
Thefollowingbenefitpayments,whichreflectexpectedfutureservice,areexpectedtobepaid:
Pension Postretirement Benefits Benefits (Inthousands)2007 . . . . . . . . . . . . . . . . . . . . . . . . . . . . . . . . . . . . . . . . . . . . . . $ 63,538 $ 5,9092008 . . . . . . . . . . . . . . . . . . . . . . . . . . . . . . . . . . . . . . . . . . . . . . 69,189 6,5672009 . . . . . . . . . . . . . . . . . . . . . . . . . . . . . . . . . . . . . . . . . . . . . . 73,489 7,4422010 . . . . . . . . . . . . . . . . . . . . . . . . . . . . . . . . . . . . . . . . . . . . . . 78,118 8,4562011 . . . . . . . . . . . . . . . . . . . . . . . . . . . . . . . . . . . . . . . . . . . . . . 82,527 9,5502012–2016 . . . . . . . . . . . . . . . . . . . . . . . . . . . . . . . . . . . . . . . 485,483 59,418
Note 13-Segment and Geographic InformationTheCompany isprincipallyengaged inprocuring, transporting,storing,processing,andmerchandisingagriculturalcommoditiesandproducts .TheCompany’soperationsareclassified into threereportablebusinesssegments:OilseedsProcessing,CornProcessing,andAgriculturalServices .Eachofthesesegmentsisorganizedbaseduponthenatureofproductsandservicesoffered .TheCompany’sremainingoperationsareaggregatedandclassifiedasOther .
TheOilseedsProcessing segment includesactivities related toprocessingoilseedssuchassoybeans,cottonseed,sunflowerseeds,canola, peanuts, and flaxseed into vegetable oils and mealsprincipallyforthefoodandfeedindustries .Inaddition,oilseedsmayberesoldintothemarketplaceasarawmaterialforotherprocessors .Crudevegetableoilissold“asis”orisfurtherprocessedbyrefining,bleaching,anddeodorizingintosaladoils .Saladoilscanbefurtherprocessedbyhydrogenatingand/orinteresterifyingintomargarine,
shortening,andother foodproducts .Partially refinedoil is soldforuseinchemicals,paints,andotherindustrialproducts .Refinedoilcanbefurtherprocessedforuseintheproductionofbiodiesel .Oilseedmealsareprimaryingredientsusedinthemanufactureofcommerciallivestockandpoultryfeeds .
TheCornProcessing segment includesactivities related to theproductionofsweeteners,starches,dextrose,andsyrupsforthefoodandbeverageindustryaswellasactivitiesrelatedtotheproduction,byfermentation,ofbioproductssuchasalcohol,aminoacids,andotherspecialtyfoodandfeedingredients .
TheAgriculturalServicessegmentutilizestheCompany’sextensivegrainelevatorandtransportationnetworktobuy,store,clean,andtransportagriculturalcommodities,suchasoilseeds,corn,wheat,milo,oats,andbarley,andresells thesecommoditiesprimarilyasfeedingredientsandasrawmaterialsfortheagriculturalprocessingindustry .AgriculturalServices’grainsourcingandtransportationnetworkprovidesreliableandefficient services to theCompany’sagriculturalprocessingoperations .Also included inAgriculturalServicesare theactivitiesofA .C .Toepfer International,aglobalmerchandiserofagriculturalcommoditiesandprocessedproducts .
Other includes theCompany’s remainingoperations,consistingprincipallyof foodand feed ingredientbusinessesand financialactivities . Food and feed ingredient businesses include WheatProcessingwithactivitiesrelatedtotheproductionofwheatflour;Cocoa Processing with activities related to the production ofchocolateandcocoaproducts; theproductionofnaturalhealthandnutritionproducts;andtheproductionofotherspecialty foodandfeedingredients .Financialactivities includebanking,captiveinsurance,privateequityfundinvestments,andfuturescommissionmerchantactivities .
Intersegmentsaleshavebeenrecordedatamountsapproximatingmarket .Operatingprofitforeachsegmentisbasedonnetsaleslessidentifiableoperatingexpenses,includinganinterestchargerelatedtoworkingcapitalusage .Alsoincludedinoperatingprofitaretherelatedequityinearningsofaffiliatesbasedontheequitymethodofaccounting .Generalcorporateexpenses, investment income,unallocated interestexpense,marketable securities transactions,andFIFOtoLIFOinventoryadjustmentshavebeenexcludedfromsegmentoperationsandclassifiedasCorporate .Grossadditionstoproperty,plant,andequipmentrepresentpurchasesofproperty,plant,andequipmentplusamountsallocatedtoproperty,plant,andequipmentrelatedtoacquiredbusinesses .
54 Archer Daniels Midland Company
NOTES TO CONSOLIDATED FINANCIAL STATEMENTS (CONTINUED)
SegmentInformation 2006 2005 2004 (Inthousands)Salestoexternalcustomers OilseedsProcessing . . . . . . . . . . . . . $11,866,895 $11,803,309 $12,049,250 CornProcessing . . . . . . . . . . . . . . . . 4,860,083 4,363,924 4,005,181 AgriculturalServices . . . . . . . . . . . . 15,439,567 15,198,831 15,638,341 Other . . . . . . . . . . . . . . . . . . . . . . . . 4,429,566 4,577,746 4,458,622 Total . . . . . . . . . . . . . . . . . . . . . . . . . $36,596,111 $35,943,810 $36,151,394
Intersegmentsales OilseedsProcessing . . . . . . . . . . . . . $ 151,019 $ 158,519 $ 178,056 CornProcessing . . . . . . . . . . . . . . . . 367,504 398,252 315,173 AgriculturalServices . . . . . . . . . . . . 1,207,426 1,084,477 2,192,090 Other . . . . . . . . . . . . . . . . . . . . . . . . 115,020 109,268 108,655 Total . . . . . . . . . . . . . . . . . . . . . . . . . $1,840,969 $ 1,750,516 $ 2,793,974
Netsales OilseedsProcessing . . . . . . . . . . . . . $12,017,914 $11,961,828 $12,227,306 CornProcessing . . . . . . . . . . . . . . . . 5,227,587 4,762,176 4,320,354 AgriculturalServices . . . . . . . . . . . . 16,646,993 16,283,308 17,830,431 Other . . . . . . . . . . . . . . . . . . . . . . . . 4,544,586 4,687,014 4,567,277 Intersegmentelimination . . . . . . . . (1,840,969) (1,750,516) (2,793,974) Total . . . . . . . . . . . . . . . . . . . . . . . . . $36,596,111 $35,943,810 $36,151,394
Interestexpense OilseedsProcessing . . . . . . . . . . . . . $ 84,698 $ 51,994 $ 36,942 CornProcessing . . . . . . . . . . . . . . . . 30,592 19,600 9,931 AgriculturalServices . . . . . . . . . . . . 68,111 42,620 43,424 Other . . . . . . . . . . . . . . . . . . . . . . . . 113,869 77,956 56,387 Corporate . . . . . . . . . . . . . . . . . . . . . 67,910 134,410 195,307 Total . . . . . . . . . . . . . . . . . . . . . . . . . $ 365,180 $ 326,580 $ 341,991
Depreciation OilseedsProcessing . . . . . . . . . . . . . $ 155,538 $ 162,290 $ 168,836 CornProcessing . . . . . . . . . . . . . . . . 264,853 265,419 268,968 AgriculturalServices . . . . . . . . . . . . 74,964 74,124 79,987 Other . . . . . . . . . . . . . . . . . . . . . . . . 137,295 139,502 144,625 Corporate . . . . . . . . . . . . . . . . . . . . . 24,064 23,317 23,197 Total . . . . . . . . . . . . . . . . . . . . . . . . . $ 656,714 $ 664,652 $ 685,613
Equityinearningsofaffiliates OilseedsProcessing . . . . . . . . . . . . . $ 61,174 $ 18,346 $ 30,475 CornProcessing . . . . . . . . . . . . . . . . 49,774 39,962 33,286 AgriculturalServices . . . . . . . . . . . . 18,571 17,879 12,359 Other . . . . . . . . . . . . . . . . . . . . . . . . 32,695 106,443 88,919 Corporate . . . . . . . . . . . . . . . . . . . . . 12,125 46,235 15,677 Total . . . . . . . . . . . . . . . . . . . . . . . . . $ 174,339 $ 228,865 $ 180,716
Operatingprofit OilseedsProcessing . . . . . . . . . . . . . $ 598,414 $ 344,654 $ 290,732 CornProcessing . . . . . . . . . . . . . . . . 877,358 530,233 660,947 AgriculturalServices . . . . . . . . . . . . 275,469 261,659 249,863 Other . . . . . . . . . . . . . . . . . . . . . . . . 309,949 414,394 359,469 Totaloperatingprofit . . . . . . . . . . . 2,061,190 1,550,940 1,561,011 Corporate . . . . . . . . . . . . . . . . . . . . . (205,940) (34,565) (843,000) Earningsbeforeincometaxes . . . . . $ 1,855,250 $ 1,516,375 $ 718,011
Investmentsinandadvancestoaffiliates OilseedsProcessing . . . . . . . . . . . . . $ 430,040 $ 356,124 CornProcessing . . . . . . . . . . . . . . . . 204,457 163,817 AgriculturalServices . . . . . . . . . . . . 231,026 207,805 Other . . . . . . . . . . . . . . . . . . . . . . . . 744,243 805,527 Corporate . . . . . . . . . . . . . . . . . . . . . 375,896 346,228 Total . . . . . . . . . . . . . . . . . . . . . . . . . $ 1,985,662 $ 1,879,501
2006 2005 2004 (Inthousands)
Identifiableassets OilseedsProcessing . . . . . . . . . . . . . $ 5,522,442 $ 5,169,644 CornProcessing . . . . . . . . . . . . . . . . 3,026,926 2,769,364 AgriculturalServices . . . . . . . . . . . . 3,246,816 2,912,294 Other . . . . . . . . . . . . . . . . . . . . . . . . 6,659,699 5,911,916 Corporate . . . . . . . . . . . . . . . . . . . . . 2,813,147 1,834,887 Total . . . . . . . . . . . . . . . . . . . . . . . . . $21,269,030 $18,598,105
Grossadditionstoproperty,plant,andequipment OilseedsProcessing . . . . . . . . . . . . . $ 215,861 $ 192,790 CornProcessing . . . . . . . . . . . . . . . . 313,365 263,483 AgriculturalServices . . . . . . . . . . . . 157,720 82,910 Other . . . . . . . . . . . . . . . . . . . . . . . . 140,330 93,211 Corporate . . . . . . . . . . . . . . . . . . . . . 13,293 14,984 Total . . . . . . . . . . . . . . . . . . . . . . . . . $ 840,569 $ 647,378
Geographic Information: The following geographic area dataincludenet salesandotheroperating incomeattributed to thecountriesbasedonthelocationofthesubsidiarymakingthesaleandlong-livedassetsbasedonphysical location .Long-livedassetsrepresent the sumof thenetbookvalueofproperty,plant,andequipmentplusgoodwillrelatedtoconsolidatedbusinesses .
2006 2005 2004 (Inthousands)Netsalesandotheroperatingincome UnitedStates . . . . . . . . . . . . . . . . . . $20,358,068 $19,450,145 $19,105,933 Germany . . . . . . . . . . . . . . . . . . . . . 5,396,228 5,990,702 6,108,079 Otherforeign . . . . . . . . . . . . . . . . . . 10,841,815 10,502,963 10,937,382 . . . . . . . . . . . . . . . . . . . . . . . . . . . . . . . . $36,596,111 $35,943,810 $36,151,394
Long-livedassets UnitedStates . . . . . . . . . . . . . . . . . . $ 3,975,424 $ 3,920,060 Foreign . . . . . . . . . . . . . . . . . . . . . . . 1,547,049 1,497,482 . . . . . . . . . . . . . . . . . . . . . . . . . . . . . . . . $ 5,522,473 $ 5,417,542
Note 14-GuaranteesTheCompanyhasenteredintoagreements,primarilydebtguaranteeagreementsrelatedtoequity-methodinvestees,whichcouldobligatetheCompanytomakefuturepaymentsiftheprimaryentityfailstoperformitscontractualobligation .TheCompanyhasnotrecordedaliabilityforpaymentofthesecontingentobligations,astheCompanybelievesthefairvalueofthesecontingentobligationsisimmaterial .TheCompanyhas collateral for aportionof these contingentobligations .These contingentobligations totaled$250millionat June30,2006 .Amountsoutstandingunder thesecontingentobligationswere$159millionatJune30,2006 .
Note 15-Antitrust Litigation SettlementIn2004,theCompanyenteredintoasettlementagreementrelatedtoaclassactionantitrustsuit involvingthesaleofhigh-fructosecornsyruppursuanttowhichtheCompanyaccrued$400million($252millionaftertax) .The$400millionwaspaidin2005 .
2006 Annual Report 55
MANAGEMENT’S REPORT ON INTERNAL CONTROL OVER FINANCIAL REPORTING
ArcherDanielsMidlandCompany’s(“ADM”)managementisresponsibleforestablishingandmaintainingadequateinternalcontroloverfinancialreporting,assuchtermisdefinedinExchangeActRules13a-15(f) .ADM’sinternalcontrolsystemisdesignedtoprovidereasonableassuranceregardingthereliabilityoffinancialreportingandthepreparationoffinancialstatementsinaccordancewithgenerallyacceptedaccountingprinciples .
Underthesupervisionandwiththeparticipationofmanagement,includingitsprincipalexecutiveofficerandprincipalfinancialofficer,ADM’smanagementassessed thedesignandoperatingeffectivenessof internalcontroloverfinancial reportingasofJune30,2006basedontheframeworksetforthinInternalControl-IntegratedFrameworkissuedbytheCommitteeofSponsoringOrganizationsoftheTreadwayCommission .
Basedon thisassessment,managementconcluded thatADM’s internalcontrolover financial reportingwaseffectiveasofJune30,2006 .Ernst&YoungLLP,anindependentregisteredpublicaccountingfirm,hasissuedanattestationreportonmanagement’sassessmentoftheCompany’sinternalcontroloverfinancialreportingasofJune30,2006 .Thatreportisincludedherein .
PatriciaA .Woertz DouglasJ .SchmalzChiefExecutiveOfficerandPresident SeniorVicePresident& ChiefFinancialOfficer
56 Archer Daniels Midland Company
REPORT OF INDEPENDENT REGISTERED PUBLIC ACCOUNTING FIRM
TheBoardofDirectorsandShareholdersArcherDanielsMidlandCompanyDecatur,Illinois
Wehaveaudited theaccompanyingconsolidatedbalancesheetsofArcherDanielsMidlandCompanyandsubsidiariesasofJune30,2006and2005,andtherelatedconsolidatedstatementsofearnings,shareholders’equity,andcashflowsforeachofthethreeyearsintheperiodendedJune30,2006 .ThesefinancialstatementsaretheresponsibilityoftheCompany’smanagement .Ourresponsibilityistoexpressanopiniononthesefinancialstatementsbasedonouraudits .
Weconductedouraudits inaccordancewiththestandardsof thePublicCompanyAccountingOversightBoard(UnitedStates) .Thosestandardsrequirethatweplanandperformtheaudittoobtainreasonableassuranceaboutwhetherthefinancialstatementsarefreeofmaterialmisstatement .Anauditincludesexamining,onatestbasis,evidencesupportingtheamountsanddisclosuresinthefinancialstatements .Anauditalsoincludesassessingtheaccountingprinciplesusedandsignificantestimatesmadebymanagement,aswellasevaluatingtheoverallfinancialstatementpresentation .Webelievethatourauditsprovideareasonablebasisforouropinion .
Inouropinion,thefinancialstatementsreferredtoabovepresentfairly,inallmaterialrespects,theconsolidatedfinancialpositionofArcherDanielsMidlandCompanyandsubsidiariesatJune30,2006and2005,andtheconsolidatedresultsoftheiroperationsandtheircashflowsforeachof the threeyears intheperiodendedJune30,2006, inconformitywithU .S .generallyacceptedaccountingprinciples .
Wealsohaveaudited,inaccordancewiththestandardsofthePublicCompanyAccountingOversightBoard(UnitedStates), theeffectivenessofArcherDanielsMidlandCompanyandsubsidiaries’internalcontroloverfinancialreportingasofJune30,2006,basedoncriteriaestablishedinInternalControl–IntegratedFrameworkissuedbytheCommitteeofSponsoringOrganizationsoftheTreadwayCommission,andourreportdatedSeptember1,2006,expressedanunqualifiedopinionthereon .
St .Louis,MissouriSeptember1,2006
2006 Annual Report 57
REPORT OF INDEPENDENT REGISTERED PUBLIC ACCOUNTING FIRM
TheBoardofDirectorsandShareholdersArcherDanielsMidlandCompanyDecatur,Illinois
Wehaveauditedmanagement’sassessment, includedintheaccompanyingManagement’sReporton InternalControlOverFinancialReporting,thatArcherDanielsMidlandCompanyandsubsidiariesmaintainedeffectiveinternalcontroloverfinancialreportingasofJune30,2006,basedoncriteriaestablishedinInternalControl–IntegratedFrameworkissuedbytheCommitteeofSponsoringOrganizationsoftheTreadwayCommission(theCOSOcriteria) .ArcherDanielsMidlandCompany’smanagementisresponsibleformaintainingeffectiveinternalcontroloverfinancialreportingandforitsassessmentoftheeffectivenessofinternalcontroloverfinancialreporting .Ourresponsibilityistoexpressanopiniononmanagement’sassessmentandanopinionontheeffectivenessoftheCompany’sinternalcontroloverfinancialreportingbasedonouraudit .
WeconductedourauditinaccordancewiththestandardsofthePublicCompanyAccountingOversightBoard(UnitedStates) .Thosestandardsrequirethatweplanandperformtheaudittoobtainreasonableassuranceaboutwhethereffectiveinternalcontroloverfinancialreportingwasmaintainedinallmaterialrespects .Ourauditincludedobtaininganunderstandingofinternalcontroloverfinancialreporting,evaluatingmanagement’sassessment,testingandevaluatingthedesignandoperatingeffectivenessofinternalcontrol,andperformingsuchotherproceduresasweconsiderednecessaryinthecircumstances .Webelievethatourauditprovidesareasonablebasisforouropinion .
Acompany’sinternalcontroloverfinancialreportingisaprocessdesignedtoprovidereasonableassuranceregardingthereliabilityoffinancialreportingandthepreparationoffinancialstatements forexternalpurposes inaccordancewithgenerallyacceptedaccountingprinciples .Acompany’sinternalcontroloverfinancialreportingincludesthosepoliciesandproceduresthat(1)pertaintothemaintenanceofrecordsthat,inreasonabledetail,accuratelyandfairlyreflectthetransactionsanddispositionsoftheassetsofthecompany;(2)providereasonableassurancethattransactionsarerecordedasnecessarytopermitpreparationoffinancialstatementsinaccordancewithgenerallyacceptedaccountingprinciples,andthatreceiptsandexpendituresofthecompanyarebeingmadeonlyinaccordancewithauthorizationsofmanagementanddirectorsofthecompany;and(3)providereasonableassuranceregardingpreventionortimelydetectionofunauthorizedacquisition,use,ordispositionofthecompany’sassetsthatcouldhaveamaterialeffectonthefinancialstatements .
Becauseofitsinherentlimitations,internalcontroloverfinancialreportingmaynotpreventordetectmisstatements .Also,projectionsofanyevaluationofeffectivenesstofutureperiodsaresubjecttotheriskthatcontrolsmaybecomeinadequatebecauseofchangesinconditionsorthatthedegreeofcompliancewiththepoliciesorproceduresmaydeteriorate .
Inouropinion,management’sassessmentthatArcherDanielsMidlandCompanyandsubsidiariesmaintainedeffectiveinternalcontroloverfinancialreportingasofJune30,2006,is fairlystated,inallmaterialrespects,basedontheCOSOcriteria .Also,inouropinion,ArcherDanielsMidlandCompanyandsubsidiariesmaintained,inallmaterialrespects,effectiveinternalcontroloverfinancialreportingasofJune30,2006,basedontheCOSOcriteria .
Wealsohaveaudited, inaccordancewith thestandardsof thePublicCompanyAccountingOversightBoard(UnitedStates),theconsolidatedbalancesheetsofArcherDanielsMidlandCompanyandsubsidiariesasof June30,2006and2005,and therelatedconsolidatedstatementsofearnings,shareholders’equity,andcashflowsforeachof thethreeyearsintheperiodendedJune30,2006,ofArcherDanielsMidlandCompanyandsubsidiaries,andourreportdatedSeptember1,2006,expressedanunqualifiedopinionthereon .
St .Louis,MissouriSeptember1,2006
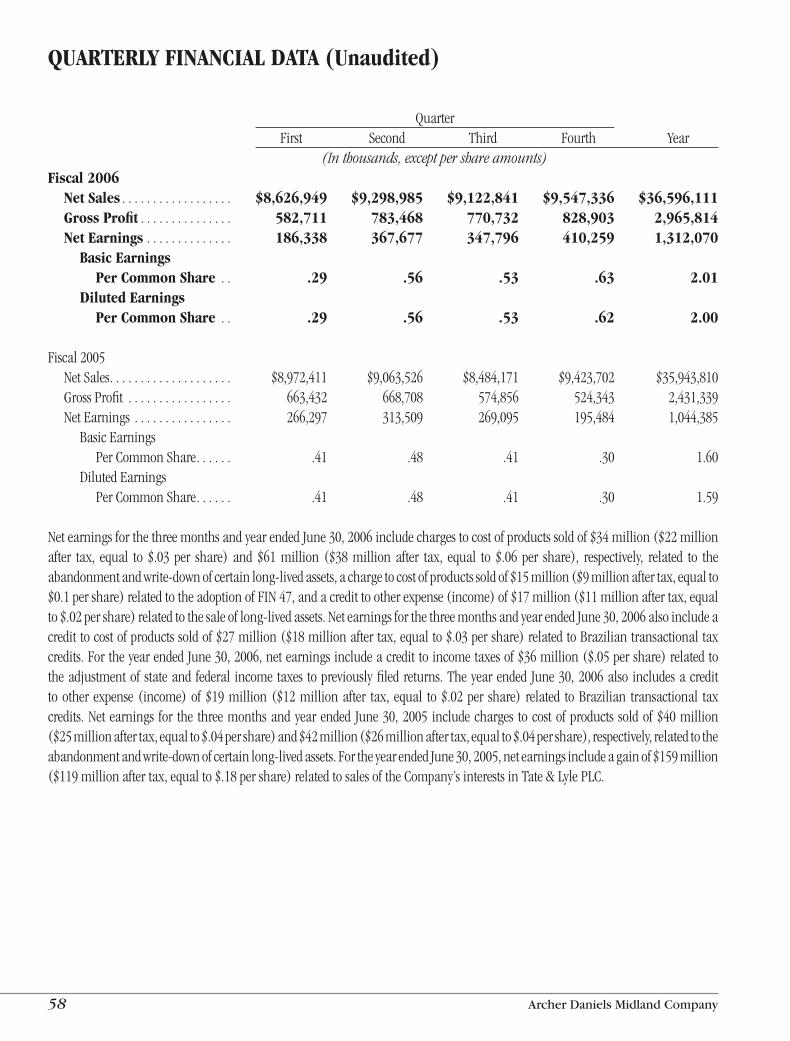
58 Archer Daniels Midland Company
QUARTERLY FINANCIAL DATA (Unaudited)
Quarter First Second Third Fourth Year (Inthousands,exceptpershareamounts)Fiscal 2006 Net Sales . . . . . . . . . . . . . . . . . . $8,626,949 $9,298,985 $9,122,841 $9,547,336 $36,596,111 Gross Profit . . . . . . . . . . . . . . . 582,711 783,468 770,732 828,903 2,965,814 Net Earnings . . . . . . . . . . . . . . 186,338 367,677 347,796 410,259 1,312,070 Basic Earnings Per Common Share . . .29 .56 .53 .63 2.01 Diluted Earnings Per Common Share . . .29 .56 .53 .62 2.00
Fiscal2005 NetSales . . . . . . . . . . . . . . . . . . . . $8,972,411 $9,063,526 $8,484,171 $9,423,702 $35,943,810 GrossProfit . . . . . . . . . . . . . . . . . 663,432 668,708 574,856 524,343 2,431,339 NetEarnings . . . . . . . . . . . . . . . . 266,297 313,509 269,095 195,484 1,044,385 BasicEarnings PerCommonShare . . . . . . .41 .48 .41 .30 1 .60 DilutedEarnings PerCommonShare . . . . . . .41 .48 .41 .30 1 .59
NetearningsforthethreemonthsandyearendedJune30,2006includechargestocostofproductssoldof$34million($22millionafter tax, equal to $ .03 per share) and $61 million ($38 million after tax, equal to $ .06 per share), respectively, related to theabandonmentandwrite-downofcertainlong-livedassets,achargetocostofproductssoldof$15million($9millionaftertax,equalto$0 .1pershare)relatedtotheadoptionofFIN47,andacredittootherexpense(income)of$17million($11millionaftertax,equalto$ .02pershare)relatedtothesaleoflong-livedassets .NetearningsforthethreemonthsandyearendedJune30,2006alsoincludeacredittocostofproductssoldof$27million($18millionaftertax,equalto$ .03pershare)relatedtoBraziliantransactionaltaxcredits .FortheyearendedJune30,2006,netearningsincludeacredittoincometaxesof$36million($ .05pershare)relatedtotheadjustmentof stateand federal incometaxes topreviouslyfiledreturns .Theyearended June30,2006also includesacredittoother expense (income)of$19million ($12millionafter tax, equal to$ .02per share) related toBrazilian transactional taxcredits .Netearnings for the threemonthsandyearended June30,2005 includecharges tocostofproducts soldof$40million($25millionaftertax,equalto$ .04pershare)and$42million($26millionaftertax,equalto$ .04pershare),respectively,relatedtotheabandonmentandwrite-downofcertainlong-livedassets .FortheyearendedJune30,2005,netearningsincludeagainof$159million($119millionaftertax,equalto$ .18pershare)relatedtosalesoftheCompany’sinterestsinTate&LylePLC .
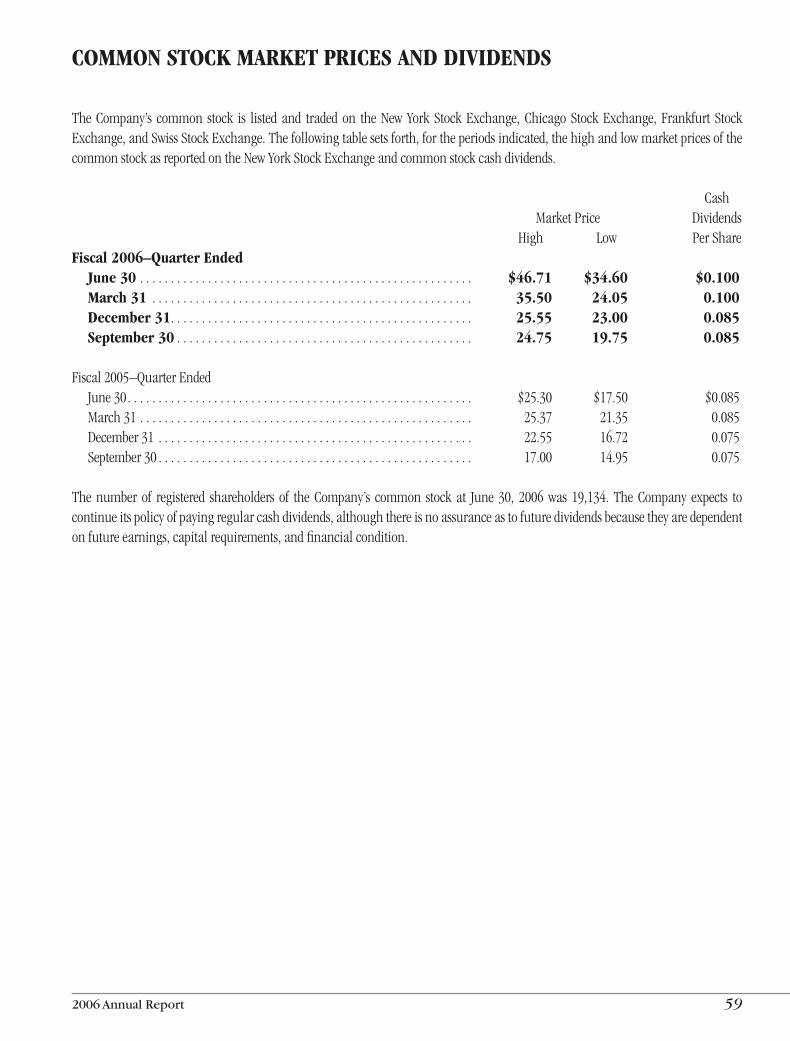
2006 Annual Report 59
COMMON STOCK MARKET PRICES AND DIVIDENDS
The Company’s common stock is listed and traded on the New York Stock Exchange, Chicago Stock Exchange, Frankfurt StockExchange,andSwissStockExchange .Thefollowingtablesetsforth,fortheperiodsindicated,thehighandlowmarketpricesofthecommonstockasreportedontheNewYorkStockExchangeandcommonstockcashdividends .
Cash MarketPrice Dividends High Low PerShareFiscal 2006–Quarter Ended June 30 . . . . . . . . . . . . . . . . . . . . . . . . . . . . . . . . . . . . . . . . . . . . . . . . . . . . . . $46.71 $34.60 $0.100 March 31 . . . . . . . . . . . . . . . . . . . . . . . . . . . . . . . . . . . . . . . . . . . . . . . . . . . . 35.50 24.05 0.100 December 31 . . . . . . . . . . . . . . . . . . . . . . . . . . . . . . . . . . . . . . . . . . . . . . . . . 25.55 23.00 0.085 September 30 . . . . . . . . . . . . . . . . . . . . . . . . . . . . . . . . . . . . . . . . . . . . . . . . 24.75 19.75 0.085
Fiscal2005–QuarterEnded June30 . . . . . . . . . . . . . . . . . . . . . . . . . . . . . . . . . . . . . . . . . . . . . . . . . . . . . . . . $25 .30 $17 .50 $0 .085 March31 . . . . . . . . . . . . . . . . . . . . . . . . . . . . . . . . . . . . . . . . . . . . . . . . . . . . . . 25 .37 21 .35 0 .085 December31 . . . . . . . . . . . . . . . . . . . . . . . . . . . . . . . . . . . . . . . . . . . . . . . . . . . 22 .55 16 .72 0 .075 September30 . . . . . . . . . . . . . . . . . . . . . . . . . . . . . . . . . . . . . . . . . . . . . . . . . . . 17 .00 14 .95 0 .075
The number of registered shareholders of the Company’s common stock at June 30, 2006 was 19,134 . The Company expects tocontinueitspolicyofpayingregularcashdividends,althoughthereisnoassuranceastofuturedividendsbecausetheyaredependentonfutureearnings,capitalrequirements,andfinancialcondition .
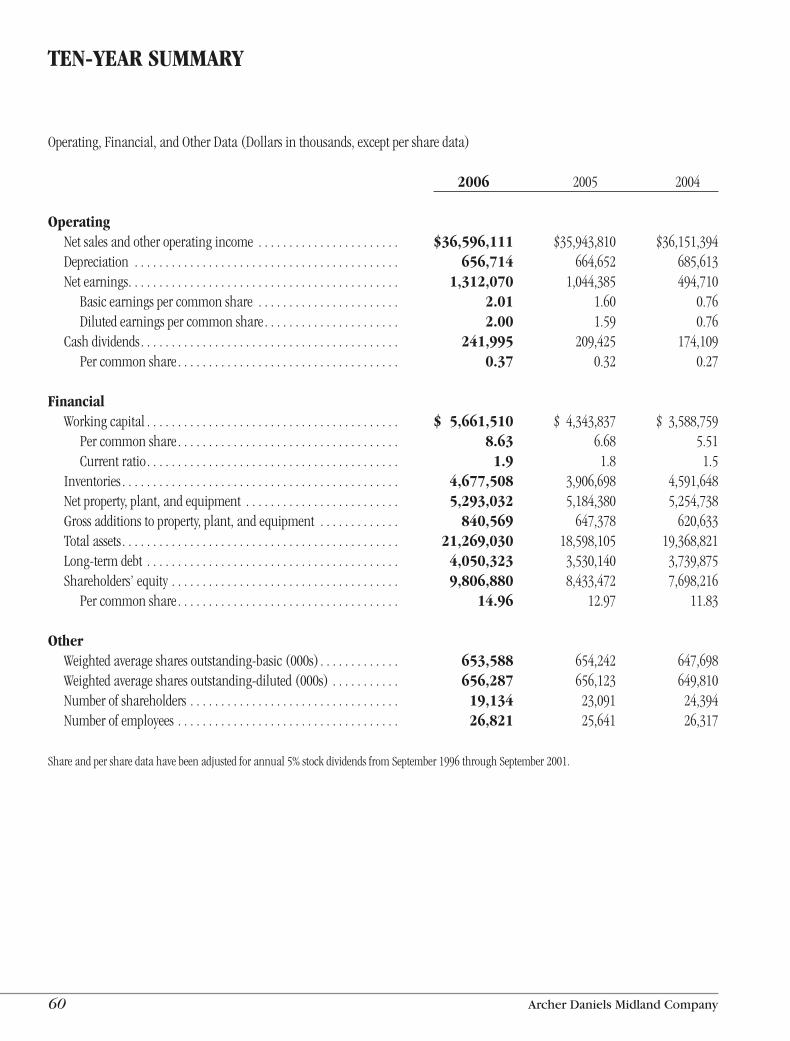
60 Archer Daniels Midland Company
TEN-YEAR SUMMARY
Operating,Financial,andOtherData(Dollarsinthousands,exceptpersharedata)
2006 2005 2004
Operating Netsalesandotheroperatingincome . . . . . . . . . . . . . . . . . . . . . . . $36,596,111 $35,943,810 $36,151,394 Depreciation . . . . . . . . . . . . . . . . . . . . . . . . . . . . . . . . . . . . . . . . . . . 656,714 664,652 685,613 Netearnings . . . . . . . . . . . . . . . . . . . . . . . . . . . . . . . . . . . . . . . . . . . . 1,312,070 1,044,385 494,710 Basicearningspercommonshare . . . . . . . . . . . . . . . . . . . . . . . 2.01 1 .60 0 .76 Dilutedearningspercommonshare . . . . . . . . . . . . . . . . . . . . . . 2.00 1 .59 0 .76 Cashdividends . . . . . . . . . . . . . . . . . . . . . . . . . . . . . . . . . . . . . . . . . . 241,995 209,425 174,109 Percommonshare . . . . . . . . . . . . . . . . . . . . . . . . . . . . . . . . . . . . 0.37 0 .32 0 .27
Financial Workingcapital . . . . . . . . . . . . . . . . . . . . . . . . . . . . . . . . . . . . . . . . . $ 5,661,510 $ 4,343,837 $ 3,588,759 Percommonshare . . . . . . . . . . . . . . . . . . . . . . . . . . . . . . . . . . . . 8.63 6 .68 5 .51 Currentratio . . . . . . . . . . . . . . . . . . . . . . . . . . . . . . . . . . . . . . . . . 1.9 1 .8 1 .5 Inventories . . . . . . . . . . . . . . . . . . . . . . . . . . . . . . . . . . . . . . . . . . . . . 4,677,508 3,906,698 4,591,648 Netproperty,plant,andequipment . . . . . . . . . . . . . . . . . . . . . . . . . 5,293,032 5,184,380 5,254,738 Grossadditionstoproperty,plant,andequipment . . . . . . . . . . . . . 840,569 647,378 620,633 Totalassets . . . . . . . . . . . . . . . . . . . . . . . . . . . . . . . . . . . . . . . . . . . . . 21,269,030 18,598,105 19,368,821 Long-termdebt . . . . . . . . . . . . . . . . . . . . . . . . . . . . . . . . . . . . . . . . . 4,050,323 3,530,140 3,739,875 Shareholders’equity . . . . . . . . . . . . . . . . . . . . . . . . . . . . . . . . . . . . . 9,806,880 8,433,472 7,698,216 Percommonshare . . . . . . . . . . . . . . . . . . . . . . . . . . . . . . . . . . . . 14.96 12 .97 11 .83
Other Weightedaveragesharesoutstanding-basic(000s) . . . . . . . . . . . . . 653,588 654,242 647,698 Weightedaveragesharesoutstanding-diluted(000s) . . . . . . . . . . . 656,287 656,123 649,810 Numberofshareholders . . . . . . . . . . . . . . . . . . . . . . . . . . . . . . . . . . 19,134 23,091 24,394 Numberofemployees . . . . . . . . . . . . . . . . . . . . . . . . . . . . . . . . . . . . 26,821 25,641 26,317
Shareandpersharedatahavebeenadjustedforannual5%stockdividendsfromSeptember1996throughSeptember2001 .
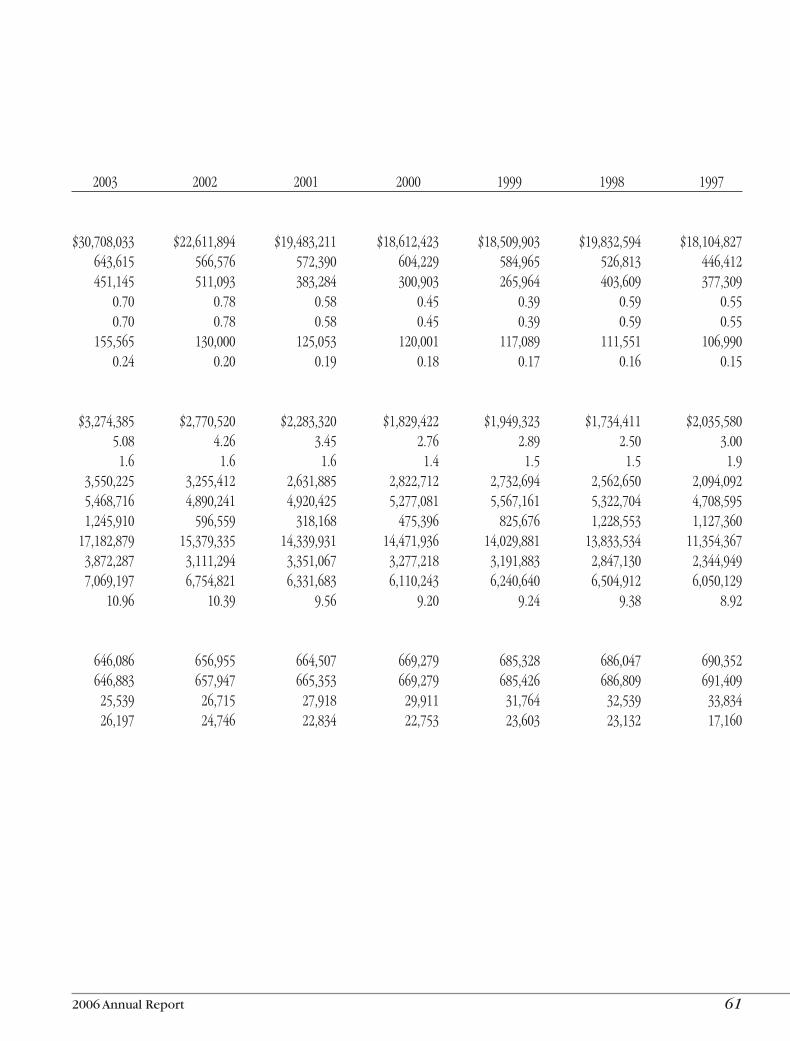
2006 Annual Report 6�
2003 2002 2001 2000 1999 1998 1997
$30,708,033 $22,611,894 $19,483,211 $18,612,423 $18,509,903 $19,832,594 $18,104,827 643,615 566,576 572,390 604,229 584,965 526,813 446,412 451,145 511,093 383,284 300,903 265,964 403,609 377,309 0 .70 0 .78 0 .58 0 .45 0 .39 0 .59 0 .55 0 .70 0 .78 0 .58 0 .45 0 .39 0 .59 0 .55 155,565 130,000 125,053 120,001 117,089 111,551 106,990 0 .24 0 .20 0 .19 0 .18 0 .17 0 .16 0 .15
$3,274,385 $2,770,520 $2,283,320 $1,829,422 $1,949,323 $1,734,411 $2,035,580 5 .08 4 .26 3 .45 2 .76 2 .89 2 .50 3 .00 1 .6 1 .6 1 .6 1 .4 1 .5 1 .5 1 .9 3,550,225 3,255,412 2,631,885 2,822,712 2,732,694 2,562,650 2,094,092 5,468,716 4,890,241 4,920,425 5,277,081 5,567,161 5,322,704 4,708,595 1,245,910 596,559 318,168 475,396 825,676 1,228,553 1,127,360 17,182,879 15,379,335 14,339,931 14,471,936 14,029,881 13,833,534 11,354,367 3,872,287 3,111,294 3,351,067 3,277,218 3,191,883 2,847,130 2,344,949 7,069,197 6,754,821 6,331,683 6,110,243 6,240,640 6,504,912 6,050,129 10 .96 10 .39 9 .56 9 .20 9 .24 9 .38 8 .92
646,086 656,955 664,507 669,279 685,328 686,047 690,352 646,883 657,947 665,353 669,279 685,426 686,809 691,409 25,539 26,715 27,918 29,911 31,764 32,539 33,834 26,197 24,746 22,834 22,753 23,603 23,132 17,160

1516123 Test2.indd 88/24/06 1:51:12 PM
62 Archer Daniels Midland Company
G. Allen Andreas Chairman
Mr .Andreas,63,joinedADMin1973andservedinbothdomesticandinternationalpositionsbeforebeingnamedPresidentandChiefExecutivein1997 .HewasfirstelectedaDirectorin1997andwasnamedChairmanin1999 .Mr .AndreaschairstheExecutiveCommittee .
Alan L. Boeckmann ChairmanandChiefExecutiveOfficerofFluorCorporation(anengineeringandconstructionfirm)
Mr .Boeckmann,58,isalsoaDirectorofBurlingtonNorthernSantaFeCorporation .HejoinedADM’sBoardin2004 .Mr .BoeckmannchairstheCompensation/SuccessionCommitteeandservesontheAuditCommittee .
Mollie Hale Carter Chairman,ChiefExecutiveOfficerandPresident,SunflowerBankandVicePresident,StarA,Inc.(afarmingandranchingoperation)
Ms .Carter,44,joinedADM’sBoardin1996andisalsoaDirectorofWestarEnergy .SheservesontheCompensation/SuccessionandNominating/CorporateGovernanceCommittees .
Roger S. Joslin FormerViceChairmanofStateFarmMutualAutomobileInsuranceCompany
Mr .Joslin,70,servesontheBoardofDirectorsofAmlin,plc .HejoinedADM’sBoardin2001andservesontheAuditandCompensation/SuccessionCommittees .
Antonio Maciel Neto ChiefExecutiveOfficerandPresident,SuzanoPapeleCelulose(aBrazilianproducerofpaperandpulpproducts)
Mr .Maciel,49,joinedADM’sBoardin2006 .HeservesontheCompensation/SuccessionandNominating/CorporateGovernanceCommittees .
D I R E C T O R S

2006 Annual Report 63
Patrick J. Moore ChairmanandChiefExecutiveOfficerofSmurfit-StoneContainerCorporation(aproducerofpaperboardandpaper-basedpackagingproducts)
Mr .Moore,52,joinedADM’sBoardin2003 .Mr .MooreservesontheAudit,ExecutiveandNominating/CorporateGovernanceCommittees .
M. Brian Mulroney SeniorPartner,OgilvyRenault(alawfirm)
Mr .Mulroney,67,isalsoaDirectorofBarrickGoldCorporation,TrizecPropertiesInc .,CendantCorporation,Quebecor,Inc .andQuebecorWorld,Inc .Mr .MulroneyformerlyservedasPrimeMinisterofCanada .HejoinedADM’sBoardin1993andservesontheExecutiveCommittee .
Thomas F. O’Neill PrincipalofSandlerO’Neill&Partners,L.P.(aninvestmentbankingfirm)
Mr .O’Neill,59,isalsoaDirectorofboththeNASDAQStockMarket,Inc .andMisonix,Inc .HejoinedADM’sBoardin2004 .Mr .O’NeillchairstheAuditCommitteeandservesontheNominating/CorporateGovernanceCommittee .
O. Glenn Webb Farmer
Mr .Webb,70,istheretiredChairmanoftheBoardandPresidentofGROWMARK,Inc .,afarmer-ownedcooperative .HejoinedADM’sBoardin1991 .HeistheLeadDirectorandservesontheCompensation/SuccessionandExecutiveCommittees .
Patricia A. Woertz ChiefExecutiveOfficerandPresident
Ms .Woertz,53,joinedADMin2006asChiefExecutiveOfficerandPresidentandamemberoftheBoardofDirectors .SheservesontheExecutiveCommittee .
Kelvin R. Westbrook PresidentandChiefExecutiveOfficerofMillenniumDigitalMedia,LLC(abroadbandservicescompany)
Mr .Westbrook,51,isalsoaDirectorofAngelicaCorporation .HejoinedADM’sBoardin2003 .Mr .WestbrookchairstheNominating/CorporateGovernanceCommitteeandservesontheCompensation/SuccessionCommittee .
64 Archer Daniels Midland Company
CORPORATE OFFICERS
Patricia A. Woertz ChiefExecutiveOfficerandPresident
David J. Smith ExecutiveVicePresident,SecretaryandGeneralCounsel
William H. Camp ExecutiveVicePresident(GlobalProcessing)
John D. Rice ExecutiveVicePresident(GlobalMarketingandRiskManagement)
Lewis W. Batchelder SeniorVicePresident(AgriculturalServices)
Edward A. Harjehausen SeniorVicePresident(CornMilling,BioProductsandFeed)
Brian F. Peterson SeniorVicePresident(CorporateAffairs)
Douglas J. Schmalz SeniorVicePresidentandChiefFinancialOfficer
Margaret M. Loebl GroupVicePresident(Finance)
Steven R. Mills GroupVicePresidentandController
Raymond V. Preiksaitis GroupVicePresident(InformationTechnologies)
Mark Bemis VicePresident(CocoaOperations)
J. Kevin Burgard VicePresident(SpecialtyFoodIngredients)
Mark J. Cheviron VicePresident(SecurityandCorporateServices)
Craig A. Fischer VicePresident(WheatProcessing)
Dennis C. Garceau VicePresident(ManufacturingandTechnicalServices)
Shannon Herzfeld VicePresident(GovernmentRelations)
Craig E. Huss VicePresident(TransportationandLogistics)
Matthew J. Jansen VicePresident(GrainGroup)
Michael Lusk VicePresident(InsuranceandRiskManagement)
Vikram Luthar VicePresident-Treasurer
Randy Moon VicePresident(HumanResources)
Dennis Riddle VicePresident(CornProcessing)
Kenneth A. Robinson VicePresident(CommodityRiskManagement)
Ismael Roig VicePresident(PlanningandBusinessDevelopment)
Scott A. Roney VicePresident(ComplianceandEthics)
A. James Shafter VicePresidentandAssistantGeneralCounsel
Stephen Yu VicePresident(Asia-PacificOperations)
Mark Zenuk VicePresident(EuropeanandAsianOperations)
Ronald S. Bandler AssistantTreasurer
Scott A. Roberts AssistantSecretaryandAssistantGeneralCounsel
Marc A. Sanner AssistantController
Phone NumberInvestor Relations: 217/424-4647
Internetwww.admworld.com
Copies of the Company’s annual report to the Securities and Exchange Commission on Form 10-K will be available to shareholders without charge upon written request to the Investor Relations Department.
Archer Daniels Midland Company is an equal opportunity employer.
Executive CertificationsThe Company’s 2006 Annual Report on Form 10-K filed with the Securities and Exchange Commission includes, as Exhibit 31, certifications of the Company’s Chief Executive Officer and Chief Financial Officer as required by Section 302 of the Sarbanes-Oxley Act of 2002. On November 11, 2005, the Company submitted to the New York Stock Exchange (NYSE) a certificate of the Chief Executive Officer certifying that he is not aware of any violation by the Company of the NYSE corporate governance listing standards.
Stock ExchangesArcher Daniels Midland Company Common Stock is listed and traded on the New York Stock Exchange, Chicago Stock Exchange, Frankfurt Stock Exchange and the Swiss Stock Exchange. Ticker symbol: ADM.
Transfer Agent and RegistrarHickory Point Bank and Trust, fsb1099 W. Wood St., Suite GDecatur, IL 62522888/740-5512
Independent AuditorsErnst & Young LLP, St. Louis, MO
Notice of Annual MeetingThe Annual Meeting of Shareholders of the Company will be held at the James R. Randall Research Center at 1001 Brush College Road on November 2, 2006, commencing at 11:00 a.m. The Annual Meeting of Shareholders will be Webcast live: http://www.admworld.com/AnnualMeeting/. Proxies will be requested by Management on or about September 22, 2006 at which time a Proxy Statement and Form of Proxy will be sent to Shareholders.
Mailing AddressArcher Daniels Midland CompanyP. O. Box 1470Decatur, IL 62525U.S.A.
Safe Harbor Statement
The annual report contains forward-looking information that is subject to certain risk and uncertainties that could cause actual results to differ materially from those projected, expressed, or implied by such forward-looking information. In some cases, you can identify forward-looking statements by our use of words such as “may, will, should, anticipates, believes, expects, plans, future, intends, could, estimate, predict, potential or contingent,” the negative of these terms or other similar expressions. The Company’s actual results could differ materially from those discussed or implied herein. Factors that could cause or contribute to such differences include, but are not limited to, those discussed in the Company’s Form 10-K for the fiscal year ended June 30, 2006. Among these risks are legislative acts, changes in the prices of food, feed and other commodities, including gasoline, and macroeconomic conditions in various parts of the world. To the extent permitted under applicable law, the Company assumes no obligation to update any forward-looking statements as a result of new information or future events.
STOCKHOLDER INFORMATION
Design: Creative Design Board, Chicago, IL