35
Admin Data Analysis Updated Summer 2012

Admin Data Analysis
Updated Summer 2012

Administrator Data Analysis Table of Contents
Data Analysis Quick Views ......................................................................................................................................................... 1 Create a New Data View ..................................................................................................................................... 2 Time Frame ......................................................................................................................................................... 4 Sorting a Column ................................................................................................................................................. 4 Drilling Down ........................................................................................................................................................ 4 Coloring ............................................................................................................................................................... 5 Data Pivot ............................................................................................................................................................ 5 Levels ................................................................................................................................................................ 6 Printing ................................................................................................................................................................ 6 Charting Charting Test Data ........................................................................................................................................ 7 Labeling, Printing, and Saving a Chart ......................................................................................................... 8 Auto Summarizing Tests ..................................................................................................................................... 9 Editing a View .................................................................................................................................................... 10 Tables Tab .................................................................................................................................................. 10 Columns Tab ............................................................................................................................................... 11 Summarize Tab ........................................................................................................................................... 12 Viewing a Subgroup within a Subpopulation ........................................................................................ 12 Viewing Summarized Fields as Numbers instead of Percentages ....................................................... 13 Saving a View .................................................................................................................................................... 14 Sharing Options ................................................................................................................................................. 15 Sharing a Template ..................................................................................................................................... 15 Sending a View ........................................................................................................................................... 16 Viewing a Sent View ............................................................................................................................. 17 Managing Views ................................................................................................................................................ 17 Editing or Deleting a View ........................................................................................................................... 17 Student Profile ................................................................................................................................................... 18 General Tab ................................................................................................................................................ 18 Tests & Scores Tab ..................................................................................................................................... 19 Show All Tests ...................................................................................................................................... 19 Test Details ........................................................................................................................................... 19 Forms Tab ................................................................................................................................................... 20 Journal Tab ................................................................................................................................................. 20 Reports .............................................................................................................................................................. 21 Monitor Groups/Lists Creating a Group ............................................................................................................................................... 22 Managing Groups .............................................................................................................................................. 24 Approving Monitor Lists ..................................................................................................................................... 24 Advanced Analysis Average/Subject/Cohorts/Longitudinal .............................................................................................................. 25 Average Tests ............................................................................................................................................. 26 Summarize by Subject ................................................................................................................................ 26 Cohorts ........................................................................................................................................................ 27 Longitudinal Data ........................................................................................................................................ 28 Vertical Views .................................................................................................................................................... 29 Summarizing on Monitor Groups/Student Interventions .................................................................................... 30 Data Analysis Field Glossary .................................................................................................................. Appendix A

Page 1 eduphoria! No content or materials demonstrating the usage of eduphoria! SchoolObjects may be posted or displayed on any external website or public domain.
Data Analysis
District and Campus Data Viewers have many options when viewing tests, and these options help facilitate more in-depth data viewing. This section covers the basics of viewing data and how to analyze the information more effectively and efficiently. Administrators can view data in two ways:
Quick Views – select from a list of pre-made templates
Create a New Data View – build a customized view from scratch
QUICK VIEWS
Data can be accessed quickly and easily by choosing a test from Quick Views.
Click Quick Views to see the list of available test options
Expand a test type, year, grade level, and subject to view the test data
Click on the drop-down menu to choose a preexisting template
The template will be applied to the selected test
**If district or campus level personnel have shared templates, they will appear in the list of available templates.
(Upper-right corner of the screen)

Page 2 eduphoria! No content or materials demonstrating the usage of eduphoria! SchoolObjects may be posted or displayed on any external website or public domain.
CREATE A NEW DATA VIEW
Creating a new data view is best used when needing to view multiple tests. The process of selecting the tests in the wizard can be faster than editing a preexisting view.
Click Create a New Data View, located in the lower-left corner of the screen
Click Next
Choose the test type, grade/test level, year, or subject to filter for only those tests
Select the test(s) from the list of available tests
Click Next
Choose the level – the way the results will be displayed
Individual Student Results District Averages Campus Averages Teacher Averages
Choose a time frame (refer to the section titled TIME FRAME for explanation)

Page 3 eduphoria! No content or materials demonstrating the usage of eduphoria! SchoolObjects may be posted or displayed on any external website or public domain.
Choose an option that best reflects the data to view (Explanations appear below.)
**Optional step
Click Next
Student Scores
Raw score
Scale score
Vertical Scale Score
Percent score
Met expectations
Commended performance
TAKS Objectives
Objectives – % score
Raw score
Scale score
Vertical Scale Score
Percent score
Met expectations
Commended performance
TEKS Student Expectations
SE – % score
Raw score
Scale score
Vertical Scale Score
Percent score
Met expectations
Commended performance
Student Responses/
Item Analysis
Shows percent correct/incorrect for each question/ objective/SE
Raw score
Scale score
Percent score
Met expectations
Commended performance
Select one or more demographics to summarize. The data will be displayed in rows.
**Optional step
Click Next
Click View My Report

Page 4 eduphoria! No content or materials demonstrating the usage of eduphoria! SchoolObjects may be posted or displayed on any external website or public domain.
TIME FRAME
Results can be viewed in one of two ways: by where students are currently enrolled or by where they were when they were tested.
The default time frame for a test is Where Students Are Now. To see where students were administered a test, click on the Where They Were icon.
SORTING A COLUMN
To help facilitate data analysis, information can be sorted in ascending or descending order.
To sort a column in ascending order, click on the column heading. To sort in descending order, click on the column heading again. **To sort within a sort, click on the first column to sort, and then click on the second column.
DRILLING DOWN
Drilling down on data will display the results for a particular group.
To view results for students grouped together on a view, double-click on the row title in the blue area of the screen. Drilling down on a student will display the student‟s profile. In the example to the right, double-clicking on „Hispanic‟ will display the Hispanic students for Blue Elementary that took this test. **Click the left green arrow to go “back” a level. (upper-left corner of the screen)
Where Students Are Now: Displays students based on where they are currently enrolled
Where Students Were Administered Test: Displays results based on where the students were enrolled at the time they were administered the test

Page 5 eduphoria! No content or materials demonstrating the usage of eduphoria! SchoolObjects may be posted or displayed on any external website or public domain.
COLORING
Test data can be color coded to make data stand out and examine trends.
To view color coding, click the Color Results icon in the upper-left corner. The data will be color coded according to the following scale: 90-100 = Green >2400 = Green 80-89 = Yellow 2201-2399 = Yellow 76-79 = Orange 2100-2200 = Orange <76 = Red <2100 = Red
To view color comparisons across multiple tests, click the Color By Comparison icon in the upper-left corner. When comparing across tests, the following logic applies from left to right:
Green = Score goes up
Red = Score goes down
Yellow = Score stays the same Note: When adding tests to the Tables test, order the tests chronologically to see the progression.
DATA PIVOT
Data pivoting allows data to be viewed not only within a group, but also vertically across tests.
When a test is initially viewed, by default it will be displayed across groups. Click the Compare Across Tests icon in the upper-left corner to flip the column titles so that the titles are viewed across tests. To compare across groups again, click the Compare Across Groups icon and the view will change back.

Page 6 eduphoria! No content or materials demonstrating the usage of eduphoria! SchoolObjects may be posted or displayed on any external website or public domain.
LEVELS
By changing the level, data can be viewed from different perspectives.
Toggle between different levels by clicking on separate icons.
PRINTING
Any data view can be exported to Excel or PDF file format.
Click the Print icon and choose:
Export to Excel
Export to PDF **When viewing a district assessment, an additional printing option titled Test Summary Report exists. The report lists test results for your district and campus.
District Summary View
Course/Section Summary View
Campus Summary View
Teacher Summary View
Individual Student View

Page 7 eduphoria! No content or materials demonstrating the usage of eduphoria! SchoolObjects may be posted or displayed on any external website or public domain.
CHARTING
The charting feature allows you to save a chart as an image, print in color, and generate smart charts. Smart charting will automatically chart information as a bar or line graph when applicable and will auto adjust the scale on the chart according to the values being graphed. Another smart charting enhancement is the ability to chart demographic data across campuses or teachers when comparing multiple campuses or teachers. Notes:
Only group data can be graphed. Group data includes results displayed at the district, campus, and teacher levels.
If only one campus or teacher is displayed, smart charting will chart within the campus. For example, if charting ethnicity, the ethnicities for that one campus will be compared.
Charting Test Data
Select a test
Remain on campus level, or switch to district or teacher level
Click the Charts icon, located in the upper-right corner of the screen (below the Log off button)
Click on the number in the column to chart
Example #1: To compare the teachers‟ scale scores, click on the actual scale score in the same row as the teacher‟s name to view a teacher comparison. Example #2: To compare the economically disadvantaged students‟ scale scores across teachers, click on the scale score in the economic disadvantaged row. A comparison of scale scores for only economically disadvantaged students will be compared across teachers.
Note: If multiple campuses and multiple tests are being charted, the chart may be displayed as a line graph.

Page 8 eduphoria! No content or materials demonstrating the usage of eduphoria! SchoolObjects may be posted or displayed on any external website or public domain.
Labeling, Printing, and Saving a Chart
To title, print, or save a chart, click the View Large button, located at the top of the chart.
Highlight the current title and rename it.
Right click on the chart and choose
to print or save the image.

Page 9 eduphoria! No content or materials demonstrating the usage of eduphoria! SchoolObjects may be posted or displayed on any external website or public domain.
AUTO SUMMARIZING TESTS
Tests can be easily summarized for the year, grade level or subject.
To summarize all the TAKS tests for a year:
Select Quick Views
Choose TAKS Test
Click on the year to expand the test options
Triple-click on the year again to see a summary of all tests given for that year By default, the tests will be grouped by subject at the campus level; however, the tests can be viewed at any level. Repeat this process to see all tests for one grade level or to see all administrations for one subject by triple-clicking on the grade level or subject. Note: To view the campuses where the students took the tests, click on the Where They Were icon.

Page 10 eduphoria! No content or materials demonstrating the usage of eduphoria! SchoolObjects may be posted or displayed on any external website or public domain.
EDITING A VIEW
Any data view in Aware can be edited so districts have the ability to customize the information to meet their needs. Once new views are created, they can be saved and the templates can be shared with other district personnel. Saving and sharing templates is discussed in a later section.
Create a new data view or choose a test from Quick Views
Click the Edit button
Tables Tab – allows you to change or add tests to view and summarize multiple tests you are viewing
Columns Tab – allows you to select information for a view
Summarize Tab – allows you to summarize information by rows. Summarize is most often needed when summarizing district, campus, or teacher summary views. You can also summarize data within a subpopulation on the Summarize Tab.
Tables Tab
The Tables Tab will display the test that is currently being viewed. All other tests for the district are located in the folders and can be added to enable multi-test analysis and viewing.
The test currently being viewed will be on the right. To add or choose another test:
Click on the + sign next to the test type
Select the test
Drag and drop it to the right
Click Update **To remove a test, click and drag it to the left. **The search option will allow you to search to quickly locate a test.

Page 11 eduphoria! No content or materials demonstrating the usage of eduphoria! SchoolObjects may be posted or displayed on any external website or public domain.
Columns Tab
The Columns Tab contains the actual test information that can be viewed.
Click the + sign next to a folder to display the information options available
These will be the column headings in the view and the information requested will be displayed below the column heading in a table format.
Click the desired column heading from the list and drag it over to the right
To remove a column, drag it back over to the left. To clear all the columns at once, click the Clear button at the bottom of the screen. **The search option will allow you to search to quickly locate a data field.
To filter a column:
Click the column name (It will change to bold text.)
Click the Add Filter icon
Choose/enter filtering criteria
Click off the filter to set it
Click Update **To hide the column so that it does not appear on the view, but still filters, select the column heading and click Hide.
Page 12 eduphoria! No content or materials demonstrating the usage of eduphoria! SchoolObjects may be posted or displayed on any external website or public domain.
Summarize Tab
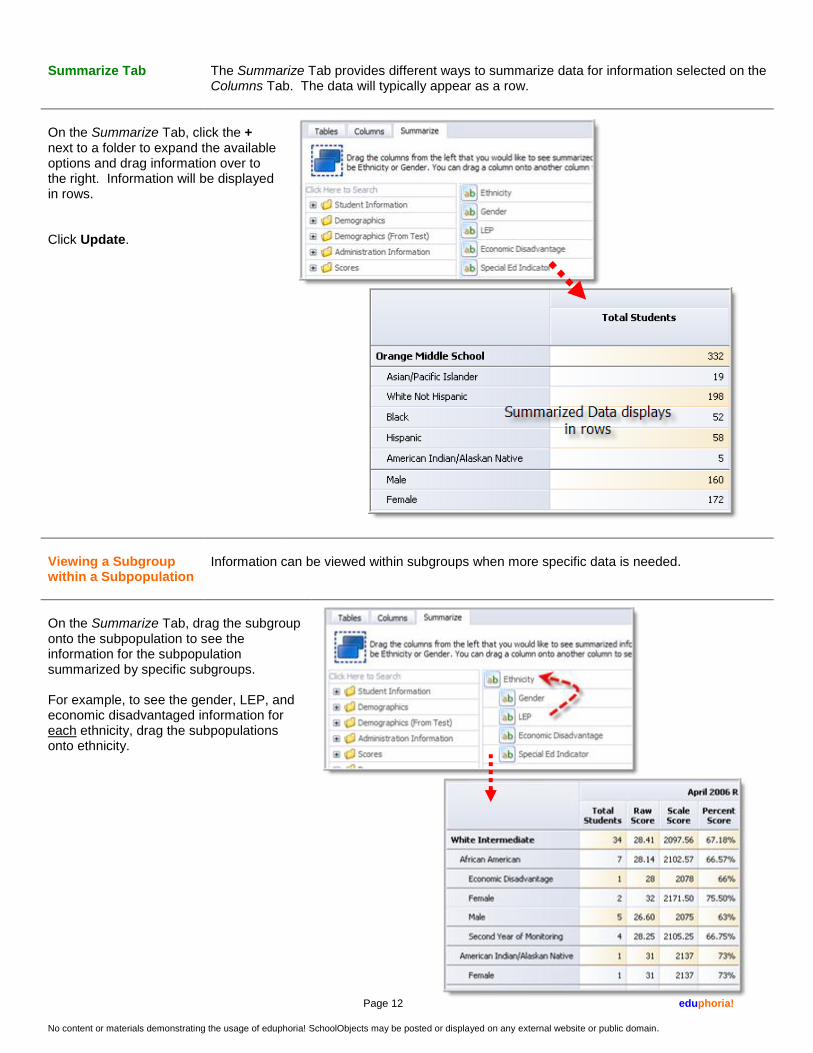
The Summarize Tab provides different ways to summarize data for information selected on the Columns Tab. The data will typically appear as a row.
On the Summarize Tab, click the + next to a folder to expand the available options and drag information over to the right. Information will be displayed in rows. Click Update.
Viewing a Subgroup within a Subpopulation
Information can be viewed within subgroups when more specific data is needed.
On the Summarize Tab, drag the subgroup onto the subpopulation to see the information for the subpopulation summarized by specific subgroups. For example, to see the gender, LEP, and economic disadvantaged information for each ethnicity, drag the subpopulations onto ethnicity.

Page 13 eduphoria! No content or materials demonstrating the usage of eduphoria! SchoolObjects may be posted or displayed on any external website or public domain.
Viewing Summarized Fields as Numbers instead of Percentages
By default, summarized information will be displayed as a percentage. Aware also allows the information to be viewed as numbers.
On the Summarize Tab, remove the check mark from Show Summarized Fields with Percentages.

Page 14 eduphoria! No content or materials demonstrating the usage of eduphoria! SchoolObjects may be posted or displayed on any external website or public domain.
SAVING A VIEW
Default views can be customized and saved to be used again. Once a view has been saved, it can be shared as a template so that teachers and other administrators can apply the template to their own data.
Once a view has been edited, click the Save As button. The view will appear under My Saved Views on the left and given a default title which will need to be changed to reflect the data in the view. To change the title:
Click the Edit button
Edit the title in the toolbar at the top
Click the Save button

Page 15 eduphoria! No content or materials demonstrating the usage of eduphoria! SchoolObjects may be posted or displayed on any external website or public domain.
SHARING OPTIONS
There are two ways to extend views to staff members. A view can be shared which will share a template that can be applied to the staff member‟s own data. The second way is to send a view. When a view is sent to a staff member, the exact data is sent regardless of the receiving staff member‟s rights.
Sharing a Template
When sharing templates, multiple sharing options are available. District Data Viewers will have district level sharing options in addition to the campus. Campus Data Viewers will only have the ability to share templates with their campuses.
To share a template, the view must first be Saved
Click the Share icon located in the upper-right corner
Select one or more ways to share the view
Below is a description of the different sharing options:
District View
Allows administrators across the district to be able to see this view in the „District Views‟ folder
My Campus(es) View
Allows administrators on your campus to be able to see this view in the „Campus Views‟ folder

Page 16 eduphoria! No content or materials demonstrating the usage of eduphoria! SchoolObjects may be posted or displayed on any external website or public domain.
All Teachers
Allows teachers across the district to be able to apply this template to any test they can view
My Campus(es) Teachers
Allows teachers only from your campus to be able to apply this template to any test they can view
District Quick Views
Allows administrators across the district to be able to apply this template to any test they can view
My Campus(es) Quick Views
Allows administrators on your campus to be able to apply this template to any test they can view
My Quick Views
Adds the template to your Quick Views and applies it to any test you can view
Sending a View
Send a view to staff members when they need to see the exact test and students that the sender is seeing.
To send a view, click the Send icon located in the upper-right corner
Click the + in the To: field and add one or more staff members
Rename the view and add any notes (optional)
Click the Send button to send an email, any typed notes, and the saved view to the staff members receiving the view
Note: The staff members will receive the exact view that you see, even if they do not have access to these students.
Page 17 eduphoria! No content or materials demonstrating the usage of eduphoria! SchoolObjects may be posted or displayed on any external website or public domain.
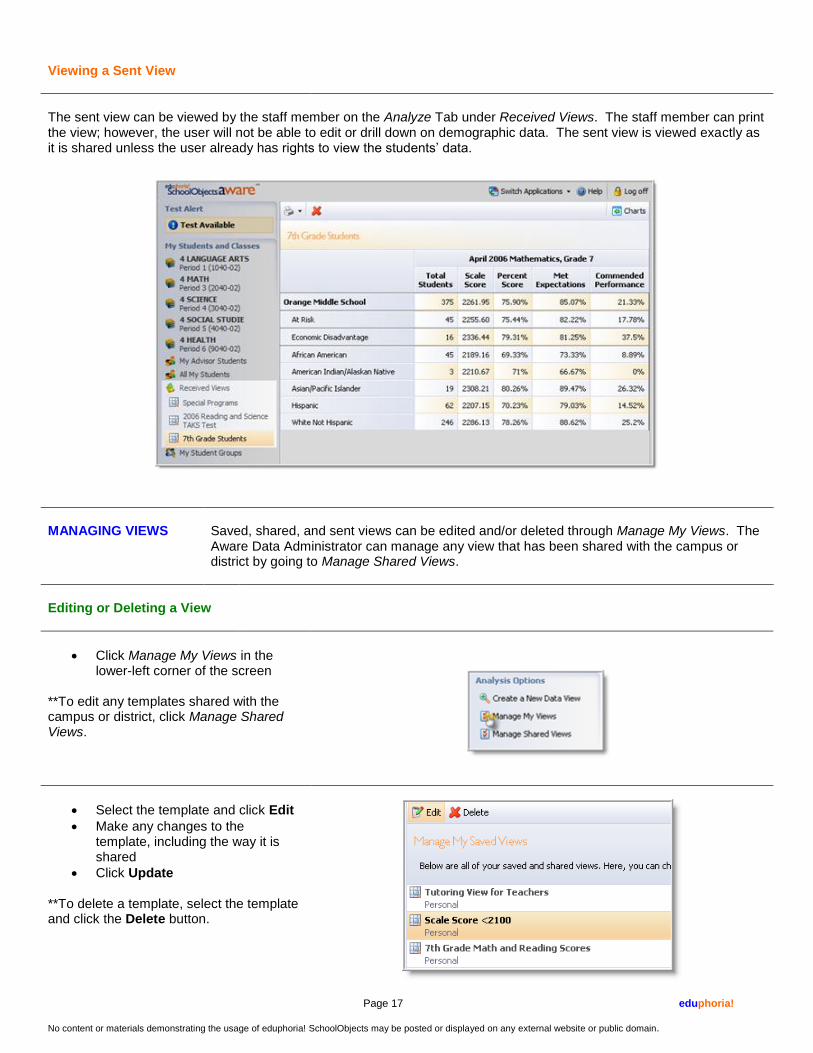
Viewing a Sent View
The sent view can be viewed by the staff member on the Analyze Tab under Received Views. The staff member can print the view; however, the user will not be able to edit or drill down on demographic data. The sent view is viewed exactly as it is shared unless the user already has rights to view the students‟ data.
MANAGING VIEWS
Saved, shared, and sent views can be edited and/or deleted through Manage My Views. The Aware Data Administrator can manage any view that has been shared with the campus or district by going to Manage Shared Views.
Editing or Deleting a View
Click Manage My Views in the lower-left corner of the screen
**To edit any templates shared with the campus or district, click Manage Shared Views.
Select the template and click Edit
Make any changes to the template, including the way it is shared
Click Update **To delete a template, select the template and click the Delete button.
Page 18 eduphoria! No content or materials demonstrating the usage of eduphoria! SchoolObjects may be posted or displayed on any external website or public domain.
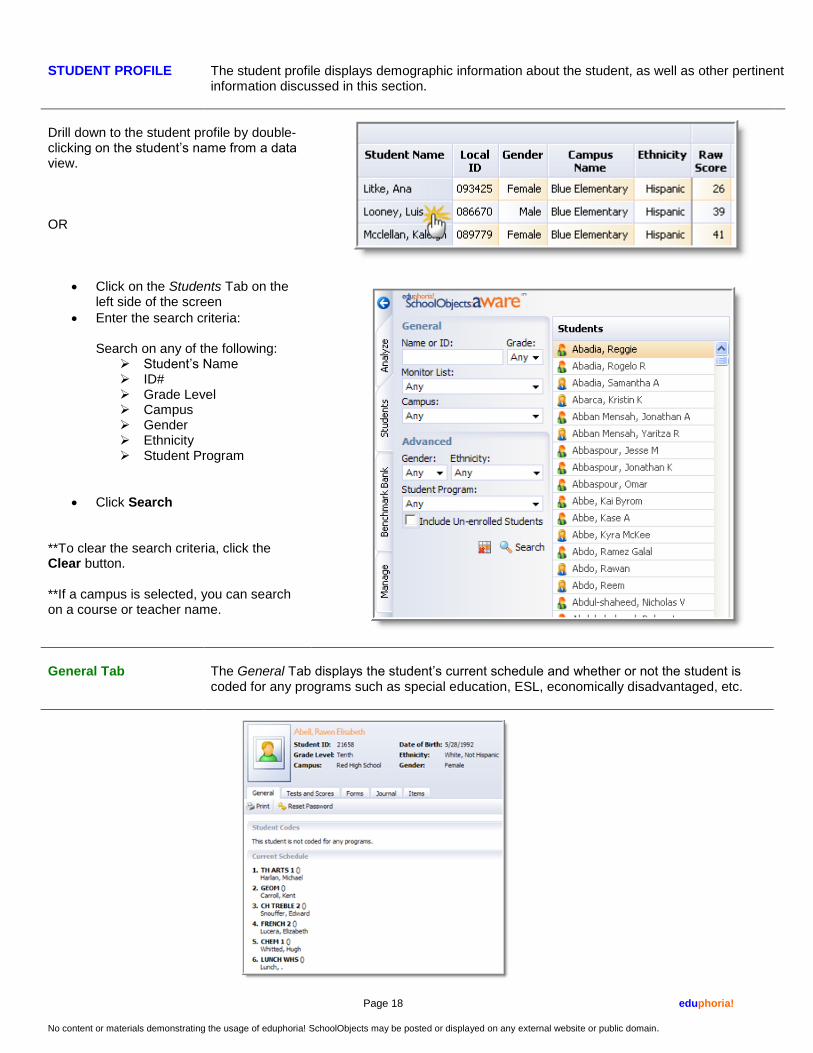
STUDENT PROFILE
The student profile displays demographic information about the student, as well as other pertinent information discussed in this section.
Drill down to the student profile by double-clicking on the student‟s name from a data view. OR
Click on the Students Tab on the left side of the screen
Enter the search criteria:
Search on any of the following: Student‟s Name ID# Grade Level Campus Gender Ethnicity Student Program
Click Search **To clear the search criteria, click the Clear button. **If a campus is selected, you can search on a course or teacher name.
General Tab
The General Tab displays the student‟s current schedule and whether or not the student is coded for any programs such as special education, ESL, economically disadvantaged, etc.

Page 19 eduphoria! No content or materials demonstrating the usage of eduphoria! SchoolObjects may be posted or displayed on any external website or public domain.
Tests & Scores Tab
The Tests & Scores Tab will contain the complete test history for the student. There are two views available when looking at a test from the student‟s profile. Show All Tests will display all district assessments and TAKS tests for the student on one screen. Test Details will display a detailed data analysis on a specific test for a student.
Show All Tests
There are two ways to access the complete test history:
Drilling down on the student from a specific test and then clicking on Show All Tests in the upper-right corner
Searching for the student from the Students Tab and clicking on the Tests & Scores Tab
**Printing from this screen will print a complete test history for the student. **To prevent a test type from being printed, collapse the section by clicking the triangle.
Test Details
There are two ways to access the test details:
Drilling down on the student from a specific test
Searching for the student from the Students Tab, clicking the Tests & Scores Tab, and double-clicking on a specific test
Comparison Histogram: Shows a distribution of scale (or percent) scores for the campus and district. The X axis represents the scale scores. The Y axis represents the percentage of students who fell within that group. The dot represents where the student fell. Objective Performance Chart: Shows how the student performed on each objective, compared to the campus and district. TAKS Objectives and Student Expectations: Shows the number of objectives/SE‟s correct out of the total number of objectives/SE‟s on the test. Individual Question Response: Shows exactly what the student bubbled on the answer document, as well as the objective and SE for each question. **Printing from this screen will print a detailed item analysis for the test. To prevent a section from being printed, collapse the section by clicking the triangle.

Page 20 eduphoria! No content or materials demonstrating the usage of eduphoria! SchoolObjects may be posted or displayed on any external website or public domain.
Forms Tab
Student forms are added on the Forms Tab. Forms are categorized into categories and will display the date and name of the staff member who added the form. Forms will remain with the student from year-to-year, unless deleted.
Journal Tab
The Journal Tab displays any journal actions added to the student profile. The types of journal actions can be customized on the Manage Tab. Teachers will only be able to view journal actions they actually add. Principals can see all journal actions added to the student profile.
To add a journal action: Click Add Action Item Choose the action item Enter the text for the
journal action Click Add Item
To print journal actions, click the Print button
To delete a journal action, click the Delete button
**Any journal action added will display the title, who added the action item, and the date.

Page 21 eduphoria! No content or materials demonstrating the usage of eduphoria! SchoolObjects may be posted or displayed on any external website or public domain.
REPORTS
There are pre-built reports located on the Reports Tab.
Report Descriptions: Accountability Report – This report looks very similar to the state accountability report. It will contain the same information
regarding demographics and tests taken. The headers for ELA/Reading, Math, Writing, Science, Social Studies, and All Tests will then be broken down by All Students, ethnicity, economic disadvantage, gender, LEP, Special Education, and At-Risk. Each row/column will show the number of students, met expectation percentage, Met expectation including TPM percentage, and commended percentage.
AYP Accountability Report – Similar to the Accountability Report incorporating only the requirements for AYP. ELL Accountability Report -- Similar to the Accountability Report incorporating only the requirements for ELL. At Risk TAKS 110% Exit Criteria Report – This report will help distirct and campus staff monitor the at-risk status of their
students. By comparing previous and current TAKS of students, it will tell you if they have met by 100% using their raw score. Other information is displayed as well.
Incorrect Responses Report – This report will help you to group students based on their responses to specific questions.
Students that missed a certain question will be grouped by the desired parameter. Group Summary Report – In addition to standard objective information, this report will assist staff in analyzing objective
mastery. By specifying your own mastery percentage, you can then view the percentage of students who attained that level on each objective numerically and visually. Additional summary data is provided as well.
Teacher Report Card – This report will display all students in each teacher‟s class with fundamental scores, including
vertical progress. Form Mass-Print – This report will generate a copy of the selected form for each student that has been assigned that form
at the campus selected. Student Forms Status Report – This report will allow for filtering on student forms

Page 22 eduphoria! No content or materials demonstrating the usage of eduphoria! SchoolObjects may be posted or displayed on any external website or public domain.
Monitor Groups/Lists
Monitor Lists are typically created by teachers who need to be able to see students that are not in their current roster. For example, a teacher tutors students after school from another campus or from another class and needs to be able to see their profiles. By creating a monitor list and having the principal approve it, the teacher will be able to view all information on the students‟ profiles. Approving monitor lists is discussed in this section. Monitor Groups are created by campus or district level administrators. Groups have two functions. When a monitor group of target students is created, the teachers who have students in the group will be able to automatically view the target group. The second function of groups gives staff members the ability to summarize on the target group and track student progress on assessments.
CREATING A GROUP
There are two ways to create a monitor group.
Option #1
Create a new data view or select a test from Quick Views
Switch to Individual Student Level to view a list of students
Edit the view to reflect the students that need to be in the monitor group (Example: Students with scale score < 2100)
Click the Add to Group button
Follow the instructions in the wizard to create the group
On the fourth step, the students will need to be added to the group:
Choose individual students by clicking on the student‟s name and clicking the Add button
Choose multiple students by holding down the shift or control keys and clicking the Add button
**Once created, teachers can only see a monitor group if they teach students in that group. And, they can only see the students they teach, not all students in the group.
To view the monitor group from the Analyze Tab, click My Student Groups and select the monitor group. The students will be displayed in a list and can be selected to view their profiles.

Page 23 eduphoria! No content or materials demonstrating the usage of eduphoria! SchoolObjects may be posted or displayed on any external website or public domain.
Option #2 A monitor group can be created manually through the Students Tab.
On the Students Tab, click Manage Monitor Groups (lower-left corner of screen)
Click New Monitor Group
Enter a name for the monitor group
Click Save
Click the Students Tab and enter students‟ names or ID numbers to search. Click Add to add the students to the monitor group.
**Teachers can only see a monitor group if they teach the students in that group. And, they can only see the students they teach, not all students in the group.
Click Save To view the monitor group from the Analyze Tab, click My Student Groups and select the monitor group. The students will be displayed in a list and can be selected to view their profiles.

Page 24 eduphoria! No content or materials demonstrating the usage of eduphoria! SchoolObjects may be posted or displayed on any external website or public domain.
MANAGING GROUPS
District Data Viewers are able to create, edit, and delete monitor groups for the district. Campus Administrators are able to create, edit, and delete monitor groups for their campuses.
On the Students Tab, click Manage Monitor Groups in the lower-left corner
Select the campus
Click on the group and add/delete students, delete the group, etc.
APPROVING MONITOR LISTS
When a teacher creates a monitor list, the list must be approved by the teacher‟s Campus Administrator before the teacher can view the students.
Click on the Students Tab
Click Approve Monitor Lists
Click on the monitor list
Click Approve List

Page 25 eduphoria! No content or materials demonstrating the usage of eduphoria! SchoolObjects may be posted or displayed on any external website or public domain.
Advanced Analysis
District and Campus Data Viewers have many options when viewing data, which helps facilitate more in-depth data viewing. This section covers how to analyze data more efficiently and effectively.
AVERAGE/SUBJECT/ COHORTS/ LONGITUDINAL
There are multiple ways to view and summarize tests to see and predict trends. Options for viewing and using data appear in this section.
Average Tests
Use this option to view multiple tests side-by-side and see an overall average. This analysis is helpful when viewing how the students have performed on all the math benchmarks for the year. Note: If viewing multiple administrations of a TAKS test (i.e. the student took the TAKS test in 3 different administrations), the summarize column will display only the last administration score. The three administrations will not be averaged together.
Once a test is selected, click the Edit button
On the Tables Tab, add the multiple tests by dragging the tests to the right
In the drop-down list, place a check mark next to the option Summarize Selected Tests With Average Results
Click Update Note: In the example below, the Compare Across Tests icon is selected to view the column titles across tests.

Page 26 eduphoria! No content or materials demonstrating the usage of eduphoria! SchoolObjects may be posted or displayed on any external website or public domain.
Summarize by Subject
Use this option when summarizing multiple tests from different subject areas and you only want to see the overall average for each subject. For example, if you are averaging 3 math tests and 3 reading tests and you only want to see one column for math and one column for reading, the results for math will be averaged into one column and the results for reading will be averaged into a second column.
Once a test is selected, click the Edit button
On the Tables Tab, add the tests from different subjects to view by dragging the tests to the right
In the drop-down list, place a check mark next to the option Summarize Selected Tests With Subject Results
Click Update Note: In the example below, the Compare Across Tests icon is selected to view the column titles across tests.

Page 27 eduphoria! No content or materials demonstrating the usage of eduphoria! SchoolObjects may be posted or displayed on any external website or public domain.
Cohorts
Cohort groups show how the same group of students has performed over time.
Two options exist when working with cohorts: Cohorts and Cohorts, Looking Back. Use the Cohorts option when selecting a test in the past. Use the Cohorts, Looking Back option when viewing a current test.
Once a test is selected, click the Edit button
On the Tables Tab, clear the current test (if viewing a test from the current year) by dragging it to the left
Add a test from a previous year by dragging the test to the right
In the drop-down list, place a check mark next to the option Summarize Selected Tests As a Cohort
Select the Where They Were icon to view the campuses that the students were on when they took the test
Click Update
Only the students that took the test that year will be displayed, along with all tests taken since that date Note: To view students for the current year, select a current test and choose Summarize Selected Tests As a Cohort, Looking Back. The results can also be viewed at the Teacher Level to show how the teacher has added value. The results can be viewed at the Student Level to show a test history for the student. Note: In the example below, the Compare Across Tests icon is selected to view the column titles across tests.

Page 28 eduphoria! No content or materials demonstrating the usage of eduphoria! SchoolObjects may be posted or displayed on any external website or public domain.
Longitudinal Data
Longitudinal results will show how different groups of students have performed over time for a particular grade level and subject.
Two options exist when working with longitudinal data: Longitudinal Analysis and Longitudinal Analysis, Looking Back. Use the Longitudinal Analysis option when selecting a test in the past. Use the Longitudinal Analysis, Looking Back option when viewing the most current test.
Once a test is selected, click the Edit button
On the Tables Tab, clear the current test (if viewing a test from the current year) by dragging it to the left
Add a test from a previous year by dragging the test to the right
In the drop-down list, place a check mark next to the option Summarize Selected Tests For Longitudinal Analysis
Select the Where They Were icon to view the campuses that the students were on when they took the test
Click Update
Performance results will be displayed showing, for example, how third grade has performed over time Note: To view students for the current year, select a current test and choose Summarize Selected Tests For Longitudinal Analysis, Looking Back. The results can be viewed at the Teacher level (if the roster for the previous years are imported) to see how a teacher‟s students have performed from year to year. Note: In the example below, the Compare Across Tests icon is selected to view the data vertically on the screen.

Page 29 eduphoria! No content or materials demonstrating the usage of eduphoria! SchoolObjects may be posted or displayed on any external website or public domain.
VERTICAL VIEWS
Vertical Views are created to see more detailed information about TEKS and Objectives.
View a test by creating a new data view or by clicking on a test in Quick Views
Click the Edit button
Remove all fields from the Columns Tab by clicking the Clear button, in order to add information for vertical columns
On the Columns Tab, information will be pulled from the following three folders:
Objectives
SEs
Responses Note: For Vertical Viewing, the only information you will use from the folders are fields without the word „All‟ in them. Basically, you will not use the first field listed in each folder. For example: Do not use „All Objectives‟ or „All Responses‟ or „All SEs‟, etc.
Click and drag a field to view and click Update

Page 30 eduphoria! No content or materials demonstrating the usage of eduphoria! SchoolObjects may be posted or displayed on any external website or public domain.
SUMMARIZING ON MONITOR GROUPS AND FORMS
Students included in a monitor group or assigned a form can easily be used when analyzing data by filtering or summarizing on the group. For example, you can see how a group of students performed on a particular test and compare it with the district or campus averages.
Before filtering or summarizing on a group or form, the students need to be added to the monitor group or assigned a form. These students are automatically added to a group that can be filtered or summarized. To filter the group:
Select a test under Quick Views
Click the Edit button
Select the Columns Tab
Expand the Monitor Group or Student Forms folder
Drag the group from the left to the right to add the group to the view
Select the group and click Add Filter. The filter will automatically default to yes
Click Update Note: Only students who have taken the selected test AND are included in the group will appear.
To summarize on the group, add the group to the Summarize Tab and click Update. The students will be compared to the other students who took the test. To view only the students who took the test, drill down on the monitor group from the district or campus level.

Appendix A eduphoria! No content or materials demonstrating the usage of eduphoria! SchoolObjects may be posted or displayed on any external website or public domain.
Data Analysis Field Glossary
Student Information
Local ID
Current Advisor
Current Campus
Current Section
Current Course
Current Instructor Demographics
Grade Level
DOB
Gender
Ethnicity
Economic Disadvantage
Economic Disadvantage Category
Title I Part A
LEP
Bilingual
ESL
Special Ed Indicator
Section 504
Gifted Talented
At Risk
Career And Technology Ed
RTI Demographics (From Test)
Grade Level (DF)
Gender (DF)
Ethnicity (DF)
Economic Disadvantage (DF)
Economic Disadvantage Category (DF)
Title I Part A (DF)
Migrant (DF)
LEP (DF)
Bilingual (DF)
ESL (DF)
Special Ed (DF)
Gifted Talented (DF)
At Risk (DF)
Career And Technology Ed (DF)
PEIMS Crisis Code
PEIMS Student Attribute Code
HSEP Reading/ELA
HSEP Other
Student information as it appears in the district‟s SIS.
Student information as it appears in the district‟s SIS.
Student information as it appears on the test data file.

Appendix A eduphoria! No content or materials demonstrating the usage of eduphoria! SchoolObjects may be posted or displayed on any external website or public domain.
Administration Information
ESC Region Number – displays ESC
County, District, Campus Number
District Name
Administered Campus Name
Date Taken – displays the date the student took the test
Testing Campus – testing campus as it appears on the test data file
Testing Instructor
Testing Section
Testing Course
District Accountability – this field compares the snapshot date county-district number to the actual testing county-district number to exclude students. It will also filter out necessary administrations for accountability and include TAKS Accommodated as appropriate for that testing year.
Campus Accountability – this functions exactly as district accountability; however, the full county-district-campus number is used for filtering
AYP Accountability – looks at the accountability county-district-campus number and the testing location CDC. If they match, then they are accountable. This looks at the date of the test compared to the snapshot data, which is slightly different from TAKS. If they were there at testing time, the student counts. It should also only look at math and reading. It cannot help with “Other Measure” for AYP, which looks at attendance, etc.
Scored All Tests – whether or not the student has a score for each test in the current data view
Language – displays the language of the test (English or Spanish)
Online Testing – displays whether student took the test online
Test Version – shows the version of the test the student took – TAKS, TAKS Accommodated, TAKS-Alt, etc. Scores
Raw Score – displays the student‟s raw score
Percent Score – displays the student‟s percent score. This is not to be confused with a percentile score. This is simply the percentage of questions answered correctly.
Scale Score – displays the student‟s scale score
Met Expectations/Satisfactory - displays whether or not the student met expectation or satisfactory
Commended / Advanced – displays whether or not the student is commended or advanced
Language Version – filter by English or Spanish
Test Version – select between regular or modified versions
Score Code and Score Code Default Information – displays the score code information as reported in the TAKS data file
TPM Formula Used – displays which formula was used according to the TAKS data file
Scale Score For TPM – the current scale score that was used to calculate TPM
Previous Scale Score For TPM – the previous scale score that was used to calculate TPM
Previous Year Mean Scale Score – the mean scale score used to calculate TPM
TPM Score – the score the student is projected to make in the next high stakes grade level
Projected to Meet Standard – whether or not the student is projected to meet in the next high stakes grade level
Met for Accountability – this combines met expectations with projected to meet to give an overall met expectations for accountability purposes
Projected to Commended –this works the same as projected to meet, but for commended
Commended or Expected to be Commended – this works the same as met for accountability, but for commended
Quantile Measure – displays the quantile measure based on the student‟s score Objectives
All Objectives – displays the objective percent score and optionally, number correct out of total correct for the student. This is oriented horizontally in a data view.
Objective Number
Objective Description
Objective Percent Correct
Objective Number Correct
Objective Number Total
Vertical View fields: These fields are used to see specific information about an objective. They are typically used in combination with the SE and Responses vertical view fields to create customized item analysis reports.
Reflects testing instructor, section, and course at time of import.

Appendix A eduphoria! No content or materials demonstrating the usage of eduphoria! SchoolObjects may be posted or displayed on any external website or public domain.
SEs
All SEs – displays the number correct or the SE percent score for students
SE Number
SE Description
SE Percent Correct
SE Number Correct
SE Number Total Responses
All Responses – displays the answer response for each student by question, the distribution of answers per question, along with the SE and objective for each question
Question Number
Student Response
Correct Response
Student Correct Accommodations
Study Guide
Presentation
Response
Setting
Timing & Scheduling
Braille
Large Print
Oral
Dyslexia Previous Scores
Previous Status – whether or not the student met expectation or was commended on the previous test of the same subject
Previous Raw – the student‟s previous raw score on the test of the same subject
Previous Scale – the student‟s previous scale score on the test of the same subject Vertical Progress
Required Progress – amount of change required to meet the states‟ expectation of minimum growth
Previous Vertical – previous vertical scale score used for the calculation
Student Progress – the amount of change in the student‟s vertical scale score
Met Progress – whether or not the student achieved at least 100% of the required progress
Progress Percent – the percentage of the required progress the student achieved. For example: if the required progress is 26 and the student only gained 25 points, then the progress percent would be 96%. If the student gained 37 points, then the progress is 142%. Negative progress growth can only happen if the student‟s vertical score actually declines.
Student‟s accommodations as coded on the TAKS test.
Vertical View fields: These fields are used to see specific information about an SE. They are typically used in combination with the Objective and Responses vertical view fields to create customized item analysis reports.
Vertical View fields: These fields are used to see specific information about a question or student response. They are typically used in combination with the Objective and SE vertical view fields to create customized item analysis reports.


