CAL POLY ADMINISTRATION AND FINANCE Performance Metrics The mission of Administration and Finance is to provide high quality, efficient support and planning services as an integral part of the campus community in support of student learning. Our goal is to deliver our services in a manner that is consistent with our mission and that applies our principles of trust, respect, communication, integrity, commitment, empowerment, innovation and creativity, collaboration, equity, and results. Communicating these expectations to those working within the division of Administration and Finance is a priority and establishes a standard for performance. People in Administration and Finance were surveyed to determine their knowledge of the principles and whether they applied them to their everyday jobs. Approximately 92% of the respondents were aware of the principles and 55% said that the principles affect their behavior in the workplace. Updated 11/2011 1
Transcript
CAL POLYADMINISTRATION AND FINANCE
Performance Metrics
The mission of Administration and Finance is to provide high quality, efficient support and planning services as an integral part of the campus community in support of student learning. Our goal is to deliver our services in a manner that is consistent with our mission and that applies our principles of trust, respect, communication, integrity, commitment, empowerment, innovation and creativity, collaboration, equity, and results. Communicating these expectations to those working within the division of Administration and Finance is a priority and establishes a standard for performance. People in Administration and Finance were surveyed to determine their knowledge of the principles and whether they applied them to their everyday jobs. Approximately 92% of the respondents were aware of the principles and 55% said that the principles affect their behavior in the workplace.
During the division’s annual planning meeting metrics are incorporated into the establishment of operating goals and targets for the coming
Updated 11/2011 1
year. Linking budget and targets to outcomes and performance is one way to assess the success of an organization.
Administration and Finance is committed to its mission and has developed metrics to gauge the effectiveness and efficiency of the support services it provides. Where comparable data exists, such campus metrics are compared with industry standards and or other institutions. Such comparisons are not always meaningful since, for example, the type and age of space or expectations may vary considerably by university; however, they have been included for discussion purposes. Of greater importance is the longitudinal view of Cal Poly’s own metrics and what is occurring over time. When possible a brief customer satisfaction survey is taken to provide qualitative information to support the quantitative data. The overall goals of the division are: (1) to be the provider of choice as measured by customer satisfaction; (2) to be the employer of choice as measured by employee satisfaction; and (3) to demonstrate best-in-class leadership in managing university resources. Metrics help determine how successful we are achieving those goals.
Some areas within Administration and Finance lend themselves more readily to performance metrics than others. An area such as Facilities Planning which oversees construction projects over $600,000 has performance expectations related to budget and schedule. However the flow and type of projects are not consistent over time and may vary from $750 million in one year to less than $20 million in another making this information somewhat less valuable. Examples of those areas where service levels can be measured are included below.
FinanceAFD Finance includes Fiscal Services, Contracts, Procurement, and Risk Management, and Budget and Analytic Business Services. These departments are responsible for state cashiering and payment processing, student fee and receivables management, student account disbursements, vendor payments, payroll, purchasing, risk management, travel reimbursement, financial reporting, budget, equipment tracking, and end user training and support for PeopleSoft finance applications and modules.
Quantitative DataFinance strategy has been to utilize technologies to optimize productivity and services. Fiscal Services goals have been to (1) increase student utilization of on-line payments to 75% or greater in order to reduce manual handling time and streamline and improve the payment process for students and to (2) increase the number of paper-
Updated 11/2011 2
less disbursements of student financial aid refunds to 75% ACH to check percentage for disbursements.
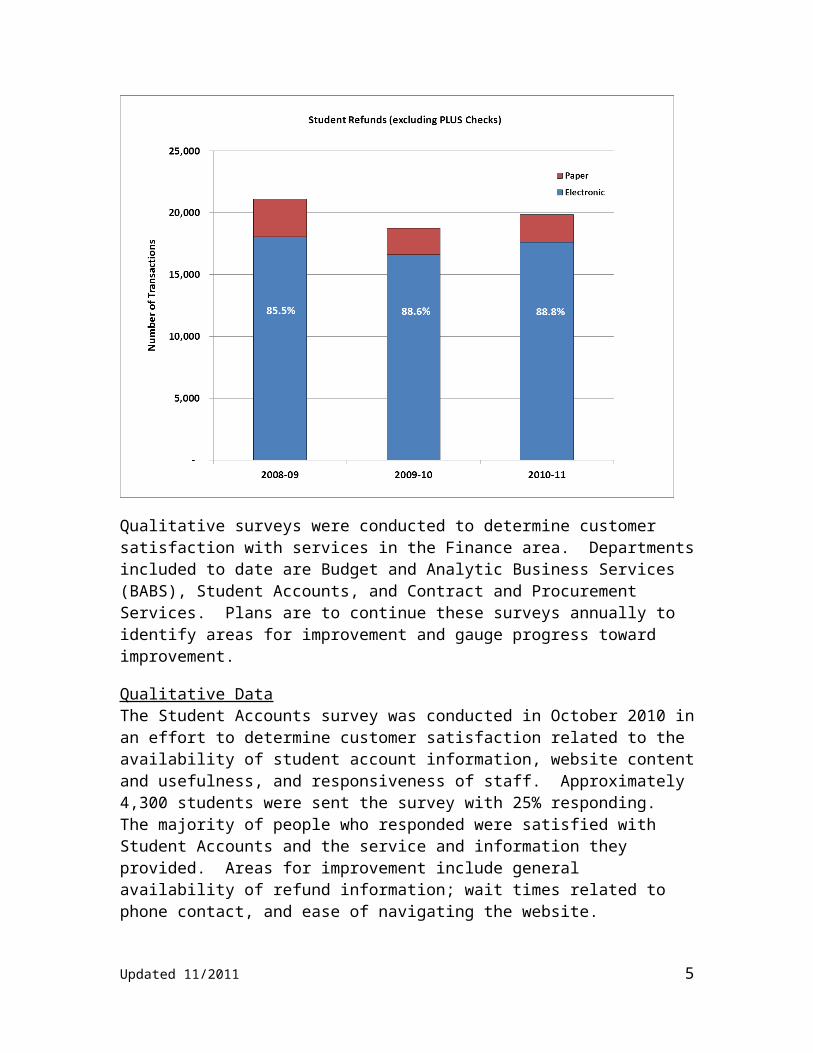
The first goal was accomplished through the use of on-line credit card and e-Check payments through the Internet. The first chart below indicates that in 2010-11 the goal was met with 77% of the student payment transactions being made electronically as compared to 2004-05 when that number was only 52%. The second chart shows that since 2008 student refund disbursement transactions have consistently exceeded the 75% goal and are now near 90%. The transactions exclude refunds related to Parent Plus Loans because of the requirement to issue paper checks.
Updated 11/2011 3
Qualitative surveys were conducted to determine customer satisfaction with services in the Finance area. Departments included to date are Budget and Analytic Business Services (BABS), Student Accounts, and Contract and Procurement Services. Plans are to continue these surveys annually to identify areas for improvement and gauge progress toward improvement.
Qualitative DataThe Student Accounts survey was conducted in October 2010 in an effort to determine customer satisfaction related to the availability of student account information, website content and usefulness, and responsiveness of staff. Approximately 4,300 students were sent the survey with 25% responding. The majority of people who responded were satisfied with Student Accounts and the service and information they provided. Areas for improvement include general availability of refund information; wait times related to phone contact, and ease of navigating the website.
Updated 11/2011 4
Updated 11/2011 5
Updated 11/2011 6
The Budget and Analytic Business Services (BABS) customer satisfaction survey was conducted in February 2011. The survey’s focus was on customer service and usefulness of the Finance dashboards. Approximately 17% of those receiving the survey responded. The majority of respondents were satisfied with the service level and responsiveness of the BABS staff and were positive with regard to the usefulness of the Finance Dashboards in meeting their data needs.
Updated 11/2011 7
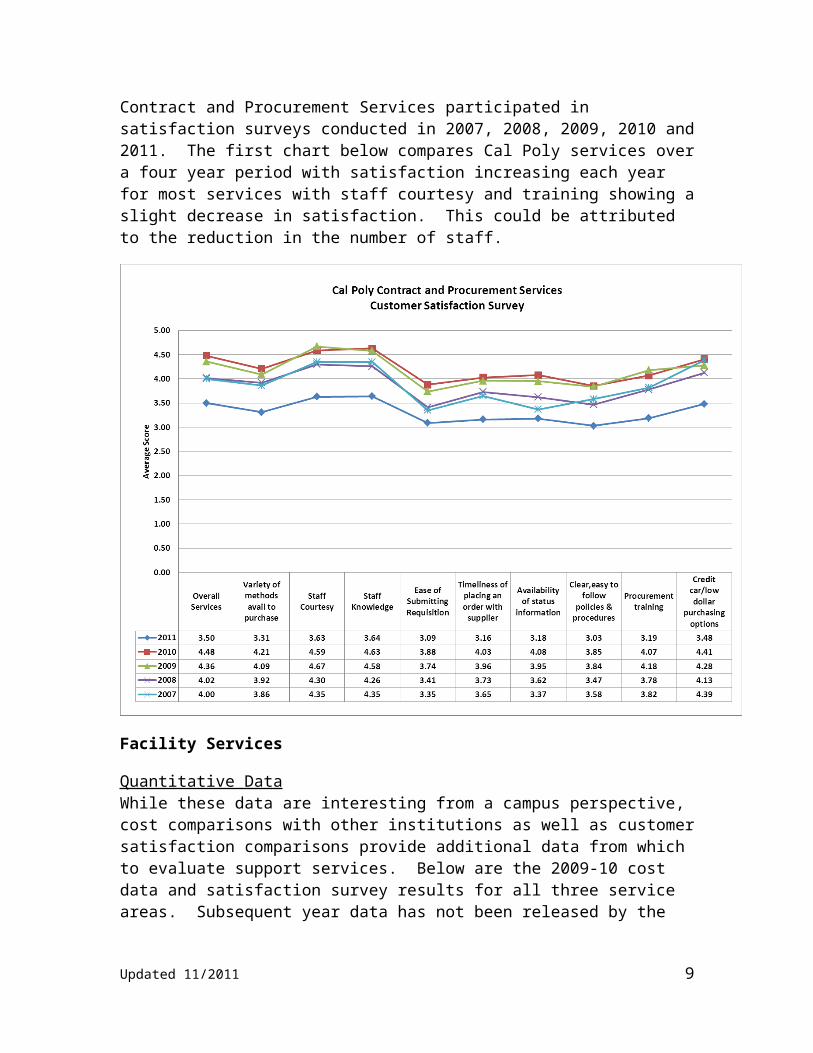
Contract and Procurement Services participated in satisfaction surveys conducted in 2007, 2008, 2009, 2010 and 2011. The first chart below compares Cal Poly services over a four year period with satisfaction increasing each year for most services with staff courtesy and training showing a slight decrease in satisfaction. This could be attributed to the reduction in the number of staff.
Facility Services
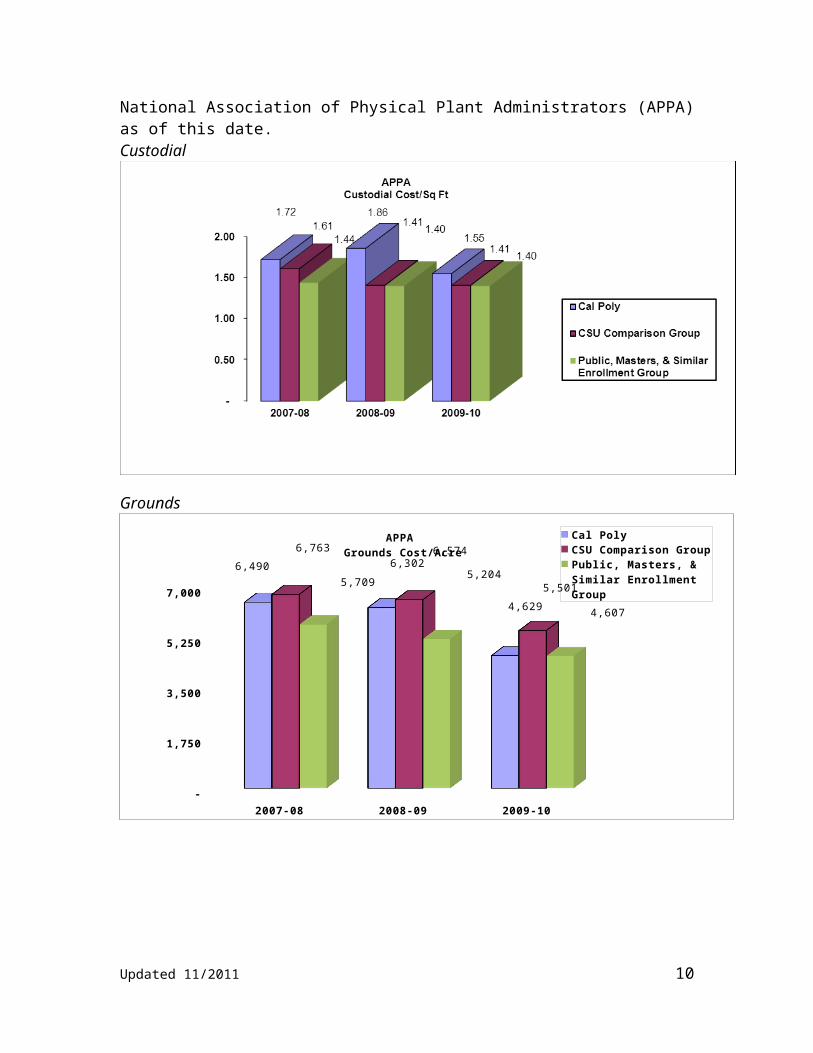
Quantitative DataWhile these data are interesting from a campus perspective, cost comparisons with other institutions as well as customer satisfaction comparisons provide additional data from which to evaluate support services. Below are the 2009-10 cost data and satisfaction survey results for all three service areas. Subsequent year data has not been released by the National Association of Physical Plant Administrators (APPA) as of this date.
Updated 11/2011 8
Custodial
Grounds
2007-08 2008-09 2009-10 -
1,750
3,500
5,250
7,000
6,490 6,302
4,629
6,763 6,574
5,501 5,7095,204
4,607
APPA Grounds Cost/Acre
Cal PolyCSU Comparison Group Public, Masters, & Similar Enrollment Group
Updated 11/2011 9
Maintenance
Note that the Maintenance Cost/Sq. Ft is higher for Cal Poly than the comparison group average due to the large number of older buildings requiring higher levels of maintenance.
Qualitative DataFacility Services, in conjunction with APPA has been evaluating service levels and customer satisfaction for a number of years. APPA has established quality levels that are consistently used by their member institutions to provide comparative data. Performance metrics have been established for custodial, grounds, and maintenance that includes APPA quality levels and customer satisfaction levels.
The survey performed for 2010-11 indicates that satisfaction with custodial services, grounds maintenance, and maintenance has remained consistent with 2009-10. Satisfaction levels achieved in grounds and maintenance in 2008-09 has since dropped back due to recent budget reductions.
Updated 11/2011 10
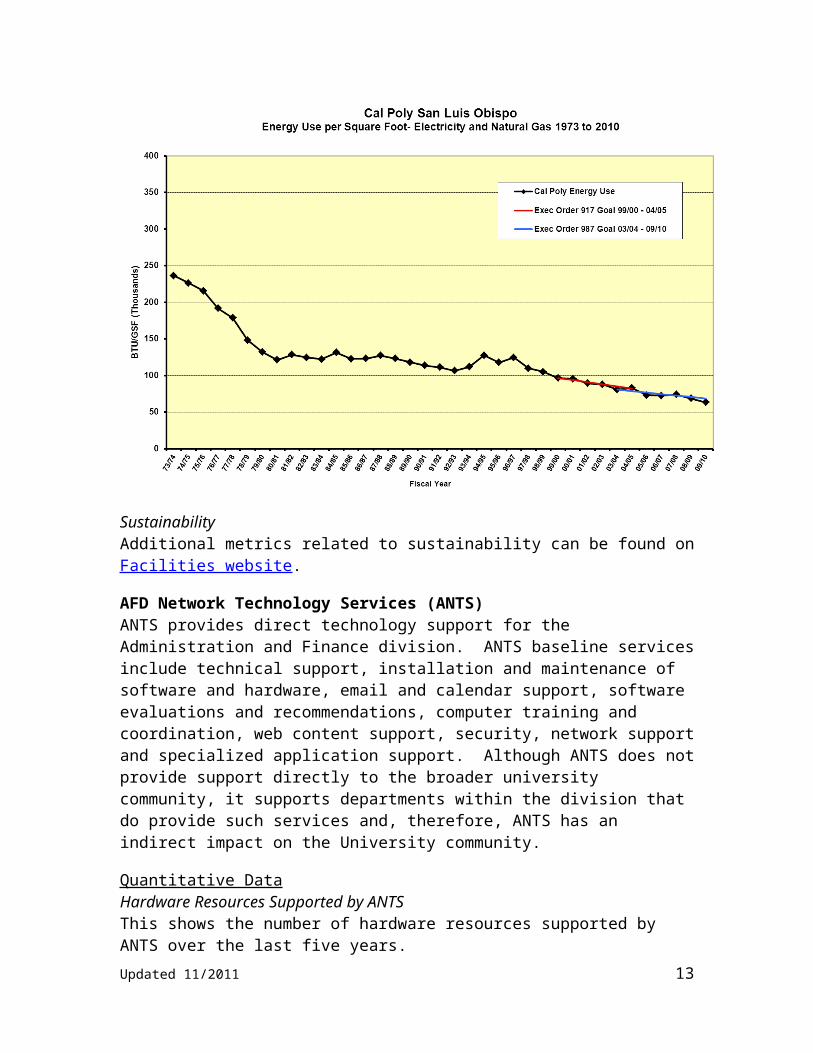
Energy UseBetween 1999 and 2003, Cal Poly’s total energy use per square foot of building fell by about 13 percent due to dozens of energy-efficiency measures. Since that time several new buildings have been added to the campus and as the campus population has grown, the energy use per square foot has not changed significantly. Total Energy Use per Square Foot is the primary metric used by the CSU to track progress toward energy conservation goals. Sometimes referred to as Energy Use Index, this metric represents total annual energy use (electricity and natural gas combined – both purchased and generated on site) per square foot of building space, measured in British Thermal Units per Square Foot, or Btu/sf. To normalize this metric between different CSU campuses, the square footage is adjusted to prorate or remove buildings and structures that are very low or zero energy users, such as parking structures, stadiums, and farm buildings such as barns and storage sheds. The CSU has established goals to reduce Btu/sf by 15% over two consecutive five year periods. Cal Poly has met or exceeded these goals.
SustainabilityAdditional metrics related to sustainability can be found on Facilities website.
AFD Network Technology Services (ANTS)ANTS provides direct technology support for the Administration and Finance division. ANTS baseline services include technical support, installation and maintenance of software and hardware, email and calendar support, software evaluations and recommendations, computer training and coordination, web content support, security, network support and specialized application support. Although ANTS does not provide support directly to the broader university community, it supports departments within the division that do provide such services and, therefore, ANTS has an indirect impact on the University community.
Quantitative DataHardware Resources Supported by ANTS This shows the number of hardware resources supported by ANTS over the last five years.
Support Types per Technician:This chart shows the average number of Technical resources supported by each Technician. Although the number of AFD Users has declined, the number of devices being supported has increased. There are approximately 3.5 technicians supporting the resources identified below and an additional 1.5 staff who support the AFD network.
Updated 11/2011 14
Support per Technician versus Industry Standards:This compares how many users, workstations and servers are supported by ANTS in comparison with industry standards for support. Typical studies compare the number of end-users to support staff for desktop support (workstations).
Industry Standard Workstation / Desktop Support StatisticsIncludes: Does not include these services
ANTS provides: PC’s and laptops, monitors and
printers. Standard installation,
configuration and troubleshooting workstation applications
Training Deep level software support Specialized application
support Other computer services Meeting Technology Services
(MTS) such as laptop and projector setup for meetings
Updated 11/2011 15
Qualitative DataIn support of the quantitative data provided above, the first ANTS customer satisfaction survey was conducted in June 2010. Respondents were asked to gauge their satisfaction with ANTS expertise, knowledge, courtesy, professionalism, timeliness, responsiveness, and overall service experience. Below are the consolidated results.
Updated 11/2011 16
University Police
Quantitative ReportThe University Police Department’s motto is "Protecting Our Future." The mission of the University Police Department at Cal Poly is to promote a safe and secure learning environment by maintaining order, enforcing laws, and providing professional police, emergency, parking, and access services. Crime statistics collected by University Police in accordance with the Cleary Act are available in the Clery Report.Below is an excerpt from that report.