University of Freiburg Department of International Economic Policy Discussion Paper Series Nr. 24 July 2013 ISSN 1866-4113 Administrative overspending in Indonesian districts: The role of local politics Bambang Suharnoko Sjahrir, Krisztina Kis-Katos and Günther G. Schulze
Transcript
University of Freiburg Department of International Economic Policy
Discussion Paper Series Nr. 24
July 2013 ISSN 1866-4113
Administrative overspending in Indonesian districts:
The role of local politics
Bambang Suharnoko Sjahrir, Krisztina Kis-Katos and
We analyze the determinants of the excessive administrative spending of local governments inIndonesia. In an unbalanced panel data set of 399 districts for 2001‐2009, we show that theproliferationofdistrictshasnotledtoincreasedadministrativespending;insteadalackofpoliticalaccountabilityisresponsibleforthisexcess.Thedegreeofpoliticalcompetitioninfluencesthelevelof administrative spending significantly; newly introduced direct elections of district heads,however,didnotcurtailthewaste.
Administrative expenditures of Indonesian districts are extremely high in internationalcomparison.On average, districts spend around a thirdof their entirebudget on generaladministrationandnotonpublicservicedelivery.Correspondingfiguresare3percentforUScountiesandforUKdistricts,8percentforNorwayand13percentforTanzania.1Eventhoughbudgetarydelineationsmaydifferacrosscountriesandlocaljurisdictionsmayservedifferent sets of functions, which makes figures not be directly comparable, theextraordinarily high figures for the Indonesian local governments point towards largeinefficienciesintheprocessofpublicservicedeliveryatthelocallevel.
One reason for these inefficienciesmaybe that thedecentralizationprocess in Indonesiahas substantially weakened accountability mechanisms at the local level. Indonesia’ssweeping decentralization,written into law in 1999 and implemented in 2001, devolvedalmost 40 percent of the overall budgetary responsibility to the regions (provinces anddistricts) and transferred a number of very important functions, such as primary andsecondary education, health services, environmental protection, and infrastructure,predominantlytothedistricts(WorldBank2008).Thisdevolutionofauthoritytothelocallevelhasshiftedsubstantialfinancialresourcesanddecisionpowertounitsthatpreviouslyweremerelyexecutingorders fromthecenter.2Bureaucraticaccountabilitywasremovedandshouldhavebeenreplacedbyeffectivedemocraticaccountability. In1999, Indonesiahad its first democratic election after the authoritarian New Order regime collapsed.Starting in 2000, district heads were elected by the now democratically elected localparliamentswhenever the termsof theeffectivelyappointeddistrictheads fromtheNewOrder came to an end. In a second reform step, beginning in 2005, district heads weredirectly elected with the aim of strengthening democratic accountability of localgovernments.
1 Systematic evidence on local governments’ administrative expenditures is unavailable, especially fordevelopingcountries.StillitisobviousfromthesefiguresthatIndonesia’sadministrativeexpendituresexceedusual levels by far. Data are taken from http://www.census.gov/govs/estimate/historical_data_2007.html,http://www.ukpublicspending.co.uk/year_spending_2010UKmn_12mc1n#ukgs302,http://www.svt.ntnu.no/iso/jorn.rattso/Papers/jkjrpolcontrolofadm.pdf and http://www.logintanzania.net/docs/lgfr2007.pdf andrefertotheyears2010(UK,US),2007(Tanzania)and1990(Norway).2Theincreaseintransfersfromthecenterhasledtoabuiltupofbankdepositsbydistrictswhichmadetheabilitytospendthefinancialfundswiselyamajorconcern(LewisandOosterman2008).
3
ItisdebatablehoweffectivethedemocraticaccountabilitymechanismsinIndonesiaatthelocal level really are. There are indications that corruption, which was rampant underSuharto,hasnotdeclined significantlyafter thedecentralizationanddemocratizationbuthasratherbecomemoredecentralizedand lessorganized(Hill2012,Hofmanetal.2004,2009), and that the political process on the local level has been characterized partly bymoney politics and powerful local elites (Mietzner 2005, 2010). If the democraticaccountability mechanisms are compromised, local governments and bureaucracies maynotspendthemoneyinthebestinterestofthepopulace,i.e.onthepublicservicesneededmost,but ratheron increasing theperksof theoffice throughbetterandmorenumerousoffices and cars, more frequent travels, more staff etc. (cf. Niskanen 1971).3 This wouldexplain the high levels of administrative spending. Administrative overspending is awasteful activity for the benefits of officeholders and as such a sort of ‘legal corruption’withcorruptionbeingdefinedasmisuseofpublicofficeforprivategain.
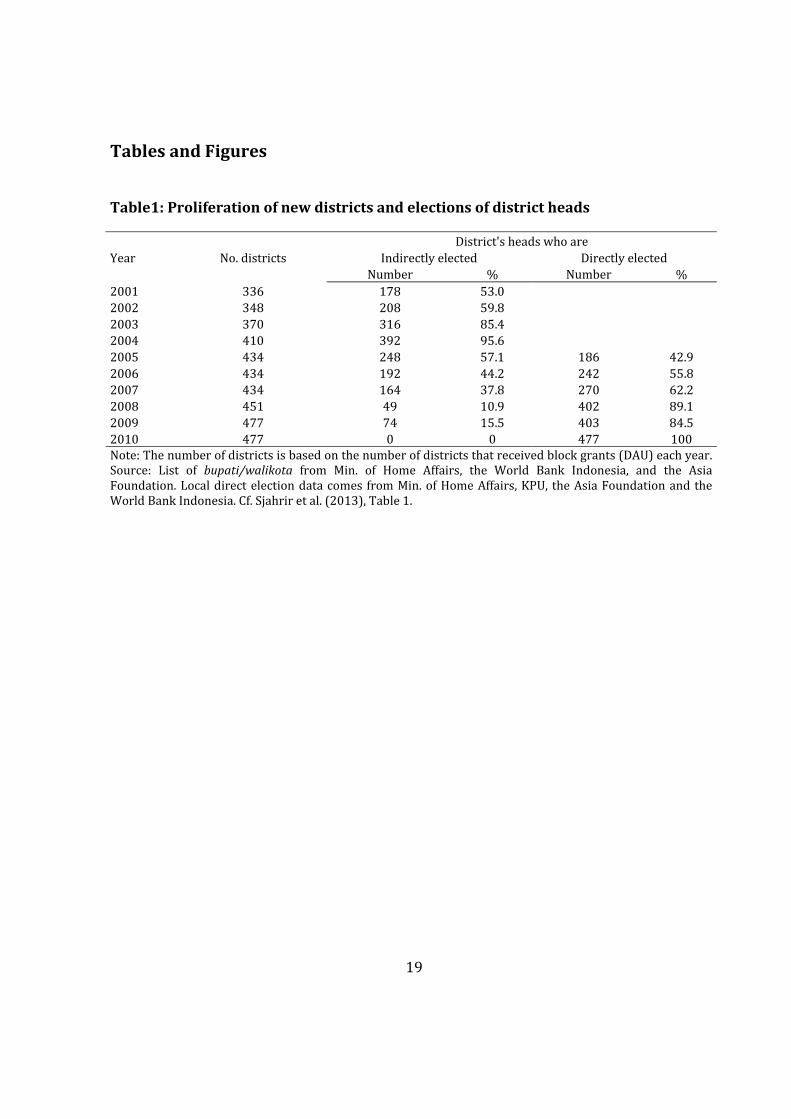
Anotherexplanationforthehighaveragespendingonadministrationmaybethecontinuedproliferation of new districts in Indonesia (Fitrani et al. 2005). The number of districtsincreased from 336 in 2001 to 477 in 2010. In principle, the proliferation of districts(pemakaran)couldberegardedasanenhancementof thehomogeneityof thepopulationwithinadistrict,allowingabettermatchingofpublicserviceswiththepreferencesofthepopulation.Burgessetal. (2012),however,arguethattheemergenceofnewdistricts isaconsequence of rent‐seeking activities of local elites rather than a strive to enhance theefficiencyofgovernmentservices.Iftheestablishmentofnewdistrictsentailedlargesetupcosts for the new administration, average administration expenditures would besignificantlyhigherthanwithoutpemakaran,butthiswouldnotnecessarilypointtowardsadministrativeoverspendingduetolackingaccountability.4
This paper looks into the determinants of administrative overspending of localgovernments inIndonesia. Inparticular,weanalyzewhetherthestepwise introductionofdemocratic accountability channels through the election of district heads by the localparliamentsandsubsequentlydirectlybytheelectorateshasledtoreducedadministrative
3 Kis‐Katos and Sjahrir (2013) show that local governments have adopted a more needs‐based spendingpattern after decentralization. They analyze the spending pattern on core public services, but not on localadministration.Astrongerneedsorientationinthespendingoflocalgovernmentsonservicesthusneedsnotcontradictapersistentlyhighspendingontheownadministration.4TheproliferationofdistrictsmaystillbeexcessiveasarguedbyBurgessetal.(2011).
4
spending.5Asthetimingofdirectandindirectelectionsvariesexogenouslyacrossdistricts,suchaneffectwouldbewell identified.Weinvestigatewhetherdifferences in formalandinformalaccountabilitymechanismsacrossdistrictsmaysystematicallyexplaindifferencesinadministrativespendinglevels.Wealsolookatthepartycompositionandthedegreeofpolitical concentration in the local parliament (DPRD) and study whether educationalprofiles affect the degree of overspending. In addition and take the ethnic‐linguisticcomposition at the district level into account. Lastly, we analyze to what extent theproliferationof newdistricts has changed the amount and compositionof administrativeoverspendingovertime.
Our paper is the first to analyze administrative overspendingof Indonesian districts andamong the first to analyze this phenomenon in decentralized developing countries.6Existing literatureon localgovernmentadministrativeoverspending issparseandmostlyrelatedtoselecteddevelopedcountries(Rongen1995,KalsethandRattsø1998,Borgeetal.2008onNorway,Revelli2010onEngland).ThepaperthatcomesclosesttooursisLewis(2006),whoanalyzestheinefficiencyofIndonesiandistricts’taxadministrationandshowsthatindirectlyelecteddistrictheadsdonotperformbetterthanappointedones.Hisfocusisthus much narrower than ours as tax administration is only a small part of totaladministrative expenditures.This lackof research is astonishing, given that a substantialnumberofdevelopingcountrieshavedecentralizedwiththeaimofimprovinggovernancequalityand that excessiveoverspending at the local level could severely compromise thesuccessofsuchdecentralizationreforms.Moreover,thereisasubstantialbodyofliteraturewarning against local capture (Bardhan and Mookherjee 2000, 2006, Reinikka andSvensson 2004, Galasso and Ravallion 2005, and others), of which administrativeoverspendingisanimportantvariant.Ourpaperthuscontributestotheempiricalliteratureondecentralizationindevelopingcountries(e.g.Prud’homme1995,Bradhan2002)aswellastothatonlocalcapture(seeabove).
Indonesia is a particularly interesting case to study the phenomenon of excessiveadministrative spending at the local level, not only because of its sheer importance:Indonesia is the fourthbiggestcountry intheworld, the third largestdemocracy,andthesecondlargest inthedevelopingworld.More importantly, it isayoungdemocracywithahistoryofweakinstitutionsandhighlevelsofcorruption,especiallyacorruptcivilservice
5WangandYao (2007)show that electionsofvillage committees in ruralChinahave led to a reduction inadministrativeexpendituresandincomegiventotownshipgovernments.6Lewis(2005)analyzesfiscalbehaviorofdistrictsafterdecentralizationbutdoesnotanalyzetheefficiencyofadministrationortheextentofadministrativespending.
5
(McLeod2005),andhasrecentlyexperienceda‘bigbang’decentralizationwithadramaticshift of power from the center to the regions (Hofman and Kaiser 2004). Thesecircumstancesallowus toanalyze towhatextent thedualreformofdemocratizationanddecentralization, both rapid and fundamental, have improved governance quality asmeasuredbytheamountofresourcesspentonbureaucracyandgovernment itselfratherthanonservicesforthepeople.7
Our results indicate that accountabilitymechanisms areweak at the local level and thatdemocratization has not yet contributed significantly to the reduction in wasteful localgovernmentspendingonitsownadministration.Thecreationofnewdistrictshasledtoatemporary shift in the subcomponents of administrative spending but not to a sustainedhigheradministrativespendingpercapita.Pemakaranthuscannotexplainthehighlevelsofadministrative spending; instead lacking political accountability, which differs acrossdistricts, is the prime explanatory factor. Political concentration in the local parliamentleads to higher overspending compared tomore fragmented local parliaments. A highervoteshareforGolkar, thedominantpartyintheNewOrderera,issignificantlyassociatedwithhigheradministrativespending,too.Ourresultscontributetoanemergingviewthatdecentralization and democratization at the local level in Indonesia have yet to delivertangible results in terms of better governance (Hill 2012, Lewis 2010, Mietzner 2010).While theseanalysesarewell informed, theydonot restonsoundeconometricanalyses.Ourpaperaimsatfillingthisgap.
The paper proceeds as follows. Section 2 provides background information ondecentralizationanddemocratizationatthelocallevelinIndonesia.Section3presentsthedataandtheempiricalapproach,Section4discussestheresults,andSection5concludes.
The Indonesian decentralization process has lead to unprecedented and large scaledevolutionofauthorityfromthecentertothedistricts.Since2001,thelocalgovernmentsof
the regencies (kabupaten) and cities (kota) have gained considerable administrative,political, and fiscal autonomy.8 Administrative decentralization devolved the majority ofpublicserviceresponsibilitiestoprovincialandlocalgovernments.Thecenterretainedthefunctions of defense, security, justice, foreign affairs, fiscal affairs, religion, forestry, andcurrencyand transferredtherestof the functionsto thedistricts.Theprovincesreceivedmainly coordinating and backstopping powers and remained directly responsible to thecenter.Law22/1999alsostipulatedthatdistrictswereresponsibleforthesectors(bidangpemerintahan wajib) health, education, public works, environment, communications,agriculture, industry and trade, investment, land, cooperatives, manpower, andinfrastructure.
During Suharto’s New Order regime, political parties were limited to three and heavilyregulated.Districtheadswereeffectivelyappointed.In1999,atotalof48politicalpartiesparticipatedinthefreeelectionwith21ofthemgainingseatsinthecenterparliamentand45 in at least one of the 292 districts’ parliaments.9 Decentralization law 22/1999 gavethesenewlydemocraticallyelectedlocalparliamentstherighttoelecttheheadsofthelocalgovernments (Bupati inKabupaten andWalikota inKota). The incumbent district headswereallowedtoservetheirfullterms,whichcametoanendatdifferentpointsintimeasthey had been appointed at different times under Suharto. In 2004, the reviseddecentralization law on regional autonomy (Law 32/2004) prescribed that the heads oflocal governments should be directly elected by the local population (Pilkada).10 Thesedirectelectionswereexpectedtoincreaseelectoralaccountabilityatthelocallevelandthusimprove local governance. The first batch of direct elections took place in 2005;subsequently, all indirectly elected district heads were gradually replaced by directlyelectedonessinceallincumbentswereallowedtofinishtheirfive‐yearterms.11Aswiththeindirectelections,thetimingofthedirectelectionswashistoricallypredetermined,whichallows a clear identification of the potential accountability effects of indirect and directelections(cf.Table1).
8 The legal framework for decentralization was laid out by law 22/1999 on regional autonomy and law25/1999onintergovernmentalfiscalrelations.9Source:HomepageofGeneralElectionCommission(KPU),http://www.kpu.go.id.12outof45partiesgainedonlyoneseatinlessthanfivedistrictparliaments.10Thesamelawalsoincreasedthecentraladministrativecontroloflocalplanningandbudgetingbygivingtheprovinces supervisory (instead of coordination) powers. In addition, the center also revised thedecentralizationlawonintergovernmentalfiscalrelations(Law33/2004).11Districtheadswereappointedfor5yearswithonepossiblereappointmentintheoldregime(law5/1974).Thetermlimitof5yearswaskeptinnewerregulationandlocalgovernmentheadsremainedlimitedtotwoconsecutiveterms(Art.234oflaw32/2004).
7
Despite these electoral reforms, rent‐seeking behavior continued. After 1999,many localparliamentsusedtheirnewlyacquiredpowertodemandmoneyfromaspiringcandidatesinexchangeofvotes (Buehler2010).The introductionofdirectelections in2004didnotstopthisrentseekingbehavior.Insteadoflocalparliaments, it isnowthepoliticalpartieswho sell their nomination to aspiring candidates (Mietzner 2005,Buehler andTan2007,Lindsay 2009, and Buehler 2010). This resulted in random candidate‐political partyrelationships and to some extent in random coalitions among parties (Mietzner 2005,2010). This relationship often ended after the election, thus creating difficulties forconstituents to hold political parties and eventualwinner accountable (Buehler and Tan2007).
Administrative decentralization resulted in a large increase in the number of localgovernments(from292in1999to477in2010,cf.Table1).Thesplittingofadministrativeunits, the so‐called pemakaran or “blossoming” of districts, was a bottom‐up process, inwhichtheproposalcamefromthe“child”districtwithpriorapprovalfromtheoriginating(or “parent”) district’s government and parliament (Government Regulation or PP129/2000).12 The proposed new district had to meet a set of technical requirements,13however, itwasunclearhoweffective theevaluationprocesswas (Fitrani et al.2005) assome of these newly created districts seemed to lack the infrastructure to deliver publicservices (Decentralization Support Facility 2007). The splitting districts phenomenonseems to have been driven by fiscal incentives but also followed ethnic and politicaldivisions and interests to capture natural resources (Fitrani et al 2005). The revisedgovernment regulation (PP 78/2007) introduced more technical requirements and astricter application procedure and approval process. In 2010, President Susilo Bambang
12Theproposalmustincludeevidenceofpublicsupportandinitialtechnicalresearch.Itwassentthroughtheprovince to the central government (Min of Home Affairs and Regional Autonomy Advisory Council orDPOPD)whichwouldevaluatethetechnicalrequirementsandgiverecommendationstothePresident.Basedontheserecommendations,thepresident,togetherwiththecentralparliament,wouldpassthelawtocreatethenewdistrict.13Thetechnicalrequirements:i)economicperformance,measuredbyGRDPandOwnSourceRevenue(PAD);ii) district’s potential, measured by available resources and infrastructure for financial and economicactivities, education, health, transportation and communication, and tourism and manpower; iii) district’ssocio‐culturalcondition,measuredbyavailableinfrastructureforreligious,socio‐cultural,andsportactivities;iv) socio‐political condition,measured by political participation of the public and people’s organization; v)technical indicators such as population, area, and minimum number of sub‐districts (see GovernmentRegulationPP129/2000).
Fiscaldecentralizationpredominantlyaffectedtheexpendituresideofthedistrictbudgets,while most taxes remained centrally set and administered. It resulted in a substantialincrease in the central government’s transfers to the regions: the formula‐based GeneralAllocation Grants (Dana Alokasi Umum/DAU), the earmarked Special Allocation Grants(DanaAlokasiKhusus/DAK), shared tax revenue, and shared (non‐tax) natural resourcesrevenue. These transfers are collectively aimed to equalize the fiscal capacity acrossdistricts, subject to their needs and capacity, in order to provide basic public services(World Bank 2003). By 2007, 36 percent of total Indonesian government expenditureswere carried out by the local governments,which, however, collectedonly 10percent oftotal government revenues (World Bank 2007). Moreover, while central transfers wereearmarkedtospecificpurposesbeforedecentralization,starting in2001,districtsbecameconsiderably freer inallocating theirexpenditures subject to thegeneral requirementsoflocalpublicserviceprovision.
Districts’ public expenditures more than doubled from 2001 to 2007 and rose furthersteeply in 2008 and 2009. Despite this overall increase, the share of administrativeexpenditures did not decline notably. On average, the government administration sectorreceived30percent of total public expenditure. This is double the average allocation forinfrastructure (15 percent) and around 4 percent less than the average allocation foreducation(34percent),makingitthesecondhighestbudgetitemfrom2001to2009(seeFigure1).
Our dataset includes 418 districts in Indonesia for the period from 2001 to 2009. Wecreated an unbalanced panel dataset in order to include both the parent and the childdistrictsresultingfromthesplittingphenomenon.WeexcludedtheprovincesofNanggroeAcehDarussalam,Papua, andPapuaBaratdue to the significantnumberofmissingdata.The capital, DKI Jakarta, was also excluded because the districts in Jakarta are notautonomous.Thetimeperiodisrestrictedbydataavailability;ourmainsourceofdistrictgovernments’ fiscal data is theDatabase for Policy and Economic Research (DAPOER) ofThe World Bank Indonesia. It contains expenditure data classified according to theeconomic categories staff, capital, goods and services, and other administrativeexpenditures.
Ourdependentvariable is thenatural logarithmofper capitapublic expenditureson thegovernment administration sector. We define administrative expenditures as allexpenditures that are incurred to administer the local governments. According to thisdefinition, we take the expenditure items classified under government generaladministration section (coded 1 in DAPOER). This expenditure category contains thefollowing expenditure items reported under general government administration (BagianUrusanUmumPemerintahan)basedonthelawKepmendagri29/2002andtherevisedlawPermendagri13/2006:15generalgovernment(pemerintahanumum),developmentplanning(perencanaanpembangunan), unity and local politics (kesatuanbangsadanpolitikdalamnegeri), personnel (kepegawaian), people and villages empowerment (pemberdayaanmasyarakat dan desa), statistics (statistik), archive (kearsipan), and communication andinformatics (komunikasi dan informatika). All these functions are performed by thegovernmentadministrations.
Byfarthebiggestshareoftheseadministrativeexpenditurespertaindirectlytotherunningof the general government: in 2007, 86 percent of total government administrationexpenditures were spent on general government while the other functions, includingdevelopment planning, received less than 5 percent (see Table A1 in the appendix). The
15 These are government regulations that regulate local governments’ budget reporting formats. TheexpenditureitemsarecalledobligatoryrolesorurusanwajibinPermendagri13/2006.
10
general government includes the offices of the Secretariats of Local Governments(SekretariatDaerah/Sekda), LocalParliaments (DewanPerwakilanRakyatDaerah/DPRD),the Local Revenue Offices (Dinas Pendapatan Daerah/Dispenda), the Local FinancialManagement Offices (Badan Pengelola Keuangan Daerah), Sub‐District offices (KantorKecamatan),aswellassomesmallerandlessimportantones.
Thecompositionofadministrativeexpenditureshasremainedfairlyunalteredthroughoutthestudyperiod.From2001to2007,staffexpendituresreceivedonaverage34percentoftotal government administrative expenditures, followed by goods and services (30percent),others(26percent),andcapital(10percent)(FigureA1).16
3.2.Controls
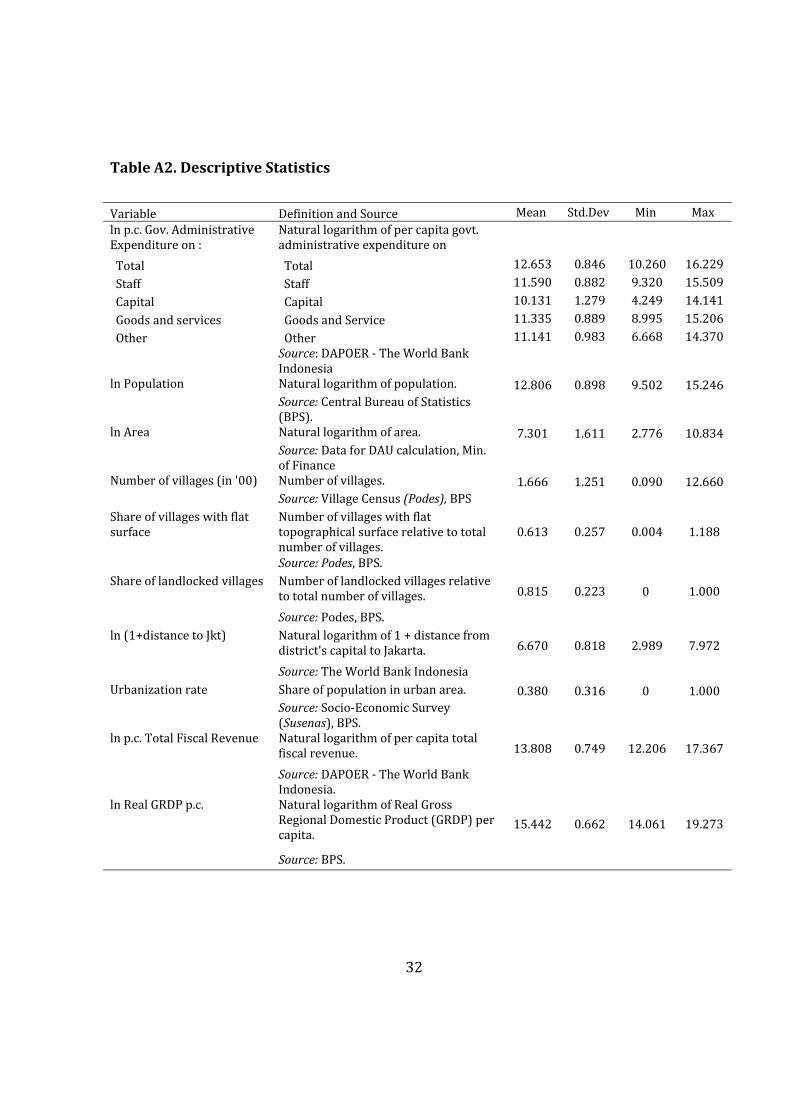
Thedeterminantsofadministrativeexpendituresinclude,first,factorsthatcapturethecostofanefficientadministrationandthusrefertothesize,geographyanddemographyofthedistrict, and, second, factors that explain to what extent the observed administrationexpenditures exceed the efficient level. The second set of determinants thus proxies theeffectivenessofformalandinformalaccountabilitymechanisms.Third,thedistrictrevenuemeasures the resources available to all government functions. Lastly, we control forsplittingdistricts.
Efficient administrative technology should exhibit strong economies of scale. We thusinclude population size as administrative expenditures per capita should decline withpopulation.Administrationshouldbemorecostlyindistrictsthataremorespreadoutandlessaccessible.We thus include the logarithmof thedistrictarea, thenumberofvillages,theshareoflandlockedvillagesandofthosewithflatsurface.Whilecostsshouldrisewiththe area and the number of villages, the share of landlocked villages and thosewith flatsurfaceshoulddecreasecostsashillyterrainandislandsinthearchipelagoeitherrequireoutpostsormore costly travel thanvillages accessibleby land.Urbanization could eitherincreaseorreduceadministrativespending:closerproximityshouldreduceadministrative
16While inspecting the data, we found some inconsistencies in the economic classification of governmentexpenditures, which resulted in overestimated administrative expenditure figures. The most commonproblemwasamisclassificationofexpendituresforstaffinothersectors(especiallyeducation)undergeneraladministrationexpenditures.Thisproblemwasespeciallypronouncedinthefirstyearsafterdecentralization,which suggests that administrative incapabilitymight have been amajor issue behind this finding. After adetailed examination of the data and interviews with the World Bank team in Indonesia, we designed aprocedure that dropped 68 out of 2812 observations thatwere obviously subject tomisspecification (seeAppendixAfordetails).
11
costs while, at the same time, urban environments pose additional administrativerequirements,therebyincreasingthecosts.AlargerdistancetoJakartamayincreasecostsas itmay capture less oversight of the center and thusmore discretionary scope and astraveltothecapitalmaybemoreexpensive.Alargerdistancemayalsocapturelowerpriceandwagelevelstherebyreducingcosts.Higher levelsofeconomicactivityand income,asmeasured by real regional GDP per capita, may increase the demand for administrativeservices and the costs of factor and material inputs thereby increasing administrativeexpenditures.
Availableresourcesshouldpositivelyaffectspendinglevelsforallgovernmental functions,evenifthecoefficientforadministrativespendingshouldbesignificantlybelowunityforanefficient administration. We measure available resources by the amount of total fiscalrevenuespercapita,whichincludesownsourcerevenueaswellasrevenuesfromresourcesharingschemes(cf.Agustinaetal.2012).
Accountability mechanisms are captured by a number of variables. First, we include adummy that is one if the district headwas directly elected and zero otherwise to checkwhether direct elections have increased accountability and have led to less wastefulgovernmentspending.Wealsoincludetheinteractioneffectsofthisvariablewithliteracyrate and revenues per capita to allow for the accountability effect to depend on fiscalresourcesoreducationalprofileoftheelectorate.17Second,weincludetheliteracyratetocapturehoweducatedtheelectorateis,hypothesizingthatabettereducatedpopulacemayhold the incumbent accountable more effectively and that administrative spending maythus be lower. Literacy rates may potentially proxy for the importance of the electoralaccountability channel, but also for informal accountability mechanisms. Optimally, wewouldhavepreferredtoalsoincludemeasuresofmediapenetrationoverthetimeperiod,butwecouldnotfindconsistenttime‐varyinginformationonmediaavailability.Third,weinclude an indicator of resource‐rich districts, defined as districts that received naturalresourcessharedrevenue,as resource‐richcountriesor regionshavebeen found tohaveworseinstitutionsandhighercorruptionlevels(interalia,BhattacharyyaandHodler2010,vanderPloeg2011).18
17Wealsoincludedadummyvariableforindirectly(anddemocratically)electeddistrictheadsastherewerestillappointeddistrictheadsintheearlyyearsofoursampleperiod(cf.Table1).However,thisvariableneverturnedoutsignificant.18 The better fiscal endowment of resource‐rich districts is captured through the variable “log of totalrevenuespercapita”.
12
Fourth,forthereducedsampleofdistrictsthatdidnotsplitupoverourtimeframe,wecanalso investigate the relative importance of further political factors, like the partyconcentrationinandpartycompositionofthelocalparliaments.Sincewecannottracethecompositionoftheparliamentsindistrictsthatsplitupin‐betweenofelections,wecanonlymeaningfully collect this information for the non‐splitting districts.19We expect that theconcentration of political power in the parliament should reduce parliamentary controloveradministrativeexpenditures,whichshouldthusincreasewithpoliticalconcentration.Weapplytwomeasures:amajorityindicator,adummyvariablethatisoneifanypartyhasa vote share of more than 50 percent, and the Hirschman‐Herfindahl index of politicalconcentration in the local parliament. To account for different parties’ inclination toapproveexcessiveadministrativespending in thedistrict,wealsocontrol forvotesharesthatthemajorpartiesreceivedinthelocalelections.
Lastly,ourcontrolsfordistrictsplitsconsistofafullsetofsplittingdummies,markinguptofive years before the split‐up of a district and up to five years after the district split up.Moreover,wedifferentiatebetweentheafter‐splitting‐upeffectsfortheparentdistrictandthoseforthechilddistricts.DescriptivestatisticsforallvariablesarefoundinTableA2intheAppendix.
3.3.Empiricalmodels
We address the determinants of administrative expenditures by estimating pooled OLSregressions. We use an unbalanced panel of old and newly formed districts instead ofgroupingallnewlyformeddistrictswiththeiroriginalparentsandtreatingthemasasingleunit throughout the whole time period. This approach enables us to disentangle thebehavior of old and newly formed districts and allows a more precise tracking of thesplitting‐upentities.Weclusterstandarderrorsattheparentdistrictlevel,allowingforanunspecified form of serial correlation of disturbances as well as for a cross‐sectionalcorrelationbetweendistrictsthatusedtobelongtothesameentity.
Thebaselineestimatingequationrelatesthenaturallogarithmofpercapitaadministrativeexpenditures in thedistrictaswellas thesizeof itsmaincomponents, toa setofcontrolvariablesinthefollowingform:
lnEXPit=βXi+γZit+λt+f(sij)+εit, (1)
19Party compositionof theparliament should inprinciplebeavailablealso fornewly createddistricts andtheir parent districts. Yet, extensive field research showed that neither the election commission nor theMinistryofHomeAffairscompileandcollectthesedata.
13
whereweobserveup to i=1,…,477districts over nine years (t=2001,…, 2009). The timeinvariant factors Xi include geographic controls for scale and technology (area, share ofcoastaland flatvillages,distance to Jakarta).The timevariantcontrolsZitcapture furtherscale and technology variables (district population, number of villages, urbanization) aswell as fiscal and economic size variables (real per capita revenues, real GDPper capita,resource‐rich indicator) and literacy rates, and in a second set of regressions politicalvariables,suchaspartycompositionsorpartyconcentration.
We also include a full set of year indicators λt to capture common macroeconomic andpolicyshocks.Allmodelsincludeasetofsplitting‐upindicators,f(sij)=Σj−sij+Σj+sijp++Σj+sijc,(j=−4,..,5),whichrecordtheyearsbefore thesplit‐upofdistricts(sij−)aswellas theyearsfollowingthesplit‐upseparatelyfortheparent(sijp)andthechild(sijc)districts.Weexpectto see considerabledifferencesbetweenparentand childdistricts since in the latternewadministrative capacitiesneed tobebuilt, andhence investments into theadministrativeinfrastructureshouldbeconsiderablylargeratthebeginning.
Inasecondsetofregressions,werestrictourattentiontodistrictsthatdidnot(yet)splitup, which allows us to test for the effects of the political environment. We collectedinformationontheseatcompositionofeachlocalparliamentfor197districtsthatdidnotsplit between1999and2009and identified the concentrationofpartypowerwithin theparliament.
4.Results
4.1Baselineresults
Table2presentsthebaselineestimatesforthetotaladministrativespendingaswellasforthe four the economic classification: spending on staff, on capital goods, on goods andservices,andonother,unspecifiedpurposes.Thebaselineregressionsfocusondifferencesinadministrativetechnology.Asexpected,scaleeffectsplayasignificantroleinexplainingadministrativespending.Alltypesofpercapitaadministrativeexpenditures,exceptfortherather special “others” category, decrease with population size. A larger district areaincreasesthecostsofadministrationbutonlyintermsofinvestmentsincapitalandgoodsand services. For total administrative expenditures, estimates do not reach usualsignificancelevels.Thenumberofvillageshasapositivebutinsignificanteffectonoverall
14
costs andmost subcomponents.20 Administrative costs are also negatively related to theshare of flat and more easily accessible (landlocked) villages, although these effects arestatisticallysignificantonlyforthesecondvariable.Thedistancetothecenterplaysalessclear‐cut role: while other administrative expenditures are smaller in more remotedistricts, the expenditures on administrative staff become actually larger. Totaladministrative expenditures, as well as most of its subcategories, are larger in moreurbanized areas, except once again for the rather specific “other” category. This mightreflect the fact that more urbanized areas use partially different administrativetechnologiesandthusoptforcostlier/moresophisticatedadministrations.
Administrativeexpendituresalsoincreasewiththefiscalsizeandeconomicstrengthofthedistricts.All expenditure typeshave a close tounitaryelasticitywith respect to total percapitarevenues.Inotherwords,theyrisealmostproportionallywithavailableresources–districts do not realize economies of scalewith respect to fiscal resources. The fact thatfinancially better endowed districts have a larger share of unspecified expenditure (theelasticity exceeds 1) is alarming because district heads have more discretion over thiscategoryandhencecanuseitmoreeasilytodistributepoliticalrentsorfavors.21
Total administrative expenditures (and “others”) increase with the GDP per capita,indicating that districts with higher economic activity require a more sophisticatedadministration. Resource‐rich districts have higher administrative spending, but theseeffects are insignificant. Better education, as measured by the literacy rate, reducesspendinginthecategories“capital”and“others”,fortotaladministrativeexpendituresthiseffectisnotsignificant.
4.2.Proliferationofnewdistricts(Pemekaran)
Model(1)inTable2doesnotaccountforsplittingdistricts,whilemodels(2)to(6)includeafullsetofsplittingdummies:fourforthefouryearsprecedingthesplit,onefortheyearofthesplitand five for theyears followingthesplit, the latter twocategoriesseparately forthe newly created district (“child”) and the remaining district (“parent”). The estimatedvalues are shown graphically in Figure 2, separately for total expenditures and selected
20 The increase in other expendituresmay be a consequence ofmore costly elections,which are budgetedunderthiscategory.21Thisinterpretationissupportedbythefindingthatsignificantpoliticalbusinesscycles(PBC)exist inthisexpenditure category. These PBC exist only for direct elections and only if the incumbent is running forreelection,cf.Sjahriretal.(2013).
15
subcategories. The solid line connects the point estimates of the splitting dummies; theshadedareadepictsthe95percentconfidenceinterval.
Figure2a shows thatoverall administrative expendituresper capitadonot rise; splittingdummiesareallinsignificantlydifferentfromzero.Hiddenbehindtheseaggregatefiguresisaclearchangeinthespendingcomposition,especiallyforthechilddistrict.Fortheparentdistrict, staff expenditures increase in the year preceding the split in order to build uppersonnel tobe transferred to the childdistrict, theydecline tonormal levels in theyearafterthesplit.Capitalexpendituresdonotchangeinpercapitaterms.Incontrast,thechilddistricthasinitiallysignificantlylowerpercapitastaffexpendituresasitstillneedstohirecivilservants.Staffexpenditures increasesignificantly inyear fourand fiveafter thesplitand almost reach normal levels. Capital expenditures per capita are significantly higherafterthesplitasnewofficesinthenewdistrictcapitalhavetobesetupandequipped.Thiseffectstartstodeclineinthethirdyearafterthecreationofthenewdistrict.
This shift in expenditure categories, however, leaves the overall administrativeexpenditures ratherunchanged inper capita terms.22 Inotherwords, theproliferationofnew districts is unable to explain the high level of administrative expenditures. Lackingaccountability is thus the prime candidate for explaining the excessive spending of localgovernmentsonthemselvesratherthanonservicesfortheirpopulation.
4.3Accountabilitymechanisms
Theeffectivenessoftheaccountabilitymechanismscannotbeestimateddirectlyastheyarenot directly observable. But we can estimate whether changes in accountabilitymechanismsovertimeorvariationsinvariablesthatproxyaccountabilitychannelsacrossdistrictsandover timehadany significanteffecton theextentofoverspending.Wehavealreadyanalyzedtheeffectofvaryingliteracyrates,whichhasproducedweakevidenceforalimitingeffectofeducationonexcessivespending(cf.Table2).Wenowanalyzewhethertheintroductionofdirectelections,inwhichvoterscanholddistrictheadsaccountableforexcessiveoverspending,hasreducedadministrativeexpenditures.Ifsuchanaccountabilitymechanism was regarded as effective, rational district heads seeking reelection wouldanticipatesuchadiscipliningdeviceandthusspendless.
Theresultsareprovided inTable3.We focusontotaladministrativespendingasweareconcerned with the aggregate overspending as a measure of wasting public resources.Direct elections have no significant effect on administrative spending and the point
estimateisverysmall(model1);ifweincludeaninteractiontermwithliteracylevels,theeffectofdirectelectionsbecomespositiveandtheinteractioneffectnegative,asexpected,indicatingthatbettereducatedelectoratescanuseelectoralaccountabilitybetter.However,the estimated coefficients do not reach usual significance levels (model 3).We allow forheterogeneous effects of direct elections depending on the financial endowment of thedistrict. Indeed, our results show that direct elections increase administrative spendingsignificantlyindistrictswithrelativelylowfiscalendowmentsanddecreaseitfordistrictswith more fiscal resources and thus higher administrative spending (in the 4th and 5thquintileofthedistributionoffiscalresources,models4and5).23
WeoptedforpooledOLSbecausemanyimportantdeterminantsofadministrativespendingare time‐invariant and thus focusing on within variation would portray a too narrowpicture.Wedidhoweverrunafixedeffectspanelregressionasrobustnesscheck.ResultsarereportedinTableA3.Resultsforthevariablesthatareincludedinbothregressionsarequite similar in sign and significance, but not in all cases in magnitude. Notably thecoefficient forpopulation ishigher intheFEregressionsandtheonefor logofpercapitarevenue is lower, indicating that administrative expenditures are adjusted to largerpopulationandhigherrevenuesonlyovertime.
Table4presentstheeffectofparliamentcomposition.Ifapartyholdsadominantpositionin the local parliament (DPRD), which implies that the political process is not verycompetitive,electoralaccountabilityisweaker,otherthingsbeingequal.Partiessupportingthedistricthead,whoneedsapproval forhis/herbudgetarydecisionsby theDPRD,neednotfeartobepenalizedforagreeingtoexcessivespendingforadministrativepurposes.Wethereforeexpectelectoralaccountabilitytobeweakerandthusoverspendingtobehigherin districts with a less competitive political environment. We employ twomeasures forcompetitive environment – political concentration in the DPRD as measured by theHirschman‐Herfindahl index and a dummy variable that is one if one party received theabsolute majority of votes (majority indicator). Moreover, in order to test for differentinclinationsofpartiesforadministrativeoverspending,weusethevotesharesofthemain
23Wealsotestedwhetherdirectelectionshadadifferenteffectforthosebupatisandwalikotaswhocouldnotrun again, as they had served the previous term as indirectly elected district head andwere ineligible forreelection. (Districtheads facea limitof twoterms.)Theunderlyingrationale for this is thataccountabilityworkspredominantly through the threatofbeingvotedoutofofficeand thatan insignificantoveralleffectmaybetheresultofmixtureofasignificanteffectforfirsttermersandaninsignificanteffectforthosewhocannot run again.Yet, the inclusionof a last termdummy interactedwithdirect electionsdidnot turnoutsignificant.
17
political parties, Golkar, PDIP, PKB, and PPP. We also control for ethno‐linguisticfragmentationasthishasbeenshowntoincreaserent‐seeking(e.g.Alesinaetal1999,forasurveyseeAlesinaandLaFerrara2005).Asparliamentcomposition isavailableonly forthedistrictsthatdidnotsplit,werestrictouranalysistothisgroup.
Our results show that administrative spending increases significantly with politicalconcentration (model 3) and if a party commands amajority position (model 4). Also ahigher vote share for Golkar, the dominant party under Suharto rule, is significantlyassociated with higher administrative spending. Our results suggest that the politicalenvironment,parliamentarycompositioninparticular,isanimportantdeterminantfortheextent of wasteful spending. Ethno‐linguistic concentration seems to increase localadministrativespending,yetthiseffectisnotstatisticallysignificantinallspecifications.24
4.4.Travelexpenditures
Weanalyzeoneparticularspendingitem,whicharguablyisaspecialbonusforincumbentpoliticians and bureaucrats: expenditures for travel. This includes travels within thedistrict,butalsototheprovinceandnationalcapitalsorabroad.Becauseofchangesinthebudgetreportingformatatthedistrictlevel,wehavedataontravelexpendituresonlyforthe period 2001‐2006. Travel expenditures per capita increase significantly with thedistrict area, urbanization, and fiscal resources, as expected, anddeclinewithpopulationdue to economies of scale and the share of villages easily accessible by land. Table 4providestheresults.
Resource‐rich districts have higher travel costs,which is consistentwith the notion thatresource‐richjurisdictionshavelesserinstitutionalquality(resourcecurse,seeabove)andthus district administrations havemore discretionary scope to usepublic funds for theirbenefit.Asbefore, districtswithhigherpolitical concentration, adominatingparty, andalargervoteshareforGolkarallowstheircivilservantstospendmoreontravels.
5.Conclusion
InthispaperwehaveanalyzedtheexcessivespendingofIndonesiandistrictgovernmentson their own administration. Amounting to almost a third of the total budget,
24 The inclusion of the ethno‐linguistic fragmentation measure does not affect the estimates of the othercoefficients in any significantway. Again,we ranFE regressions,which are availableupon request. Theseestimates are less reliable as there is little variation in the political variables, which change only withelections,i.e.onlyonce.
18
administrativespendingisthesecondbiggestbudgetitemandconstitutesinthatorderofmagnitudealargemisallocationofpublicresources.Wecouldexcludetheproliferationofnew districts as a reason for these high levels of administrative spending. Instead, weregardthemasamanifestationofpoorgovernanceandthusoflackingaccountabilityatthelocal level. Since accountability mechanisms are not directly observable for such largenumber of districts, we exploited variations of proxies for formal and informalaccountability mechanisms across districts and time. We found weak evidence foreducationlevelstomatter.Theintroductionofdirectelectionsofdistrictheadsdidnothavea significantly favorable effect on administrative spending for the entire sample. Uponcloserinspectionwecouldidentifythatdirectelections increasedadministrativespendingfordistrictsthatarefinanciallynotwellendowedandreduced it forthericherones(thathavehighadminspendinglevelstobeginwith).Overalltheintroductionofdirectelectionschangedlittleforthebetter.
Our result underscores thenotion that institutional changeneeds tobe encompassing togenerate the desired effect. It may simply not be sufficient to change one institutionalregulation, even if it is a core one, if the general environment has changed little and theactorsseenoincentivesforchangingtheirbehavior.Foraccountabilitytoworkatthelocallevel,thepoliticalsystemhastobetrulycompetitive.Thisiswhatoursecondsetofresultsprovides evidence for: in districtswith little political competition, asmeasured by partyconcentration or the existence of a dominant party in the local parliament, thewaste ofpublic resources is even worse. More transparency of and higher competition in thepoliticalprocessaswellaslowerbarrierstoentryinthepoliticalmarketmaybeimportantelements in improving the formal accountability mechanism. In particular it would bedesirable to allow independent candidates to run for the office of district heads as thiswould break the parties’ monopoly to nominate candidates, which they use to extractrewards from hopeful candidates in exchange for their nomination (Mietzner 2010).Successful candidates will seek to recover these “entry fees”. Higher budgetarytransparencyandcompetitivelocalmediawouldputtheissueofexcessiveadministrativeexpenditureson thepoliticalagenda.Even ifour resultsmaydisappointhopes inarapidimprovementofgovernancequality throughdecentralizationanddemocratization,a littlemorethanadecadeintodemocratizedanddecentralizedIndonesia’shistory,itmaybetooearlytohanddownthefinalverdictonthesuccessorfailureofthesereforms.Thebestmaybeyettocome.
Number % Number %2001 336 178 53.02002 348 208 59.82003 370 316 85.42004 410 392 95.62005 434 248 57.1 186 42.92006 434 192 44.2 242 55.82007 434 164 37.8 270 62.22008 451 49 10.9 402 89.12009 477 74 15.5 403 84.52010 477 0 0 477 100Note:Thenumberofdistrictsisbasedonthenumberofdistrictsthatreceivedblockgrants(DAU)eachyear.Source: List of bupati/walikota from Min. of Home Affairs, the World Bank Indonesia, and the AsiaFoundation.Localdirectelectiondatacomes fromMin.ofHomeAffairs,KPU, theAsiaFoundationandtheWorldBankIndonesia.Cf.Sjahriretal.(2013),Table1.
(0.179) (0.178) (0.267) (0.418) (0.229) (0.323)Timeeffects yes yes yes yes yes yesSpliteffects no yes yes yes yes yesR‐squared 0.917 0.843 0.705 0.869 0.651 0.916Note:Allmodelsareestimatedbyunbalancedpaneldata(PooledOLS).Robuststandarderrorsclusteredatthe parent‐district level are reported in parentheses. The number of districts is 399, the number ofobservations1889.***,**,*denotesignificanceatthe1,5and10%level.
Notes:AllmodelsareestimatedbypooledOLSregressionsforunbalancedpaneldata.Robuststandarderrors,clustered at the parent‐district level are reported in parentheses. The years observed are 2001‐2006. Thesample is restricted to districts that did not split between the 1999 and 2004 elections. The number ofdistrictsis197,thenumberofobservations905.***,**,*denotesignificanceatthe1,5,and10%level.
Notes:Thefiguremapsannualtotalp.c.expendituresbysectorforthesampleofthe418Indonesiadistrictswithfulldata.Otherscategoryincludesthefollowingsectors: public law and order, economy, environment, housing and publicfacilities,tourismandculture,religiousaffairs,andsocialprotection.Source:DAPOER–WorldBankIndonesia.
-4 -3 -2 -1 0 1 2 3 4 5Timing before and after split
Parent
-.3
-.2
-.1
0.1
.2E
stim
ated
coe
ffici
ents
-4 -3 -2 -1 0 1 2 3 4 5Timing before and after split
Child
Splitting Districts Effect to Gov. Admin. Staff Exp.
-.3
-.1
.1.3
.5.7
.91.
11.
31.
5E
stim
ated
coe
ffici
ents
-4 -3 -2 -1 0 1 2 3 4 5Timing before and after split
Parent
-.3
-.1
.1.3
.5.7
.91.
11.
31.
5E
stim
ated
coe
ffici
ents
-4 -3 -2 -1 0 1 2 3 4 5Timing before and after split
Child
Splitting Districts Effect to Gov. Admin. Capital Exp.
Notes: The figures map coefficient estimates and confidence intervals of dummyvariables for parent and child districts indicating the timing before and after thesplitforthesampleofthe384Indonesiadistrictswithfulldata.Source:dataonnewdistrictsisbasedonnumberofdistrictsreceivedDAUineachyear,MinofFinance.
29
AppendixA:Datacleaning
The inspection of the data showed some obvious misspecifications of expenditures inwrong expenditure categories, especially in the years following the change in accountingstandards for local governments. We corrected these obvious misspecifications ofadministrativeexpendituresbyidentifyingtheoutliersusingasetofstatisticalcriteria.Weproceeded in three steps. First, we identified outliers in administrative expenditures forthosedistricts that hadmisclassified the teachers’ salary as administrative expenses. Forthis purpose,we excluded all observations forwhich 1. the share of administrative staffexpenditurestototalexpenditureswereatleasttwostandarddeviationsabovethesamplemean,andforwhichatthesametime2.theshareofeducationalstaffexpenditurestototalexpenditureswasatleasttwostandarddeviationsbelowthemean(RuleI).
Inasecondstep,wetriedtomakesurethatallexcludedobservationsaretrulyoutliersanddonotonlyreflect lowteachers’salariesbecauseof lowpupilnumbers.Thus,wekeptallobservations in the sample (irrespective of whether they fulfilled Rule I), for which perpupilexpenditures rangedabove thesamplemedian (Rule II).Wedefined thenumberofpupils based on Susenas, a household dataset representative at the district level,, whichrecordsthetotalnumberofstudentsenrolledinprimary,andjuniorandseniorsecondaryschools.
In a third step, we repeated the above procedure to check for similar misspecificationsbetweenthehealthandadministrativesector,applyingRuleIalsotothesalariesofhealthstaff(doctorsandnurses)(RuleIII).ByfollowingRulesItoIII,wedroppedatotalof68outof2812observations.
Notes:Thefiguremapsyearlytotalp.c.administrativeexpenditures(accordingto their economic classification) for the sample of the418 Indonesia districtswithfulldata.Source:DAPOER–WorldBankIndonesia.
Note:Thenumberofobservationsis1889for399districtsfrom2001‐2009.Thenumberofobservationsforpoliticalindicatorsfromelectiondatais1039from197districtsthatdidnotsplitandforwhichelectiondataand ethnic‐linguistic concentration data are available. The number of observations for governmentadministrativeroutineexpenditureontravelis1333from384districtsfrom2001‐2006.
Bardhan, Pranab (2002) Decentralization of Government and Development, Journal ofEconomicPerspectives,16(4):185‐205.
Bardhan, Pranab and Mookherjee, Dilip (2000) Capture and governance at local andnationallevels.AmericanEconomicReview90:135–139.
Bardhan, Pranab and Mookherjee, Dilip (2006) Decentralisation and Accountability inInfrastructureDelivery inDeveloping Countries,Economic Journal, 116(508): 101‐127.
Bhattacharyya, Sambit and Hodler, Roland (2010) Natural resources, democracy andcorruption,EuropeanEconomicReview,54(4):608–21.
Borge,Lars‐Erik,TorbergFalchandPerTovmo(2008)Publicsectorefficiency:therolesofpolitical and budgetary institutions, fiscal capacity, and democratic participation,PublicChoice,136:475–495
Buehler,MichaelandPaigeJohnsonTan(2007)Party‐candidaterelationshipsinIndonesianlocal politics: a case study of the 2005 regional elections inGowa, South Sulawesiprovince,Indonesia,84:41‐69.
Buehler, Michael (2010), Decentralisation and local democracy in Indonesia: themarginalizationof thepublic sphere?, in:Problemsofdemocratization in Indonesiaelections, institutions and society, eds. Edwards Aspinall and Marcus Mietzner,InstituteofSoutheastAsianStudies,Singapore:267‐287.
Burgess, Robin, Matthew Hansen, Benjamin Olken, Peter Potapov and Stefanie Sieber(2012)The Political EconomyofDeforestation in theTropics,Quarterly JournalofEconomics,1707‐1754
Decentralization Support Facility (2007), Costs and benefits of new region creation inIndonesia:Finalreport,DecentralizationSupportFacility,Jakarta.
Fitrani,Fitria,BertHofmanandKaiKaiser(2005)Unityindiversity?Thecreationofnewlocal governments in a decentralizing Indonesia, Bulletin of Indonesian EconomicStudies,41(1):57‐79.
Hill, Hal (2012) ‘Corruption and development: the Indonesian experience’, in S. Khoman(ed.),AScholarforAll:essaysinhonourofMedhiKrongkaew,ThammasatUniversityPress,Bangkok:150–64.
Hofman, Bert and Kai Kaiser (2004) The Making of the Big Bang and its Aftermath: APolitical Economy Perspective, in J. Alm, M.V. Jorge and S.M. Indrawati (eds.)Reforming Intergovernmental Fiscal Relations and the Rebuilding of Indonesia,Cheltenham:EdwardElgar.
Indonesia Corruption Watch and Lembaga Bantuan Hukum (LBH) Jakarta, (2012)MembongkaruangharampemilukadaDKIJakarta2012[ExposureofillegalfundofdirectlocalheadelectionDKIJakarta2012].Pressrelease,22May2012.
Kis‐Katos, Krisztina and Bambang Suharnoko Sjahrir (2013) The impact of fiscal andpolitical decentralization on local pubic investments in Indonesia. IEP DiscussionPaperSeriesNo.25,UniversityofFreiburg,Freiburg.
Lewis, Blane (2005) Indonesian Local Government Spending, Taxing and Saving: AnExplanation of Pre‐ and Post‐decentralization Fiscal Outcomes, Asian EconomicJournal,19(3):291‐317.
Lewis, Blane (2006) Local government taxation: An analysis of administrative costinefficiency,BulletinofIndonesianEconomicStudies,42(2):213‐233.
Lewis, Blane (2010) Indonesian Decentralization: Accountability Deferred, InternationalJournalofPublicAdministration,33(12):648—657.
Lewis, Blane and Oosterman, A. (2008) The impact of decentralization on sub‐nationalgovernmentfiscalslackinIndonesia,PublicBudgetingandFinance29(2):27–47.
Lindsay, Jennifer (2009) Pomp, piety and performance: Pilkada in Yogyakarta 2005, inDeepeningdemocracy in Indonesia?Direct elections for local leaders (Pilkada), eds.
37
Maribeth Erb and Priyambudhi Sulistiyanto, Institute of Southeast Asian Studies,Singapore:211‐229.
McLeod, Ross (2005) The struggle to regain effective government under democracy inIndonesia,BulletinofIndonesianEconomicStudies,41(3):367–86.
Mietzner, Marcus (2010) Indonesia’s direct elections: empowering the electorate orentrenchingtheneworderoligarchy?In:Aspinall,E.,Fealy,G.(eds.),Soeharto’sNewOrderanditsLegacy.ANUEPress,Canberra,pp.173–190.
Reinikka, Rivta and Svensson, Jacob (2004) Local capture: evidence from a centralgovernment transfer program in Uganda, Quarterly Journal of Economics, 119(2):679–705.
Rongen, Gunnar (1995) Efficiency in the Provision of Local Public Goods in Norway,EuropeanJournalofPoliticalEconomy,11:253‐264.
World Bank (2003) Decentralizing Indonesia: A regional public expenditure reviewoverviewreport,WorldBank,Jakarta.
World Bank (2008) Spending for Development: Making the Most of Indonesia’s NewOpportunities, Indonesia Public Expenditure Review, 3rd ed., World Bank,WashingtonDC.