ADMINISTRATIVE SCHOOL DISTRICT NO. 1 (BEND – LA PINE SCHOOLS) DESCHUTES COUNTY, OREGON 520 NW Wall St Bend, OR 97703 COMPREHENSIVE ANNUAL FINANCIAL REPORT FOR FISCAL YEAR ENDED JUNE 30, 2015 Prepared by the Business Office Brad Henry – Chief Operations & Financial Officer
Transcript
ADMINISTRATIVE SCHOOL DISTRICT NO. 1
(BEND – LA PINE SCHOOLS)
DESCHUTES COUNTY, OREGON
520 NW Wall St
Bend, OR 97703
COMPREHENSIVE ANNUAL FINANCIAL REPORT
FOR FISCAL YEAR ENDED JUNE 30, 2015
Prepared by the Business Office
Brad Henry – Chief Operations & Financial Officer
Administrative School District No. 1 Deschutes County, Oregon Financial Statements Table of Contents
i
TABLE OF CONTENTS --------------------------------------------------------------------------------------------------- i INTRODUCTORY SECTION Letter of Transmittal --------------------------------------------------------------------------------------------- iv ASBO Notification of Award for Excellence in Financial Reporting -------------------------------- ix
GFOA Certificate of Excellence in Financial Reporting ------------------------------------------------- x Organizational Chart -------------------------------------------------------------------------------------------- xi Principal Officials ------------------------------------------------------------------------------------------------- xii FINANCIAL SECTION INDEPENDENT AUDITORS’ REPORT -------------------------------------------------------------------- 1 MANAGEMENT’S DISCUSSION AND ANALYSIS ----------------------------------------------------- 4 BASIC FINANCIAL STATEMENTS Statement of Net Position ------------------------------------------------------------------------------------- 15 Statement of Activities ----------------------------------------------------------------------------------------- 16 Balance Sheet Governmental Funds ---------------------------------------------------------------------- 17 Reconciliation of Governmental Funds Balance Sheet to Statement of Net Position -------------------------------------------------- 18 Statement of Revenues, Expenditures and Changes in Fund Balances Governmental Funds ----------------------------------------------------------- 19 Reconciliation of the Statement of Revenues, Expenditures and Changes in Fund Balance of Governmental Funds to the Statement of Activities ---------------------------------------------------------------------- 20 Statement of Revenues, Expenditures and Changes in Fund Balance Budget to Actual – General Fund and Special Revenue Fund ------------------------------------------------------------------------------ 21 Statement of Net Position Fiduciary Fund – Private Purpose Trust Fund ----------------------- 23 Statement of Changes in Net Position Fiduciary Fund – Private Purpose Trust Fund ------ 24 Notes to Financial Statements ------------------------------------------------------------------------------- 25 REQUIRED SUPPLEMENTARY INFORMATION Schedule of Funding Progress - OPEB ------------------------------------------------------------------- 52 SUPPLEMENTARY INFORMATION
Description of Fund Types ------------------------------------------------------------------------------------ 53 Combining Schedule of Assets, Liabilities and Fund Balance
General Fund Sub Funds (GAAP Basis) ------------------------------------------------------------------------------------------ 54
Administrative School District No. 1 Deschutes County, Oregon Financial Statements Table of Contents
ii
Combining Schedule of Revenues, Expenditures and Changes in Fund Balance General Fund Sub- Funds (GAAP Basis) --------------------------------------------------------------------------------- 56
BUDGETARY COMPARISONS
Schedule of Revenues, Expenditures and Changes in Fund Balance Budget to Actual –
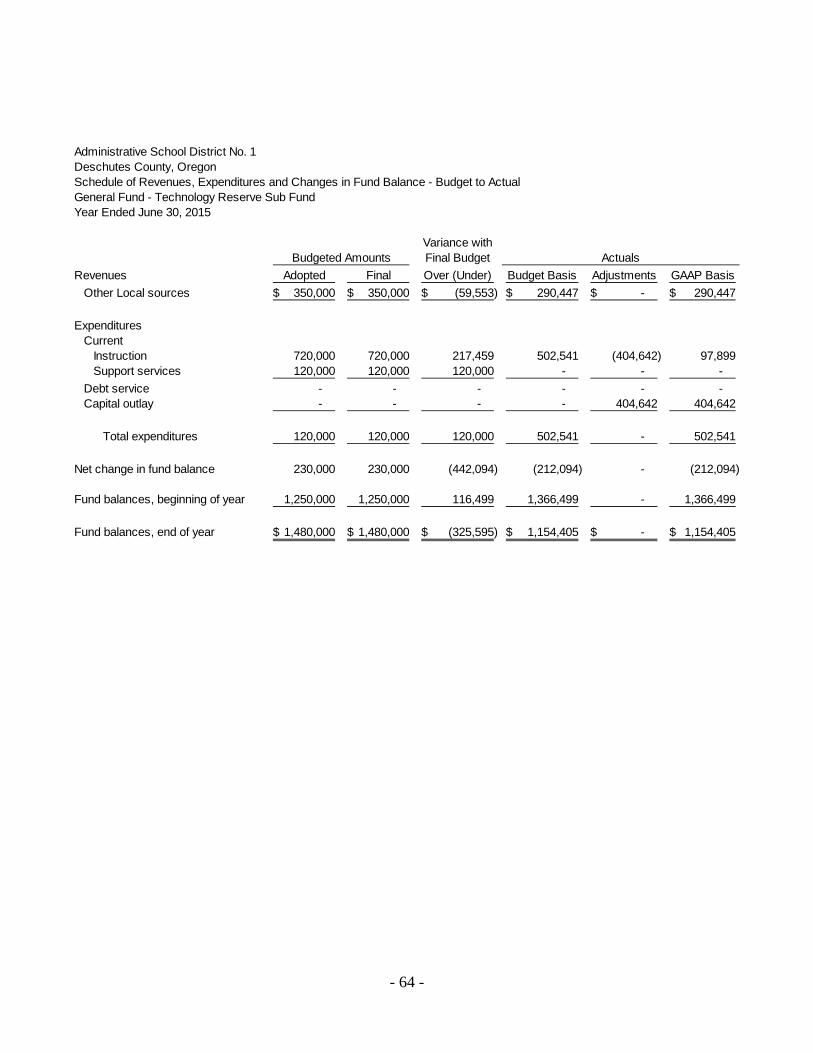
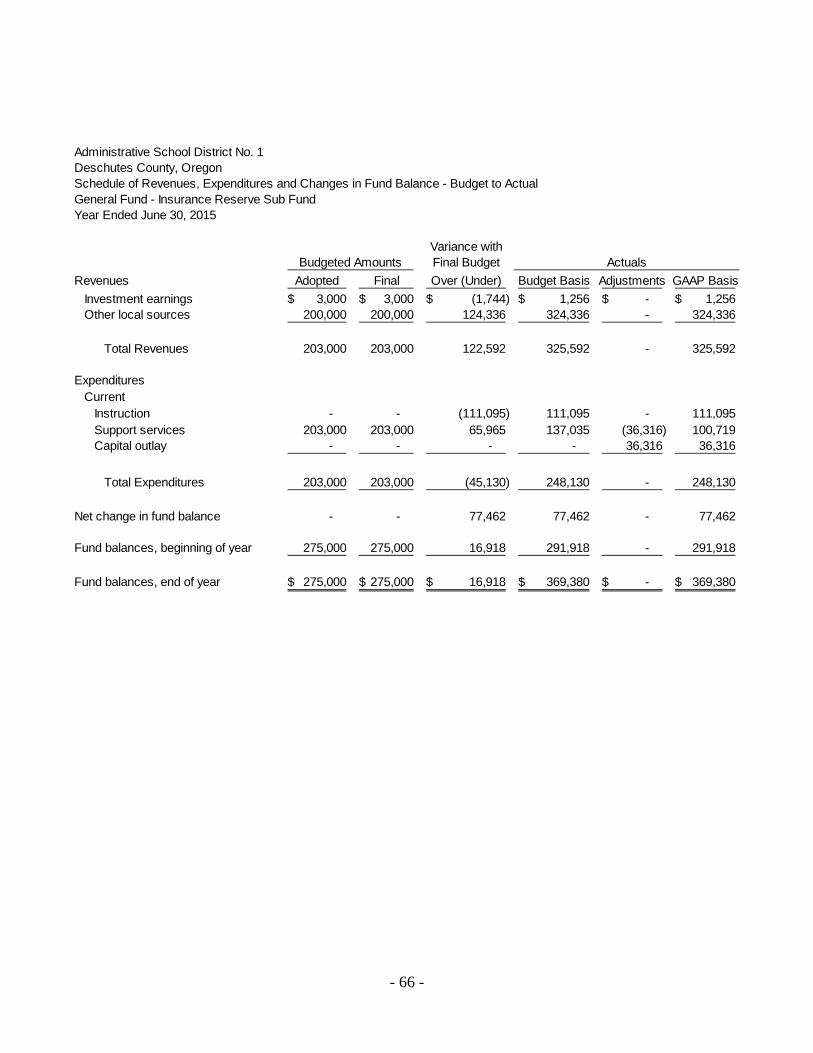
General Fund Operations Sub-Fund --------------------------------------------------------------- 58 Athletics and Activities Sub Fund ------------------------------------------------- 59 Instructional Materials Sub Fund -------------------------------------------------- 60 Transportation Equipment Sub Fund -------------------------------------------- 61 Print Shop Equipment Sub Fund -------------------------------------------------- 62 Facility Usage Sub Fund ------------------------------------------------------------ 63 Technology Reserve Sub Fund --------------------------------------------------- 64 Maintenance Replacement Sub Fund ------------------------------------------- 65 Insurance Reserve Sub Fund ------------------------------------------------------ 66
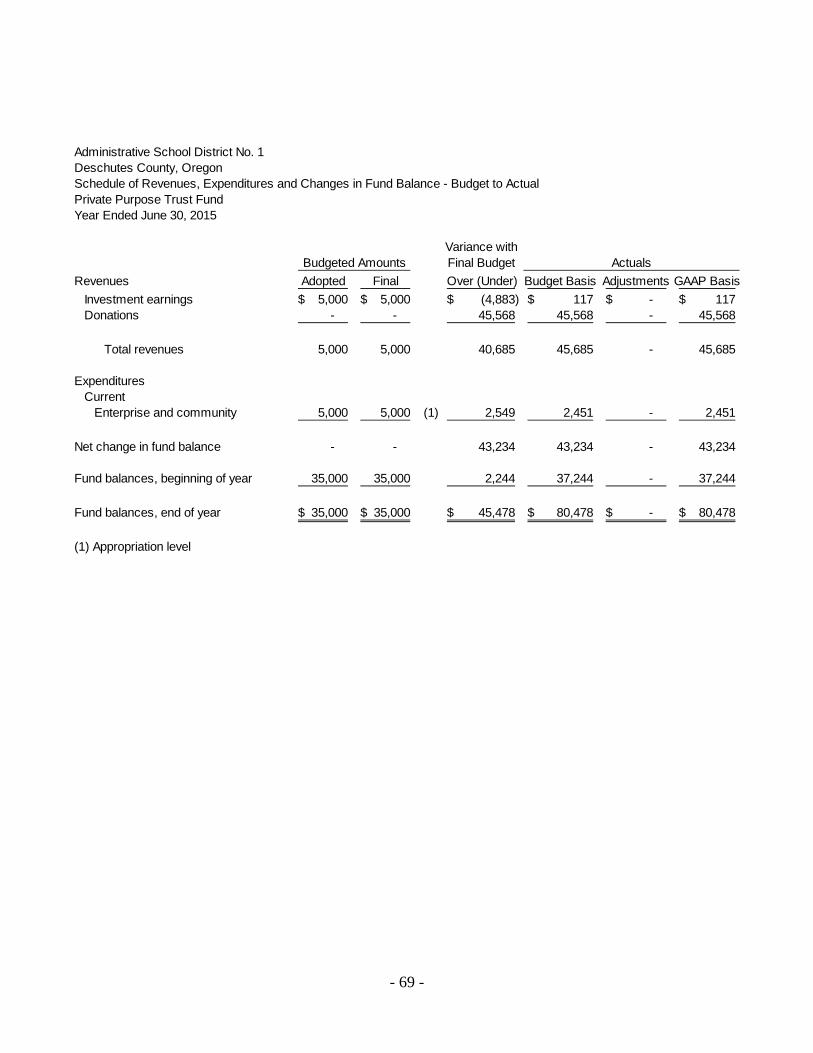
Debt Service Fund ---------------------------------------------------------------------------- 67 Capital Projects Fund ------------------------------------------------------------------------ 68 Private Purpose Trust Fund ---------------------------------------------------------------- 69
OTHER FINANCIAL SCHEDULES
Schedule of Property Tax Transactions – General Fund -------------------------------------------- 70 Schedule of Property Tax Transactions – Debt Service Fund -------------------------------------- 71 Schedule of Expenditures of Federal Awards ----------------------------------------------------------- 72 Schedule of Future Debt Service by Issue – Bond Principal and Interest ----------------------- 74
STATISTICAL SECTION
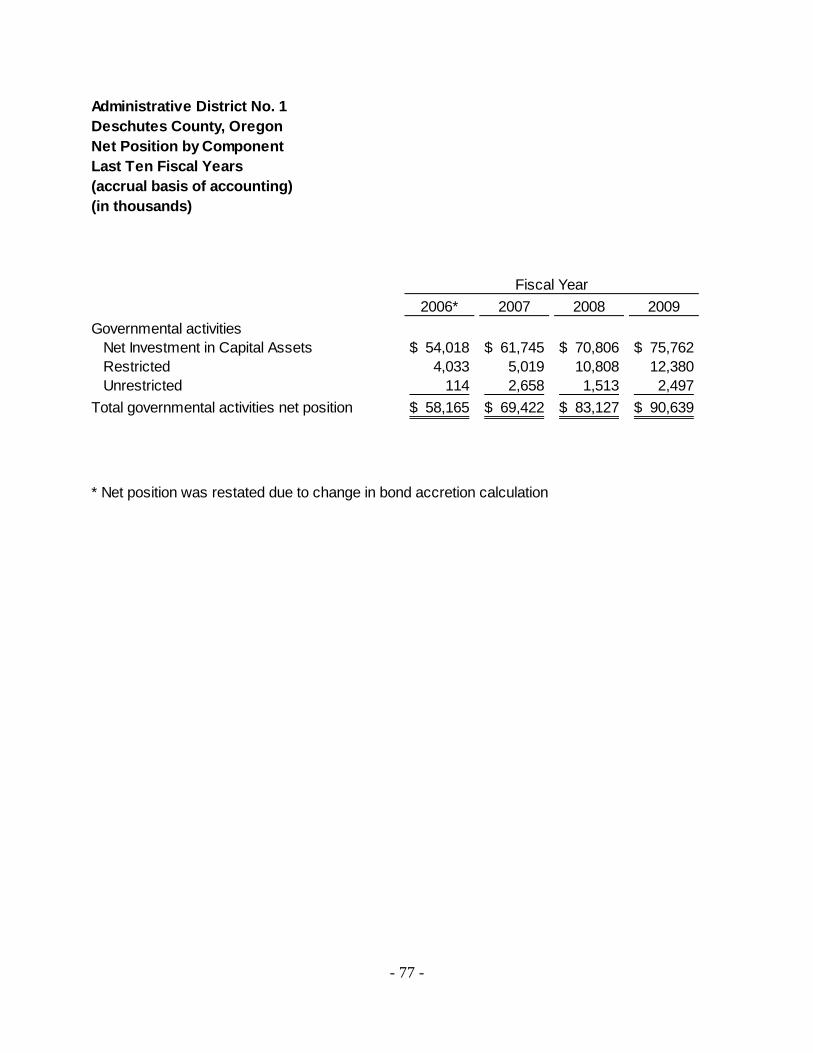
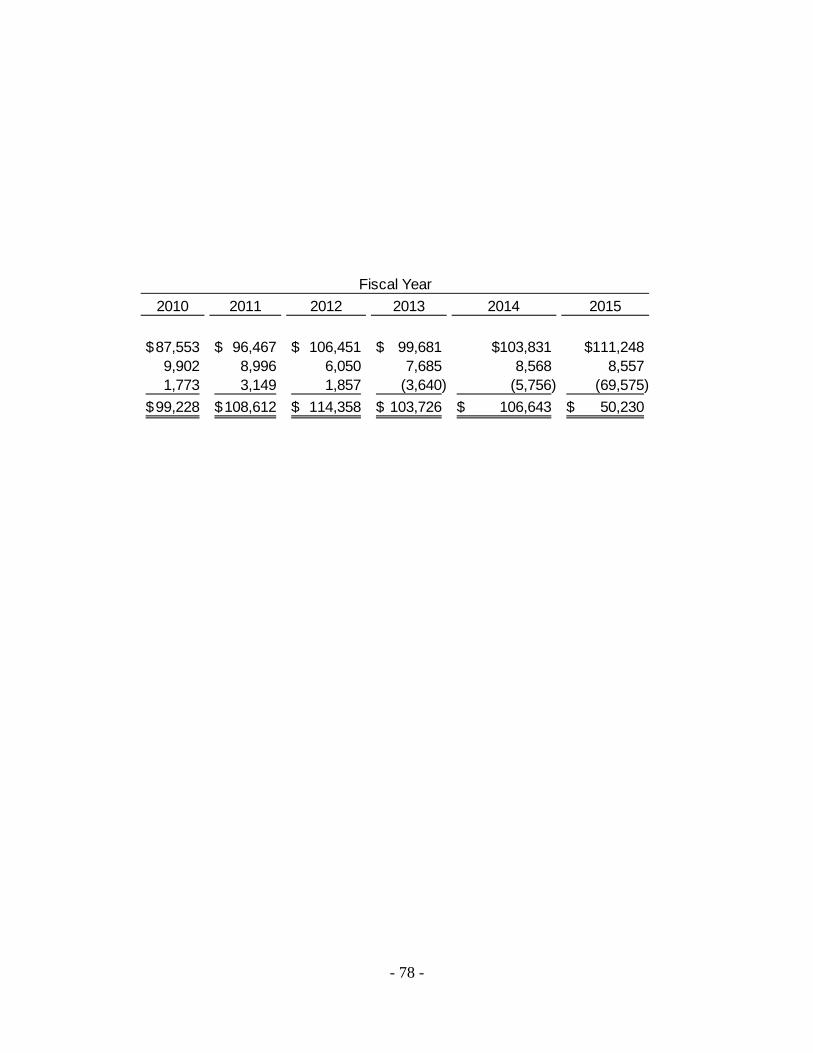
Statistical Section Contents ---------------------------------------------------------------------------------- 76 Net Position by Component – Last Ten Fiscal Years ------------------------------------------------- 77 Changes in Net Position – Last Ten Fiscal Years------------------------------------------------------ 79
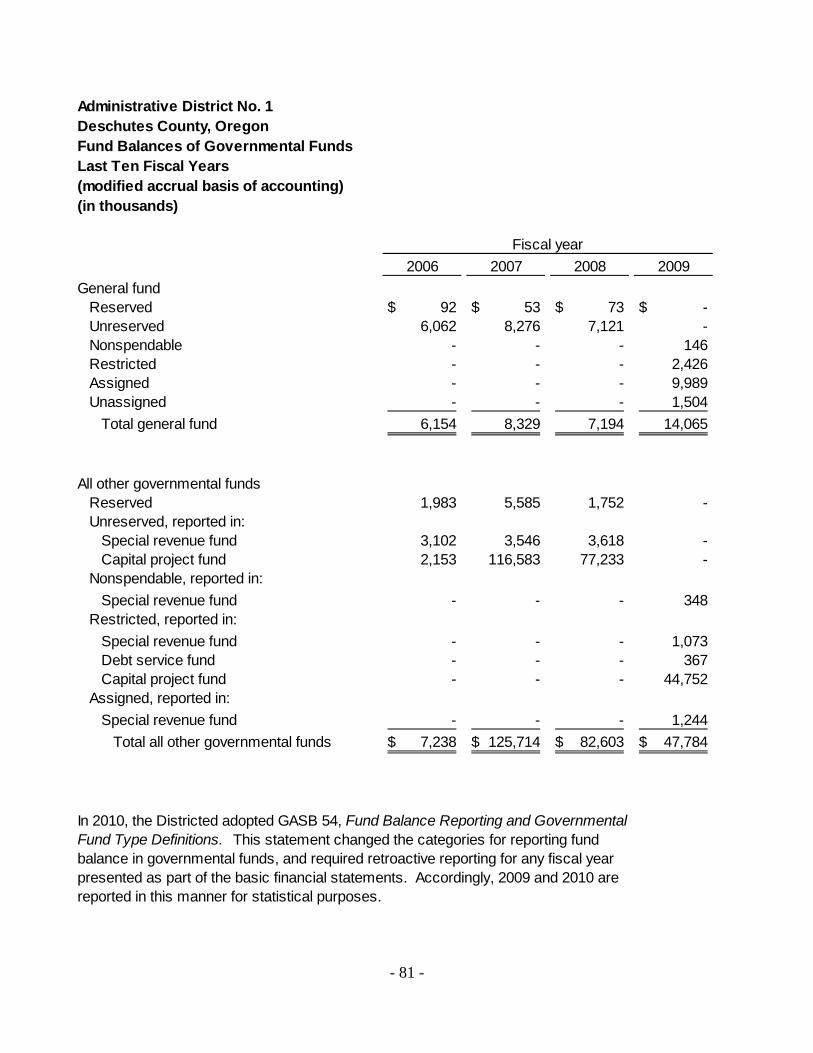
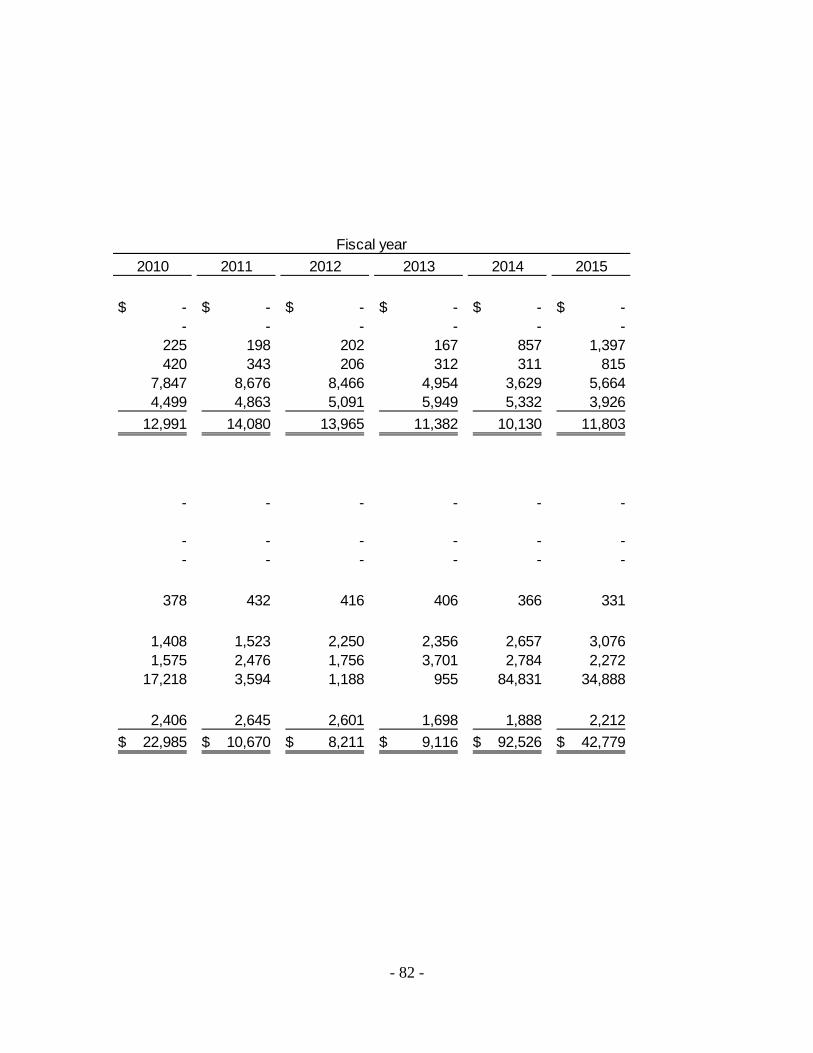
Fund Balances of Governmental Funds - Last Ten Fiscal Years ---------------------------------- 81 Changes in Fund Balances of Governmental Funds -
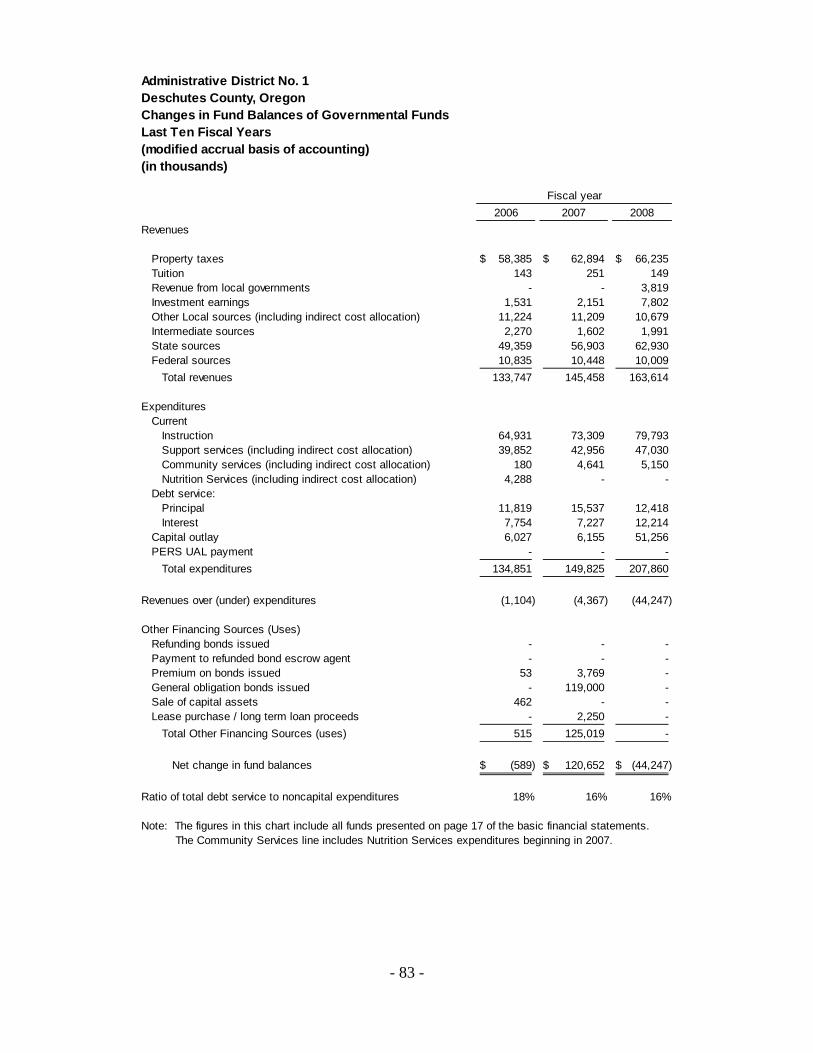
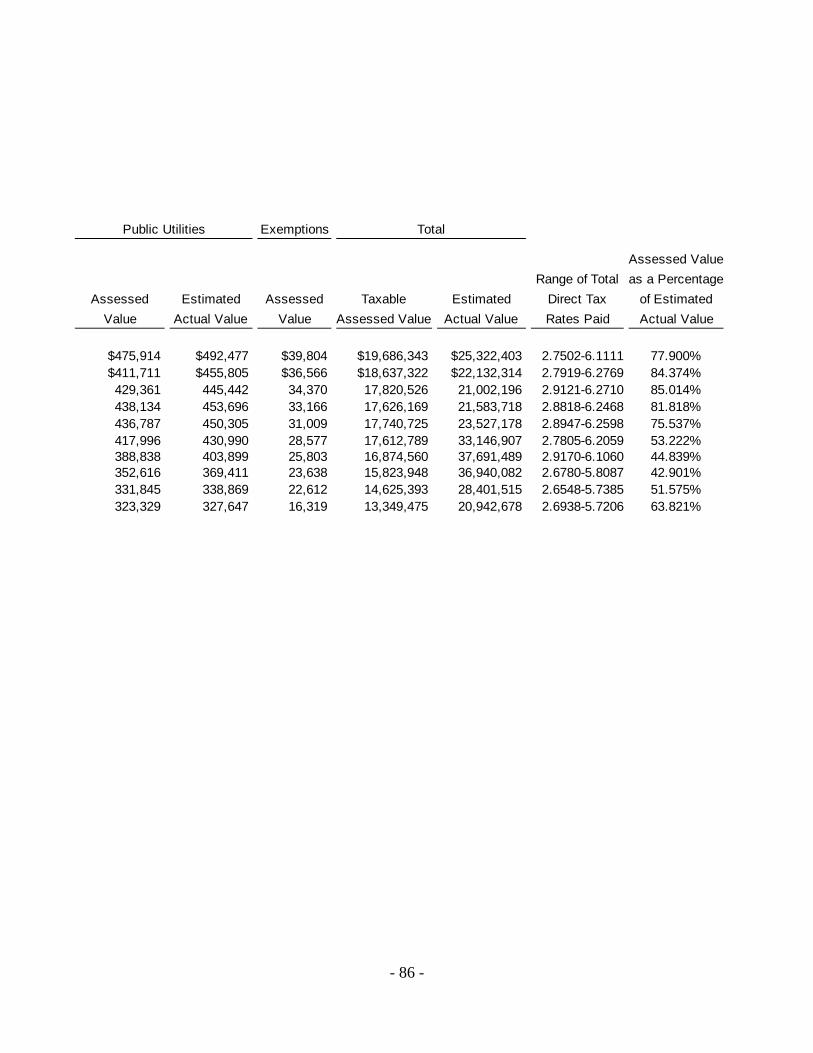
Last Ten Fiscal Years ------------------------------------------------------------------------------- 83 Assessed Value and Estimated Value of Taxable Property in Deschutes County - Last Ten Fiscal Years ---------------------------------------------------- 85 Property Tax Rates – All Direct and Overlapping Governments -
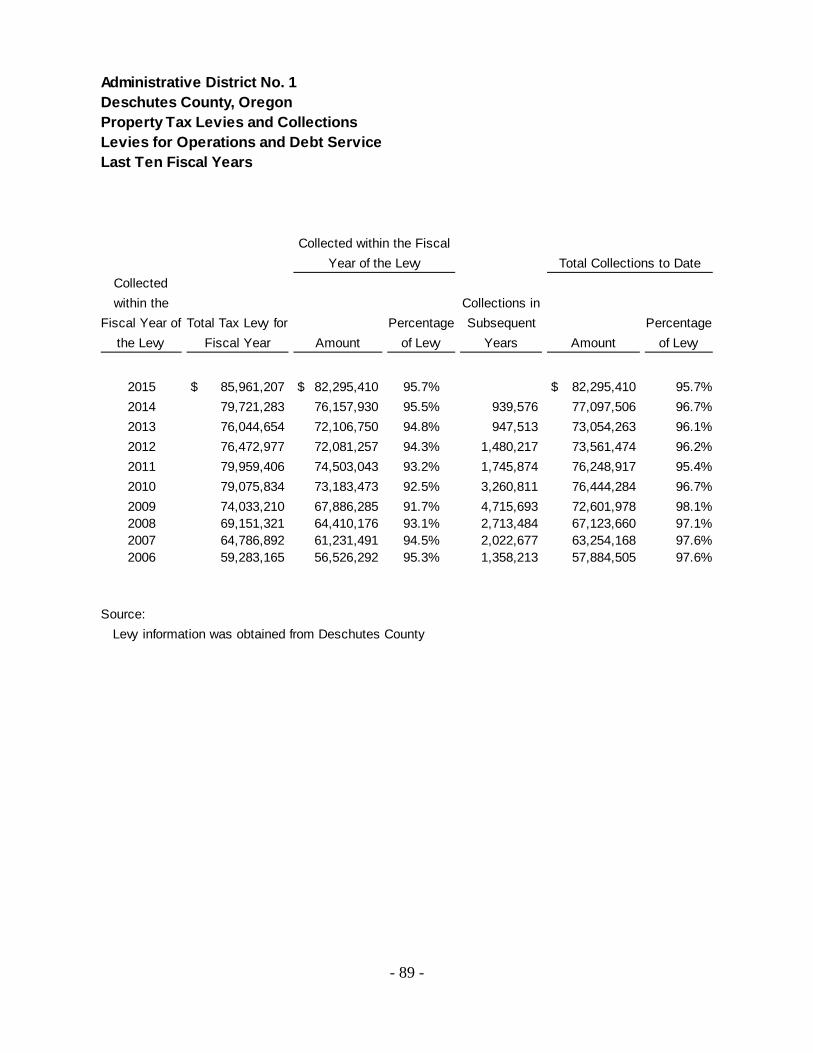
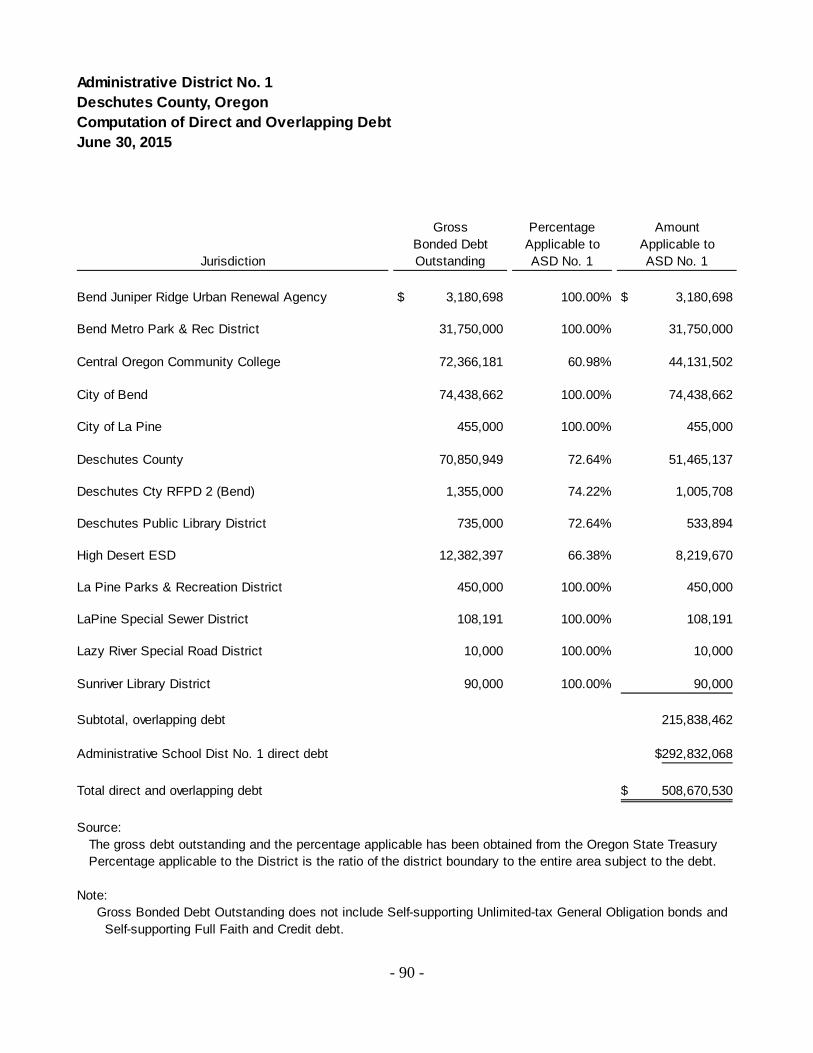
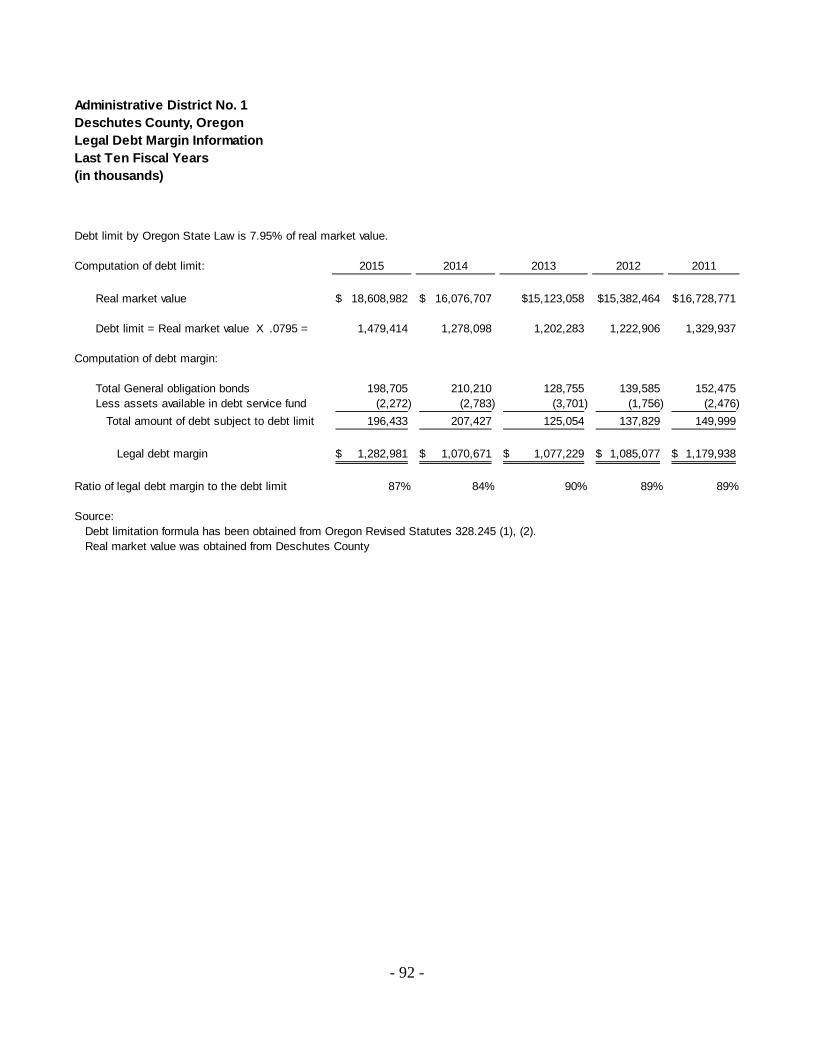
Last Ten Fiscal Years ------------------------------------------------------------------------------- 87 Principal Taxpayers – Deschutes County – Current Year and Nine Years Ago ---------------------------------------------------------------------------------- 88 Property Tax Levies and Collections – Levies for Operations and Debt Service - Last Ten Fiscal Years ------------------------------------------- 89 Computation of Direct and Overlapping Debt-----------------------------------------------------------90 Ratios of Outstanding Debt by Type - Last Ten Fiscal Years --------------------------------------- 91 Legal Debt Margin Information – Last Ten Fiscal Years --------------------------------------------- 92
Administrative School District No. 1 Deschutes County, Oregon Financial Statements Table of Contents
iii
Ratio of Net Bonded Debt to Real Market Value and Net Bonded Debt Per Capita – Last Ten Fiscal Years ------------------------------------------------------ 94
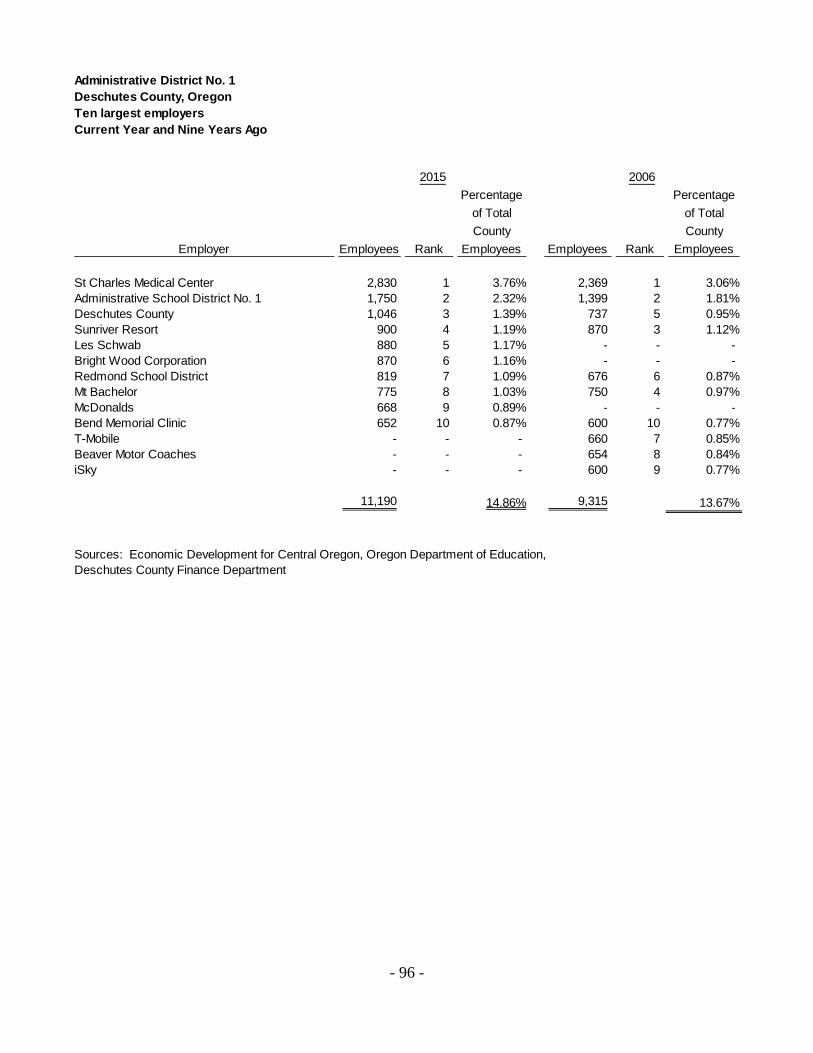
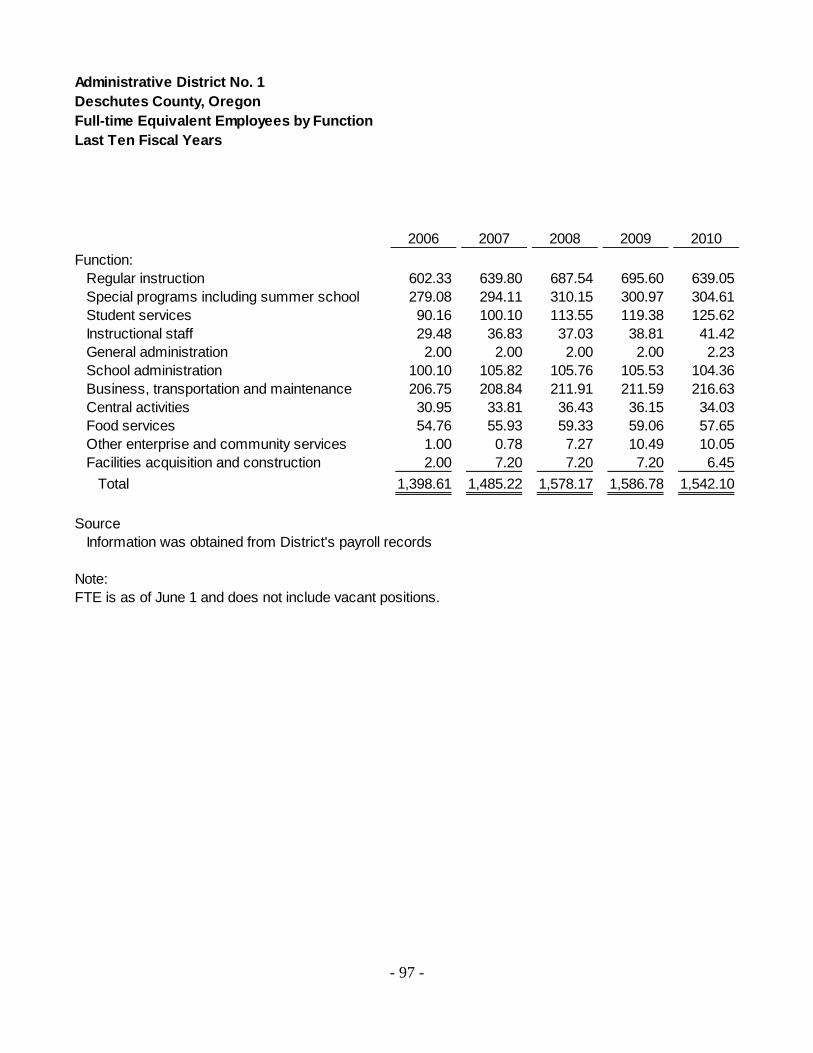
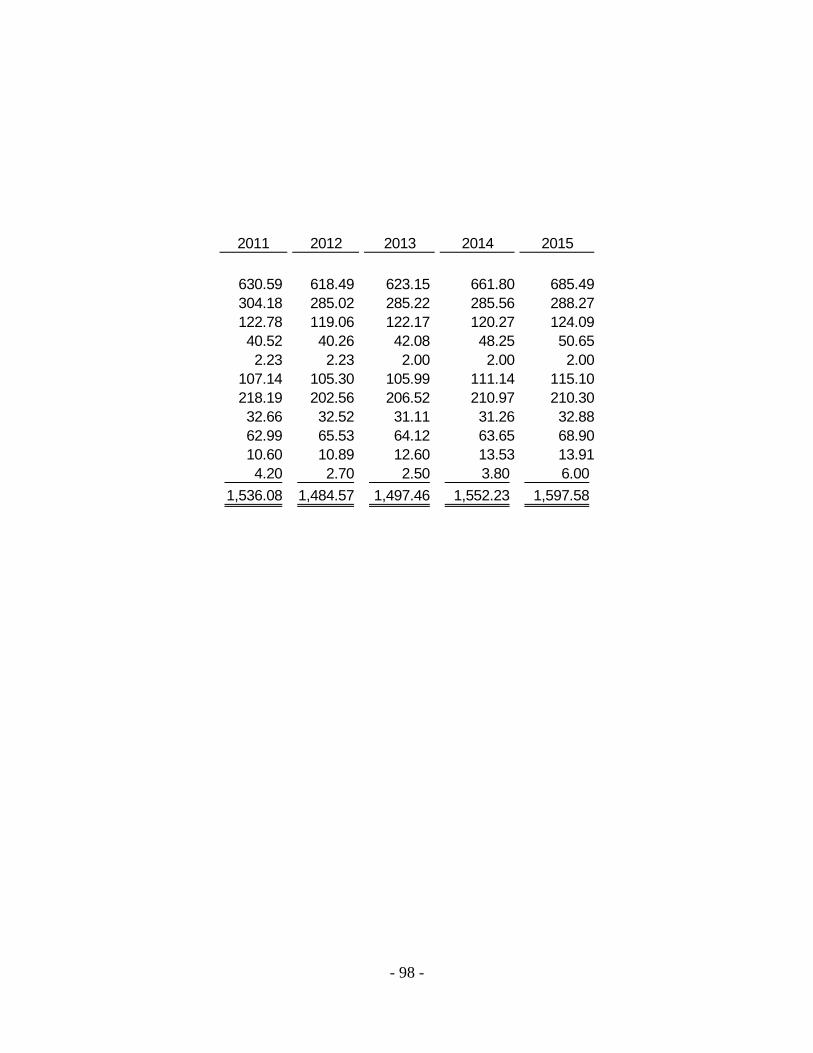
Demographic and Economic Statistics – Last Ten Fiscal Years ----------------------------------- 95 Ten Largest Employers – Current Year and Nine Years Ago -------------------------------------- 96 Full-time Equivalent Employees by Function – Last Ten Fiscal Years --------------------------- 97 Operating Indicators by Function – Last Ten Fiscal Years ------------------------------------------ 99 Capital Asset Statistics by Function – Last Ten Fiscal Years -------------------------------------- 101
School Building Statistics with Enrollment Information ---------------------------------------------- 103
OTHER INFORMATION
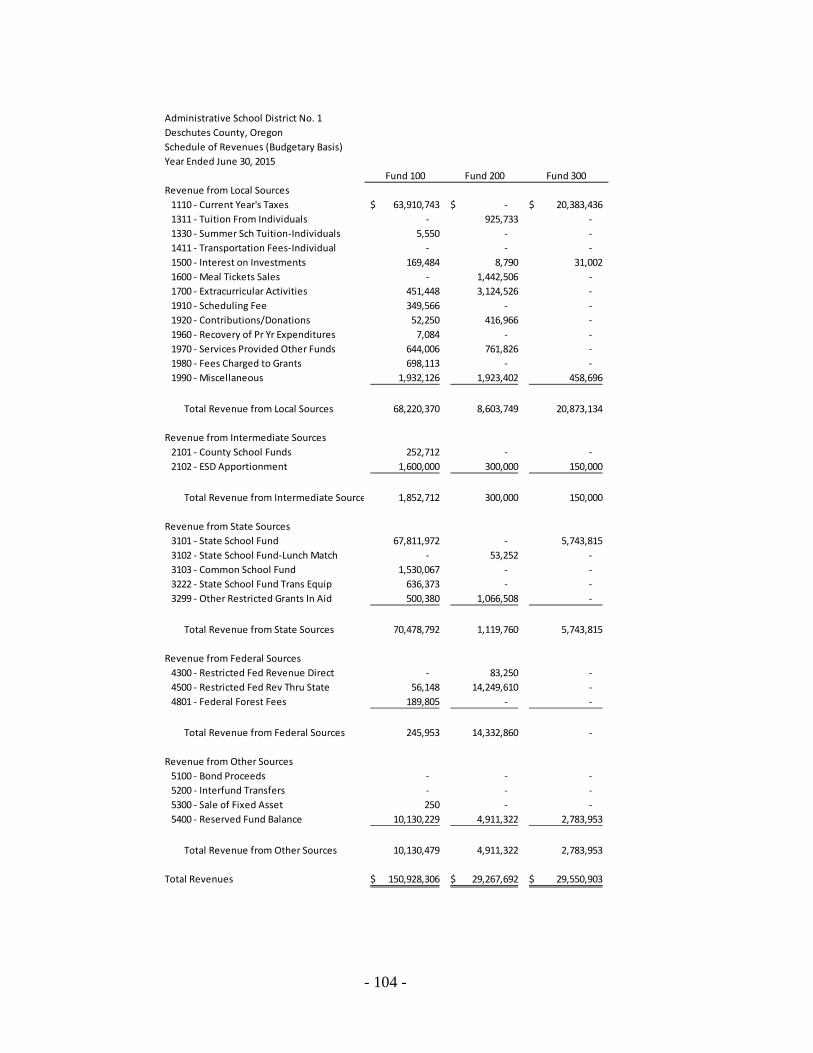
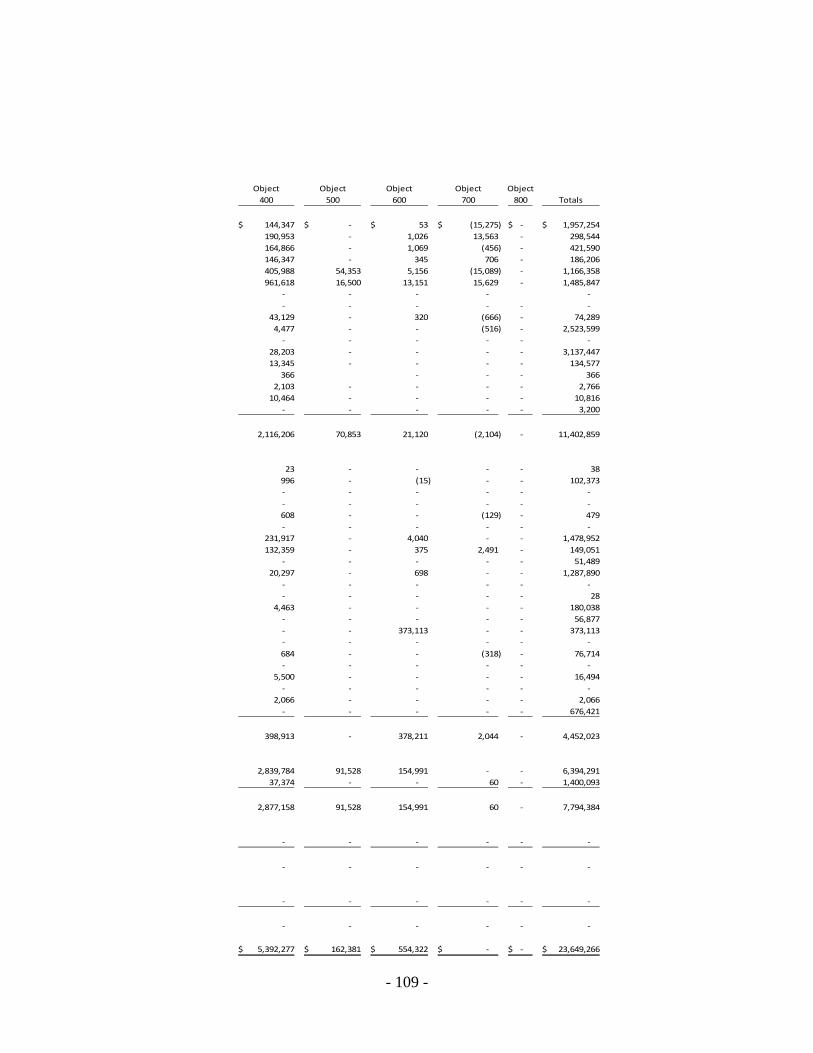
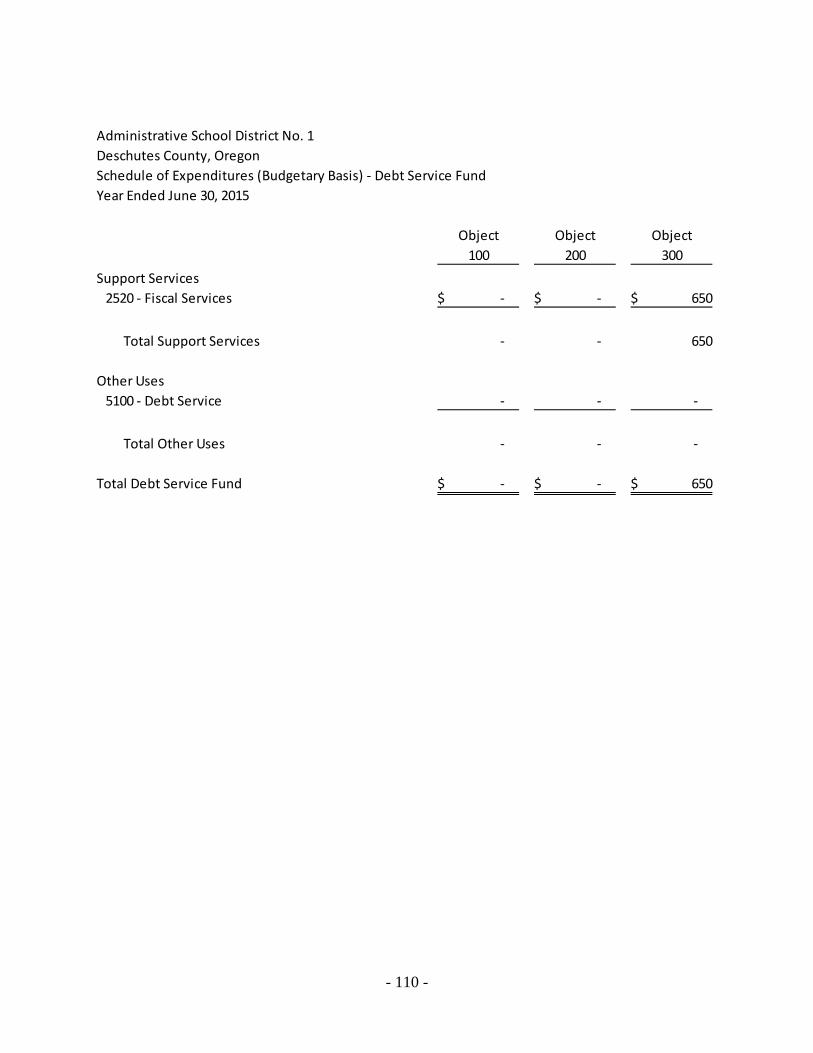
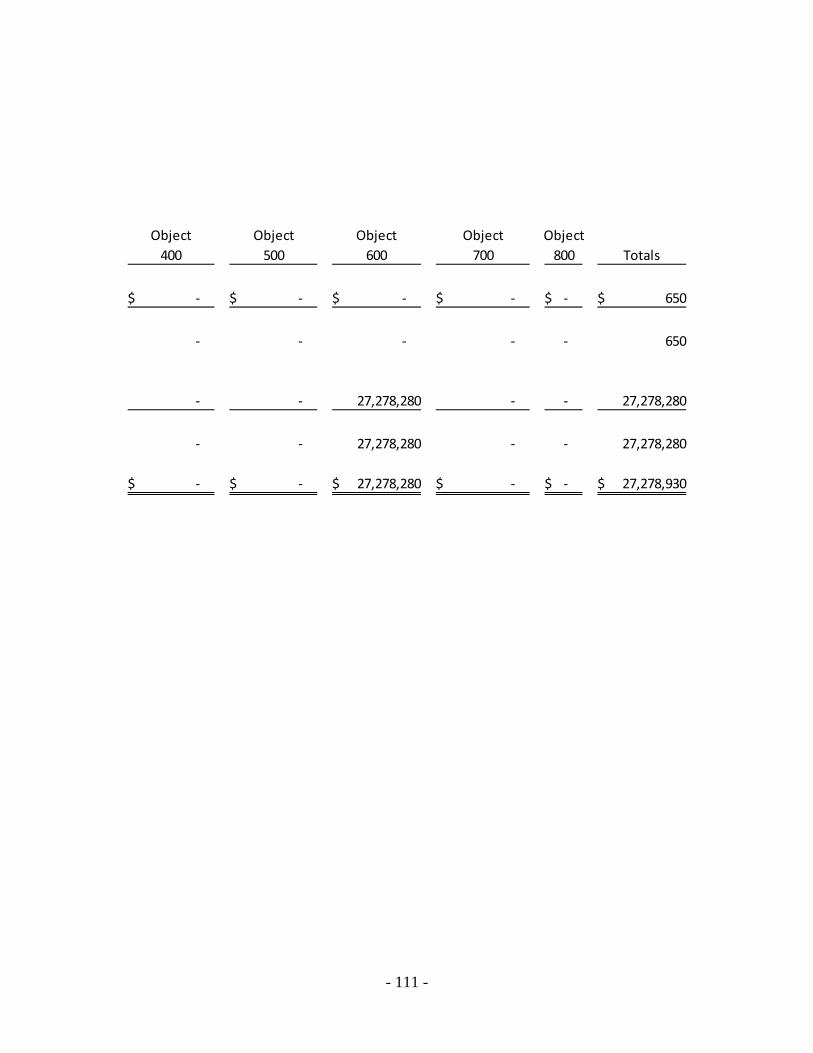
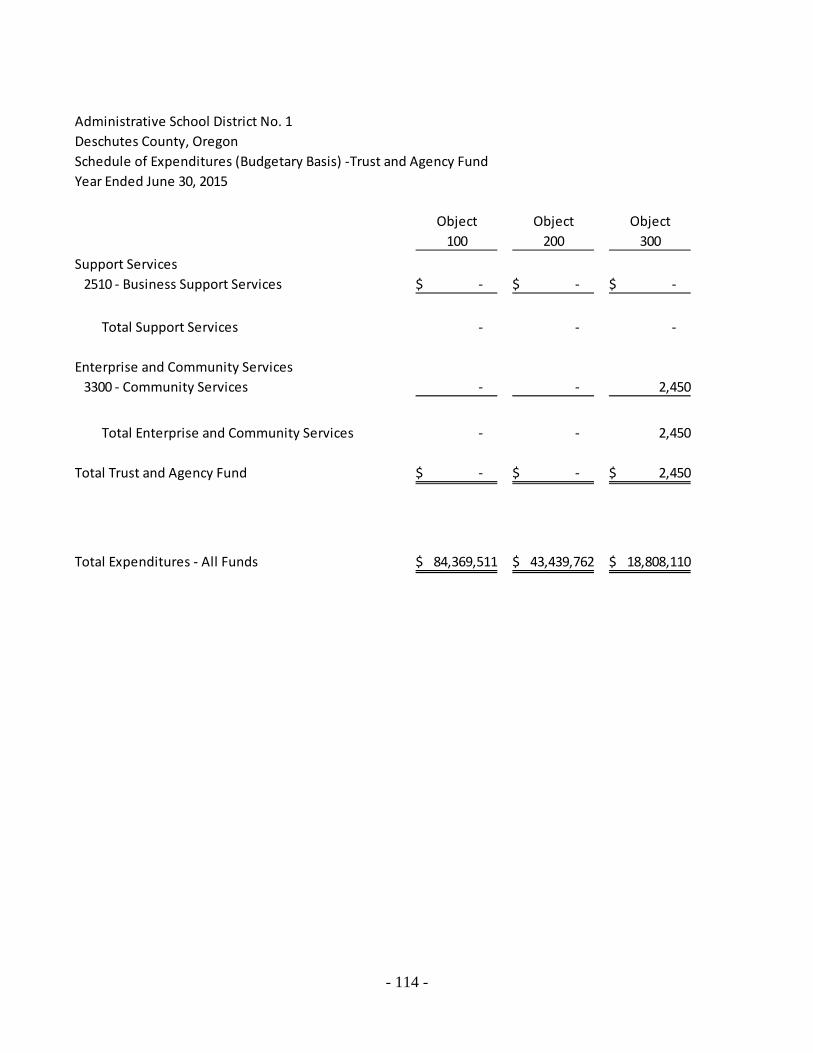
SCHEDULES REQUIRED BY OREGON DEPARTMENT OF EDUCATION Schedule of Detailed Revenues and Expenditures – (Budgetary Basis) - Actual and Budget
Schedule of Revenues – All Funds ----------------------------------------------------- 104 General Fund ---------------------------------------------------------------------------------- 106 Special Revenue Fund --------------------------------------------------------------------- 108 Debt Service Fund --------------------------------------------------------------------------- 110 Capital Projects Fund ----------------------------------------------------------------------- 112 Trust and Agency Fund -------------------------------------------------------------------- 114
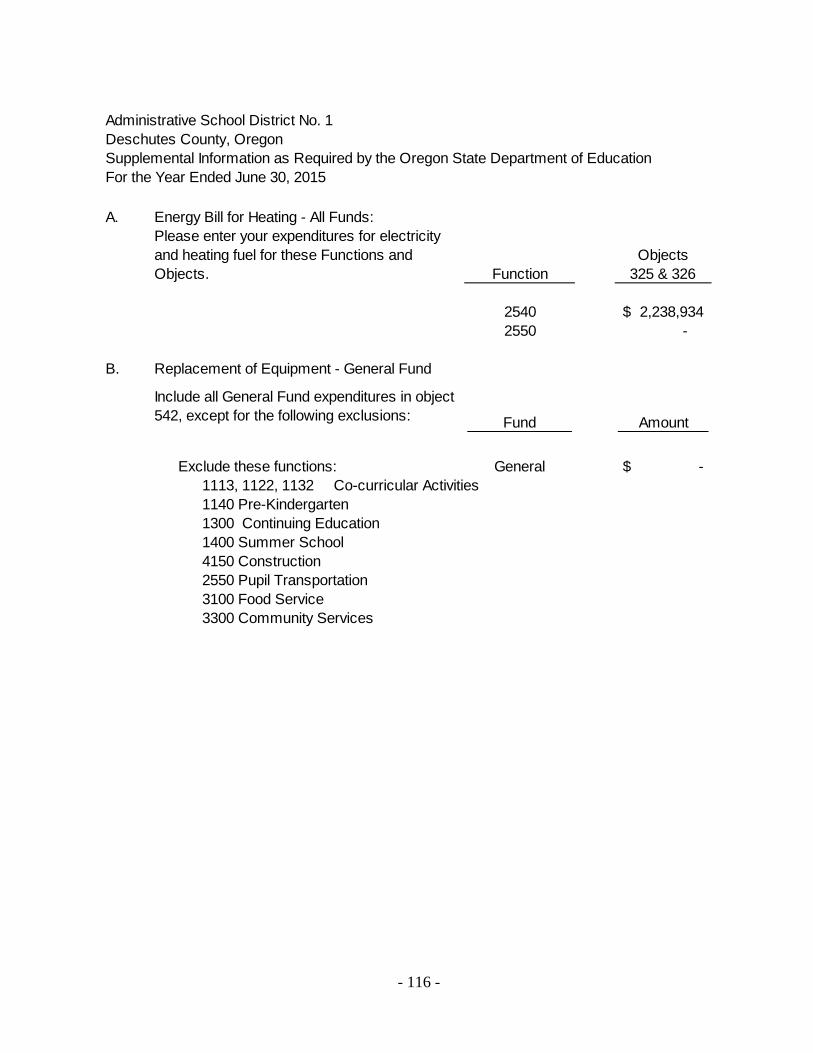
Supplemental information as required by Oregon State Department of Education -------------------------------------------------------------------------- 116
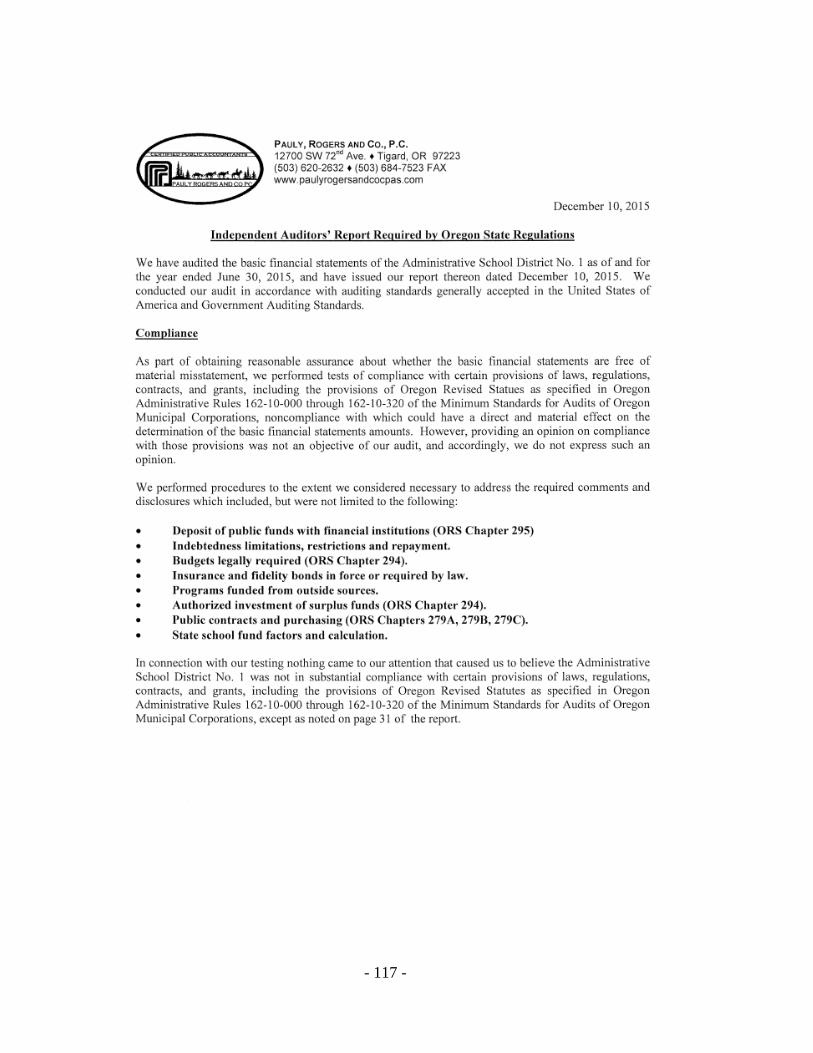
INDEPENDENT AUDITORS’ REPORT REQUIRED BY STATE REGULATIONS ------------------------------------------------------------------------- 117 GRANT COMPLIANCE REVIEW SECTION Report on Internal Control over Financial Reporting and on Compliance and Other Matters Based on an Audit of Financial Statements Performed in Accordance with Government Auditing Standards ------------------------------------------ 119 Report on Compliance With Requirements Applicable to Each Major Program and on Internal Control Over Compliance in Accordance With OMB Circular A-133 ---------------------------------------- 121 Schedule of Findings and Questioned Cost ------------------------------------------------------------ 123
INTRODUCTORY SECTION
Central School, built in 1905
Originally a grade school, was destroyed by fire in 1937.
iv
November 30, 2015 Board of Directors and Citizens of Deschutes County Administrative School District No. 1 (Bend-La Pine Schools) Deschutes County Bend, Oregon 97703 The Comprehensive Annual Financial Report for Administrative School District No. 1, Deschutes County, Oregon (District), for the year ended June 30, 2015, is presented to the Board of Directors for distribution to those responsible for, and concerned with, the operation of the District. We encourage readers to consider the information presented here in conjunction with additional information provided in the Management Discussion and Analysis starting on page 4 of this report. This report was prepared by the Fiscal Services Department. We assume full responsibility for the completeness and reliability of the information contained in this report, based upon a comprehensive framework of internal control that we have established for this purpose. This report is submitted in accordance with the provisions of Oregon's Municipal Audit Law. District Profile The District was formed in 1961 as the result of an election that consolidated five school districts. The consolidation provided increased instructional services to the students through more efficient management of available resources. We are located in the center of the state, approximately 160 miles southeast of Portland, and 130 miles east of our state capital, Salem. We are Oregon's fifth largest school district, enrolling approximately 17,163 pupils in grades kindergarten through 12 during fiscal year 2014-15. As of this writing, enrollment has increased to approximately 17,500. We provide many programs that fall under the headings of general education, special education and alternative education. Many of our school buildings have been constructed in the last fifteen years, but we also utilize buildings constructed as far back as 1918. We are an independent entity, with a Board of Directors composed of seven elected members. All management staff members are hired by the School Board. In 2014-15, we employed approximately 1,797 permanent staff including 920 teachers, counselors and licensed specialists, and 799 support staff, such as instructional assistants, secretaries, clerks and various technical positions. During the 2014-15 fiscal year, we operated with a management team of 78 administrators and supervisors, including the Superintendent. The School Board is the governing body, and as such is exclusively responsible for its decisions and is accountable for the decisions it makes. The latitude afforded under state law allows the School Board to significantly influence operations. This authority includes, but is not limited to, adoption and appropriation of the budget, control over all assets, negotiating collective bargaining agreements, short term borrowing, and contracting and developing the programs of the District. We budget appropriations in four governmental funds on an annual basis. These funds are: General Fund, Special Revenue Fund, Debt Service Fund, and Capital Projects Fund. The legal level of appropriations is at the fund and major function level, consistent with Oregon Budget Law.
v
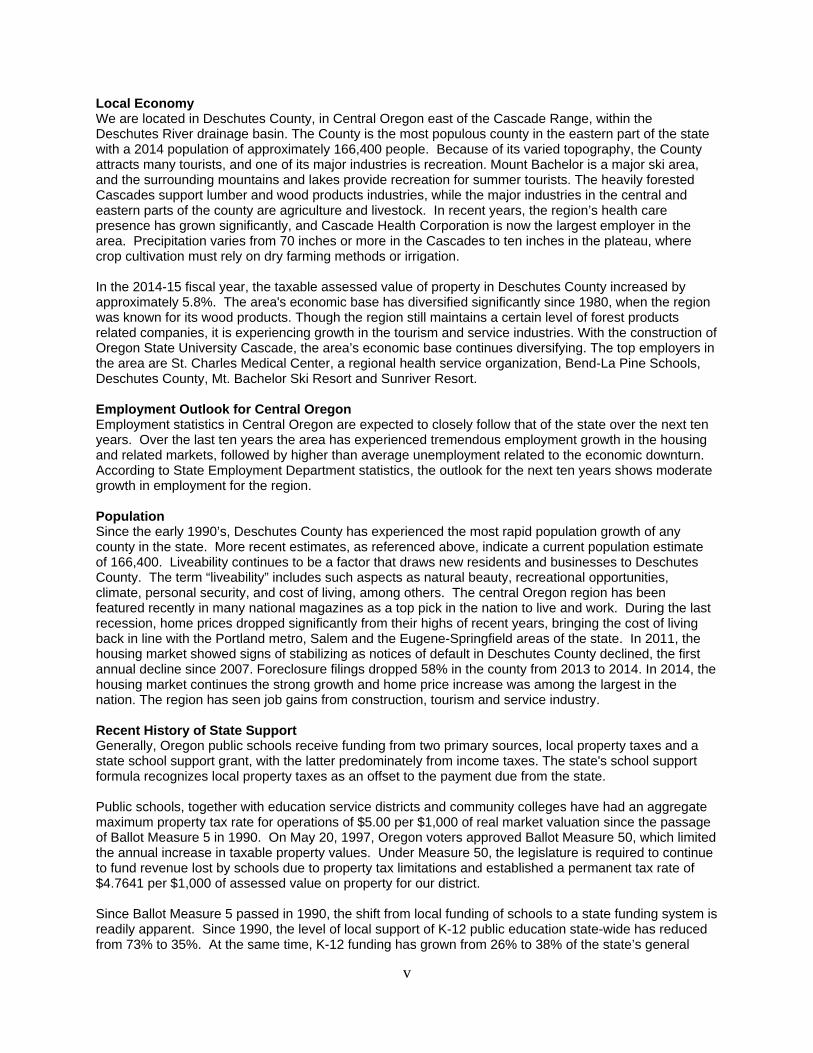
Local Economy We are located in Deschutes County, in Central Oregon east of the Cascade Range, within the Deschutes River drainage basin. The County is the most populous county in the eastern part of the state with a 2014 population of approximately 166,400 people. Because of its varied topography, the County attracts many tourists, and one of its major industries is recreation. Mount Bachelor is a major ski area, and the surrounding mountains and lakes provide recreation for summer tourists. The heavily forested Cascades support lumber and wood products industries, while the major industries in the central and eastern parts of the county are agriculture and livestock. In recent years, the region’s health care presence has grown significantly, and Cascade Health Corporation is now the largest employer in the area. Precipitation varies from 70 inches or more in the Cascades to ten inches in the plateau, where crop cultivation must rely on dry farming methods or irrigation. In the 2014-15 fiscal year, the taxable assessed value of property in Deschutes County increased by approximately 5.8%. The area's economic base has diversified significantly since 1980, when the region was known for its wood products. Though the region still maintains a certain level of forest products related companies, it is experiencing growth in the tourism and service industries. With the construction of Oregon State University Cascade, the area’s economic base continues diversifying. The top employers in the area are St. Charles Medical Center, a regional health service organization, Bend-La Pine Schools, Deschutes County, Mt. Bachelor Ski Resort and Sunriver Resort. Employment Outlook for Central Oregon Employment statistics in Central Oregon are expected to closely follow that of the state over the next ten years. Over the last ten years the area has experienced tremendous employment growth in the housing and related markets, followed by higher than average unemployment related to the economic downturn. According to State Employment Department statistics, the outlook for the next ten years shows moderate growth in employment for the region. Population Since the early 1990’s, Deschutes County has experienced the most rapid population growth of any county in the state. More recent estimates, as referenced above, indicate a current population estimate of 166,400. Liveability continues to be a factor that draws new residents and businesses to Deschutes County. The term “liveability” includes such aspects as natural beauty, recreational opportunities, climate, personal security, and cost of living, among others. The central Oregon region has been featured recently in many national magazines as a top pick in the nation to live and work. During the last recession, home prices dropped significantly from their highs of recent years, bringing the cost of living back in line with the Portland metro, Salem and the Eugene-Springfield areas of the state. In 2011, the housing market showed signs of stabilizing as notices of default in Deschutes County declined, the first annual decline since 2007. Foreclosure filings dropped 58% in the county from 2013 to 2014. In 2014, the housing market continues the strong growth and home price increase was among the largest in the nation. The region has seen job gains from construction, tourism and service industry. Recent History of State Support Generally, Oregon public schools receive funding from two primary sources, local property taxes and a state school support grant, with the latter predominately from income taxes. The state's school support formula recognizes local property taxes as an offset to the payment due from the state. Public schools, together with education service districts and community colleges have had an aggregate maximum property tax rate for operations of $5.00 per $1,000 of real market valuation since the passage of Ballot Measure 5 in 1990. On May 20, 1997, Oregon voters approved Ballot Measure 50, which limited the annual increase in taxable property values. Under Measure 50, the legislature is required to continue to fund revenue lost by schools due to property tax limitations and established a permanent tax rate of $4.7641 per $1,000 of assessed value on property for our district. Since Ballot Measure 5 passed in 1990, the shift from local funding of schools to a state funding system is readily apparent. Since 1990, the level of local support of K-12 public education state-wide has reduced from 73% to 35%. At the same time, K-12 funding has grown from 26% to 38% of the state’s general
vi
fund budget. The 2007 State Legislature increased the biennial K-12 education appropriation to $5.985 billion, with an additional $260 million allocated through a School Improvement Grant. Economic downturn forced the state legislature to adjust the state’s budget for the 2007-09 biennium. During the 2007-09 biennium the legislature reduced the state school fund by approximately $271 million, or 4.5%. The legislature used reserves from sources across the state government to make available to K-12 school districts $51 million in the “school day restoration fund”. As part of the federal actions to combat the recession, the federal government made available funds through the “State Fiscal Stabilization Fund”. Approximately $115 million of the federal resources were used state-wide in 2008-09 to offset the reduction to the state school fund. All of these actions, along with efforts at the district level to reduce expenditures, allowed the district to be better prepared financially to face the challenges of the 2009-11 biennium. With the economic downturn becoming widespread, it is no surprise that the projected available resources at the state level were materially less for the 2009-11 biennium than in the 2007-09 biennium. In addition to the projected revenues for the biennium, the state had available reserves approximating $800 million as well as additional federal funds from the State Fiscal Stabilization Fund. Even with these sources of funds, the legislature approved a K-12 budget for the biennium of $5.8 billion, with an extra $200 million available in the second year of the biennium if state revenues did not fall below a certain level. At the $5.8 billion level the decrease to K-12 funding is approximately 5.5% from the adjusted level of the previous biennium. In a special session during March of the 2009-10 year, the legislature allocated the additional $200 million to K-12 funding. The State’s revenue forecast in June, 2010 was over $500 million short for the 2009-11 biennium. This translated to a loss to K-12 education of over $200 million for the 2010-11 year, to $5.738 billion for the biennium. And finally, as additional funds became available through the federal Ed Jobs bill in August, 2010, the State’s revenue forecast was once again reduced. The K-12 education share of the revenue shortfall was exactly offset by the additional funds made available through the federal Ed Jobs bill. Our State/Federal funding for the 2009-11 biennium ended at $5.738 billion. Funding for the 2011-13 biennium was at $5.713 billion, slightly less than the 2009-11 funding. Our pension costs have increased approximately 400%. At this level of funding, we operated with less staff and provided a shortened school year. We also chose to reduce costs such as instructional materials, support to instructional technology and delayed equipment purchases. Funding for the 2013-15 biennium was $6.65 billion, a great improvement from 2011-13. As the state continues to climb out of the depths of the worst recession in recent history, the Legislature found ways to begin reinvesting in K-12 education. While the increased funding and partial relief from PERS increases that were provided by the 2013 Legislature do not allow a return to pre-recession staffing and programming levels, they have put us in a position of positive pro-active planning for the future. For 2015-17 biennium, we are funded at $7.38 billion with a 49.2/50.8 split vs. a traditional 49/51 split. With full day kindergarten and opening of two new schools, we are still not at the pre-recession staffing and programming levels. For 2017-19 biennium, we anticipate higher PERS rates due to court ruling on SB 822 and unfavourable valuations and earnings. We are advocating for adequate and stable K-12 funding and PERS reforms. Major Initiatives We are completing the construction of a middle school and a new elementary school. These two new schools are set to open in the fall of 2015. Long-term Financial Planning We forecast revenues, expenditures and fund balance in a five-year rolling plan. Revenue forecasts consider historical increases in formula revenue from the State with adjustments for current information, as well as increases tied to the consumer price index for other types of revenues. Forecasts for salary
vii
expenditures consider contracts with employee associations while forecasts for non-salary items consider the increase in the consumer prices index as well as other external factors. We have also considered the long-term impact of adding additional schools. Because approximately one-half of the our operational funding is derived from state income tax, our Board of Directors has instituted a policy that prohibits us from proposing an ending fund balance less than three percent of total revenue in the general fund. The policy also requires that we propose a plan to grow the ending fund balance. The 2015-16 adopted budget includes a budgeted ending fund balance equal to 4.75% of resources. The Board and Budget Committee have discussed to push any additional ending fund balance over the budgeted 4.75% to future years to help offset anticipated higher PERS rates. Relevant Financial Policies and Information Fiscal Year Our fiscal year commences on July 1 and ends on June 30 of the following year. Debt Administration We have been very active in managing our debt over the last 25 years. Many general obligation issues have been “refunded” (refinanced), saving millions for taxpayers by locking in lower interest rates and shortening the maturity of the bonds. On March 15, 2005 we issued general obligation refunding bonds to partially refund our 1998 and 2001 general obligation bonds. The aggregate principal amount of the refunding was $63.0 million. In June, 2007 we issued $119 million in general obligation bonds to fund new construction and capital improvements. These bonds are payable over the next 17 years. In the spring of 2011 we issued Full Faith and Credit bonds to refinance a 2008 issue, keeping the term the same but lowering the interest rate by approximately two percentage points. In August 2014, we issued $91 million in general obligation bonds to fund new construction and capital improvements. These bonds are payable over the next 19 years In November 2002, we joined a state-wide consortium and issued $40.9 million of tax pension bonds to finance our estimated 2001 unfunded actuarial liability with the Oregon Public Employees Retirement System (PERS). In April 2003, we participated in the second state-wide effort to refund a portion of our 2002 unfunded actuarial liability by issuing $25.3 million of tax pension bonds. And in February 2004 we participated in the third state-wide effort to refund a portion of our 2003 unfunded actuarial liability by issuing $5.9 million of tax pension bonds. As a result of these pension bond issuances our pension related expenditures will less for the foreseeable future. Debt limit is established by Oregon law, specifically ORS 328.245(1) and (2), at 7.95 percent of the real market value of property within the taxing district's boundary. At June 30, 2015 our net bonded debt is $1,202,707,583 less than the statutory debt limit. Other Information Independent Audit The provisions of Oregon law, specifically ORS 297.425 through 297.555 require that an independent audit be made of all public school district funds within six months following the close of each fiscal year. The auditors, who were selected by the Board of Directors, have completed their audit of our financial statements and their opinion is included in the Financial Section of this report. Additional audit requirements of the federal and state governments are included in this report. Please refer to the Auditor’s Comments Section for disclosures and comments required by the Minimum Standards for Audits of Oregon Municipal Corporations, and refer to the Grant Compliance Review Section for comments relating to general grant compliance required by the Single Audit Act of 1984 as amended by the Single Audit Act Amendments of 1996. Awards
viii
GFOA Certificate of Achievement of Excellence The Government Finance Officers Association of the United States and Canada (GFOA) awarded a Certificate of Achievement for Excellence in Financial Reporting to the District for our Comprehensive Annual Financial Report for the year ended June 30, 2014. The Certificate of Achievement is a prestigious national award recognizing conformance with the highest standards for preparation of state and local government financial reports. In order to be awarded a Certificate of Achievement, a government unit must publish an easily readable and efficiently organized Comprehensive Annual Financial Report, whose contents conform to program standards. Such reports must satisfy both generally accepted accounting principles and applicable legal requirements. A Certificate of Achievement is valid for a period of one year only. We have received a Certificate of Achievement for the last thirty-two years. We believe our current report continues to conform to the Certificate of Achievement program requirements, and we are submitting it to GFOA for review. ASBO Certificate of Excellence in Financial Reporting The Association of School Business Officials International (ASBO) awarded its Certificate of Excellence in Financial Reporting to the District for our Comprehensive Annual Financial Report for the year ended June 30, 2014. Receiving this award is recognition that we have met the highest standards of excellence in school financial reporting as adopted by the Association of School Business Officials International. We have received a Certificate of Excellence for the last thirty-one years. We believe our current report continues to conform to the Certificate of excellence program requirements, and we are submitting it to ASBO for review. Acknowledgments Superintendent Ron Wilkinson retired at the end of 2014-15 school year. We want to thank Superintendent Wilkinson for his leadership and vision. After a comprehensive search, Mr. Shay Mikalson was named our next Superintendent. We look forward to continued success under Superintendent Mikalson’s leadership. We wish to express our appreciation to the entire Business Department staff for their efforts and contributions to our Comprehensive Annual Financial Report. We also recognize the members of the Board of Directors for their expectations of excellence, and their dedication to our financial operations. Respectfully submitted,
Brad Henry Chief Operating and Financial Officer
ix
x
xi
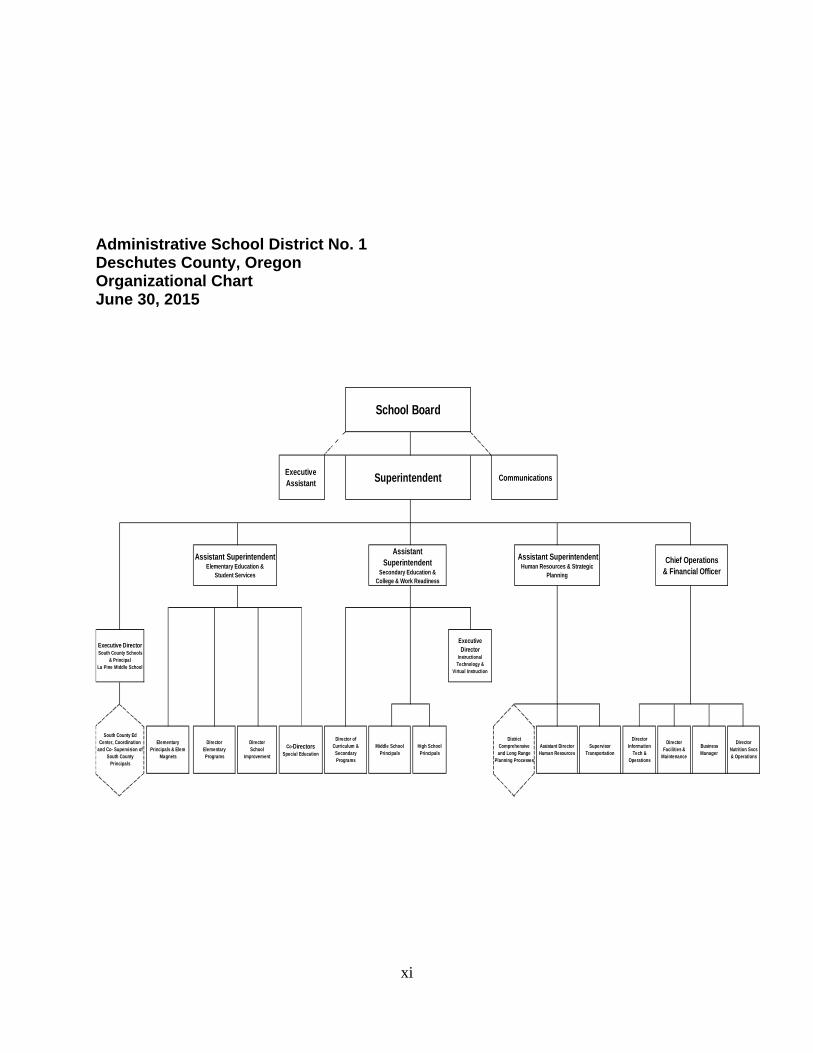
Administrative School District No. 1 Deschutes County, Oregon Organizational Chart June 30, 2015
South County Ed Center, Coordination
and Co- Supervision of South County
Principals
Assistant Superintendent Human Resources & Strategic
Planning
Executive Assistant
Communications
Assistant Superintendent
Secondary Education & College & Work Readiness
Executive Director
Instructional Technology &
Virtual Instruction
Superintendent
High School Principals
Executive Director South County Schools
& Principal La Pine Middle School
District Comprehensive and Long Range
Planning Processes
Assistant Director Human Resources
Middle School Principals
Supervisor Transportation
Director of Curriculum &
Secondary Programs
Director Information
Tech & Operations
Chief Operations & Financial Officer
Business Manager
Director Facilities &
Maintenance
Director Nutrition Svcs & Operations
Co-Directors Special Education
Elementary Principals & Elem
Magnets
School Board
Assistant Superintendent Elementary Education &
Student Services
Director School
Improvement
Director Elementary Programs
xii
Administrative School District No. 1 Deschutes County, Oregon Principal Officials June 30, 2015
BOARD OF DIRECTORS
Nori Juba – Chair June 30, 2017 Bend, Oregon Cheri Helt June 30, 2017 Bend, Oregon Ron Gallinat June 30, 2019 Bend, Oregon Peggy Kinkade June 30, 2019 Bend, Oregon Andy High June 30, 2019 Bend, Oregon Dr. Stuart Young June 30, 2017 La Pine, Oregon Julie Craig June 30, 2017 Bend, Oregon
ADMINISTRATIVE STAFF Ron Wilkinson Superintendent Brad Henry Chief Operations and Financial Officer
The above members of the Board and administrative staff can be reached by mail at 520 NW Wall Street,
Bend, OR. 97701.
This page intentionally left blank
FINANCIAL SECTION
Reid School, built in 1914
Currently houses the Deschutes Historical Center.
- 1 -
- 2 -
- 3 -
This page intentionally left blank
Management’s Discussion and Analysis
Administrative School District No. 1 Deschutes County, Oregon Management’s Discussion And Analysis June 30, 2015
- 4 -
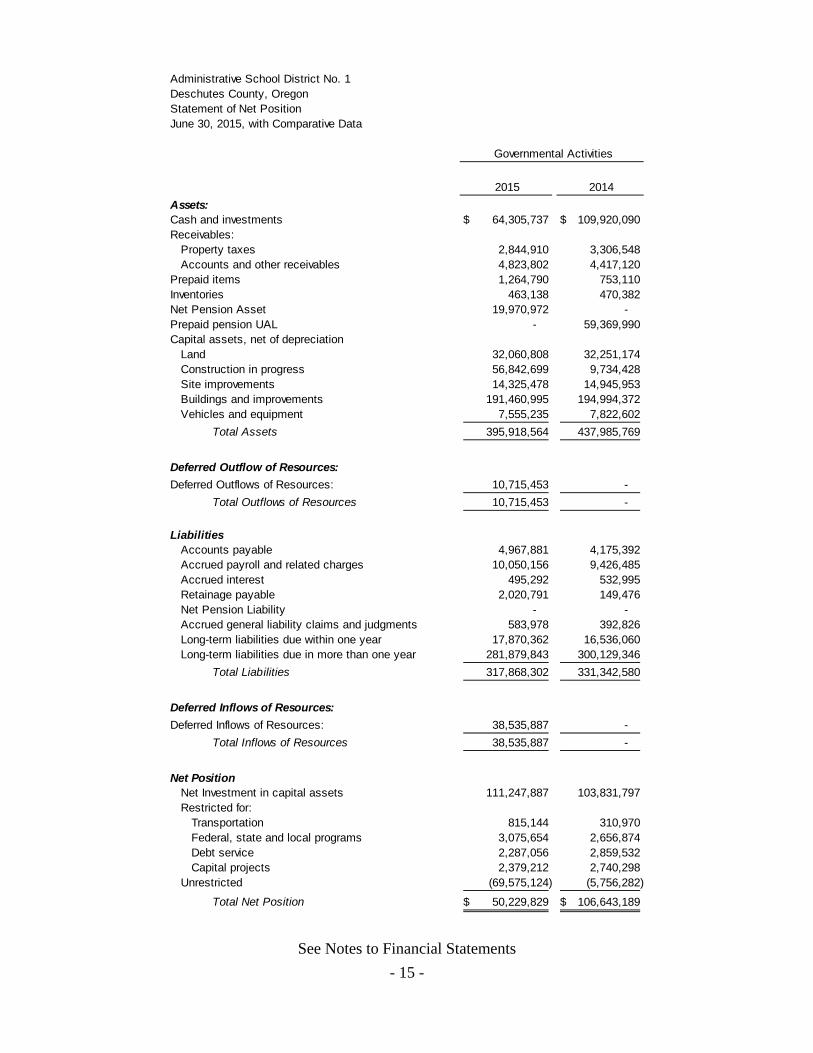
As management of Administrative School District No. 1, Deschutes County, Oregon (the District), we offer readers of our financial statements this narrative overview and analysis of the financial activities for the fiscal year ended June 30, 2015. We encourage readers to consider the information presented here in conjunction with additional information provided in the Transmittal Letter, which can be found on pages iv - viii. Financial Highlights In the government-wide statements, our assets exceeded our liabilities at June 30, 2015 by
$50 million. Of this amount, $111 million is net investment in capital assets, and the balance is restricted for grants, debt service, and capital projects, or is unrestricted. Pension liabilities are included in unrestricted.
Our total net position decreased by $56 million, with unrestricted net position decreasing by $63 million, principally due to implementation of Governmental Accounting Standards Board (GASB) 68. Please refer to page 42 for more information on GASB 68.
We are completing construction of two new schools in the fall of 2015 and construction projects throughout the district with 2013 General Obligation Bond.
Our General Fund ended the 2014-15 fiscal year with a fund balance of $11.8 million, which is 8.5% of expenditures.
Overview of the Financial Statements This discussion and analysis are intended to serve as an introduction to our basic financial statements. Our basic financial statements consist of three components: 1) government-wide financial statements, 2) fund financial statements, and 3) notes to the basic financial statements. This report also contains supplementary information in addition to the basic financial statements themselves. Government-wide financial statements. The government-wide financial statements are designed to provide readers with a broad overview of our finances, in a manner similar to a private-sector business. These statements include: The Statement of Net Position. The statement of net position presents information on all of our assets and liabilities at year end. Net position is what remains after the liabilities have been paid or otherwise satisfied. Over time, increases or decreases in net position may serve as a useful indicator of whether our financial position is improving or deteriorating. The Statement of Activities. The statement of activities presents information showing how our net position changed over the year by tracking revenues, expenses and other transactions that increase or reduce net position. All changes in net position are reported as soon as the underlying event giving rise to the change occurs, regardless of the timing of related cash flows. Thus, revenues and expenses are reported in this statement for some items that will only result in cash flows in future fiscal periods (e.g., uncollected taxes).
Administrative School District No. 1 Deschutes County, Oregon Management’s Discussion And Analysis June 30, 2015
- 5 -
In the government-wide financial statements, our activities are categorized as governmental activities. Most of our basic functions are shown here, such as regular and special education, child nutrition services, transportation, administration, technology services, facilities acquisition, construction and maintenance. These activities are primarily financed through property taxes, Oregon’s State School Fund and other intergovernmental revenues. The government-wide financial statements can be found on pages 15 and 16 of this report. Fund financial statements. The fund financial statements provide more detailed information about our funds, focusing on our most significant or “major” funds – not the District as a whole. A fund is a grouping of related accounts that is used to maintain control over resources that have been segregated for specific activities or objectives. Our district, like other state and local governments, uses fund accounting to ensure and to demonstrate compliance with finance-related legal requirements. All of our funds can be divided into two categories: governmental funds and fiduciary funds. Governmental funds. The governmental funds are used to account for essentially the same functions reported as governmental activities in the government-wide financial statements. However, unlike the government-wide financial statements, governmental fund financial statements focus on near-term inflows and outflows of spendable resources, as well as on balances of spendable resources available at the end of the fiscal year. Such information may be useful in evaluating a government’s near-term financing requirements. Because the focus of governmental funds is narrower than that of the government-wide financial statements, it is useful to compare the information presented for governmental funds with similar information presented for governmental activities in the government-wide financial statements. By doing so, readers may better understand the long-term impact of the government’s near-term financing decisions. Both the governmental fund Balance Sheet and Statement of Revenues, Expenditures and Changes in Fund Balances are reconciled to the government-wide Statements of Net Position and Activities. We maintain 4 individual governmental funds. Information is presented separately in the governmental fund Balance Sheet and the governmental fund Statement of Revenues, Expenditures and Changes in Fund Balances for the General, Special Revenues, Debt Service, and Capital Projects Funds, all of which are considered to be major funds. Fiduciary funds. Fiduciary funds are used to account for resources held for the benefit of parties outside the government. Fiduciary funds are not reflected in the government-wide financial statement because the resources of those funds are not available to support our own programs. We hold approximately $80,000 in trust funds for student scholarships. The fund financial statements can be found on pages 17-24 of this report. Notes to the basic financial statements. The notes provide additional information essential to a full understanding of the data provided in the government-wide and fund financial statements. The notes to the basic financial statements can be found on pages 25-51 of this report.
Administrative School District No. 1 Deschutes County, Oregon Management’s Discussion And Analysis June 30, 2015
- 6 -
Government-Wide Financial Analysis As noted earlier, net position may serve over time as a useful indicator of a government’s financial position. Our assets exceeded liabilities by $50 million at June 30, 2015. In June 2012, the Governmental Accounting Standards Board (GASB) issued Statement No. 68, Accounting and Financial Reporting for Pensions. This statement provides guidance for accounting for net pension liabilities, including definition of balances to be included in deferred inflows and deferred outflows of resources. We implemented GASB 68 in 2014-15 fiscal year. The beginning net position at July 1, 2014, does not equal to the ending net position at June 30, 2014. A restatement of the prior year net position was required to record the net pension liability at the prior measurement date and reclassify prior year pension contributions from expenses to deferred outflows. Please refer to page 42 for more information on GASB 68. Capital assets, which consist of our land, buildings, land improvements, construction in progress, vehicles, and equipment, represent about 76 percent of total assets. This percentage has increased from the prior year, mainly due to the construction projects and other technology capital projects that are underway or were completed during current year. The remaining assets consist mainly of the net pension asset, cash and investments and grants and property taxes receivable. Please refer to page 35 for more information on capital asset activities. Our largest liability, 89 percent of total liabilities, is for the repayment of the long-term portion of general obligation bonds and other debt. Current liabilities, representing about 9.4 percent of our total liabilities, consist of payables on accounts, benefits, and the current portion of long-term debt. The remaining 1.6% of total liabilities is other post-employment benefit obligation. Please refer to pages 36-38 for more information on long-term debt activity.
Administrative School District No. 1 Deschutes County, Oregon Management’s Discussion And Analysis June 30, 2015
- 7 -
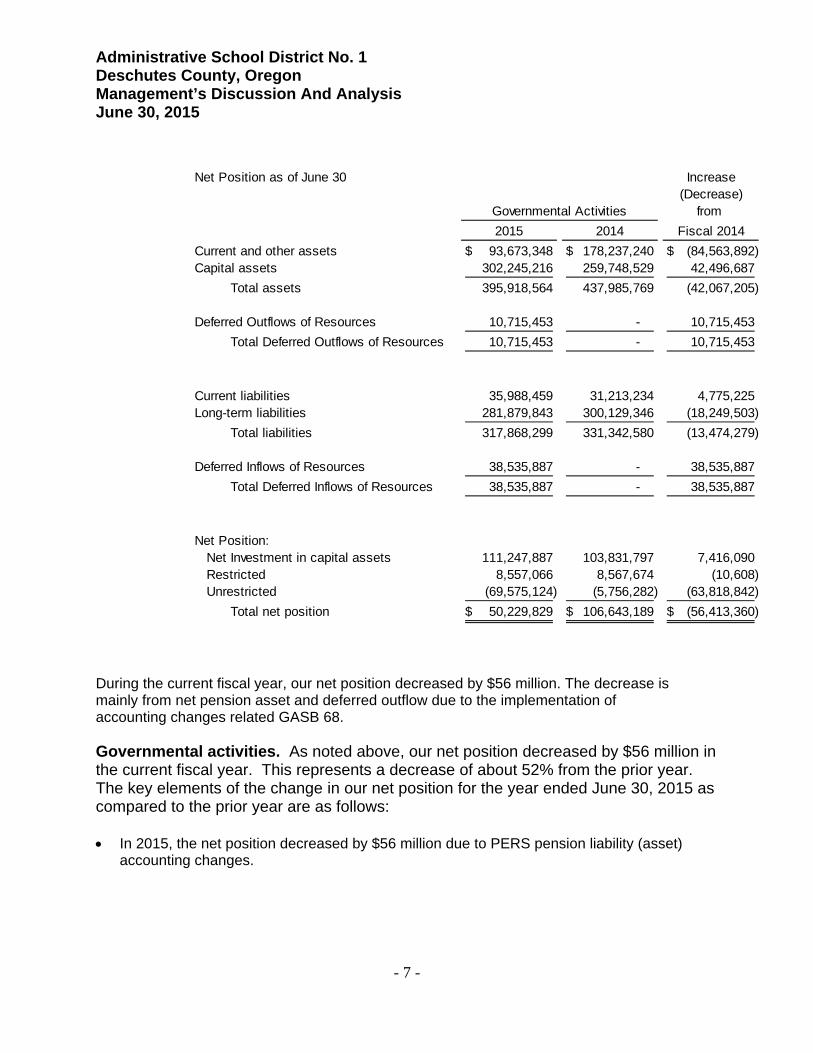
During the current fiscal year, our net position decreased by $56 million. The decrease is mainly from net pension asset and deferred outflow due to the implementation of accounting changes related GASB 68. Governmental activities. As noted above, our net position decreased by $56 million in the current fiscal year. This represents a decrease of about 52% from the prior year. The key elements of the change in our net position for the year ended June 30, 2015 as compared to the prior year are as follows: In 2015, the net position decreased by $56 million due to PERS pension liability (asset)
accounting changes.
Net Position as of June 30 Increase(Decrease)
from
2015 2014 Fiscal 2014
Current and other assets 93,673,348$ 178,237,240$ (84,563,892)$ Capital assets 302,245,216 259,748,529 42,496,687
Total assets 395,918,564 437,985,769 (42,067,205)
Deferred Outflows of Resources 10,715,453 - 10,715,453
Total Deferred Outflows of Resources 10,715,453 - 10,715,453
Current liabilities 35,988,459 31,213,234 4,775,225 Long-term liabilities 281,879,843 300,129,346 (18,249,503)
Total liabilities 317,868,299 331,342,580 (13,474,279)
Deferred Inflows of Resources 38,535,887 - 38,535,887
Total Deferred Inflows of Resources 38,535,887 - 38,535,887
Net Position:Net Investment in capital assets 111,247,887 103,831,797 7,416,090 Restricted 8,557,066 8,567,674 (10,608) Unrestricted (69,575,124) (5,756,282) (63,818,842)
Total net position 50,229,829$ 106,643,189$ (56,413,360)$
Governmental Activities
Administrative School District No. 1 Deschutes County, Oregon Management’s Discussion And Analysis June 30, 2015
- 8 -
The beginning net position at July 1, 2014, does not equal the ending net position at June 30, 2014. Due to the implementation of GASB Statements 68 and 71, a restatement of the prior year net position was required to record the net pension liability at the prior measurement date and reclassify prior year pension contributions from expenses to deferred outflows.
Changes in Net Position, Fiscal Year Ended June 30 Increase
(Decrease)
from
2015 2014 Fiscal 2014
Revenues:
Programs revenues:
Charges for services 6,357,714$ 6,318,750$ 38,964$
Operating grants and contributions 19,425,439 17,538,149 1,887,290
Capital grants and contributions 636,373 670,353 (33,980)
General revenues:
Property taxes 83,907,941 77,839,444 6,068,497
Federal aid not restricted to specific purposes 189,807 283,955 (94,148)
State aid not restricted to specific purposes 75,139,105 69,609,643 5,529,462
Intermediate aid not restricted to specific purposes 2,002,712 1,827,979 174,733
Earnings on investments 470,074 1,138,253 (668,179)
Other local revenue 2,348,763 2,372,775 (24,012)
Total revenues 190,477,929 177,599,301 12,878,628
Expenses:
Instruction 98,212,078 97,549,991 662,087
Support services 34,230,718 56,867,927 (22,637,209)
Enterprise and community services 7,410,433 7,288,914 121,519
Interest on long-term debt 11,664,343 12,975,237 (1,310,894)
Total expenses 151,517,572 174,682,069 (23,164,497)
Increase (decrease) in net position 38,960,357 2,917,232 36,043,125
Net Position July 1 11,269,472 103,725,957 (92,456,485)
Net Position June 30 50,229,829$ 106,643,189$ (56,413,360)$
Governmental Activities
Administrative School District No. 1 Deschutes County, Oregon Management’s Discussion And Analysis June 30, 2015
- 9 -
-
20
40
60
80
100
120
Instruction Support services Enterprise andcommunity
services
Interest on long-term debt
Mill
ions
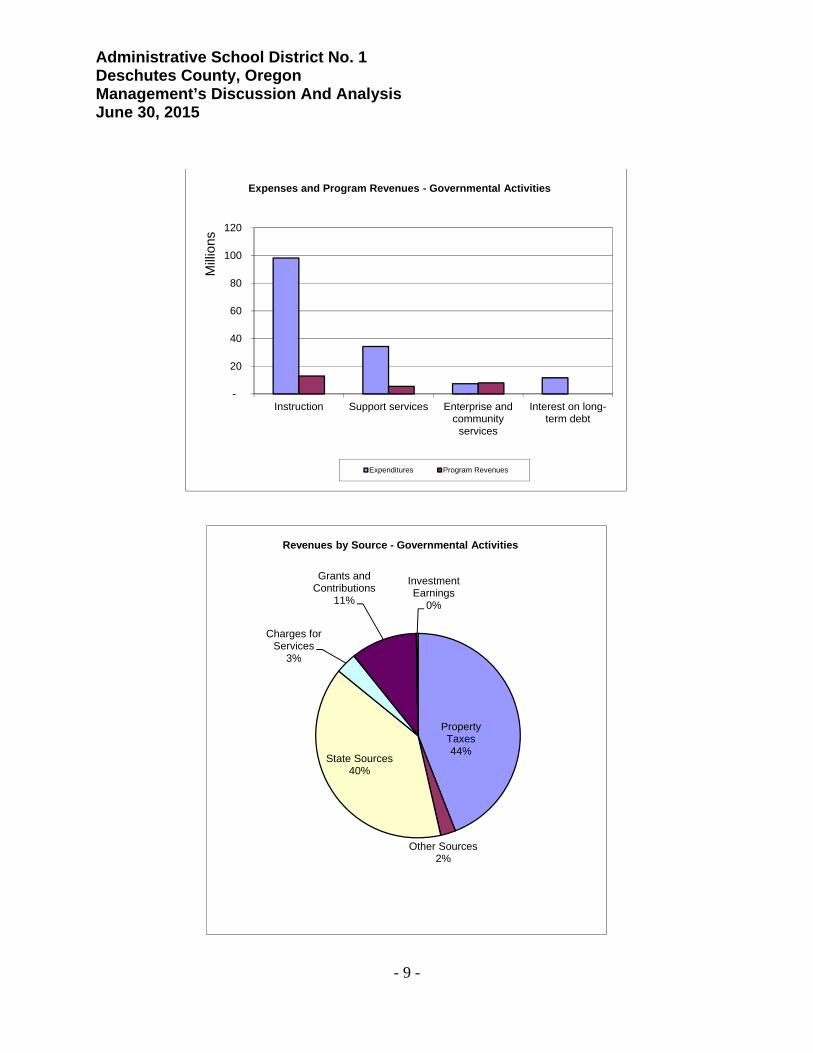
Expenses and Program Revenues - Governmental Activities
Expenditures Program Revenues
Property Taxes44%
Other Sources2%
State Sources40%
Charges for Services
3%
Grants and Contributions
11%
Investment Earnings
0%
Revenues by Source - Governmental Activities
Administrative School District No. 1 Deschutes County, Oregon Management’s Discussion And Analysis June 30, 2015
- 10 -
FINANCIAL ANALYSIS OF THE DISTRICT’S FUNDS As noted earlier, we use fund accounting to ensure and to demonstrate compliance with finance-related legal requirements. Governmental funds. The focus of our governmental funds is to provide information on relatively short-term cash flow and funding for future basic services. Such information is useful in assessing our financing requirements. In particular, unassigned fund balance may serve as a useful measure of a government’s net resources available for spending at the end of a fiscal year. At June 30, 2015, our governmental funds reported combined ending fund balances of $54.5 million. About 64% of the ending fund balance constitutes capital projects, as authorized by voters. An additional 14% is for use as obligated by grants or for debt service obligations. General Fund. The General Fund is the chief operating fund of the District. As of June 30, 2015, the Balance Sheet for Governmental Funds shows that the District had a fund balance of $11.8 million. This reflects the intent to use beginning fund balance as part of our resources to offset cost of opening two new schools and full day kindergarten in 2015-16. Debt Service Fund. The Debt Service Fund has a total fund balance of $2.2 million, all of which is restricted for the payment of debt service. The decrease of approximately $0.5 million in fund balance reflects the more stable trend of property tax collection, which allows us to forecast property tax collection more accurately. Capital Projects Fund. The Capital Projects Fund has a total fund balance of $34.8 million, all of which is restricted for ongoing capital projects. These available resources are a result of the issuance of the most recent general obligation bonds in August 2013. Total expenditures of $49.6 million in the current year reflect the work related to the construction of two new schools, major additions and renovations to facilities across the district. GENERAL FUND BUDGETARY HIGHLIGHTS In the current fiscal year all expenditures in the General Fund were within the appropriations as approved by the Board of Directors. We increased our service level (and expenditures) during the year, as evidenced by the significant variance in the expenditure budget. This service level increase was attained by using additional resources made available from increased enrollment and additional state-wide formula revenue.
Administrative School District No. 1 Deschutes County, Oregon Management’s Discussion And Analysis June 30, 2015
- 11 -
CAPITAL ASSET AND DEBT ADMINISTRATION Capital assets. Our investment in capital assets includes land, buildings and improvements, vehicles and equipment, and construction in progress. The increase in capital assets from 2014 to 2015 was approximately $42 million. This increase is due to ongoing construction projects funded by the 2013 General Obligation Bond.
-
5
10
15
20
25
30
35
40
45
50
55
60
65
70
75
80
85
90
95
Instruction Support Services Enterprise andCommunity Services
Mill
ions
Actual Expenditures vs Final Budget-General Fund
Budget Actual
Administrative School District No. 1 Deschutes County, Oregon Management’s Discussion And Analysis June 30, 2015
- 12 -
.
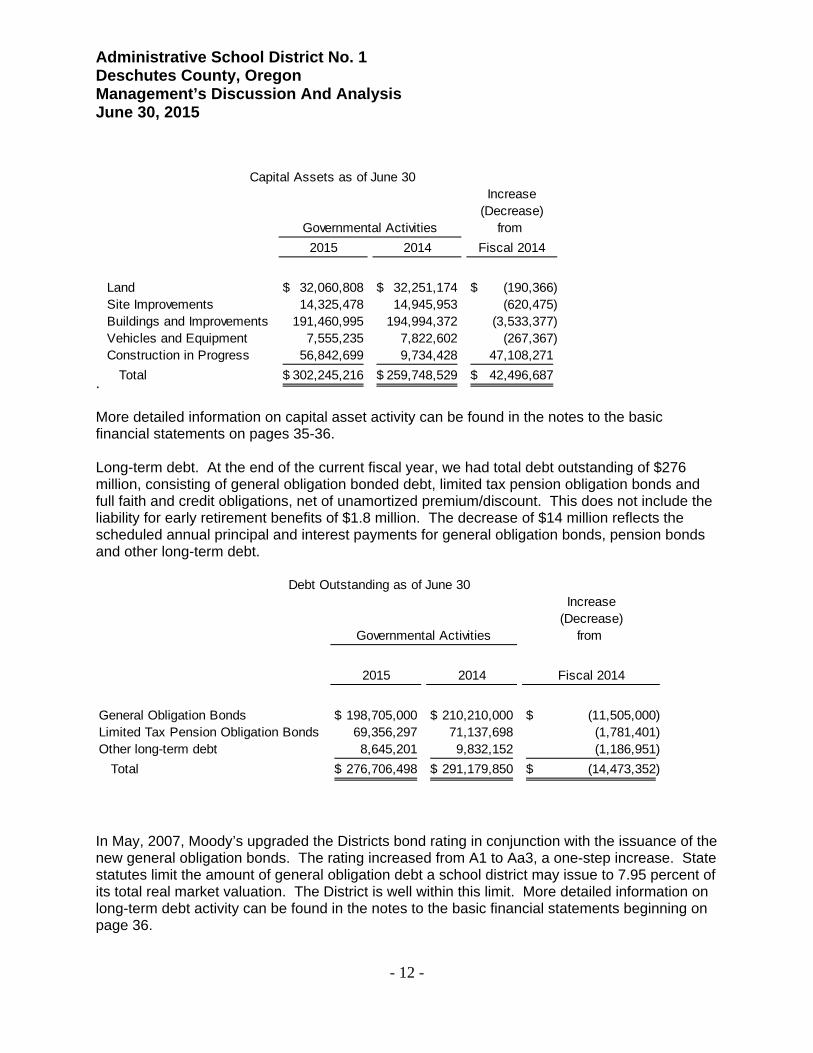
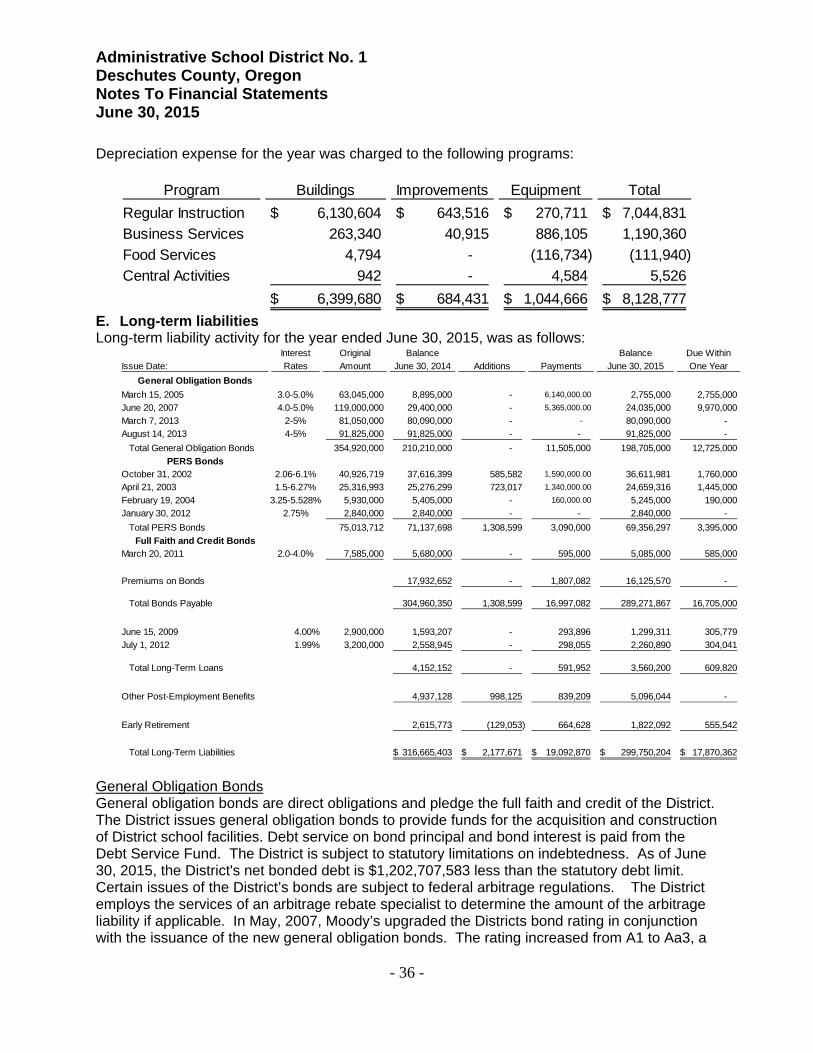
More detailed information on capital asset activity can be found in the notes to the basic financial statements on pages 35-36. Long-term debt. At the end of the current fiscal year, we had total debt outstanding of $276 million, consisting of general obligation bonded debt, limited tax pension obligation bonds and full faith and credit obligations, net of unamortized premium/discount. This does not include the liability for early retirement benefits of $1.8 million. The decrease of $14 million reflects the scheduled annual principal and interest payments for general obligation bonds, pension bonds and other long-term debt.
In May, 2007, Moody’s upgraded the Districts bond rating in conjunction with the issuance of the new general obligation bonds. The rating increased from A1 to Aa3, a one-step increase. State statutes limit the amount of general obligation debt a school district may issue to 7.95 percent of its total real market valuation. The District is well within this limit. More detailed information on long-term debt activity can be found in the notes to the basic financial statements beginning on page 36.
Increase(Decrease)
from
2015 2014 Fiscal 2014
Land 32,060,808$ 32,251,174$ (190,366)$ Site Improvements 14,325,478 14,945,953 (620,475) Buildings and Improvements 191,460,995 194,994,372 (3,533,377) Vehicles and Equipment 7,555,235 7,822,602 (267,367) Construction in Progress 56,842,699 9,734,428 47,108,271
Total 302,245,216$ 259,748,529$ 42,496,687$
Governmental Activities
Capital Assets as of June 30
Increase(Decrease)
from
2015 2014 Fiscal 2014
General Obligation Bonds 198,705,000$ 210,210,000$ (11,505,000)$ Limited Tax Pension Obligation Bonds 69,356,297 71,137,698 (1,781,401) Other long-term debt 8,645,201 9,832,152 (1,186,951)
Total 276,706,498$ 291,179,850$ (14,473,352)$
Debt Outstanding as of June 30
Governmental Activities
Administrative School District No. 1 Deschutes County, Oregon Management’s Discussion And Analysis June 30, 2015
- 13 -
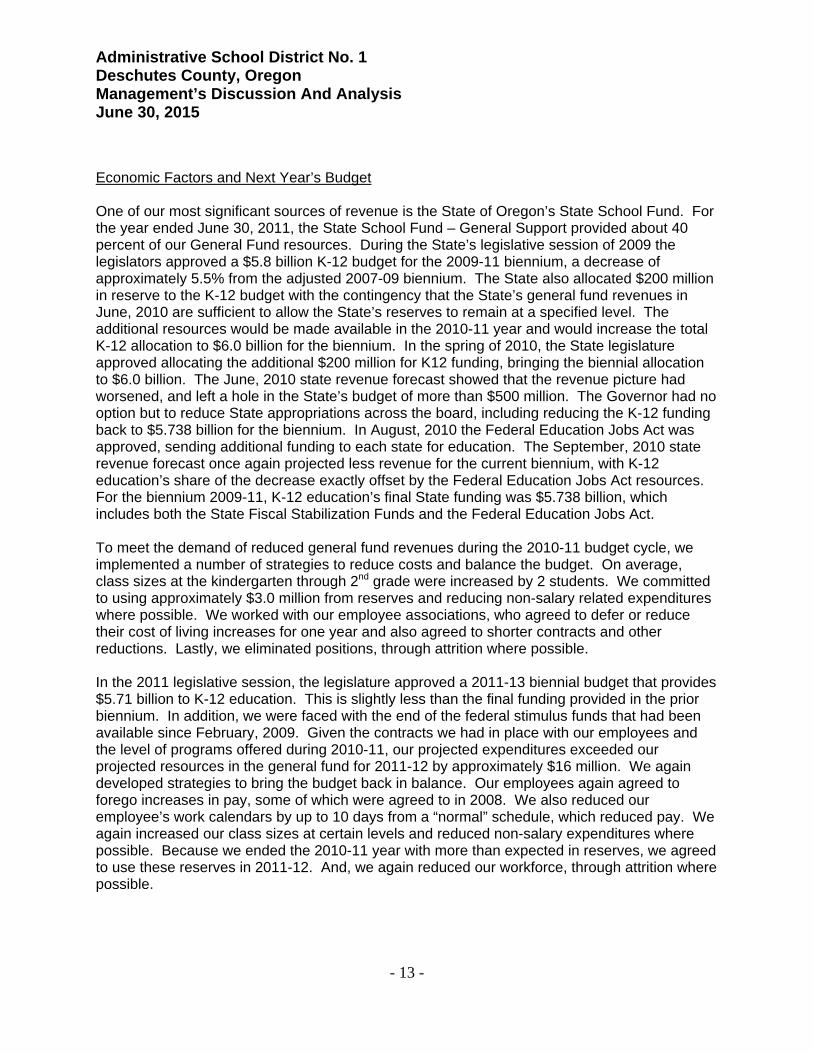
Economic Factors and Next Year’s Budget One of our most significant sources of revenue is the State of Oregon’s State School Fund. For the year ended June 30, 2011, the State School Fund – General Support provided about 40 percent of our General Fund resources. During the State’s legislative session of 2009 the legislators approved a $5.8 billion K-12 budget for the 2009-11 biennium, a decrease of approximately 5.5% from the adjusted 2007-09 biennium. The State also allocated $200 million in reserve to the K-12 budget with the contingency that the State’s general fund revenues in June, 2010 are sufficient to allow the State’s reserves to remain at a specified level. The additional resources would be made available in the 2010-11 year and would increase the total K-12 allocation to $6.0 billion for the biennium. In the spring of 2010, the State legislature approved allocating the additional $200 million for K12 funding, bringing the biennial allocation to $6.0 billion. The June, 2010 state revenue forecast showed that the revenue picture had worsened, and left a hole in the State’s budget of more than $500 million. The Governor had no option but to reduce State appropriations across the board, including reducing the K-12 funding back to $5.738 billion for the biennium. In August, 2010 the Federal Education Jobs Act was approved, sending additional funding to each state for education. The September, 2010 state revenue forecast once again projected less revenue for the current biennium, with K-12 education’s share of the decrease exactly offset by the Federal Education Jobs Act resources. For the biennium 2009-11, K-12 education’s final State funding was $5.738 billion, which includes both the State Fiscal Stabilization Funds and the Federal Education Jobs Act. To meet the demand of reduced general fund revenues during the 2010-11 budget cycle, we implemented a number of strategies to reduce costs and balance the budget. On average, class sizes at the kindergarten through 2nd grade were increased by 2 students. We committed to using approximately $3.0 million from reserves and reducing non-salary related expenditures where possible. We worked with our employee associations, who agreed to defer or reduce their cost of living increases for one year and also agreed to shorter contracts and other reductions. Lastly, we eliminated positions, through attrition where possible. In the 2011 legislative session, the legislature approved a 2011-13 biennial budget that provides $5.71 billion to K-12 education. This is slightly less than the final funding provided in the prior biennium. In addition, we were faced with the end of the federal stimulus funds that had been available since February, 2009. Given the contracts we had in place with our employees and the level of programs offered during 2010-11, our projected expenditures exceeded our projected resources in the general fund for 2011-12 by approximately $16 million. We again developed strategies to bring the budget back in balance. Our employees again agreed to forego increases in pay, some of which were agreed to in 2008. We also reduced our employee’s work calendars by up to 10 days from a “normal” schedule, which reduced pay. We again increased our class sizes at certain levels and reduced non-salary expenditures where possible. Because we ended the 2010-11 year with more than expected in reserves, we agreed to use these reserves in 2011-12. And, we again reduced our workforce, through attrition where possible.
Administrative School District No. 1 Deschutes County, Oregon Management’s Discussion And Analysis June 30, 2015
- 14 -
During the 2010-11 fiscal year the School Board approved new agreements with all of our employee groups. The support staff agreement was ratified by the association in July, 2011, and was effective July 1, 2011. The agreement is a two-year agreement on language and a one-year agreement on wages and benefits. The certified agreement was ratified by our certified group in June, 2011 and is effective July 1, 2011. In the 2013 legislative session, the legislature approved a 2013-15 biennial budget that provides $6.75 billion to K-12 education, a combination of revenue of $6.55 billion and $200 million of PERS reform through SB 822.This is a great improvement from 2011-13 and a start of reinvesting in K-12 education. In September 2013, the Governor called special session and passed five bills, providing another $100 million to K-12 for 2014-15 and deeper PERS reforms to realize real savings for 2013-15 and additional savings for 2015-17 and on. During the 2012-13 fiscal year the School Board approved new agreements with all of our employee groups. The support staff agreement was ratified by the association in September, 2013, and was effective July 1, 2013. The certified agreement was ratified by our certified group in June, 2013 and is effective July 1, 2013. The agreements for both groups are a two-year agreement on language, wages and benefits. In 2013-14, our enrollment is approximately 16,800. In combination with the Legislature’s Special Session, we have amended our budget to reflect the increase resources and requirements. In 2014-15, our enrollment is approximately 17,163. In combination with additional enrollment growth and increased local resources, we have amended our budget to reflect the increase resources and requirements. During the 2014-15 fiscal year the School Board approved new agreements with all of our employee groups. The support staff agreement was ratified by the association in September, 2013, and was effective September 1, 2015. The certified agreement was ratified by our certified group in June, 2015 and is effective July 1, 2015. The agreements for both groups are a two-year agreement on language, wages and benefits. In the 2015 legislative session, the legislature approved a 2015-17 biennial budget that provides $7.38 billion to K-12 education with a 49.2/50.8 split vs. a traditional 49/51 split. We believe it is prudent to manage our revenue and expenditure at 49/51 split. As of this writing, 2015-16 enrollment has increased by more than 350 students from the 2014-15 level to be approximately 17,500. Requests for Information This financial report is designed to present the user with a general overview of our finances and to demonstrate our accountability. Questions concerning any of the information provided in this report or requests for additional information should be addressed to our Finance Director at 520 NW Wall Street, Bend, Oregon 97701.
Basic Financial Statements
See Notes to Financial Statements
- 15 -
Administrative School District No. 1Deschutes County, OregonStatement of Net PositionJune 30, 2015, with Comparative Data
2015 2014
Assets: Cash and investments 64,305,737$ 109,920,090$ Receivables:
Property taxes 2,844,910 3,306,548 Accounts and other receivables 4,823,802 4,417,120
Prepaid items 1,264,790 753,110 Inventories 463,138 470,382 Net Pension Asset 19,970,972 - Prepaid pension UAL - 59,369,990 Capital assets, net of depreciation
Land 32,060,808 32,251,174 Construction in progress 56,842,699 9,734,428 Site improvements 14,325,478 14,945,953 Buildings and improvements 191,460,995 194,994,372 Vehicles and equipment 7,555,235 7,822,602
Total Assets 395,918,564 437,985,769
Deferred Outflow of Resources:
Deferred Outflows of Resources: 10,715,453 -
Total Outflows of Resources 10,715,453 -
LiabilitiesAccounts payable 4,967,881 4,175,392 Accrued payroll and related charges 10,050,156 9,426,485 Accrued interest 495,292 532,995 Retainage payable 2,020,791 149,476 Net Pension Liability - - Accrued general liability claims and judgments 583,978 392,826 Long-term liabilities due within one year 17,870,362 16,536,060 Long-term liabilities due in more than one year 281,879,843 300,129,346
Total Liabilities 317,868,302 331,342,580
Deferred Inflows of Resources:
Deferred Inflows of Resources: 38,535,887 -
Total Inflows of Resources 38,535,887 -
Net PositionNet Investment in capital assets 111,247,887 103,831,797 Restricted for:
Transportation 815,144 310,970 Federal, state and local programs 3,075,654 2,656,874 Debt service 2,287,056 2,859,532 Capital projects 2,379,212 2,740,298
Unrestricted (69,575,124) (5,756,282)
Total Net Position 50,229,829$ 106,643,189$
Governmental Activities
See Notes to Financial Statements
- 16 -
Administrative School District No. 1Deschutes County, OregonStatement of ActivitiesYear Ended June 30, 2015, with Comparative Data
Functions Expenses
Charges for
Services
Operating
Grants and
Contributions
Capital Grants
and
Contributions 2015 2014
Governmental ActivitiesInstruction
Regular instruction 74,280,377$ 3,634,057$ 3,522,372$ -$ (67,123,948)$ (65,686,406)$ Special programs including summer school 23,931,701 - 5,811,251 - (18,120,450) (19,528,484)
Total direct classroom services 98,212,078 3,634,057 9,333,623 - (85,244,398) (85,214,890)
Support ServicesStudents 10,069,890 - 99,704 - (9,970,186) (10,446,973) Instructional staff 6,065,679 - 2,931,337 - (3,134,342) (3,573,783) General administration 739,894 - - - (739,894) (661,118) School administration 9,478,940 - 250,839 - (9,228,101) (9,600,223) Business, transportation and maintenance 3,231,695 931,586 637,299 636,373 (1,026,437) (20,338,014) Central activities 3,968,198 - 19,291 - (3,948,907) (4,901,232) Supplemental retirement program 676,422 - - - (676,422) (2,492,630)
Total classroom support services 34,230,718 931,586 3,938,470 636,373 (28,724,289) (52,013,973)
Enterprise and Community ServicesFood services 5,804,041 1,442,506 4,550,411 - 188,876 (67,835) Other enterprise and community services 1,606,392 349,566 1,602,935 - 346,108 117,118
Total enterprise and community services 7,410,433 1,792,071 6,153,346 - 534,985 49,283
Interest on long-term liabilities 11,664,343 - - - (11,664,343) (12,975,237)
Total school district 151,517,572$ 6,357,714$ 19,425,439$ 636,373$ (125,098,045) (150,154,817)
General revenues:Property taxes levied for:
General purposes 63,524,513 59,048,422 Debt service 20,383,428 18,791,022
Federal aid not restricted to specific purposes 189,805 283,955 State aid not restricted to specific purposes 75,139,105 69,609,643 Intermediate aid not restricted to specific purposes 2,002,712 1,827,979 Earnings on investments 470,074 1,138,253 Other local revenue 2,348,763 2,372,775
Total general revenues 164,058,400 153,072,049
Change in net position 38,960,355 2,917,232
Net position - beginning 11,269,474 103,725,957
Net position - ending 50,229,829$ 106,643,189$
Governmental Activities
Program Revenues
Net (Expense) Revenue and Changes
in Net Position
See Notes to Financial Statements
- 17 -
Administrative School District No. 1Deschutes County, OregonBalance SheetGovernmental FundsJune 30, 2015, with Comparative Data
General
Special
Revenues Debt Service Capital Projects 2015 2014
Assets
Cash and investments 23,817,099$ 1,479,267$ 2,105,365$ 36,904,002$ 64,305,733$ 109,920,090$
Total fund balances 11,802,284 5,618,426 2,271,973 34,887,827 54,580,510 102,656,375
Total Liabilities and Fund Balances 28,392,982$ 5,618,426$ 2,782,348$ 36,908,618$ 73,702,374$ 118,867,250$
Totals
See Notes to Financial Statements
- 18 -
Administrative School District No. 1Deschutes County, OregonReconciliation of Governmental FundsBalance Sheet to Statement of Net PositionJune 30, 2015
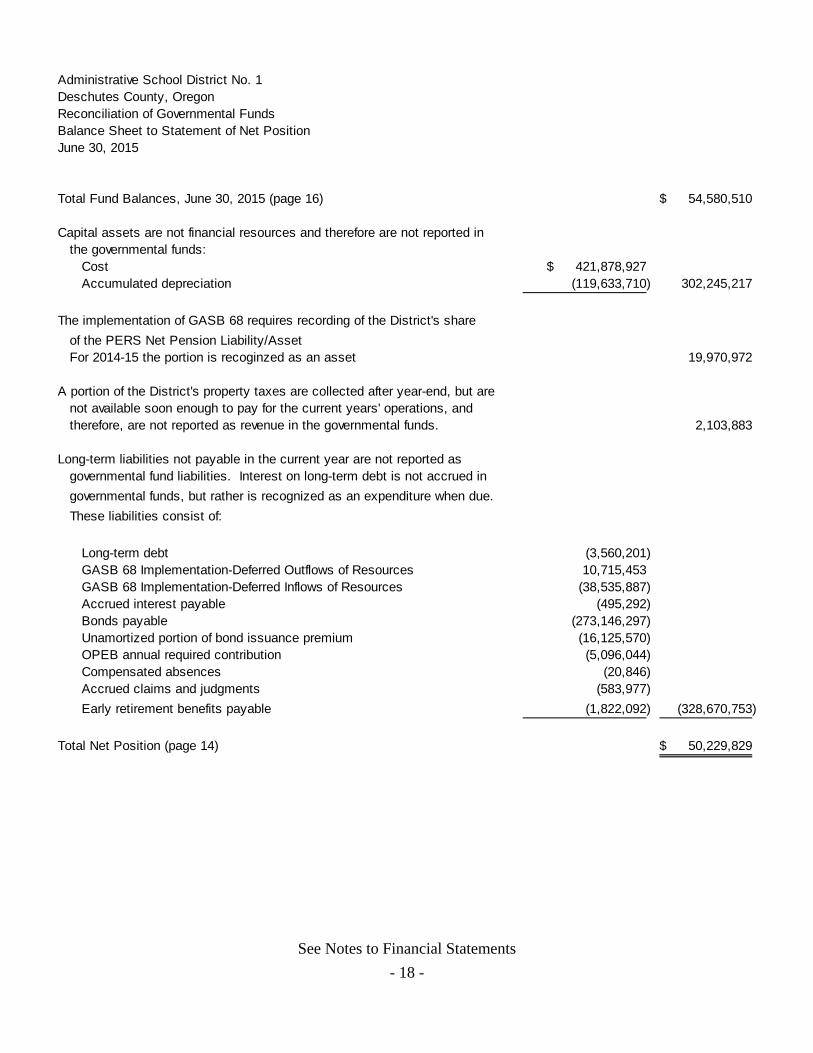
Total Fund Balances, June 30, 2015 (page 16) 54,580,510$
Capital assets are not financial resources and therefore are not reported in the governmental funds:
The implementation of GASB 68 requires recording of the District's share
of the PERS Net Pension Liability/AssetFor 2014-15 the portion is recoginzed as an asset 19,970,972
A portion of the District's property taxes are collected after year-end, but arenot available soon enough to pay for the current years' operations, andtherefore, are not reported as revenue in the governmental funds. 2,103,883
Long-term liabilities not payable in the current year are not reported asgovernmental fund liabilities. Interest on long-term debt is not accrued in
governmental funds, but rather is recognized as an expenditure when due.
These liabilities consist of:
Long-term debt (3,560,201) GASB 68 Implementation-Deferred Outflows of Resources 10,715,453 GASB 68 Implementation-Deferred Inflows of Resources (38,535,887) Accrued interest payable (495,292) Bonds payable (273,146,297) Unamortized portion of bond issuance premium (16,125,570) OPEB annual required contribution (5,096,044) Compensated absences (20,846) Accrued claims and judgments (583,977)
Early retirement benefits payable (1,822,092) (328,670,753)
Total Net Position (page 14) 50,229,829$
See Notes to Financial Statements
- 19 -
Administrative School District No. 1Deschutes County, OregonStatement of Revenues, Expenditures and Changes in Fund Balance - Governmental FundsYear Ended June 30, 2015, with Comparative Data
Capital outlay 989,725 162,380 - 48,776,700 49,928,805 13,260,630
Total expenditures 139,126,022 23,649,266 27,278,930 49,665,083 239,719,301 193,798,966
Revenues over (under) expenditures 1,672,055 707,104 (511,980) (49,498,904) (47,631,725) (14,399,407)
Other Financing Sources (Uses)General obligation bonds issued - - - - 91,825,000 Premium on issuance of bonds - - - - - 4,732,033
Sale of capital assets - - - 272,342 272,342 -
Total Other Financing Sources (Uses) - - - 272,342 272,342 96,557,033
Net change in fund balances 1,672,055 707,104 (511,980) (49,226,562) (47,359,383) 82,157,626
Fund balances, beginning of year 10,130,229 4,911,322 2,783,953 84,114,389 101,939,893 20,498,749
Fund balances, end of year 11,802,284$ 5,618,426$ 2,271,973$ 34,887,827$ 54,580,510$ 102,656,375$
Totals
See Notes to Financial Statements
- 20 -
Administrative School District No. 1Deschutes County, OregonReconciliation of the Statement of Revenues, Expenditures
and Changes in Fund Balance of Governmental Funds tothe Statement of Activities
Year Ended June 30, 2015
Net Change in Fund Balance (page 18) (47,359,383)$
Amounts reported for governmental activities in the Statement of Activitiesare different because:
Governmental funds report capital outlay as expenditures. However, in the Statement of Activities, the cost of those assets is allocated over their estimateduseful lives and reported as depreciation expense. This is the amount by which
capital outlays exceeded depreciation in the current period:Expenditures for capital assets and construction in progress 50,625,464$ Less current year depreciation (8,128,777) 42,496,687
Long-term debt proceeds are reported as other financing sources in governmental funds. In the Statement of Net Position, however, issuing long-term debt increases liabilities. Similarly, repayment of principal is an expenditure in the governmental funds but reduces the liability in the Statement of Net Position. This is the amount by which repayments exceeded proceeds:
Debt issued - Debt principal repaid 15,781,952 15,781,952
GASB 68 Implementation net of Deferred Outflows and Deferred Inflows 27,820,434
Governmental funds report the effect of issuance costs, premiums, and discountswhen debt is first issued, whereas these amounts are deferred and amortized in the Statement of Activities. This amount is the net effect of these differences:
Amortization of premiums, net of discount amortization 1,807,082 1,807,082
In the Statement of Activities interest is accrued on long-term debt, whereasin the governmental funds it is recorded as an interest expense when due.
Accreted interest on PERS UAL bonds (1,308,599) Accrued interest on general obligation bonds and other long term debt 37,707 (1,270,892)
Property taxes that do not meet the measurable and available criteria are not
recognized as revenue in the current year in the governmental funds. In the Statement of Activities property taxes are recognized as revenue when levied. (386,237)
Compensated absences are recognized as an expenditure in the governmental fundswhen they are paid. In the Statement of Activities they are recognized as anexpenditure when incurred. 20,846
Certain expenses in the Statement of Activities do require the use of current financial resources and, therefore, are not reported as expenditures in governmental funds
Early retirement benefits 792,760 OPEB annual required contribution (158,916) Estimated claims and judgments (583,978) 49,866
Change in Net Position (page 15) 38,960,355$
See Notes to Financial Statements
- 21 -
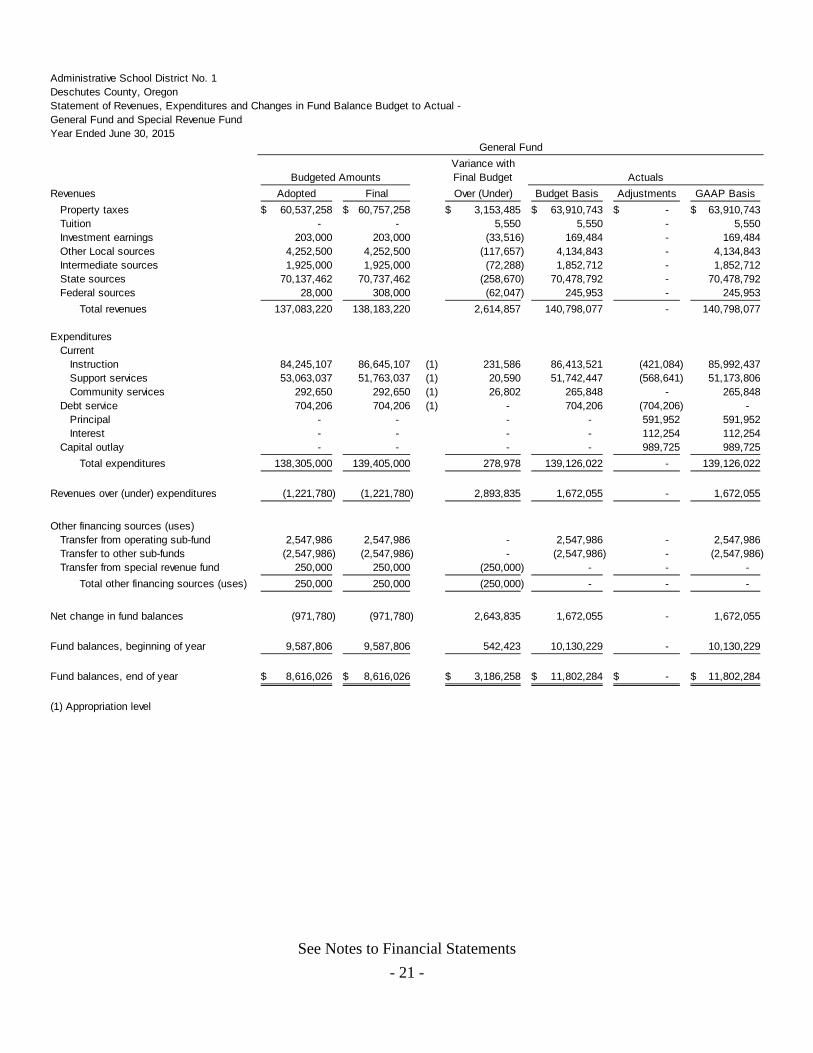
Administrative School District No. 1Deschutes County, OregonStatement of Revenues, Expenditures and Changes in Fund Balance Budget to Actual -General Fund and Special Revenue FundYear Ended June 30, 2015
Variance withFinal Budget
Revenues Adopted Final Over (Under) Budget Basis Adjustments GAAP Basis
Total expenditures 138,305,000 139,405,000 278,978 139,126,022 - 139,126,022
Revenues over (under) expenditures (1,221,780) (1,221,780) 2,893,835 1,672,055 - 1,672,055
Other financing sources (uses)Transfer from operating sub-fund 2,547,986 2,547,986 - 2,547,986 - 2,547,986 Transfer to other sub-funds (2,547,986) (2,547,986) - (2,547,986) - (2,547,986) Transfer from special revenue fund 250,000 250,000 (250,000) - - -
Total other financing sources (uses) 250,000 250,000 (250,000) - - -
Net change in fund balances (971,780) (971,780) 2,643,835 1,672,055 - 1,672,055
Fund balances, beginning of year 9,587,806 9,587,806 542,423 10,130,229 - 10,130,229
Fund balances, end of year 8,616,026$ 8,616,026$ 3,186,258$ 11,802,284$ -$ 11,802,284$
(1) Appropriation level
Budgeted Amounts Actuals
General Fund
See Notes to Financial Statements
- 22 -
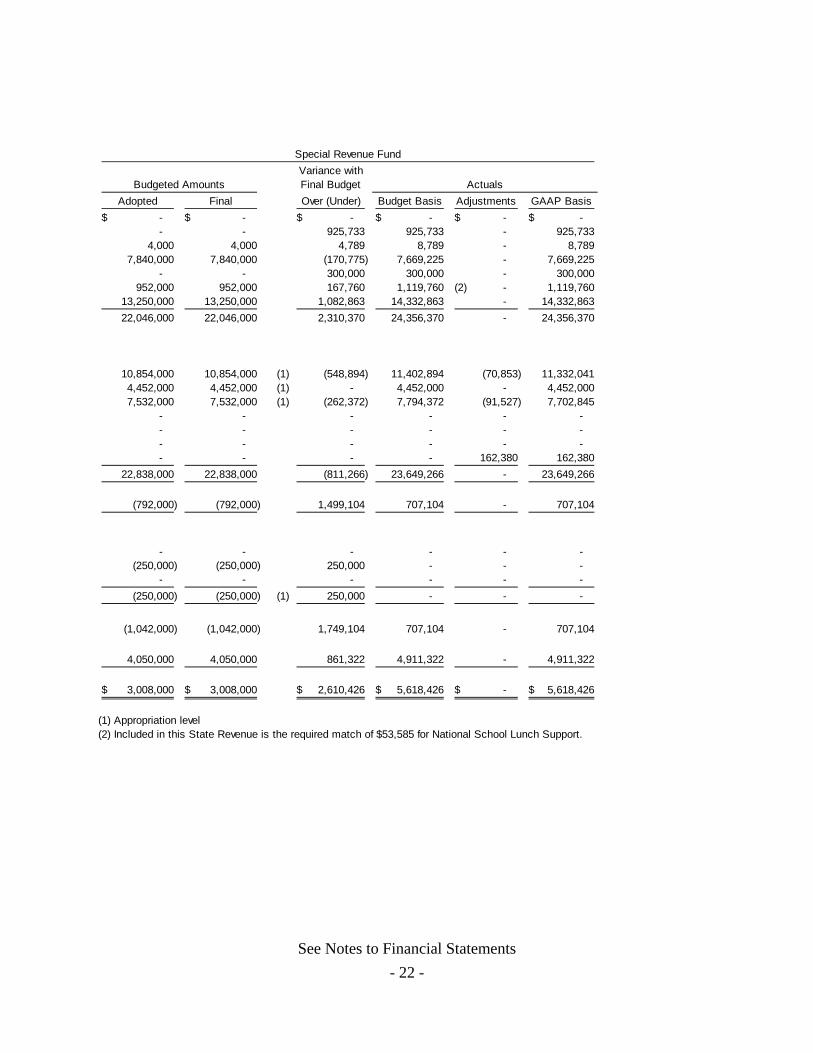
Variance withFinal Budget
Adopted Final Over (Under) Budget Basis Adjustments GAAP Basis
(1) Appropriation level(2) Included in this State Revenue is the required match of $53,585 for National School Lunch Support.
Special Revenue Fund
Budgeted Amounts Actuals
See Notes to Financial Statements
- 23 -
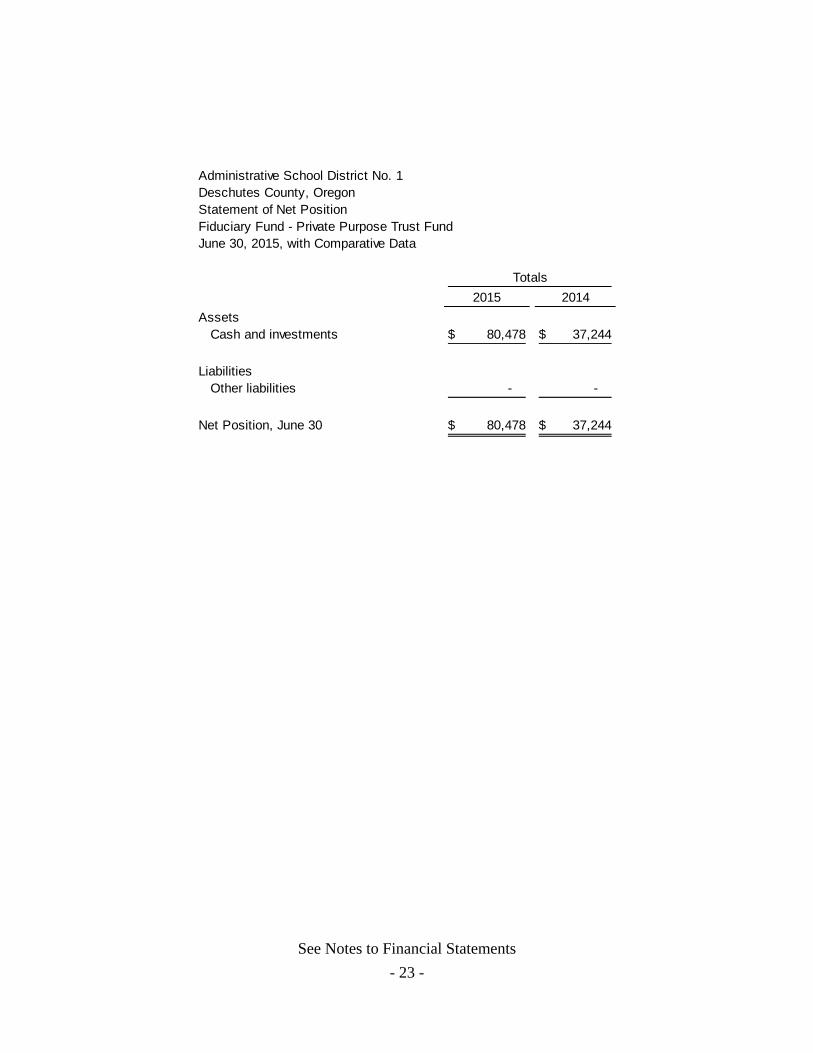
Administrative School District No. 1Deschutes County, OregonStatement of Net PositionFiduciary Fund - Private Purpose Trust FundJune 30, 2015, with Comparative Data
2015 2014
AssetsCash and investments 80,478$ 37,244$
LiabilitiesOther liabilities - -
Net Position, June 30 80,478$ 37,244$
Totals
See Notes to Financial Statements
- 24 -
Administrative School District No. 1Deschutes County, OregonStatement of Changes in Net PositionFiduciary Fund - Private Purpose Trust FundYear Ended June 30, 2015, with Comparative Data
Administrative School District No. 1 Deschutes County, Oregon Notes To Financial Statements June 30, 2015
- 25 -
I. Summary of significant accounting policies The basic financial statements of Administrative School District No. 1 (the District) have been prepared in conformity with generally accepted accounting principles (GAAP) as applied to government units. The Governmental Accounting Standards Board (GASB) is the accepted standard-setting body for establishing governmental accounting financial reporting principles. The District's significant accounting policies are described below. A. Reporting entity Administrative School District No. 1, was organized under provisions of Oregon Statutes pursuant to ORS Chapter 332 and provides education services to children from grades K-12 located in Bend and La Pine and surrounding areas. The District has five high schools, seven middle schools, and eighteen elementary schools with an approximate total enrollment of 17,500 students. The District is governed by a separately elected seven-member Board of Education (Board) who approves the administrative officials. The daily functioning of the District is under the supervision of the Superintendent. As required by generally accepted accounting principles, all activities of the District have been included in the basic financial statements.
The District qualifies as a primary government since it has a separately elected governing body, is a legally separate entity, and is fiscally independent. There are various governmental agencies and special service districts, which provide service within the District’s boundaries. However, the District is not financially accountable for any of these entities, and therefore, none of them are considered component units or included in these basic financial statements. B. Government-wide and fund financial statements The Statement of Net Position and the Statement of Activities display information about the District. These statements include the governmental financial activities of the overall District, except fiduciary activities. Eliminations have been made to minimize the double counting of internal activities, however interfund services provided and used are not eliminated in the process of elimination. Certain indirect costs are included in the program expense reported for individual functions and activities. Governmental activities are financed primarily through property taxes, intergovernmental revenues, and charges for services. The Statement of Activities presents a comparison between direct expenses and program revenues for each of its functions/programs. Direct expenses are those that are specifically associated with a function and, therefore, are clearly identifiable to that function. Program revenues include: (1) charges to students or others for tuition, fees, rentals, material, supplies or services provided, (2) operating grants and contributions and (3) capital grants and contributions. Revenues that are not classified as program revenues, including property taxes and state support, are presented as general revenues. Separate financial statements are provided for governmental funds and fiduciary funds, even though the latter are excluded from the government-wide financial statements.
Administrative School District No. 1 Deschutes County, Oregon Notes To Financial Statements June 30, 2015
- 26 -
C. Measurement focus, basis of accounting, and financial statement presentation The government-wide financial statements are reported using the economic resources measurement focus and the accrual basis of accounting. Revenues are recorded when earned and expenses are recorded when a liability is incurred, regardless of the timing of the related cash flows. Property taxes are recognized as revenues in the year for which they are levied. Grants and similar items are recognized as revenue as soon as all eligibility requirements imposed by the provider have been met. In the Statement of Activities, program revenues include grants received from federal and state agencies and student activity fees and fundraising proceeds. Governmental fund financial statements are reported using the current financial resources measurement focus and the modified accrual basis of accounting. Revenues are recognized as soon as they are both measurable and available. Revenues are considered to be available when they are collectible within the current period or soon enough thereafter to pay liabilities of the current period. For this purpose, the District considers property tax revenues to be available if they are collected within 60 days of the end of the current fiscal period. A six-month availability period is used for revenue recognition for all other governmental fund revenues susceptible to accrual. Revenues that are susceptible to accrual include federal, state and local grants which are expenditure-driven and common school fund proceeds. Expenditures are generally recorded when a liability is incurred, as under accrual accounting. However, principal and interest on long-term debt as well as expenditures related to early retirement, arbitrage rebates and post-employment healthcare benefits are recorded only when payment is due. The District reports the following major governmental funds:
General Fund - Accounts for all general operating revenues and expenditures of the District and for all financial resources not accounted for in another fund. Principal revenue sources are property taxes and state school support.
Special Revenue Fund - Accounts for revenues derived from specific grants and other
earmarked revenue sources. Principal revenue sources are federal and state grants, student fundraising activities, and school lunch sales.
Debt Service Fund – Is used to account for the accumulation of resources and payment of general obligation bond and limited tax pension obligation bond principal and interest from governmental resources such as property taxes and state school support.
Capital Projects Fund - Accounts for the acquisition and construction of major capital facilities or other improvements. Principal revenue sources are bond proceeds and interest earnings from cash and investments.
Additionally, the District reports the following fund types:
Trust Fund – This fund uses the economic resources measurement focus and accrual basis of accounting. Accounts for scholarship resources held by the District in a fiduciary capacity for use by students. Disbursements from this fund are made in accordance with the various trust agreements.
Administrative School District No. 1 Deschutes County, Oregon Notes To Financial Statements June 30, 2015
- 27 -
As a general rule the effect of inter-fund activity has been eliminated from the government-wide financial statements. When both restricted and unrestricted resources are available for use, it is the District’s policy to use restricted resources first, then unrestricted resources as they are needed. D. Assets, liabilities, and net position 1. Deposits and investments The District’s cash and cash equivalents are considered to be cash on hand, demand and savings deposits, cash with the county treasurer, and short-term investments with maturities of three months or less from the date of acquisition. State statutes authorize the District to invest in general obligations of the U.S. Government and its agencies, certain bonded obligations of Oregon municipalities, bankers' acceptances and the State of Oregon Treasurer’s Local Government Investment Pool (LGIP). Investments are reported at fair value. The LGIP operates in accordance with appropriate state laws and regulations. The reported value of the LGIP is the same as the fair value of the LGIP shares.
The Oregon State Treasury administers the LGIP. It is an open-ended no-load diversified portfolio offered to any agency, political subdivision or public corporation of the State that by law is made the custodian of, or has control of, any fund. The LGIP is commingled with the State’s short-term funds. In seeking to best serve local governments of Oregon, the Oregon legislature established the Oregon Short-Term Fund Board. The purpose of the Board is to advise the Oregon State Treasury in the management and investment options of the LGIP. 2. Receivables and payables Property taxes are levied and become a lien on July 1. Collection dates are November 15, February 15 and May 15 following the lien date. Discounts are allowed if the amount due is received by November 15 or February 15. Taxes unpaid and outstanding on May 16 are considered delinquent. Uncollected property taxes are recorded on the statement of net position. Uncollected taxes are deemed by management to be substantially collectible or recoverable through liens; therefore, no allowance for uncollectible taxes has been established. All property taxes receivable are due from property owners within the District. Accounts and other receivables are comprised primarily of claims for reimbursement of costs under various federal and state grants. Unreimbursed expenditures due from grantor agencies are reflected in the basic financial statements as receivables and revenues. Grant revenues are recorded at the time eligible expenditures are incurred. Grant monies received prior to the occurrence of qualifying expenditures are recorded as unearned revenue.
Activities between funds that are representative of lending/borrowing arrangements outstanding at the end of the fiscal year are referred to as “due to/from other funds”. There were no such arrangements as of June 30, 2015.
Administrative School District No. 1 Deschutes County, Oregon Notes To Financial Statements June 30, 2015
- 28 -
3. Inventories and prepaid items Print Shop supplies, maintenance supplies and food and other cafeteria supplies are stated at average invoice cost. Donated commodities from the United States Department of Agriculture in the Nutrition Services Fund are included in the District's inventories at fair market wholesale value. Inventory items are charged to expenditures of user departments at the time of withdrawal from inventory (consumption method). Prepaid items consist of prepaid software support fees, and are reported using the consumption method, where items are charged to expenditure as the service is provided. 4. Capital Assets Capital assets are recorded at original or estimated original cost. Donated capital assets are recorded at their estimated fair market value on the date donated. The District defines capital assets as assets with an initial cost of more than $5,000 and an estimated life in excess of one year. Interest incurred during construction is not capitalized. Maintenance and repairs that do not add to the value of the asset or materially extend assets’ lives are not capitalized. Capital assets are depreciated using the straight-line method over the following useful lives:
Buildings and improvements 20 to 50 years Equipment 5 to 10 years
5. Self-Insurance The District is self-insured for costs up to policy deductible limits as follows:
Fire loss, property damage, theft, vandalism, etc. - $50,000 per occurrence School Board errors and omissions - $10,000 per occurrence
The District is self-insured for unemployment claims. 6. Retirement Plans Substantially all of the District's employees are participants in the State of Oregon Public Employees Retirement System (PERS). For the purpose of measuring the net pension liability, deferred outflows of resources and deferred inflows of resources related to pensions, and pension expense, information about fiduciary net position of PERS and additions to/deductions from PERS’s fiduciary net position have been determined on the same basis as they are reported by PERS. For this purpose, benefit payments (including refunds of employee contributions) are recognized when due and payable in accordance with the benefit terms. Investments are reported at fair value. GASB 68 and 71 have been implemented as of July 1, 2014. In addition, certificated employees, classified employees and eligible administrative supervisors who retire under PERS with ten years of regular service qualify for early retirement benefits which are funded and charged to expenses/expenditures on a pay-as-you-go basis. In the government wide statements, the early termination benefit liability is computed by estimating the annual benefit due to retirees participating in the plan at the end of the fiscal year, and discounting to its net present value. On June 30, 2013, the plan closed to new retirees.
Administrative School District No. 1 Deschutes County, Oregon Notes To Financial Statements June 30, 2015
- 29 -
The District offers its employees a tax deferred annuity plan established pursuant to Section 403(b) of the Internal Revenue Code, as well as a deferred compensation plan pursuant to Section 457 of the Internal Revenue code. In June 2012, the GASB issued Statement No. 68, Accounting and Financial Reporting for Pensions. This statement provides guidance for accounting for net pension liabilities, including definition of balances to be included in deferred inflows and deferred outflows of resources. The specific accounts impacting the District are detailed below. Net pension liability – Previous standards defined pension liabilities in terms of the Annually Required Contribution. Statement No. 68 defines the net pension liability as the portion of the actuarial present value of projected benefit payments that is attributed to past periods of employee service, net of the pension plan’s fiduciary net position. Deferred inflows of resources and deferred outflows of resources – Statement No. 68 includes recognition of deferred inflows and outflows of resources associated with the difference between projected and actual earnings on pension plan investments. These differences are to be recognized in pension expense using a systematic and rational method over a closed five-year period. 7. Compensated Absences District personnel currently work under an annual contract based upon the number of workdays in each year. Employees under such contracts have no vested vacation pay benefits. Beginning in the 08-09 school year, certain administrators were able to accrue unused vacation leave from year to year up to a total of 30 days. Upon resignation or termination of employment, these employees will receive pay for up to 20 of these accrued vacation days. Currently, accumulated compensatory benefits earned by employees are paid as of June 30 each year. Sick pay does not vest. 8. Fund Equity In the fund financial statements, governmental funds are categorized by the nature of the resources within the fund. The district reports fund balance using the following categories:
Nonspendable fund balance indicates the portion of fund equity that cannot be spent as it is not in a spendable format, such as inventories and prepaid expenditures. Restricted fund balance indicates the portion of fund equity the use of which is externally restricted by grantors, creditors, or law. Assigned fund balance indicates the portion of fund equity that the District intends to use for a specific purpose imposed by the Superintendent or designee. The Governing Body delegated the authority to the Superintendent or designee to assign fund balance. Unassigned fund balance indicates the amount of general fund equity that is available for budgeting in future periods.
9. Long-Term Debt In the government-wide financial statements long-term debt is reported as a liability in the Statement of Net Position. Bond premiums and discounts are deferred and amortized over the life of the bonds using the straight-line method. Beginning with 2013-14, per new requirements in GASB 65, bond issuance costs are recognized when incurred and not deferred. Bonds
Administrative School District No. 1 Deschutes County, Oregon Notes To Financial Statements June 30, 2015
- 30 -
payable are reported net of the applicable bond premium or discount. In the fund financial statements bond premiums and discounts, as well as bond issuance costs, are recognized when incurred and not deferred. The face amount of the debt issued, premiums received on debt issuances, and discounts are reported as other financing sources and uses. Issuance cost, whether or not withheld from the actual debt proceeds received, are reported as debt service expenditures. 10. Use of Estimates The preparation of basic financial statements, in conformity with accounting principles generally accepted in the United States of America, requires management to make estimates and assumptions that affect the reported amounts of assets and liabilities and disclosure of contingent assets and liabilities at the date of the basic financial statements and reported amounts of revenues and expenses/expenditures during the reporting period. Actual results could differ from those estimates.
II. Stewardship, compliance, and accountability A. Budgetary information Annual budgets, as required by state statutes, are adopted on the modified accrual basis of accounting for all governmental funds. The budget is prepared by fund, function and activity. The budget document includes information on the past two years, current year budget information, as well as requested appropriation and estimated revenues for the ensuing fiscal year. The proposed budget is presented by the budget officer to the budget committee. Public meetings are held by the budget committee. The budget committee may make changes to the original document. The budget committee approves the budget document to be submitted to the governing body of the district. Once the budget document is received by the governing body, they hold a public hearing on a date as published. After the public hearing, the governing body gives consideration to matters discussed and makes amendments to the budget document prior to adoption.
However, state statutes do not allow the governing body to increase estimated expenditures for each fund by more than ten percent. The amount of the total ad valorem taxes to be certified by the county for levy for all funds shall not exceed the amount presented by the budget committee unless the budget document is republished and another public hearing is held. The governing body is then required by state statutes to adopt the budget, make appropriations, and certify the levy of ad valorem taxes for each fund. The level of control for appropriations is exercised at the program level. The program level consists of instruction, support services, enterprise and community services, facilities acquisition and construction, debt service and transfers.
Administrative School District No. 1 Deschutes County, Oregon Notes To Financial Statements June 30, 2015
- 31 -
Unexpected additional resources may be added to the budget through the use of a supplemental budget and appropriations ordinance. Original and supplemental budgets may be modified by the use of appropriation transfers between the levels of control. Such transfers require approval by the governing body. All appropriations lapse at the end of the District's fiscal year.
Administrative School District No. 1 Deschutes County, Oregon Notes To Financial Statements June 30, 2015
- 32 -
The District has budgeted for administrative purposes, sub-fund account groupings within the General Fund. The sub-funds have been employed to allow the administration flexibility in managing fiscal matters while complying with statutory requirements. The sub-fund account groupings used for administrative purposes are as follows:
General Fund
General Operations Facility Usage Athletics and Activities Technology Reserve Maintenance Replacement Transportation Equipment Insurance Reserve Print Shop Equipment Instructional Materials B. Excess of expenditures over appropriations ORS 294.435 states in part “no greater expenditure of public money shall be made for any specific purpose than the amount appropriated therefore.” For the year ended June 30, 2015, the expenditures in Special Revenue Fund, for Instruction and Community Services, and Capital Projects Fund, for Facilities Acquisition, exceeded appropriations.
III. Detailed notes on all funds A. Deposits and investments Deposits At June 30, 2015 the District held cash of $8,179,981 with a bank balance of $7,947,138. The insurance and collateral requirements for deposits are established by banking regulations and Oregon law. FDIC insurance of $250,000 for interest bearing accounts and 100% for non-interest bearing accounts applies to the deposits in each depository. Where balances continually exceed $250,000, ORS 295 requires bank depositories to pledge collateral against any public funds deposits in excess of deposit insurance amounts. ORS 295 sets the specific value of the collateral, as well as the types of collateral that are acceptable. ORS 295 creates a shared liability structure for participating bank depositories, better protecting public funds though still not guaranteeing that all funds are 100% protected. Banks are required to report quarterly to Treasury, providing quarter-end public funds balances in excess of the FDIC limits, net worth, and FDIC capitalization information. The FDIC assigns each bank with a capitalization category quarterly, either well capitalized, adequately capitalized or undercapitalized. The Public Funds Collaterization Program calculates, based on this information, the bank’s minimum collateral required, which is the value that must be pledged with the custodian for the next quarter. The minimum collateral requirement is reported to the bank, OST and custodian. Public officials are required to verify that deposit accounts in excess of deposit insurance limits are only maintained at financial institutions included on the list of qualified depositories found on the Treasurer’s web site.
Administrative School District No. 1 Deschutes County, Oregon Notes To Financial Statements June 30, 2015
- 33 -
Custodial credit risk – cash and cash equivalents. In the case of deposits, this is the risk that in the event of a bank failure, the District’s deposits may not be returned to it. The District does not have a policy for custodial credit risk for deposits. The provisions of ORS 295 create a shared liability structure for participating bank depositories, better protecting public funds though still not guaranteeing that all funds are 100% protected.
Investments At June 30, 2015 the District was invested as follows:
Custodial credit risk - investments. For an investment, this is the risk that, in the event of the failure of the counterparty, the District will not be able to recover the value of its investments or collateral securities that are in the possession of an outside party. The District has a Third Party Safekeeping Agreement (TPSA) with Wells Fargo Bank to hold certain securities in trust. All of the securities subject to the TPSA are held in trust in the District’s name. The District does not have a policy for custodial credit risk for certificates of deposit. Credit risk. Credit risk is the risk that an issuer or other counterparty to an investment will not fulfill its obligation. The District’s investment policy minimizes this risk by limiting investments to the safest types of securities and by diversifying the investment portfolio; this is done by limiting the District’s exposure to an individual security issuer or backer, when possible. The schedule above summarizes the District’s holdings by rating. Concentration of credit risk. The District’s investment policy requires that the District’s investments be diversified across maturities, security type, and institution to avoid incurring unreasonable risk. The investment holdings at June 30, 2015 meet the requirements of this policy. Interest rate risk. Interest rate risk is lessened by generally matching investment maturities with cash requirements so that sales prior to maturities are minimized. The District’s investment policy requires that only investments that can be held to maturity shall be purchased. At June 30, 2015 the District’s investment holdings meet the requirement of this policy.
Investment type:
Credit
quality
Reported
amount Up to 6 months
6 months to 1
year
State of Oregon Investment Pool N/A 35,103,761$ 35,103,761$ -$ Certificates of Deposit N/A 6,008,595 3,000 6,005,595
Federal Home Loan Bank Bonds AAA 5,007,150 - 5,007,150
Federal Home Loan Bank Bonds AAA 5,001,850 - 5,001,850
Federal Home Loan Bank Bonds AAA 5,004,400 - 5,004,400
Total 56,125,756$ 35,106,761$ 21,018,995$
Maturities
Administrative School District No. 1 Deschutes County, Oregon Notes To Financial Statements June 30, 2015
- 34 -
B. Tax collections The voters of the State of Oregon approved Ballot Measure 5, a constitutional limit on property taxes for schools and non-school government operations in November, 1990. The limitation provides that property taxes for school operations are limited to $5.00 for each $1,000 of property market value. The limitation does not apply to taxes levied for principal and interest on general obligation bonded debt. The voters of the State of Oregon later passed Measure 50 in May, 1997, which further reduced taxes by replacing the previous constitutional limits on tax bases with a rate and value limit. Measure 50 reduced the amount of operating property tax revenues available for its 1997-98 fiscal year and thereafter. This reduction was accomplished by rolling assessed property values back to their 1995-96 values less 10% and limiting future tax value growth of each property to no more than 3% per year, subject to certain exceptions. Taxes levied to support bonded debt are exempted from the reductions. The Measure also sets restrictive voter approval requirements for most tax and many fee increases and new bond issues, and requires the State of Oregon to minimize the impact of the tax cuts to school districts. The result of these initiatives has been that school districts have become more dependent upon state school funding and less dependent upon property tax revenues as their major source of operating revenue. The levy for general operations is based on a permanent rate of $4.7641 per thousand of assessed valuation. The levies, as extended on the tax rolls, are summarized as follows:
Unpaid taxes become subject to foreclosure four years after they become a lien on the property. Tax collections and foreclosure are the responsibility of the county tax collector/treasurer. C. Receivables The accounts and other receivable in the General Fund are primarily receivables from other government entities such as Oregon Department of Education, and High Desert Education Service District for reimbursement of expenditures. The accounts and other receivable in Special Revenue Funds represent balances due from state and federal governments for special program grants.
Debt
General Fund Service Fund
Certification to Assessor 66,199,304 20,758,475
Farm land and open space taxes 21,771 6,791
Other adjustments 38,011 11,852
Truncation gain 586 991
Loss to compression (1,076,571) -
Levy as extended on tax rolls 65,183,101 20,778,109
Administrative School District No. 1 Deschutes County, Oregon Notes To Financial Statements June 30, 2015
- 35 -
Accounts and other receivables on the Statement of Net Position are comprised of the following as of June 30, 2015:
D. Capital assets Capital asset activity for the year-ended June 30, 2015 was as follows:
Amount
Grants 3,813,385$
Common school fund 765,033
Other 245,384
Total 4,823,802$
Balance BalanceJune 30, 2014 Increases Decreases June 30, 2015
Capital assets not being depreciatedLand 32,251,174$ -$ 190,365$ 32,060,809$ Construction in progress 9,734,428 47,108,271 - 56,842,699
Total non-depreciable assets 41,985,602 47,108,271 190,365 88,903,508
Capital assets being depreciated:Buildings and improvements 286,261,744 2,866,304 - 289,128,048 Site improvements 19,672,790 63,956 - 19,736,746 Vehicles and equipment 23,333,327 777,298 - 24,110,625
Total depreciable assets 329,267,861 3,707,558 - 332,975,419
Less accumulated depreciation for:Buildings and improvements (91,267,371) (6,399,680) - (97,667,051) Site improvements (4,726,837) (684,431) - (5,411,268) Vehicles and equipment (15,510,725) (1,044,666) - (16,555,391)
Total accumulated depreciation (111,504,934) (8,128,777) - (119,633,710)
Total depreciable assets, net 217,762,927 (4,421,219) - 213,341,709
Total capital assets, net 259,748,530$ 42,687,052$ 190,365$ 302,245,217$
Administrative School District No. 1 Deschutes County, Oregon Notes To Financial Statements June 30, 2015
- 36 -
Depreciation expense for the year was charged to the following programs:
E. Long-term liabilities Long-term liability activity for the year ended June 30, 2015, was as follows:
General Obligation Bonds General obligation bonds are direct obligations and pledge the full faith and credit of the District. The District issues general obligation bonds to provide funds for the acquisition and construction of District school facilities. Debt service on bond principal and bond interest is paid from the Debt Service Fund. The District is subject to statutory limitations on indebtedness. As of June 30, 2015, the District's net bonded debt is $1,202,707,583 less than the statutory debt limit. Certain issues of the District’s bonds are subject to federal arbitrage regulations. The District employs the services of an arbitrage rebate specialist to determine the amount of the arbitrage liability if applicable. In May, 2007, Moody’s upgraded the Districts bond rating in conjunction with the issuance of the new general obligation bonds. The rating increased from A1 to Aa3, a
April 21, 2003 1.5-6.27% 25,316,993 25,276,299 723,017 1,340,000.00 24,659,316 1,445,000
February 19, 2004 3.25-5.528% 5,930,000 5,405,000 - 160,000.00 5,245,000 190,000
January 30, 2012 2.75% 2,840,000 2,840,000 - - 2,840,000 -
Total PERS Bonds 75,013,712 71,137,698 1,308,599 3,090,000 69,356,297 3,395,000
Full Faith and Credit BondsMarch 20, 2011 2.0-4.0% 7,585,000 5,680,000 - 595,000 5,085,000 585,000
Premiums on Bonds 17,932,652 - 1,807,082 16,125,570 -
Total Bonds Payable 304,960,350 1,308,599 16,997,082 289,271,867 16,705,000
June 15, 2009 4.00% 2,900,000 1,593,207 - 293,896 1,299,311 305,779
July 1, 2012 1.99% 3,200,000 2,558,945 - 298,055 2,260,890 304,041
Total Long-Term Loans 4,152,152 - 591,952 3,560,200 609,820
Other Post-Employment Benefits 4,937,128 998,125 839,209 5,096,044 -
Early Retirement 2,615,773 (129,053) 664,628 1,822,092 555,542
Total Long-Term Liabilities 316,665,403$ 2,177,671$ 19,092,870$ 299,750,204$ 17,870,362$
Administrative School District No. 1 Deschutes County, Oregon Notes To Financial Statements June 30, 2015
- 37 -
one-step increase. In February, 2013 the District refinanced a portion of the 2007 General Obligation Bonds. This refinancing will save approximately $3.8 million over the life of the debt. In August 2013, we issued $91 million in general obligation bonds to fund new construction and capital improvements. Future maturities to service the general obligation bonds outstanding as of June 30, 2015, are as follows:
Limited Tax Pension Obligation Bonds The District participated in the OSBA Pension Bond Pool for the purpose of funding the District’s allocated portion of the PERS Unfunded Actuarial Liability (UAL). Bonds in the amount of $40,926,720 were issued October 31, 2002, additional bonds in the amount of $25,316,992 were issued April 21, 2003 and $5,930,000 were issued February 19, 2004. The bonds are being amortized over 25-26 years. In February, 2012 the District refinanced a portion of the 2002 Pension Bonds. This refinance will save approximately $45,000 per year in interest. Debt service on bond principal and interest is paid from the debt service fund. Future maturities to service the limited tax pension obligation bonds outstanding as of June 30, 2015, are as follows:
Year Ending
June 30, Principal Interest Total
2016 12,725,000 8,662,463 21,387,463
2017 14,065,000 8,036,213 22,101,213
2018 15,235,000 7,353,613 22,588,613
2019 16,815,000 6,743,913 23,558,913
2020 10,290,000 5,978,463 16,268,463
2021-2025 70,270,000 21,766,463 92,036,463
2026-2030 43,620,000 9,229,438 52,849,438
2031-2033 15,685,000 975,000 16,660,000
198,705,000$ 68,745,566$ 267,450,566$
Year Ending
June 30, Principal Interest Total
2016 2,086,401$ 3,968,737$ 6,055,138$
2017 2,481,542 3,874,052 6,355,594
2018 2,926,884 3,752,696 6,679,580
2019 3,419,688 3,601,834 7,021,522
2020 3,947,826 3,418,526 7,366,352
2021-2025 30,495,359 12,558,504 43,053,863
2026-2028 22,690,000 2,310,502 25,000,502
68,047,698$ 33,484,852$ 101,532,551$
Administrative School District No. 1 Deschutes County, Oregon Notes To Financial Statements June 30, 2015
- 38 -
Full Faith and Credit Bonds On March 21, 2011, the District issued full faith and credit bonds to refinance a long-term loan taken out in 2009 that was used to the finance the repair of Summit High School athletic fields. The refunding was undertaken to reduce total debt service payments over the next 16 years by $886,848 and resulted in an economic gain to the taxpayers of approximately $740,000. The bonds mature in January 2024 and the interest rates range from 2-4%. Future maturities to service the Full Faith and Credit bonds are as follows:
Long-term loans During 2009, the District borrowed funds to purchase 21 busses. This loan matures on June 15, 2019 with a fixed interest rate of 4.00%. On July 1, 2012, we financed $3,200,000 to purchase 28 school buses. The loan matures in 2022 and the fixed interest rate is 1.99%. Future maturities to service the long-term loans outstanding as of June 30, 2015 are as follows:
Year Ending
June 30, Principal Interest Total
2016 585,000$ 200,475$ 785,475$
2017 580,000 180,000 760,000
2018 575,000 156,800 731,800
2019 570,000 133,800 703,800
2020 565,000 111,000 676,000
2021-2024 2,210,000 220,000 2,430,000
5,085,000$ 1,002,075$ 6,087,075$
Year Ending
June 30, Principal Interest Total
2016 609,820$ 94,386$ 704,206$
2017 628,288 75,917 704,205
2018 647,380 56,826 704,206
2019 667,116 37,090 704,206
2020 329,210 20,235 349,445
2021-2023 678,387 20,503 698,890
3,560,201$ 304,957$ 3,865,158$
Administrative School District No. 1 Deschutes County, Oregon Notes To Financial Statements June 30, 2015
- 39 -
Leases The District leases facilities and equipment under non-cancelable operating leases. Total costs for such leases were $218,823 for the year ended June 30, 2015. The future minimum lease payments for these leases are as follows:
In prior years, the general fund has been used to liquidate long-term liabilities other than debt. F. Interfund Transfers There were no Interfund transfers in 2014-15.
G. Fund balances The District categorizes its fund balance for major funds as nonspendable, restricted, assigned or unassigned. Nonspendable fund balance represents resources that can’t be spent as they are not in a spendable format. Restricted fund balances represent resources whose use is constrained by externally imposed restrictions placed by creditors, grantors or contributors or those restrictions imposed by law. Assigned fund balances represent amounts the district intends to use for specific purposes and are imposed by the Superintendent or designee. The authority for the Superintendent or designee to assign resources for specific purposes is granted by the School Board, the District’s governing body. For the classification of unrestricted ending fund balance the District first reduces assigned amounts, then unassigned amounts when expenditures are incurred for purposes for which amounts in any of those unrestricted fund balance classifications could be used. At times when restricted and unrestricted amounts can be used, the District uses restricted amounts first.
Administrative School District No. 1 Deschutes County, Oregon Notes To Financial Statements June 30, 2015
- 40 -
Details of fund balance classifications displayed in the aggregate are as follows:
IV. Other Information
A. Termination benefits Special termination benefits have been made available to employees who meet guidelines of a plan adopted by the Board on May 3, 1983 and revised most recently on May 27, 2009. All employees are eligible to apply for participation in the plan if they have been employed with the District for at least the ten consecutive years prior to their retirement date and also qualify for retirement in accordance with the PERS/OPSRP guidelines in force at the time of early retirement. The maximum monthly benefit paid by the District will be equal to .1667 times the base salary divided by 12. Base salary is the average of the scheduled annual gross regular salary for the three highest completed paid contract years before retirement, but shall not exceed $36,000. Employees do not contribute to the plan and accrue no vested benefits prior to their acceptance in the program. The District's liability under the program is reported in the government-wide statements. The
Special Debt CapitalGeneral Revenue Service Projects June 30, June 30,
Administrative School District No. 1 Deschutes County, Oregon Notes To Financial Statements June 30, 2015
- 41 -
plan is funded by an assessment charged against payroll in all funds. The assessed charges are accumulated and stipends paid from the special revenue fund. The intent of this assessment is to fund the plan on a “pay-as-you-go” basis and not to accumulate resources in the special revenue fund for this plan. These benefits are in addition to benefits that may become available under the pension plan administered under the State of Oregon Public Employees Retirement System. The expenditures incurred under the post-employment benefit plan during the current fiscal year totaled $664,276 and covered 161 retirees. A liability for termination benefits has been recorded in the government-wide statements. The liability was derived by calculating the future benefit for all current participants based on the monthly maximum amount available to each participant for the years that they are eligible for the plan. The total liability is then discounted using a 15-year average market yield rate on US Treasury securities to reflect the present value of future cash flows. On May 27, 2009, the School Board voted to implement a phasing out of the program. All employees participating in the plan before the effective date of the phase out period will receive benefits as anticipated when they retire. Beginning in fiscal year 2009-10, benefits under the plan were reduced each year by 10%, ending with fiscal year 2012-13 where benefits will be reduced to 60% of the amount they would have received. On June 30, 2013, the plan closed to new retirees. Future maturities of termination benefits payable are as follows:
Administrative School District No. 1 Deschutes County, Oregon Notes To Financial Statements June 30, 2015
- 42 -
B. Pension plan Plan Description Administrative School District No. 1 is participating in the State of Oregon Public Employees Retirement System (PERS), a cost-sharing multiple-employer defined benefit pension plan administered by PERS. The Oregon Public Employees Retirement System (PERS) consists of a single cost-sharing multiple-employee defined benefit plan. All benefits of the system are established by the legislature pursuant to Oregon Revised Statute (ORS) Chapters 238 and 238A. Oregon PERS produces an independently audited Comprehensive Annual Financial Report which can be found at: http://www.oregon.gov/pers PERS Pension (Chapter 238). The ORS Chapter 238 Defined Benefit Plan is closed to new members hired on or after August 29, 2003. For the purpose of measuring the net pension liability, deferred outflows of resources and deferred inflows of resources related to pensions, and pension expense, information about fiduciary net position of PERS and additions to/deductions from PERS’s fiduciary net position have been determined on the same basis as they are reported by PERS. For this purpose, benefit payments (including refunds of employee contributions) are recognized when due and payable in accordance with the benefit terms. Investments are reported at fair value. GASB Statements 68 and 71 have been implemented as of July 1, 2014. Pension Benefits: The PERS retirement allowance is payable monthly for life. It may be selected from 13 retirement benefit options. These options include survivorship benefits and lump-sum refunds. The basic benefit is based on years of service and final average salary. A percentage (2.0 percent for police and fire employees, and 1.67 percent for general service employees) is multiplied by the number of years of service and the final average salary. Benefits may also be calculated under either a formula plus annuity (for members who were contributing before August 21, 1981) or a money match computation if a greater benefits results. Death Benefits: Upon the death of a non-retired member, the beneficiary receives a lump-sum refund of the member’s account balance (accumulated contributions and interest). In addition, the beneficiary will receive a lump-sum payment from employer funds equal to the account balance, provided on or more of the following contributions are met: member was employed by PERS employer at the time of death, member died within 120 days after termination of PERS covered employment, member died as a result of injury sustained while employed in a PERS-covered job, or member was on an official leave of absence from a PERS-covered job at the time of death. Disability Benefits: A member with 10 or more years of creditable service who becomes disable from other than duty-connected causes may receive a non-duty disability benefit. A disability resulting from a job-incurred injury or illness qualifies a member (including PERS judge members) for disability benefits regardless of the length of PERS-covered service. Upon qualifying for either a non-duty or duty disability, service time is computed to age 58 (55 for police and fire members) when determining the monthly benefit. Benefit Changes After Retirement: Members may choose to continue participation in a variable equities investment account after retiring and may experience annual benefit fluctuations due to changes in the market value equity investments. Under ORS 238.360 monthly benefits are adjusted annually through cost-of-living changes. The cap on the COLA will vary based on the amount of the annual benefit.
Administrative School District No. 1 Deschutes County, Oregon Notes To Financial Statements June 30, 2015
- 43 -
OPSRP Pension Program (OPSRP DB): The ORS Chapter 238A Defined Benefit Pension Program provides benefits to members hired on or after August 29, 2003. Pension Benefits: This portion of OPSRP provides a life pension funded by employer contributions. Benefits are calculated with the following formula for members who attain normal retirement age: Police and fire: 1.8 percent is multiplied by the number of years of service and the final average salary. Normal retirement age for police and fire members is age 60 or age 53 with 25 years of retirement credit. To be classified as a police and fire member, the individual must have been employed continuously as a police and fire member for at least five years immediately preceding retirement. General service: 1.5 percent is multiplied by the number of years of service and the final average salary. Normal retirement age for general service members is age 65, or age 58 with 30 years of retirement credit. A member of the pension program becomes vested on the earliest of the following dates: the date the member completes 600 hours of service in each of five calendar years, the date the member reaches normal retirement age, and, if the pension program is terminated, the date on which termination becomes effective. Death Benefits: Upon the death of a non-retired member, the spouse or other person who is constitutionally required to be treated in the same manner as the spouse, receives for life 50 percent of the pension that would otherwise have been paid to the deceased member. Disability Benefits: A member who has accrued 10 or more years of retirement credits before the member becomes disabled or a member who becomes disabled due to job-related injury shall receive a disability benefit of 45 percent of the member’s salary determined as of the last full month of employment before the disability occurred. Benefit Changes After Retirement: Under ORS 238A.210 monthly benefits are adjusted annually through cost-of-living changes. The cap on the COLA will vary based on the amount of the annual benefit.
Contributions PERS members are required to contribute 6% of their salary and the employer makes contributions at an actuarially determined rate as adopted by the PERS Board. The rate for Tier I and Tier II for the year ended June 30, 2015 was 13.65% of covered annual payroll. The rate for OPSRP for the year ended June 30, 2015 was 11.65%. The contribution requirements of plan members are established by state statute. The employer contribution is set and may be amended by the Retirement Board. The District’s contributions to Oregon PERS for the years ended June 30, 2015, 2014, and 2013 were $10,045,456, $11,237,149, and $9,083,637, respectively. Because all PERS employers are required by law to submit the contributions adopted by the Retirement Board, and employer contributions are calculated in conformance with the standards of GASB Statement 27, there is no Net Pension Obligation. The contributions actually made are equivalent to the Annual Pension Cost. In addition, employee contributions for the years ended June 30, 2015, 2014, and 2013 of $4,732,696, $4,530,845, and $4,255,248, respectively, were paid by the District under terms of employment contracts. At June 30, 2015, the District reported a net pension asset of $19,970,972 for its proportionate share of the net pension asset. The pension asset was measured as of December 31, 2012,
Administrative School District No. 1 Deschutes County, Oregon Notes To Financial Statements June 30, 2015
- 44 -
and the total pension liability used to calculate the net pension liability was determined by an actuarial valuation as of that date. The District’s proportion of the net pension liability was based on a projection of the District’s long-term share of contributions to the pension plan relative to the projected contributions of all participating employers, actuarially determined. At December 31, 2012, the District’s proportion was .88 percent.
Amounts reported as deferred outflows or inflow of resources related to pension will be
recognized in pension expense as follows:
All assumptions, methods and plan provisions used in these calculations are described in the Oregon PERS system-wide GASB 68 reporting summary dated July 29, 2015. Oregon PERS produces an independently audited CAFR which can be found at: http://www.oregon.gov/pers/Pages/section/financial_reports/financial.aspx.
Actuarial Valuations – The employer contribution rates effective July 1, 2013 through June 30, 2015, were set using the entry age normal actuarial cost method. For the Tier One/Tier Two component of the PERS Defined Benefit Plan, this method produced an employer contribution rate consisting of (1) an amount for normal cost (estimated amount necessary to finance benefits earned by employees during the current service year), (2) an amount for the amortization unfunded actuarial accrued liabilities, which are being amortized over a fixed period with new unfunded actuarial liabilities being amortized over 20 years.
Deferred Outflow of Resources
Deferred Inflow of Resources
Differences between projected and actual investment earnings 38,535,887$ Changes in employer proportion and differences between employer contributions and proportionate share of contributions 592,848 District contributions subsequent to the measurement date 10,122,605 Net Deferred outflow(inflow) of resources (27,820,434)$
Administrative School District No. 1 Deschutes County, Oregon Notes To Financial Statements June 30, 2015
- 45 -
For the OPSRP Pension Program component of the PERS Defined Benefit Plan, this method produced an employer rate consisting of (a) an amount for normal cost (the estimated amount necessar4y to finance benefits earned by the employees during the current service year), (b) an actuarially determined amount for funding a disability benefit component, and (c) an amount for the amortization of unfunded actuarial accrued liabilities, which are being amortized over a fixed period with new unfunded actuarial accrued liabilities being amortized over 16 years.
Actuarial Methods and Assumptions:
Valuation date December 31, 2012 rolled forward to June 30, 2014 Experience Study Report 2012, Published September 18, 2013 Actuarial cost method Entry Age Normal Amortization method Amortized as a level percentage of payroll as layered
amortization bases over a closed period; Tier One/Tier Two UAL is amortized over 20 years and OPSRP pension UAL is amortized over 16 years
Asset valuation method Market value of assets Inflation rate 2.75 percent Investment rate of return 7.75 percent Projected salary increase 3.75 percent overall payroll growth; salaries for individuals
are assumed to grow at 3.75 percent plus assumed rates of merit/longevity increases based on service
Mortality Healthy retirees and beneficiaries: RP-2000 Sex-distinct, generational per Scale AA, with collar adjustments and set-backs as described in the valuation. Active members: Mortality rates are a percentage of healthy retiree rates that vary by group, as described in the valuation. Disabled retirees: Mortality rates are a percentage (65% for males and 90% for females) of the RP-2000 static combined disabled mortality sex-distinct table.
Actuarial valuations of an ongoing plan involve estimates of value of reported amounts and assumptions about the probability of events far into the future. Actuarially determined amounts are subject to continual revision as actual results are compared to past expectations and new estimates are made about the future. Experience studies are performed as of December 31 of even numbered years. The method and assumptions shown are based on the 2012 Experience Study which is reviewed for the four-year period ending December 31, 2012. Discount Rate – The discount rate used to measure the total pension liability was 7.75 percent for the Defined Benefit Pension Plan. The projection of cash flows used to determine the discount rate assumed that contributions from the plan members and those of the contributing employers are made at the contractually required rates, as actuarially determined. Based on those assumptions, the pension plan’s fiduciary net position was projected to be available to make all projected future benefit payments of current plan members. Therefore, the long-term expected rate of return on pension plan investments for the Defined Benefit Pension Plan was applied to all periods of projected benefit payments to determine the total pension liability.
Administrative School District No. 1 Deschutes County, Oregon Notes To Financial Statements June 30, 2015
- 46 -
Sensitivity of the District’s proportionate share of the net pension liability to changes in the discount rate – The following presents the District’s proportionate share of the net pension liability calculated using the discount rate of 7.75 percent, as well as what the District’s proportionate share of the net pension liability would be if it were calculated using a discount rate that is 1-percentage-point lower (6.75 percent) or 1-perentage-point higher (8.75 percent than the current rate.
Changes in Plan Provisions Subsequent to Measurement Date: The Oregon Supreme Court on April 30, 2015, ruled in the Moro decision, that the provisions of Senate Bill 861, signed into law in October 2013, that limited the post-retirement COLA on benefits accrued prior to the signing of the law were unconstitutional. Benefits could be modified prospectively, but not retrospectively. As a result, those who retired before the bills were passed will continue to receive a COLA tied to the Consumer Price Index that normally results in a 2% increase annually. PERS will make restoration payments to those benefit recipients. PERS members who have accrued benefits before and after the effective dates of the 2013 legislation will have a blended COLA rate when they retire. Oregon Public Employees Retirement System Notes to the Schedules of Employer Allocations and Pension Amounts by Employer As of and for the Fiscal Year Ended June 30, 2014. This is a change in benefit terms subsequent to the measurement date of June 30, 2014, which will be reflected in the next year’s actuarial valuations. The impact of the Moro decision on the total pension liability and employer’s net pension liability (asset) has not been fully determined. However, PERS’ third-party actuaries have estimated the impact of the Moro decision under one possible methodology, which is summarized below (dollars in millions).
Additional disclosures related to Oregon PERS not applicable to specific employers are available online at the below website, or by contacting PERS at the following address: PO BOX 23700 Tigard, OR 97281-3700, http://www.oregon.gov/pers/EMP/docs/er_general_information/opers_gasb_68_disclosure_information_revised.pdf
DecisionTotal pension liability 63,135 68,050Fiduciary net position 65,402 65,400
Net pension liability (asset) (2,267) 2,650
June 30, 2014 Measurement Date
Administrative School District No. 1 Deschutes County, Oregon Notes To Financial Statements June 30, 2015
- 47 -
C. Prepaid pension liability As a result of the issuance of Series 2002, Series 2003 and Series 2004 Limited Tax Pension Obligation Bonds, a prepaid PERS liability has been reported in the Statement of Net Position for the year ended June 30, 2014. The prepaid liability is equal to the initial $40,449,272, $25,000,000, and $5,642,462 payments made to PERS from the bond proceeds on October 31, 2002, April 21, 2003 and February 19, 2004. This asset was removed in accordance with GASB 68 in 2014-15.
D. Other post-employment benefits (OPEB) The District sponsors a self-pay early retirement health insurance program for its retirees. The health insurance program is a post-employment benefit plan that allows eligible retirees and their dependents to purchase continuation of coverage under the District’ health insurance plans from the date of retirement until eligibility for Medicare as required under ORS 243. The statutory requirement under ORS 243 results in an “implicit rate subsidy,” the difference between expected early retiree claim costs and the premium paid by the retiree. GASB Statement 45 requires recognition of the cost and liability of this implicit rate subsidy in the government-wide financial statements. Currently, the District participates in the Oregon Educators Benefit Board, a statewide agent multiple-employer plan for health insurance benefits. The District’s annual OPEB cost is reflected on the Statement of Net Position on the accrual basis, and is calculated based on the annual required contribution of the employer (ARC), an amount actuarially determined in accordance with the parameters of GASB Statement 45. The ARC represents a level of funding that, if paid on an ongoing basis, is projected to cover normal cost each year and amortize any unfunded actuarial liabilities over a period not to exceed 30 years. There is no separate, audited GAAP-based postemployment benefit report available for this Plan.
Administrative School District No. 1 Deschutes County, Oregon Notes To Financial Statements June 30, 2015
- 48 -
The following table shows the components of the District’s OPEB cost for the year ending June 30, 2015, 2014, 2013, and 2012, the amount actually contributed to the plan, and changes in the District’s net OPEB obligation:
The District’s annual OPEB cost, the percentage of annual OPEB cost contributed to the plan and the net OPEB obligation are:
Determination of Annual Required Contribution
2015 2014 2013 2012Normal cost at year end 580,676$ 689,831$ 688,954$ 629,212$ Amortization of UAAL 513,866 700,100 700,976 602,991
1,094,542$ 1,389,930$ 1,389,930$ 1,232,203$
Determination of Net OPEB ObligationAnnual required contribution (ARC) 1,094,542$ 1,389,930$ 1,389,930$ 1,232,203$ Interest on Net OPEB Obligation 148,115 135,740 121,535 132,840 Adjustment to ARC for Net OPEB Obligation (244,532) (224,105) (200,652) (202,384) Annual OPEB cost 998,125 1,301,565 1,310,813 1,162,659
Administrative School District No. 1 Deschutes County, Oregon Notes To Financial Statements June 30, 2015
- 49 -
Actuarial valuations of an ongoing plan involve estimates of the value of reported amounts and assumptions about the probability of occurrence of events far into the future. Examples include assumptions about the future employment, claim cost, and healthcare cost trend. Amounts determined regarding the funded status of the plan and the annual required contribution of the employer are subject to continual revision as actual results are compared with past expectations and new estimates are made about the future. Calculations are based on the benefits provided under the term of the substantive plan in effect at the time of each valuation and on the pattern of sharing costs between the employer and plan members to that point. The District elected to use the Entry Age Normal (EAN) method for calculating the ARC and Actuarial Accrued Liability (AAL). The ARC is equal to the sum of the Normal Cost and a payment to amortize the Unfunded AAL over a period not to exceed 30 years. All amortization bases are spread as level dollar amounts over future open periods. The plan is currently unfunded as defined by GASB. Contributions to the plan have been determined on a pay-as-you-go basis and compared to the actuarially determined annual OPEB cost for disclosure purposes. The key actuarial assumptions used in the valuation as of June 30, 2015 include the following:
Investment returns assumption: 3.0% Inflation rate assumption: 3.0% Medical/RX annual trend rate: 8.0% initial increase in 2013, reducing to 5.9% over the
next 9 years Rates of mortality, retirement, and withdrawal are the same rates that were used in the
12/31/09 actuarial valuation of the Oregon Public Employees Retirement System for school district employees.
As of June 30, 2015, the AAL for benefits was $14,016,697, and the actuarial value of assets was $0, resulting in an unfunded AAL of $14,016,697. The covered payroll was $72,294,271 and the ratio of the unfunded AAL to the covered payroll was 19.4%. Using a 30 year amortization period, the ARC for the fiscal year ending June 30, 2015 has been actuarially determined to be $1,094,542 for the implicit rate subsidy. The District’s Plan is currently unfunded as defined by GASB. Contributions to the Plan have been determined on a pay-as-you-go basis and compared to the actuarially determined Annual OPEB Cost for disclosure purposes. The schedule of funding progress for the postemployment defined benefit plan immediately following the notes to the financial statements presents multiyear trend information about whether the actuarial value of plan assets is increasing or decreasing relative to the actuarial accrued liability for benefits over time.
Administrative School District No. 1 Deschutes County, Oregon Notes To Financial Statements June 30, 2015
- 50 -
E. Risk management The District is exposed to various risks of loss related to torts, theft of, damage to, and destruction of assets; errors and omissions; injuries to employees; and natural disasters. The District carries commercial insurance for risks of loss, including workers’ compensation and employee health and accident insurance. Settled claims resulting from these risks have not exceeded commercial insurance coverage in any of the past three fiscal years. Insurance coverage has not changed significantly from prior years. A liability for estimated unemployment claims is presented in the government-wide statements as an accrued payroll liability. The liability represents the district’s estimate of its share of unemployment claims during fiscal year 2014-15 that were unpaid as of June 30, 2015. The estimate was calculated based on district experience and actual claims paid after June 30, 2015. A reconciliation of the claims liability is as follows:
A liability for estimated general liability claims is presented in the government-wide statements. The liability represents the district’s estimate of its share of various general liability claims during fiscal year 2014-15 that were unpaid as of June 30, 2015. The liability was calculated using actual claims settled and paid after June 30, 2015. A reconciliation of the claims liability is as follows:
F. Commitments and contingencies As of June 30, 2015, the District has contractual commitments for construction of new buildings and District improvement projects. Reimbursement claims under federal and state program grants may be subject to further audit and adjustment by grantor agencies. State school support from the Oregon Department of Education may also be subject to further audit and adjustment. Disallowed claims could become a liability of the General Fund. Any such amounts are not expected to be significant. Accordingly, management does not anticipate any material adverse consequences arising from such actions.
A substantial portion of operating funding is received from the State of Oregon. State funding is
Administrative School District No. 1 Deschutes County, Oregon Notes To Financial Statements June 30, 2015
- 51 -
determined through state wide revenue projections that are paid to individual school districts based on pupil counts and other factors in the state school fund revenue formula. Because these projections and pupil counts fluctuate they can cause increases or decreases in revenue. Due to these future uncertainties at the state level, the future effect on the operations cannot be determined. The District is a defendant in various lawsuits. Although the outcome of these lawsuits is not presently determinable, it is the opinion of the District’s legal counsel that resolution of these matters will not have a material adverse effect on the financial condition of the District.
G. Environmental matters The District has complied with EPA standards for asbestos removal or encasement as well as maintenance of an asbestos management plan. In addition, the District's fuel storage facilities meet EPA standards including annual testing requirements H. Subsequent events REALMS (Rimrock Expeditionary Alternative Learning Middle School) is a charter school of our District till the end of 2014-15 school year. Effective July 1, 2015, REALMS will terminate its charter status and join the District as a magnet middle school. I. Restatement of prior year net position Due to the implementation of GASB 68 and a correction in interest income, a restatement of the prior year net position was required. The restatement is as follows:
Net Position-Beginning as previously reported 106,643,189$ Interest Income Correction (716,479) Pension Asset for Prepaid as of 6/30/14 (59,369,989) Proportionate share of net pension liability (44,961,459) Net outflow/(inflow) of resources 9,674,212 Net Position-Beginning as restated 11,269,474$
REQUIRED SUPPLEMENTARY INFORMATION
- 52 -
Administrative School District No. 1Deschutes County, OregonRequired Supplementary InformationSchedule of Funding Progress - Other Post Employment BenefitsYear Ended June 30, 2015
The above table presents the most recent actuarial valuations for the District's post employment benefit plan, and it provides information that approximates funding progress of the plan.
SUPPLEMENTARY INFORMATION
Bend High School, built in 1925
Current site of Bend-La Pine Schools Education Center.
- 53 -
Description of Fund Types
General Fund This fund accounts for general operating revenues, expenditures and transfers of the District. The principal sources of revenue are from the local tax levy and state school support. Sub-fund account groupings are used to separate accounting records for management purposes. The sub-fund account groupings are as follows: General Operations Athletics and Activities Instructional Materials Transportation Equipment Print Shop Equipment Facility Usage Technology Reserve Maintenance Replacement Insurance Reserve Special Revenue Fund The special revenue fund accounts for revenue sources that are set aside for specific purposes or have legal restrictions that determine how and on what the funds may be disbursed. The District accounts for grant funds, student body funds and nutritional services activities in special revenue funds. The grant funds include Title grants, IDEA (special education), Family Advocate Network and various other grants received from the federal, state or other sources. Debt Service Fund The debt service fund is used to account for all sources and uses related to the general obligation debt, PERS UAL refunding debt, and Summit High Athletic field project debt of the District. The main source used to pay for the general obligation debt of the District is property taxes levied at a rate to cover the debt for the current period. The source used to pay for the PERS UAL refunding debt of the District is a portion of the State School Fund. The source used to pay the long-term debt for the Summit High Athletic field project is general resources of the district. Capital Projects Fund The capital projects fund is used to account for the transactions related to projects funded through the issuance of general obligation bonds. The major source of revenue for this fund is proceeds from the issuance of bonds. In August 2013, we sold $91 million general obligation bonds. We started construction of two new schools and other construction projects throughout the district. These projects will be completed over the next three years. Private Purpose Trust Fund The private purpose trust fund accounts for revenues and expenses of individual bequests and grants held by the District. The fund assets have been contributed by individuals and are subject to restrictions set forth in the trust agreements.
This page intentionally left blank
SUPPLEMENTARY INFORMATION
COMBINING SCHEDULES OF GENERAL FUND SUB-FUNDS
- 54 -
Administrative School District No. 1Deschutes County, OregonCombining Schedule of Assets, Liabilities and Fund Balance General Fund - Sub-Funds(GAAP Basis)June 30, 2015, with Comparative Data
General
Operations
Athletics and
Activities
Instructional
Materials
Transportation
Equipment
AssetsCash and investments 20,006,352$ 230,389$ 634,548$ 815,144$ Receivables
Property taxes 2,167,927 - - - Accounts and other receivables 949,194 - - -
Administrative School District No. 1Deschutes County, OregonCombining Schedule of Revenues, Expenditures and Changes in Fund Balance General Fund Sub-Funds (GAAP Basis)Year Ended June 30, 2015, with Comparative Data
Administrative School District No. 1Deschutes County, OregonSchedule of Revenues, Expenditures and Changes in Fund Balance - Budget to ActualGeneral Fund - Operations Sub FundYear Ended June 30, 2015
Variance withFinal Budget
Revenues Adopted Final Over (Under) Budget Basis Adjustments GAAP Basis
Total expenditures 131,294,786 132,394,786 (389,873) 132,784,659 - 132,784,659
Revenues over (under) expenditures 2,729,253 2,729,253 1,011,727 3,740,980 - 3,740,980
Other financing sources (uses)Transfers (2,982,986) (2,982,986) - (2,982,986) - (2,982,986)
Net change in fund balances (253,733) (253,733) 1,011,727 757,994 - 757,994
Fund balances, beginning of year 6,950,000 6,950,000 133,768 7,083,768 - 7,083,768
Fund balances, end of year 6,696,267$ 6,696,267$ 1,145,495$ 7,841,762$ -$ 7,841,762$
Budgeted Amounts Actuals
- 59 -
Administrative School District No. 1Deschutes County, OregonSchedule of Revenues, Expenditures and Changes in Fund Balance - Budget to ActualGeneral Fund - Athletics and Activities Sub FundYear Ended June 30, 2015
Variance withFinal Budget
Revenues Adopted Final Over (Under) Budget Basis Adjustments GAAP Basis
Other Local sources 440,000$ 440,000$ 15,486$ 455,486$ -$ 455,486$
Total expenditures 2,191,486 2,191,486 66,124 2,125,362 1,720 2,125,362
Revenues over (under) expenditures (1,751,486) (1,751,486) 81,610 (1,669,876) - (1,669,876)
Other financing sourcesTransfers 1,711,486 1,711,486 - 1,711,486 - 1,711,486
Net change in fund balances (40,000) (40,000) 81,610 41,610 - 41,610
Fund balances, beginning of year 80,000 80,000 108,779 188,779 - 188,779
Fund balances, end of year 40,000$ 40,000$ 190,389$ 230,389$ -$ 230,389$
Budgeted Amounts Actuals
- 60 -
Deschutes County, OregonSchedule of Revenues, Expenditures and Changes in Fund Balance - Budget to ActualGeneral Fund - Instructional Materials Sub FundYear Ended June 30, 2015
Variance withFinal Budget
Adopted Final Over (Under) Budget Basis Adjustments GAAP Basis
Total expenditures 1,170,000 1,170,000 47,065 1,125,935 - 1,125,935
Revenues over (under) expenditures (1,170,000) (1,170,000) 624,065 (545,935) - (545,935)
Other financing sourcesTransfers 1,150,000 1,150,000 - 1,150,000 - 1,150,000
Net change in fund balances (20,000) (20,000) 624,065 604,065 - 604,065
Fund balances, beginning of year 20,000 20,000 10,483 30,483 - 30,483
Fund balances, end of year -$ -$ 634,548$ 634,548$ -$ 634,548$
Budgeted Amounts Actuals
- 61 -
Administrative School District No. 1Deschutes County, OregonSchedule of Revenues, Expenditures and Changes in Fund Balance - Budget to ActualGeneral Fund - Transportation Equipment Sub FundYear Ended June 30, 2015
Variance withFinal Budget
Revenues Adopted Final Over (Under) Budget Basis Adjustments GAAP Basis
Total expenditures 704,206 704,206 - 704,206 - 704,206
Revenues over (under) expenditures (58,025) (58,025) 490,699 432,674 - 432,674
Other financing sources (uses) Proceeds from lease financing - - - - - -
Transfers 71,500 71,500 - 71,500 - 71,500
Total other financing sources 71,500 71,500 490,699 71,500 - 71,500
Net change in fund balance 13,475 13,475 981,398 504,174 - 504,174
Fund balances, beginning of year 257,806 257,806 53,164 310,970 - 310,970
Fund balances, end of year 271,281$ 271,281$ 1,034,562$ 815,144$ -$ 815,144$
Budgeted Amounts Actuals
- 62 -
Administrative School District No. 1Deschutes County, OregonSchedule of Revenues, Expenditures and Changes in Fund Balance - Budget to ActualGeneral Fund - Print Shop Sub FundYear Ended June 30, 2015
Variance withFinal Budget
Revenues Adopted Final Over (Under) Budget Basis Adjustments GAAP Basis
Other Local sources 1,075,000$ 1,075,000$ (159,860)$ 915,140$ -$ 915,140$
ExpendituresCurrent
Support services 1,130,000 1,130,000 114,742 1,015,258 (128,034) 887,224 Debt service - - - - - - Capital outlay - - - - 128,034 128,034
Net change in fund balance (55,000) (55,000) (45,118) (100,118) - (100,118)
Other financing sourcesTransfers - - - - - -
Net change in fund balances (55,000) (55,000) (45,118) (100,118) - (100,118)
Fund balances, beginning of year 275,000 275,000 35,059 310,059 - 310,059
Fund balances, end of year 220,000$ 220,000$ (10,059)$ 209,941$ -$ 209,941$
Budgeted Amounts Actuals
- 63 -
Administrative School District No. 1Deschutes County, OregonSchedule of Revenues, Expenditures and Changes in Fund Balance - Budget to ActualGeneral Fund - Facility Usage Sub FundYear Ended June 30, 2015
Variance withFinal Budget
Revenues Adopted Final Over (Under) Budget Basis Adjustments GAAP Basis
Other Local sources 345,000$ 345,000$ 48,213$ 393,213$ -$ 393,213$
Total expenditures 371,522 371,522 136,729 234,793 - 234,793
Revenues over (under) expenditures (26,522) (26,522) 184,942 158,420 - 158,420
Other financing sourcesTransfers - - 50,000 - 50,000
Net change in fund balance (26,522) (26,522) 184,942 208,420 - 208,420
Fund balances, beginning of year 180,000 180,000 (52,898) 127,102 - 127,102
Fund balances, end of year 153,478$ 153,478$ 132,044$ 335,522$ -$ 335,522$
Budgeted Amounts Actuals
- 64 -
Administrative School District No. 1Deschutes County, OregonSchedule of Revenues, Expenditures and Changes in Fund Balance - Budget to ActualGeneral Fund - Technology Reserve Sub FundYear Ended June 30, 2015
Variance withFinal Budget
Revenues Adopted Final Over (Under) Budget Basis Adjustments GAAP Basis
Other Local sources 350,000$ 350,000$ (59,553)$ 290,447$ -$ 290,447$
Debt service - - - - - - Capital outlay - - - - 404,642 404,642
Total expenditures 120,000 120,000 120,000 502,541 - 502,541
Net change in fund balance 230,000 230,000 (442,094) (212,094) - (212,094)
Fund balances, beginning of year 1,250,000 1,250,000 116,499 1,366,499 - 1,366,499
Fund balances, end of year 1,480,000$ 1,480,000$ (325,595)$ 1,154,405$ -$ 1,154,405$
Budgeted Amounts Actuals
- 65 -
Administrative School District No. 1Deschutes County, OregonSchedule of Revenues, Expenditures and Changes in Fund Balance - Budget to ActualGeneral Fund - Maintenance Replacement Sub FundYear Ended June 30, 2015
Variance withFinal Budget
Revenues Adopted Final Over (Under)Budget Basis Adjustments GAAP Basis
Other Local sources -$ -$ 139,385$ 139,385$ -$ 139,385$ State sources - - 36,295 36,295 - 36,295
Total revenues - - 175,680 175,680 - 175,680
ExpendituresCurrent
Support services 400,000 400,000 14,859 385,141 (309,642) 75,499 Capital outlay - - - - 309,642 309,642
Total expenditures 400,000 400,000 14,859 385,141 - 385,141
Revenues over (under) expenditures (400,000) (400,000) 190,539 (209,461) - (209,461)
Other financing sourcesTransfers 300,000 300,000 (300,000) - - -
Net change in fund balance (100,000) (100,000) (109,461) (209,461) - (209,461)
Fund balances, beginning of year 300,000 300,000 120,654 420,654 - 420,654
Fund balances, end of year 200,000$ 200,000$ 11,193$ 211,193$ -$ 211,193$
Budgeted Amounts Actuals
- 66 -
Administrative School District No. 1Deschutes County, OregonSchedule of Revenues, Expenditures and Changes in Fund Balance - Budget to ActualGeneral Fund - Insurance Reserve Sub FundYear Ended June 30, 2015
Variance withFinal Budget
Revenues Adopted Final Over (Under) Budget Basis Adjustments GAAP Basis
Investment earnings 3,000$ 3,000$ (1,744)$ 1,256$ -$ 1,256$ Other local sources 200,000 200,000 124,336 324,336 - 324,336
Total Revenues 203,000 203,000 122,592 325,592 - 325,592
Total Expenditures 203,000 203,000 (45,130) 248,130 - 248,130
Net change in fund balance - - 77,462 77,462 - 77,462
Fund balances, beginning of year 275,000 275,000 16,918 291,918 - 291,918
Fund balances, end of year 275,000$ 275,000$ 16,918$ 369,380$ -$ 369,380$
Budgeted Amounts Actuals
- 67 -
Administrative School District No. 1Deschutes County, OregonSchedule of Revenues, Expenditures and Changes in Fund Balance - Budget to ActualDebt Service FundYear Ended June 30, 2015
Variance withFinal Budget
Revenues Adopted Final Over (Under) Budget Basis Adjustments GAAP Basis
Total expenditures 27,281,378 27,281,378 2,447 27,278,930 - 27,278,930
Net change in fund balance (1,219,643) (1,219,643) 707,662 (511,979) - (511,979)
Fund balances, beginning of year 2,238,643 2,238,643 545,309 2,783,952 - 2,783,952
Fund balances, end of year 1,019,000$ 1,019,000$ 1,252,971$ 2,271,973$ -$ 2,271,973$
(1) Appropriation level
Budgeted Amounts Actuals
- 68 -
Administrative School District No. 1Deschutes County, OregonSchedule of Revenues, Expenditures and Changes in Fund Balance - Budget to ActualCapital Projects FundYear Ended June 30, 2015
Variance withFinal Budget
Revenues Adopted Final Over (Under) Budget Basis Adjustments GAAP Basis
Investment earnings 300,000$ 300,000$ (133,821)$ 166,179$ -$ 166,179$ Other Local sources - - - - - -
Total revenues 300,000 300,000 (133,821) 166,179 - 166,179
ExpendituresCurrent
Facilities acquisition and construction 42,150,000 42,150,000 (1) (7,515,083) 49,665,083 (48,776,700) 888,383 Capital outlay - - - - 48,776,700 48,776,700
Total expenditures 42,150,000 42,150,000 (7,515,083) 49,665,083 - 49,665,083
Revenues over (under) expenditures (41,850,000) (41,850,000) (7,648,904) (49,498,904) - (49,498,904)
Other Financing UsesGeneral obligation bonds issued - - - - - - Premium on general obligation bonds - - - - - - Sale of capital assets - - (272,342) 272,342 - 272,342 Transfers - - - - - -
Total other financing uses - - (272,342) 272,342 - 272,342
Net change in fund balance (41,850,000) (41,850,000) (7,921,246) (49,226,562) - (49,226,562)
Fund balances, beginning of year 85,000,000 85,000,000 (885,611) 84,114,389 - 84,114,389
Fund balances, end of year 43,150,000$ 43,150,000$ (8,806,857)$ 34,887,827$ -$ 34,887,827$
(1) Appropriation level
ActualsBudgeted Amounts
- 69 -
Administrative School District No. 1Deschutes County, OregonSchedule of Revenues, Expenditures and Changes in Fund Balance - Budget to ActualPrivate Purpose Trust FundYear Ended June 30, 2015
Variance withFinal Budget
Revenues Adopted Final Over (Under) Budget Basis Adjustments GAAP Basis
Total Debt Service Fund 21,473,352$ 604,633$ 92,858$ 20,389,192$ 572,385$
July 2014 collections 104,598
Total uncollected 676,983$
Reconciliation to revenue:
Cash collections by county treasurer above 20,389,192$
Additional collections for closed urban renew al
Land sales 18,899
Less taxes accrued June 30, 2014: (86,664)
Add taxes accrued June 30, 2015:
Current year 34,330
Prior year 27,679 62,009
Total revenues 20,383,436$
- 72 -
Federal Grantor and
Pass Through Agency Program Title
CFDA Number
Pass-Through Grantor
Identifying Number Federal Expenditures
U.S. Department of AgriculturePassed through Oregon Department of Education:
School Breakfast Program 10.553 902001 1,199,715National School Lunch Program 10.555 902001 2,976,009Child and Adult Care Food Program 10.558 902001 234,588Summer Food Service Program for Children 10.559 902001 134,319Fresh Fruit and Vegetable Program 10.582 902001 115,191
Subtotal Passed Through Oregon Department of Education 4,659,823
Direct Programs:Schools and Roads - Grants to Counties 10.666 189,805HealthierUS School Challenge 10.587
Total U.S. Department of Agriculture 4,849,628
U.S. Department of EducationPassed through Oregon Department of Education:
Title I Grants to Local Education Agencies 84.010 25171 65,37784.010 25203 3,170,00084.010 25627 39,80984.010 26876 19,92184.010 22572 732,23884.010 28335 13,071
4,040,416 (1)
Project School Emergency Response to Violence 84.184S 28,694
Special Education - Grants to States 84.027 24936 4,08884.027 26415 4,51584.027 26638 2,625,12184.027 25686 7,09684.027 30073 6,248
Special Education - Preschool Grants 84.173 24149& 26222 24,668
Special Education - State Vocational Rehabilitation 84.126A 90Special Education - Grants to States 84.027 26000
2,671,826
Improving Teacher Quality State Grants 84.367 25425 457,03484.367 22754 4,240
461,274 (1)
English Language Acquisition State Grants 84.365 25107 82,653
ARRA Early Childhood matters 93.708 27419
School Improvement Grants 94.377 24901 36,739
(1) Major program
Administrative School District No. 1Deschutes County, OregonSchedule Of Expenditures Of Federal AwardsFor the Fiscal Year Ended June 30, 2015
- 73 -
Federal Grantor and
Pass Through Agency Program Title
CFDA Number
Pass-Through Grantor
Identifying Number Federal Expenditures
Special Education - State Personnel Development 84.323 23439 16,519
Subtotal Passed Through Oregon Department of Education 7,338,121
Passed Through Oregon University System:Gaining Early Awareness and Readiness for Undergraduate Programs 84.334 26,476College Access Challenge Grant Program 84.378
Subtotal Passed Through Oregon University System 26,476
Passed Through High Desert ESD:Career and Technical Education - Basic Grants to States 84.048 43,916Education for Homeless Children and Youth 84.196 11,121
Subtotal Passed Through High Desert ESD 55,036
Passed Through Chalkboard Project:Teacher Incentive Fund 84.385A 2,163,869
Subtotal Passed Through Chalkboard Project 2,163,869
Passed Through US Forest Service:Wetlands Reserve Program 10.072 1,379Forest Legacy Program 10.676 2,370
Subtotal Passed Through US Forest Service 3,749
Direct Programs:National Junior ROTC 12.000 73,972National Junior ROTC 12.000 6,034
Total U.S. Department of Education 9,667,257
U.S. Department of Health and Human ServicesPassed through Oregon Employment Department:
Child Care and Development Block Grant 93.575 56,148
Total U.S. Department of Education 56,148
Total Federal Financial Assistance 14,573,032
U.S. Department of Agriculture
Passed through Oregon Department of Education:
Commodities from Private Schools n/a 902001 5,780
Grand Total Federal Financial Assistance 14,578,812
Notes:This schedule is presented on the modified accrual basis of accounting, which is consistent
with the preparation of the District's financial statements.
(1) Major program
Administrative School District No. 1Deschutes County, OregonSchedule Of Expenditures Of Federal AwardsFor the Fiscal Year Ended June 30, 2015
- 74 -
Administrative School District No. 1Deschutes County, OregonSchedule of Future Debt Service by Issue - Bond Principal and InterestJune 30, 2015
Year of Maturity Total Principal Interest Principal Interest Principal Interest Principal Interest Principal Interest
Regular instruction 49,966$ 58,094$ 62,788$ 64,627$ Special programs including summer school 18,883 19,348 21,262 22,407 Students 6,168 6,881 8,227 9,298 Instructional staff 3,005 3,407 3,768 4,286 General administration 627 660 618 577 School administration 7,291 7,862 8,357 8,768 Business, transportation and maintenance 17,968 18,074 20,289 21,119 Central activities 3,946 4,350 4,668 5,133 Supplemental retirement program 2,279 2,352 2,459 2,504 Food services 4,252 4,533 4,814 4,923 Other enterprise and community services 179 206 456 643
Interest on long-term liabilities 9,052 8,705 13,222 13,066 Total governmental activities 123,616 134,472 150,928 158,570
Program revenuesGovernmental activities
Charges for servicesRegular instruction 3,658 3,834 3,540 3,437 Special programs including summer school 132 104 - - Business, transportation and maintenance 784 1,014 1,122 1,069 Food services 1,798 1,867 1,833 1,661 Other enterprise and community services 254 314 353 274
Operating grants and contributions 12,304 11,740 14,053 22,008 Capital grants and contributions 300 268 4,152 446
Total governmental activities program revenues 19,230 19,141 25,053 28,895
Total governmental net expense (104,386) (115,331) (125,875) (129,675)
General revenues and other changes in net positionGovernmental activities
Federal aid not restricted to specific purposes 673 682 678 610 State aid not restricted to specific purposes 48,118 55,956 58,754 57,735 Intermediate aid not restricted to specific purposes 1,345 1,467 1,990 2,062 Earnings on investments 1,584 2,151 7,802 2,355 Other local revenue 3,703 2,875 2,782 2,037
Total governmental activities 113,579 126,588 139,580 137,188
Administrative District No. 1Deschutes County, OregonFund Balances of Governmental FundsLast Ten Fiscal Years(modified accrual basis of accounting)(in thousands)
All other governmental fundsReserved 1,983 5,585 1,752 - Unreserved, reported in:
Special revenue fund 3,102 3,546 3,618 - Capital project fund 2,153 116,583 77,233 -
Nonspendable, reported in:
Special revenue fund - - - 348 Restricted, reported in:
Special revenue fund - - - 1,073 Debt service fund - - - 367 Capital project fund - - - 44,752
Assigned, reported in:
Special revenue fund - - - 1,244
Total all other governmental funds 7,238$ 125,714$ 82,603$ 47,784$
In 2010, the Districted adopted GASB 54, Fund Balance Reporting and GovernmentalFund Type Definitions. This statement changed the categories for reporting fundbalance in governmental funds, and required retroactive reporting for any fiscal yearpresented as part of the basic financial statements. Accordingly, 2009 and 2010 arereported in this manner for statistical purposes.
Administrative District No. 1Deschutes County, OregonChanges in Fund Balances of Governmental FundsLast Ten Fiscal Years(modified accrual basis of accounting)(in thousands)
2006 2007 2008
Revenues
Property taxes 58,385$ 62,894$ 66,235$ Tuition 143 251 149 Revenue from local governments - - 3,819 Investment earnings 1,531 2,151 7,802 Other Local sources (including indirect cost allocation) 11,224 11,209 10,679 Intermediate sources 2,270 1,602 1,991 State sources 49,359 56,903 62,930 Federal sources 10,835 10,448 10,009
Revenues over (under) expenditures (1,104) (4,367) (44,247)
Other Financing Sources (Uses)Refunding bonds issued - - - Payment to refunded bond escrow agent - - - Premium on bonds issued 53 3,769 - General obligation bonds issued - 119,000 - Sale of capital assets 462 - - Lease purchase / long term loan proceeds - 2,250 -
Total Other Financing Sources (uses) 515 125,019 -
Net change in fund balances (589)$ 120,652$ (44,247)$
Ratio of total debt service to noncapital expenditures 18% 16% 16%
Note: The figures in this chart include all funds presented on page 17 of the basic financial statements. The Community Services line includes Nutrition Services expenditures beginning in 2007.
Administrative District No. 1Deschutes County, OregonAssessed Value and Estimated Value of Taxable Property in Deschutes CountyLast Ten Fiscal Years(in thousands of dollars)
SourceValuation information has been obtained from the Deschutes County Assessor, and includes all property within Deschutes County.
Note: The range of total direct tax rates paid is presented, rather than a weighted average for each type ofproperty. Tax rates are applied by property location and type. We are unable to obtain direct rateinformation by type within locations, so calculating the weighted average direct rate is impractical.
Real Property Personal Property Manufactured Homes
Deschutes Public Library District 735,000 72.64% 533,894
High Desert ESD 12,382,397 66.38% 8,219,670
La Pine Parks & Recreation District 450,000 100.00% 450,000
LaPine Special Sewer District 108,191 100.00% 108,191
Lazy River Special Road District 10,000 100.00% 10,000
Sunriver Library District 90,000 100.00% 90,000
Subtotal, overlapping debt 215,838,462
Administrative School Dist No. 1 direct debt $292,832,068
Total direct and overlapping debt 508,670,530$
Source:The gross debt outstanding and the percentage applicable has been obtained from the Oregon State TreasuryPercentage applicable to the District is the ratio of the district boundary to the entire area subject to the debt.
Note: Gross Bonded Debt Outstanding does not include Self-supporting Unlimited-tax General Obligation bonds and
Self-supporting Full Faith and Credit debt.
- 91 -
Administrative District No. 1Deschutes County, OregonRatios of Outstanding Debt by TypeLast Ten Fiscal Years
Sources:Personal and per capita income numbers were obtained from the Bureau of Economic Analysis
Governmental Activities
This page intentionally left blank
- 92 -
Administrative District No. 1Deschutes County, OregonLegal Debt Margin InformationLast Ten Fiscal Years(in thousands)
Debt limit by Oregon State Law is 7.95% of real market value.
Computation of debt limit: 2015 2014 2013 2012 2011
Real market value 18,608,982$ 16,076,707$ $15,123,058 $15,382,464 16,728,771$
Debt limit = Real market value X .0795 = 1,479,414 1,278,098 1,202,283 1,222,906 1,329,937
Computation of debt margin:
Total General obligation bonds 198,705 210,210 128,755 139,585 152,475 Less assets available in debt service fund (2,272) (2,783) (3,701) (1,756) (2,476)
Total amount of debt subject to debt limit 196,433 207,427 125,054 137,829 149,999
Sources:Population numbers come from Economic Development for Central Oregon (EDCO).Real market value comes from Deschutes County
- 95 -
Administrative District No. 1Deschutes County, OregonDemographic and Economic StatisticsLast Ten Fiscal Years
Calendar
Year Population
Unemployment
Rate
Per capita
Income
Total Personal
Income
Civilian
Labor
Force
Average Daily
Membership
Annual Cost
Per ADM
2015 166,400 6.2% Not Available Not Available 81,325 16,467 10,503$
2014 162,525 8.1% Not Available Not Available 77,925 16,051 10,775$ 2013 160,140 10.8% Not Available Not Available 80,505 15,763 10,9732012 158,875 11.8% Not Available Not Available 80,234 15,463 10,1572011 157,905 13.5% Not Available $5,946,000,000 80,246 15,380 10,0372010 157,211 14.8% $36,449 5,666,000,000 80,258 15,091 10,1082009 154,920 15.3% 35,966 5,705,290,000 86,588 15,137 10,4762008 150,113 7.1% 35,728 5,635,347,000 83,364 15,027 10,0442007 143,316 4.9% 36,282 5,565,902,000 83,097 14,620 9,1982006 135,590 4.6% 33,522 4,996,527,000 80,791 13,981 8,842
SourcesUnemployment rate and labor force information is for Deschutes County and was obtained
from the Oregon Employment Department - Oregon Labor Market Information System (OLMIS).Population numbers come from Economic Development for Central Oregon (EDCO). 2009 and 2010 populations are an estimate, using population projections provided by PSU.Personal and per capita income numbers came from the Bureau of Economic Analysis
- 96 -
Administrative District No. 1Deschutes County, OregonTen largest employersCurrent Year and Nine Years Ago
Employer Employees Rank
Percentage
of Total
County
Employees Employees Rank
Percentage
of Total
County
Employees
St Charles Medical Center 2,830 1 3.76% 2,369 1 3.06%Administrative School District No. 1 1,750 2 2.32% 1,399 2 1.81%Deschutes County 1,046 3 1.39% 737 5 0.95%Sunriver Resort 900 4 1.19% 870 3 1.12%Les Schwab 880 5 1.17% - - - Bright Wood Corporation 870 6 1.16% - - - Redmond School District 819 7 1.09% 676 6 0.87%Mt Bachelor 775 8 1.03% 750 4 0.97%McDonalds 668 9 0.89% - - - Bend Memorial Clinic 652 10 0.87% 600 10 0.77%T-Mobile - - - 660 7 0.85%Beaver Motor Coaches - - - 654 8 0.84%iSky - - - 600 9 0.77%
11,190 14.86% 9,315 13.67%
Sources: Economic Development for Central Oregon, Oregon Department of Education,Deschutes County Finance Department
2015 2006
This page intentionally left blank
- 97 -
Administrative District No. 1Deschutes County, OregonFull-time Equivalent Employees by FunctionLast Ten Fiscal Years
2006 2007 2008 2009 2010
Function:Regular instruction 602.33 639.80 687.54 695.60 639.05 Special programs including summer school 279.08 294.11 310.15 300.97 304.61 Student services 90.16 100.10 113.55 119.38 125.62 Instructional staff 29.48 36.83 37.03 38.81 41.42 General administration 2.00 2.00 2.00 2.00 2.23 School administration 100.10 105.82 105.76 105.53 104.36 Business, transportation and maintenance 206.75 208.84 211.91 211.59 216.63 Central activities 30.95 33.81 36.43 36.15 34.03 Food services 54.76 55.93 59.33 59.06 57.65 Other enterprise and community services 1.00 0.78 7.27 10.49 10.05 Facilities acquisition and construction 2.00 7.20 7.20 7.20 6.45
Total 1,398.61 1,485.22 1,578.17 1,586.78 1,542.10
Source Information was obtained from District's payroll records
Note:FTE is as of June 1 and does not include vacant positions.
Administrative District No. 1Deschutes County, OregonOperating Indicators by FunctionLast Ten Fiscal Years
2006 2007 2008 2009 2010
Function:Instruction
Enrollment 14,648 15,077 15,607 15,951 15,834
TransportationNumber of busses 113 116 116 117 118 Miles driven per year 1,545,026 1,639,986 1,696,668 1,753,574 1,705,606 Cost per mile 3.47 3.60 3.89 3.91 3.92Students transported to school daily 7,033 7,170 7,255 7,563 6,648
Administrative District No. 1Deschutes County, OregonCapital Asset Statistics by FunctionLast Ten Fiscal Years
2006 2007 2008 2009 2010
Function:Instruction
Number of elementary schools 14 14 14 15 16 Number of middle schools 5 5 5 5 5 Number of high schools schools 5 5 5 5 5 Elementary school enrollment 6,586 6,734 7,085 7,004 6,967 Middle school enrollment 3,115 3,294 3,344 3,637 3,640 High school enrollment 4,947 5,049 5,178 5,300 5,227
General administrationNumber of buildings 1 1 1 1 1
Business, transportation and maintenanceNumber of buildings 4 4 4 4 4
SourceInformation was obtained from the District's capital asset and student enrollment records
Administrative School District No. 1Deschutes County, OregonSupplemental Information as Required by the Oregon State Department of EducationFor the Year Ended June 30, 2015
A. Energy Bill for Heating - All Funds:Please enter your expenditures for electricity and heating fuel for these Functions and Objects. Function
Objects 325 & 326
2540 2,238,934$ 2550 -
B. Replacement of Equipment - General Fund
Include all General Fund expenditures in object 542, except for the following exclusions: Fund Amount
Exclude these functions: General -$ 1113, 1122, 1132 Co-curricular Activities1140 Pre-Kindergarten1300 Continuing Education1400 Summer School4150 Construction2550 Pupil Transportation3100 Food Service3300 Community Services
AUDITOR’S COMMENTS SECTION REQUIRED BY STATE REGULATIONS