53
VIDEO CREATIVE IN A DIGITAL WORLD Global report

VIDEO CREATIVE IN A DIGITAL WORLD Global report
2
Introduction AdReaction studies have been conducted since 2001, delivering insights on consumers' perceptions of advertising,
particularly digital formats.
AdReaction: Video Creative in a Digital World addresses key questions facing marketers, including:
• How are videos viewed by screen – and for how long?
• What do people think of video ads by screen?
• How can I create ads that consumers won’t skip?
We surveyed, via smartphone or tablet, more than 13,500 16-45 year old multiscreen users across 42 countries.
Multiscreen users were defined as people who own, or have access to, a TV and a smartphone and/or a tablet. We also
conducted parallel copy testing for 20 ads in eight countries, across TV, online video and mobile video ad formats,
interviewing more than 10,000 consumers.
This report summarizes overall global learning. For data by country, please visit www.millwardbrown.com/adreaction
For more detailed local country reports, please contact your local Millward Brown office.
Contents
3
Right person – How much video are people viewing by
screen, and how does targeting improve their receptivity to ads?
Right context – What do people think about video ads and
how does this vary by screen and format?
Right content – How can marketers optimize video ads
across screens and avoid having viewers skip them?
Effectiveness learning and further reading
4
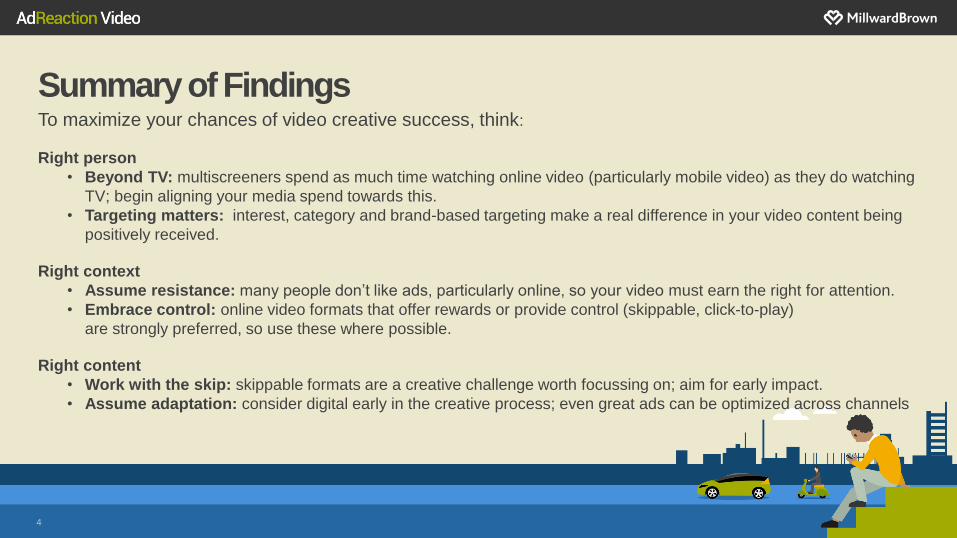
Summary of Findings To maximize your chances of video creative success, think:
Right person
• Beyond TV: multiscreeners spend as much time watching online video (particularly mobile video) as they do watching
TV; begin aligning your media spend towards this.
• Targeting matters: interest, category and brand-based targeting make a real difference in your video content being
positively received.
Right context
• Assume resistance: many people don’t like ads, particularly online, so your video must earn the right for attention.
• Embrace control: online video formats that offer rewards or provide control (skippable, click-to-play)
are strongly preferred, so use these where possible.
Right content
• Work with the skip: skippable formats are a creative challenge worth focussing on; aim for early impact.
• Assume adaptation: consider digital early in the creative process; even great ads can be optimized across channels
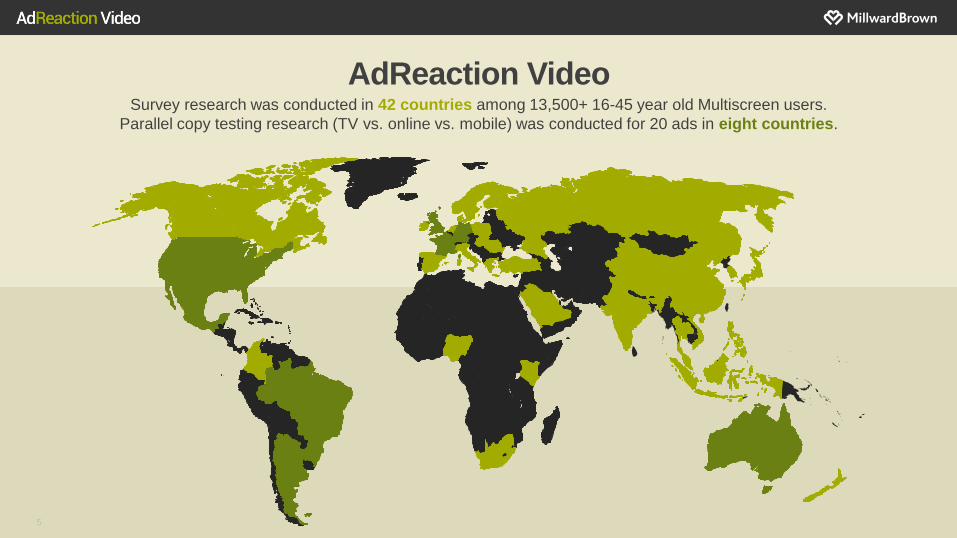
AdReaction Video Survey research was conducted in 42 countries among 13,500+ 16-45 year old Multiscreen users.
Parallel copy testing research (TV vs. online vs. mobile) was conducted for 20 ads in eight countries.
5
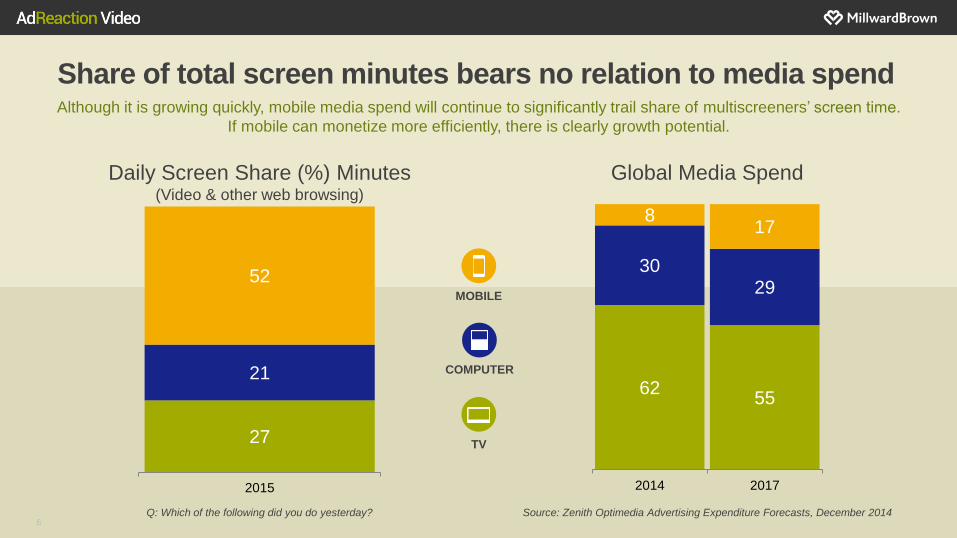
Share of total screen minutes bears no relation to media spend Although it is growing quickly, mobile media spend will continue to significantly trail share of multiscreeners’ screen time.
If mobile can monetize more efficiently, there is clearly growth potential.
Daily Screen Share (%) Minutes (Video & other web browsing)
Global Media Spend
62 55
30 29
8 17
2014 2017
6 Q: Which of the following did you do yesterday?
27
21
52
2015
Source: Zenith Optimedia Advertising Expenditure Forecasts, December 2014
MOBILE
TV
COMPUTER
Right Person How much video are people viewing by screen, and how does targeting improve their receptivity to ads?
7
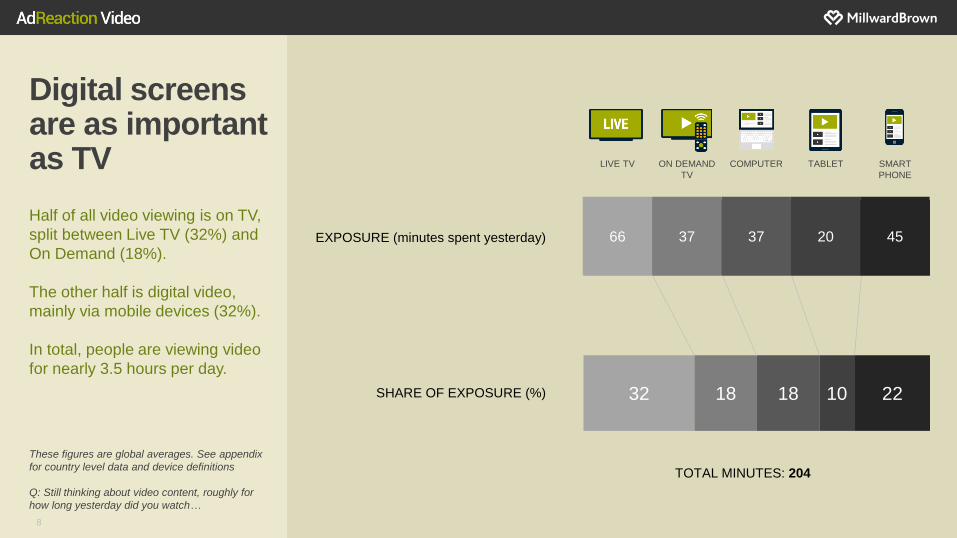
Digital screens are as important as TV
Half of all video viewing is on TV,
split between Live TV (32%) and
On Demand (18%).
The other half is digital video,
mainly via mobile devices (32%).
In total, people are viewing video
for nearly 3.5 hours per day.
32
1
18
1
18
1
10
1
22
1
SHARE OF EXPOSURE (%)
EXPOSURE (minutes spent yesterday)
LIVE TV ON DEMAND
TV
COMPUTER TABLET SMART
PHONE
66 37 37 20 45
These figures are global averages. See appendix
for country level data and device definitions
Q: Still thinking about video content, roughly for
how long yesterday did you watch…
8
TOTAL MINUTES: 204
SMARTPHONE
ON DEMAND TV
COMPUTER
LIVE TV
TABLET
9
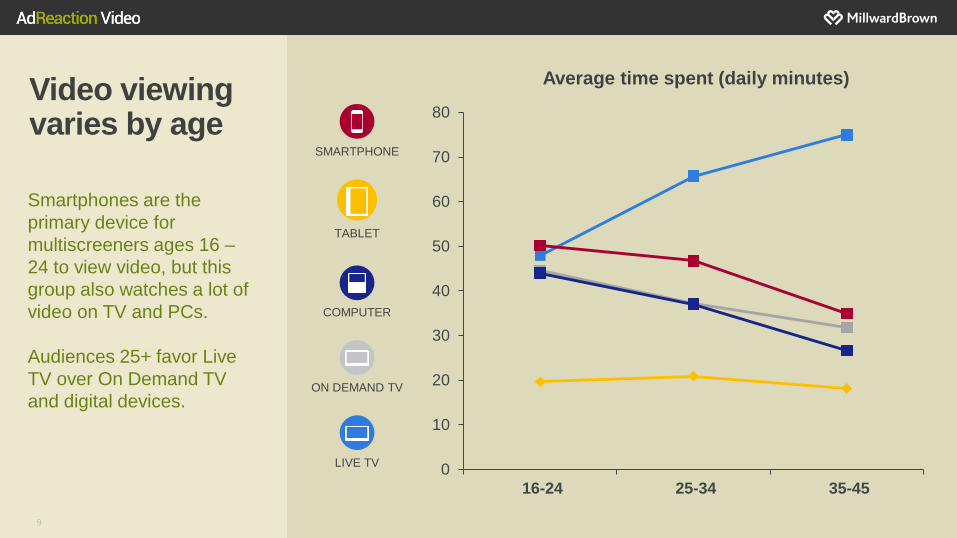
Video viewing varies by age
Smartphones are the
primary device for
multiscreeners ages 16 –
24 to view video, but this
group also watches a lot of
video on TV and PCs.
Audiences 25+ favor Live
TV over On Demand TV
and digital devices.
0
10
20
30
40
50
60
70
80
16-24 25-34 35-45
Average time spent (daily minutes)
10
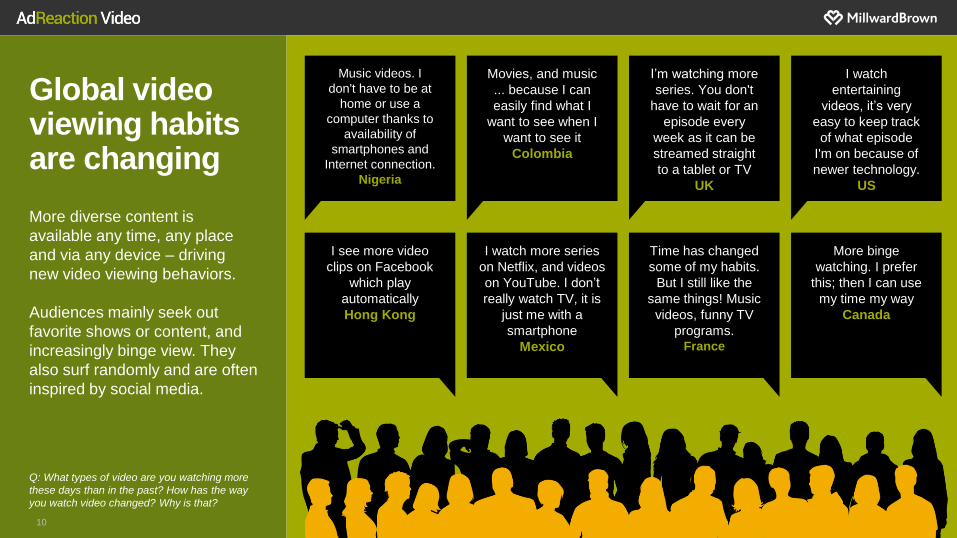
Global video viewing habits are changing
More diverse content is
available any time, any place
and via any device – driving
new video viewing behaviors.
Audiences mainly seek out
favorite shows or content, and
increasingly binge view. They
also surf randomly and are often
inspired by social media.
Music videos. I
don't have to be at
home or use a
computer thanks to
availability of
smartphones and
Internet connection.
Nigeria
Movies, and music
... because I can
easily find what I
want to see when I
want to see it
Colombia
I’m watching more
series. You don't
have to wait for an
episode every
week as it can be
streamed straight
to a tablet or TV
UK
I watch
entertaining
videos, it’s very
easy to keep track
of what episode
I'm on because of
newer technology.
US
I see more video
clips on Facebook
which play
automatically
Hong Kong
I watch more series
on Netflix, and videos
on YouTube. I don’t
really watch TV, it is
just me with a
smartphone
Mexico
Time has changed
some of my habits.
But I still like the
same things! Music
videos, funny TV
programs. France
More binge
watching. I prefer
this; then I can use
my time my way
Canada
Q: What types of video are you watching more
these days than in the past? How has the way
you watch video changed? Why is that?
11
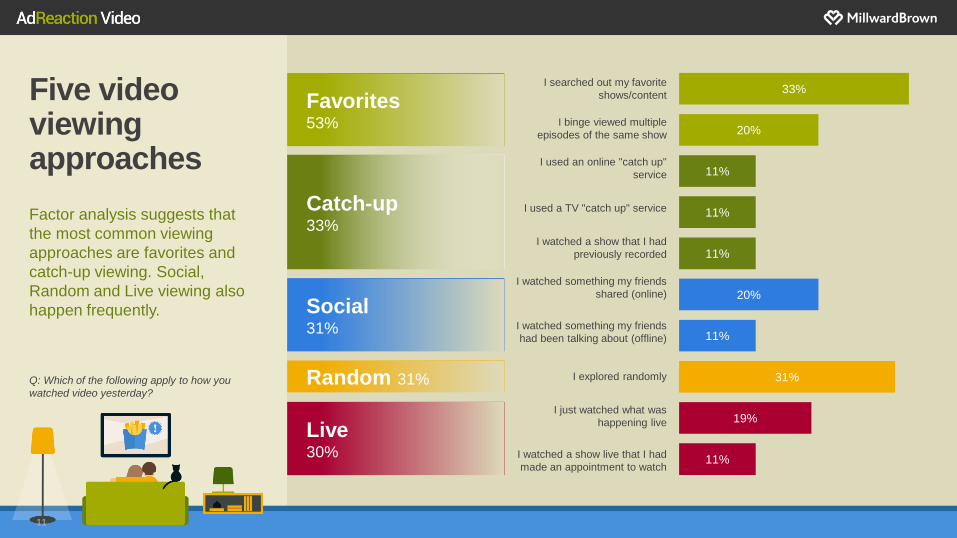
Five video viewing approaches
Factor analysis suggests that
the most common viewing
approaches are favorites and
catch-up viewing. Social,
Random and Live viewing also
happen frequently.
11%
19%
31%
11%
20%
11%
11%
11%
20%
33%
Q: Which of the following apply to how you
watched video yesterday?
Social 31%
Catch-up 33%
Favorites 53%
Random 31%
Live 30%
I searched out my favorite
shows/content
I binge viewed multiple
episodes of the same show
I used an online "catch up"
service
I used a TV "catch up" service
I watched a show that I had
previously recorded
I watched something my friends
shared (online)
I watched something my friends
had been talking about (offline)
I explored randomly
I just watched what was
happening live
I watched a show live that I had
made an appointment to watch
12
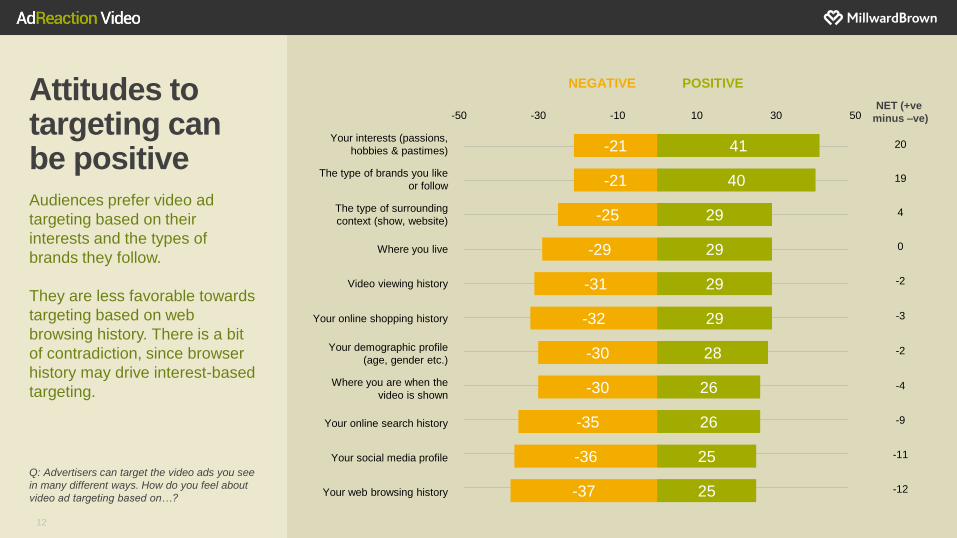
Attitudes to targeting can be positive Audiences prefer video ad
targeting based on their
interests and the types of
brands they follow.
They are less favorable towards
targeting based on web
browsing history. There is a bit
of contradiction, since browser
history may drive interest-based
targeting.
Q: Advertisers can target the video ads you see
in many different ways. How do you feel about
video ad targeting based on…?
NEGATIVE POSITIVE
NET (+ve
minus –ve)
Your interests (passions,
hobbies & pastimes)
The type of brands you like
or follow
The type of surrounding
context (show, website)
Where you live
Video viewing history
Your online shopping history
Your demographic profile
(age, gender etc.)
Where you are when the
video is shown
Your online search history
Your social media profile
Your web browsing history
-21
-21
-25
-29
-31
-32
-30
-30
-35
-36
-37
41
40
29
29
29
29
28
26
26
25
25
-50 -30 -10 10 30 50
20
19
4
0
-2
-3
-2
-4
-9
-11
-12
13
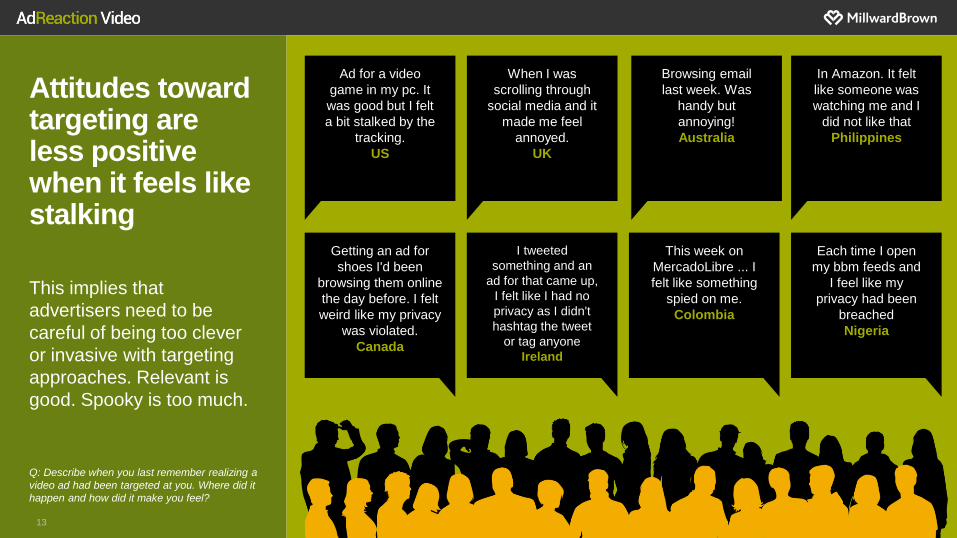
Attitudes toward targeting are less positive when it feels like stalking
This implies that
advertisers need to be
careful of being too clever
or invasive with targeting
approaches. Relevant is
good. Spooky is too much.
Ad for a video
game in my pc. It
was good but I felt
a bit stalked by the
tracking.
US
When I was
scrolling through
social media and it
made me feel
annoyed.
UK
Browsing email
last week. Was
handy but
annoying!
Australia
In Amazon. It felt
like someone was
watching me and I
did not like that
Philippines
Getting an ad for
shoes I'd been
browsing them online
the day before. I felt
weird like my privacy
was violated.
Canada
I tweeted
something and an
ad for that came up,
I felt like I had no
privacy as I didn't
hashtag the tweet
or tag anyone
Ireland
This week on
MercadoLibre ... I
felt like something
spied on me.
Colombia
Each time I open
my bbm feeds and
I feel like my
privacy had been
breached
Nigeria
Q: Describe when you last remember realizing a
video ad had been targeted at you. Where did it
happen and how did it make you feel?
14
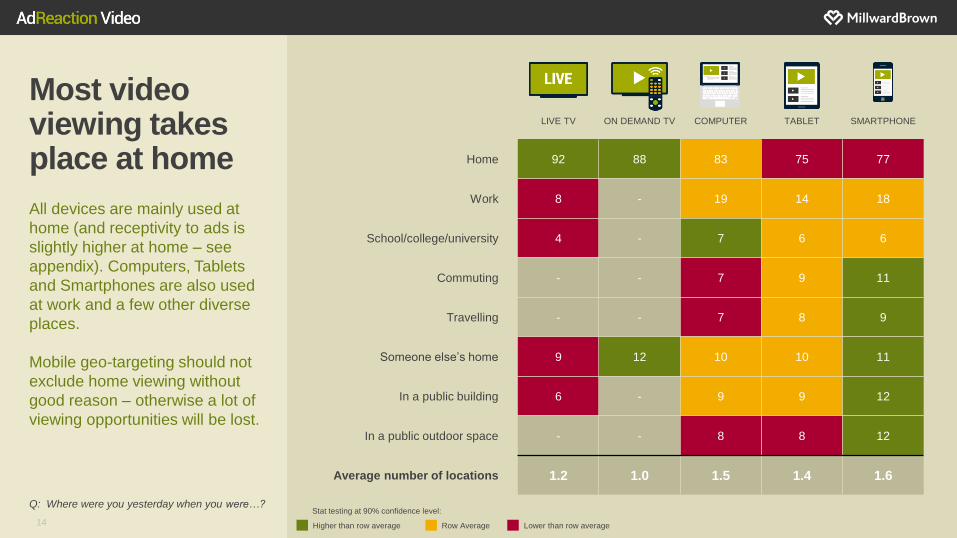
Most video viewing takes place at home
All devices are mainly used at
home (and receptivity to ads is
slightly higher at home – see
appendix). Computers, Tablets
and Smartphones are also used
at work and a few other diverse
places.
Mobile geo-targeting should not
exclude home viewing without
good reason – otherwise a lot of
viewing opportunities will be lost.
LIVE TV ON DEMAND TV COMPUTER TABLET SMARTPHONE
Home 92 88 83 75 77
Work 8 - 19 14 18
School/college/university 4 - 7 6 6
Commuting - - 7 9 11
Travelling - - 7 8 9
Someone else’s home 9 12 10 10 11
In a public building 6 - 9 9 12
In a public outdoor space - - 8 8 12
Average number of locations 1.2 1.0 1.5 1.4 1.6
Q: Where were you yesterday when you were…?
Row Average Higher than row average Lower than row average
Stat testing at 90% confidence level:
15
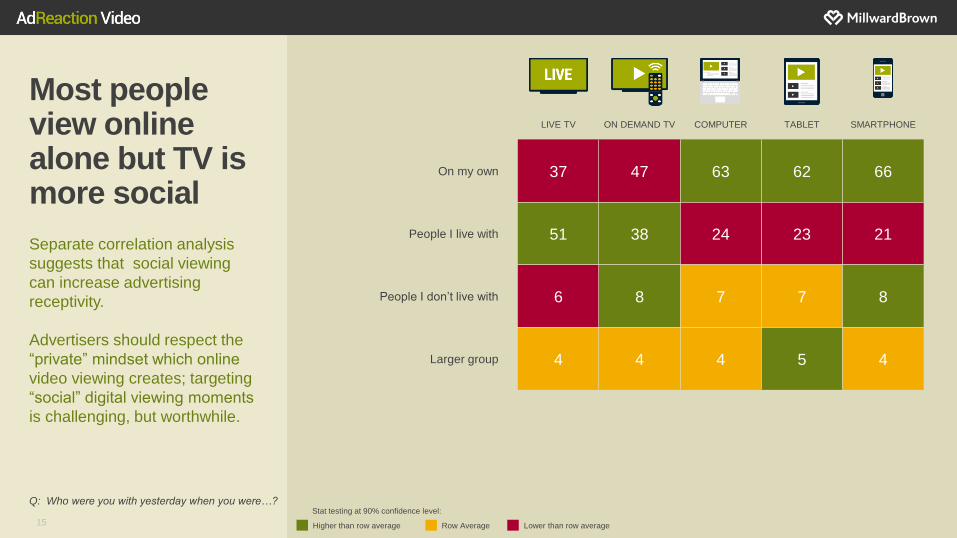
Most people view online alone but TV is more social
Separate correlation analysis
suggests that social viewing
can increase advertising
receptivity.
Advertisers should respect the
“private” mindset which online
video viewing creates; targeting
“social” digital viewing moments
is challenging, but worthwhile.
LIVE TV ON DEMAND TV COMPUTER TABLET SMARTPHONE
On my own 37 47 63 62 66
People I live with 51 38 24 23 21
People I don’t live with 6 8 7 7 8
Larger group 4 4 4 5 4
Q: Who were you with yesterday when you were…?
Row Average Higher than row average Lower than row average
Stat testing at 90% confidence level:
Right Context What do people think of video ads and how
does this vary by screen and format?
16
17
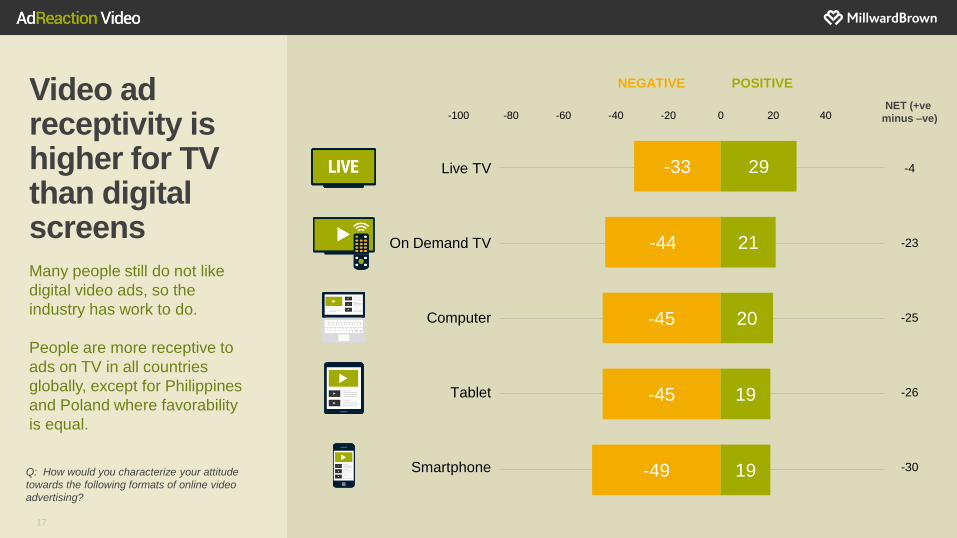
Video ad receptivity is higher for TV than digital screens
Many people still do not like
digital video ads, so the
industry has work to do.
People are more receptive to
ads on TV in all countries
globally, except for Philippines
and Poland where favorability
is equal.
-33
-44
-45
-45
-49
29
21
20
19
19
-100 -80 -60 -40 -20 0 20 40
NEGATIVE POSITIVE
NET (+ve
minus –ve)
Live TV
On Demand TV
Computer
Tablet
Smartphone
-4
-23
-25
-26
-30 Q: How would you characterize your attitude
towards the following formats of online video
advertising?
18
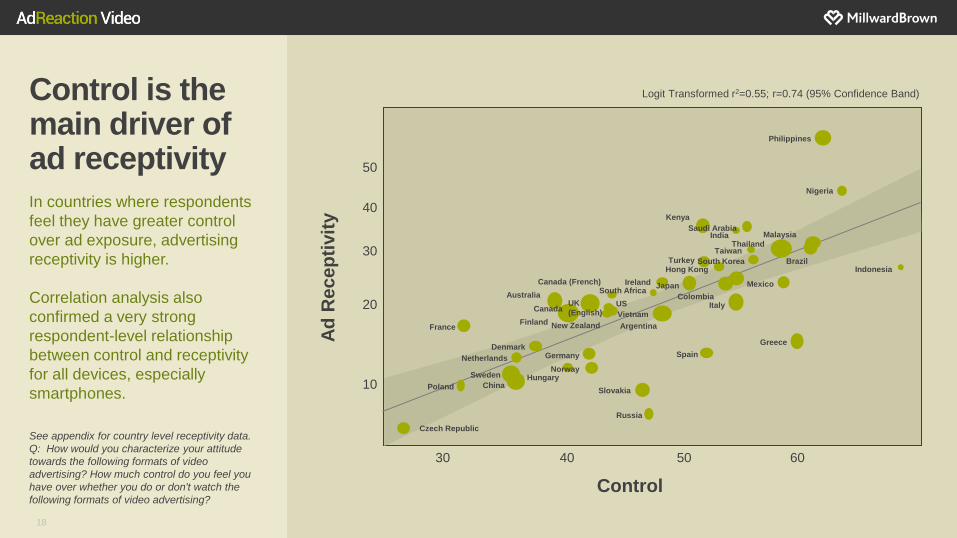
Control is the main driver of ad receptivity
In countries where respondents
feel they have greater control
over ad exposure, advertising
receptivity is higher.
Correlation analysis also
confirmed a very strong
respondent-level relationship
between control and receptivity
for all devices, especially
smartphones.
Logit Transformed r2=0.55; r=0.74 (95% Confidence Band)
Ad
Recep
tivit
y
Control
See appendix for country level receptivity data.
Q: How would you characterize your attitude
towards the following formats of video
advertising? How much control do you feel you
have over whether you do or don't watch the
following formats of video advertising?
30 40 50 60
10
20
30
40
50
France
Poland
Czech Republic
Netherlands
Denmark
Sweden
China
Canada (French)
Australia
Finland New Zealand
UK
(English) Canada
Germany
Hungary Norway
Slovakia
Russia
Spain
Greece
Argentina
Vietnam
US
South Africa Ireland Japan
Colombia Italy
Turkey Hong Kong
Kenya
Saudi Arabia India
Taiwan
South Korea
Thailand Malaysia
Brazil
Mexico
Nigeria
Philippines
Indonesia
19
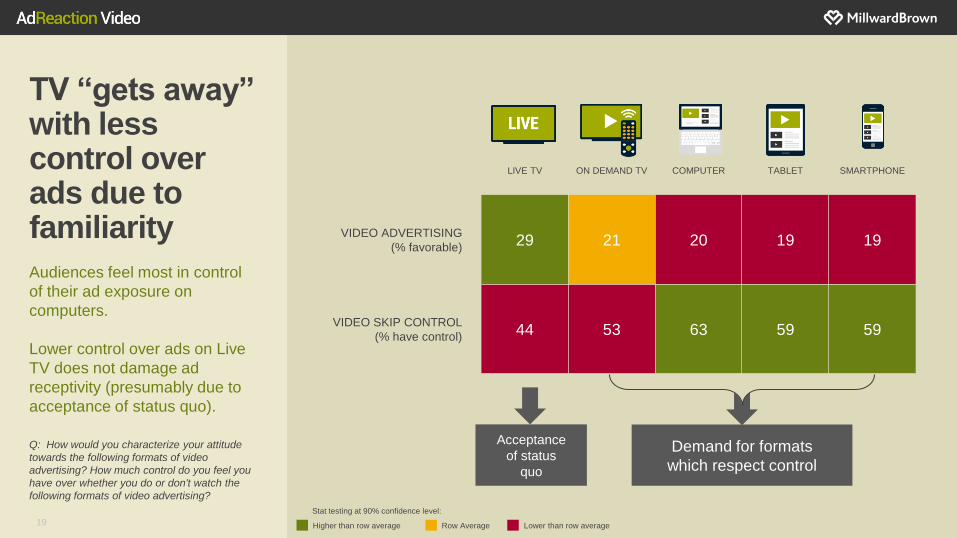
TV “gets away” with less control over ads due to familiarity
Audiences feel most in control
of their ad exposure on
computers.
Lower control over ads on Live
TV does not damage ad
receptivity (presumably due to
acceptance of status quo).
LIVE TV ON DEMAND TV COMPUTER TABLET SMARTPHONE
VIDEO ADVERTISING
(% favorable) 29 21 20 19 19
VIDEO SKIP CONTROL
(% have control) 44 53 63 59 59
Q: How would you characterize your attitude
towards the following formats of video
advertising? How much control do you feel you
have over whether you do or don't watch the
following formats of video advertising?
Acceptance
of status
quo
Demand for formats
which respect control
Row Average Higher than row average Lower than row average
Stat testing at 90% confidence level:
20
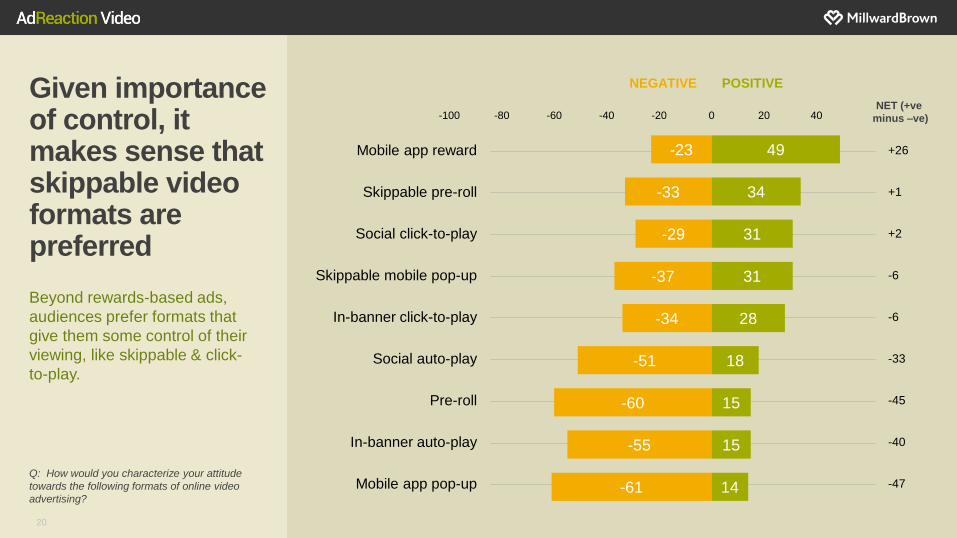
Given importance of control, it makes sense that skippable video formats are preferred
Beyond rewards-based ads,
audiences prefer formats that
give them some control of their
viewing, like skippable & click-
to-play.
-23
-33
-29
-37
-34
-51
-60
-55
-61
49
34
31
31
28
18
15
15
14
-100 -80 -60 -40 -20 0 20 40
NEGATIVE POSITIVE
NET (+ve
minus –ve)
Mobile app reward
Skippable pre-roll
Social click-to-play
Skippable mobile pop-up
In-banner click-to-play
Social auto-play
Pre-roll
In-banner auto-play
Mobile app pop-up
+26
+1
+2
-6
-6
-33
-45
-40
-47 Q: How would you characterize your attitude
towards the following formats of online video
advertising?
21
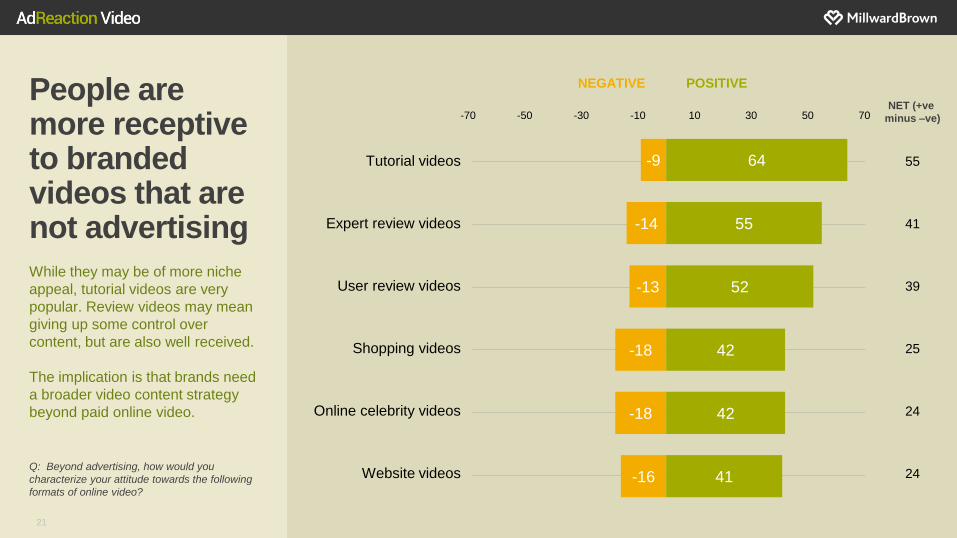
People are more receptive to branded videos that are not advertising
While they may be of more niche
appeal, tutorial videos are very
popular. Review videos may mean
giving up some control over
content, but are also well received.
The implication is that brands need
a broader video content strategy
beyond paid online video.
Q: Beyond advertising, how would you
characterize your attitude towards the following
formats of online video?
-9
-14
-13
-18
-18
-16
64
55
52
42
42
41
-70 -50 -30 -10 10 30 50 70
NEGATIVE POSITIVE
NET (+ve
minus –ve)
Tutorial videos
Expert review videos
User review videos
Shopping videos
Online celebrity videos
Website videos
55
41
39
25
24
24
Right Content How can marketers optimize video ads across screens and avoid having viewers skip them?
22
23
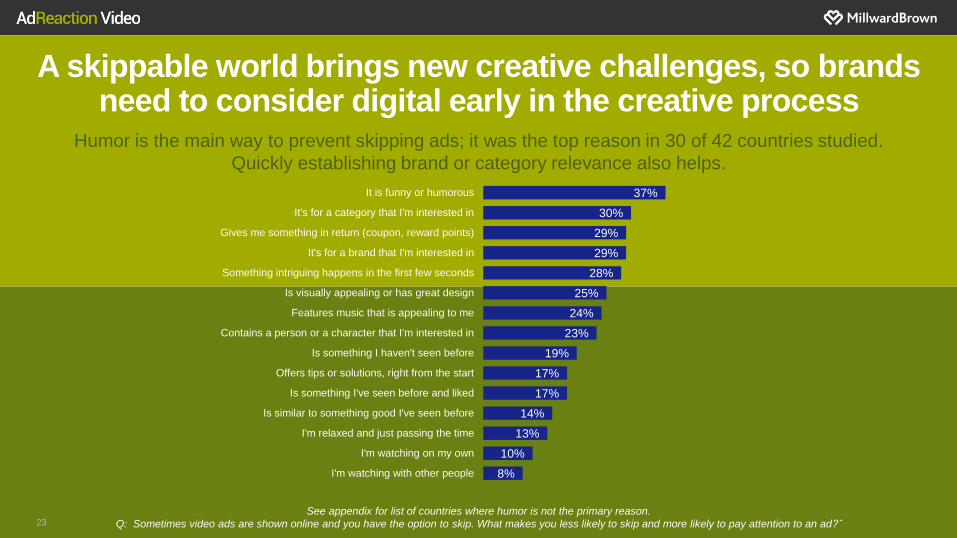
A skippable world brings new creative challenges, so brands need to consider digital early in the creative process
Humor is the main way to prevent skipping ads; it was the top reason in 30 of 42 countries studied.
Quickly establishing brand or category relevance also helps.
8%
10%
13%
14%
17%
17%
19%
23%
24%
25%
28%
29%
29%
30%
37%
I'm watching with other people
I'm watching on my own
I'm relaxed and just passing the time
Is similar to something good I've seen before
Is something I've seen before and liked
Offers tips or solutions, right from the start
Is something I haven't seen before
Contains a person or a character that I'm interested in
Features music that is appealing to me
Is visually appealing or has great design
Something intriguing happens in the first few seconds
It's for a brand that I'm interested in
Gives me something in return (coupon, reward points)
It's for a category that I'm interested in
It is funny or humorous
See appendix for list of countries where humor is not the primary reason.
Q: Sometimes video ads are shown online and you have the option to skip. What makes you less likely to skip and more likely to pay attention to an ad?ˆ
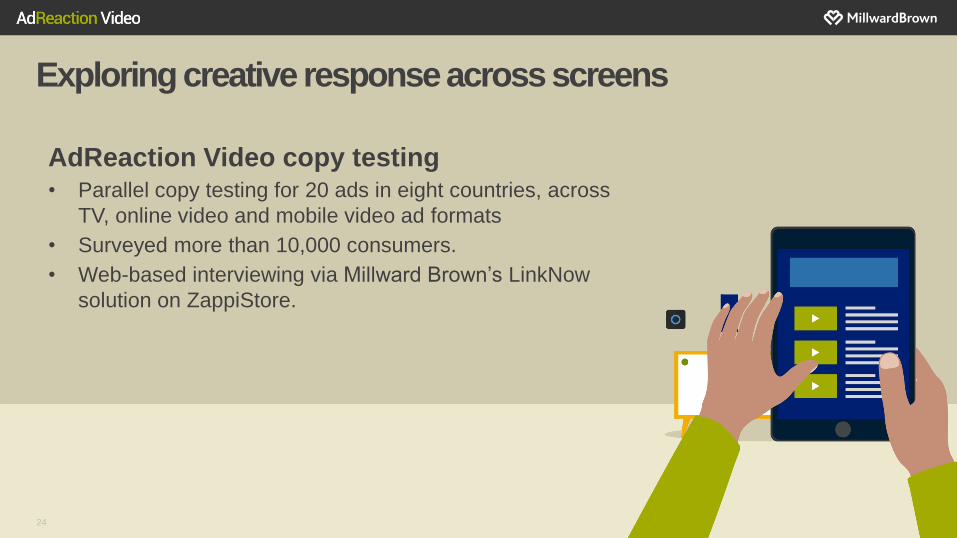
Exploring creative response across screens
24
AdReaction Video copy testing • Parallel copy testing for 20 ads in eight countries, across
TV, online video and mobile video ad formats
• Surveyed more than 10,000 consumers.
• Web-based interviewing via Millward Brown’s LinkNow
solution on ZappiStore.
25
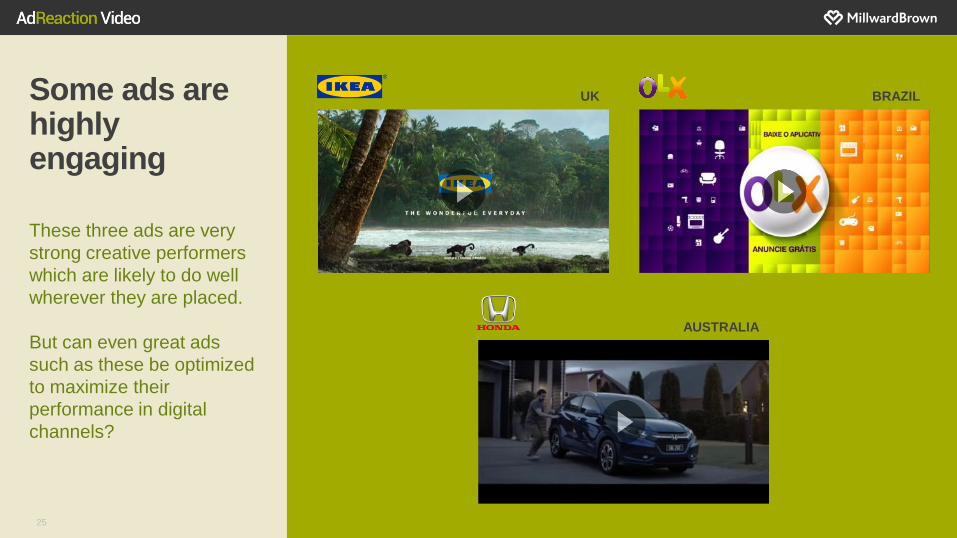
Some ads are highly engaging These three ads are very
strong creative performers
which are likely to do well
wherever they are placed.
But can even great ads
such as these be optimized
to maximize their
performance in digital
channels?
UK BRAZIL
AUSTRALIA
26
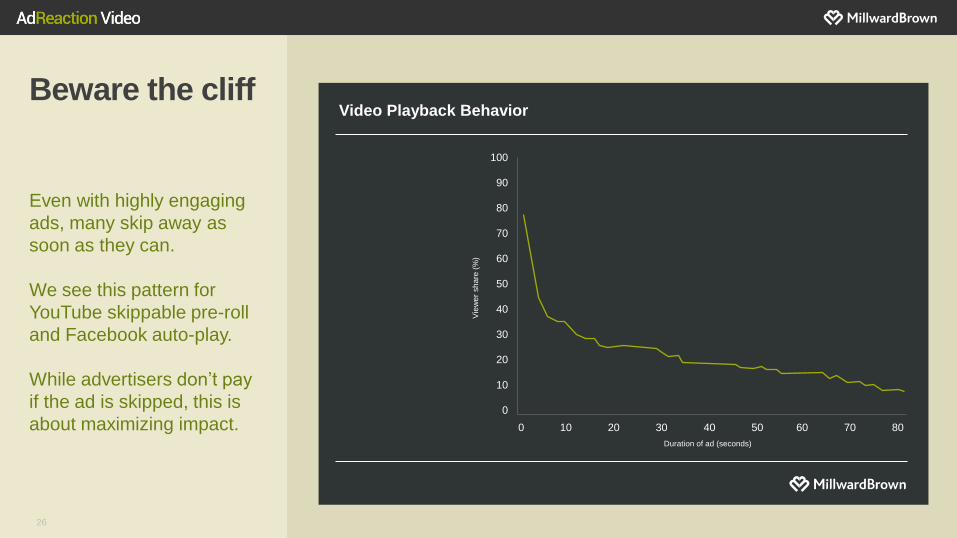
Beware the cliff
Even with highly engaging
ads, many skip away as
soon as they can.
We see this pattern for
YouTube skippable pre-roll
and Facebook auto-play.
While advertisers don’t pay
if the ad is skipped, this is
about maximizing impact.
Vie
we
r sh
are
(%
)
Duration of ad (seconds)
Video Playback Behavior
0 10 20 30 40 50 60 70 80
100
90
80
70
60
50
40
30
20
10
0
27
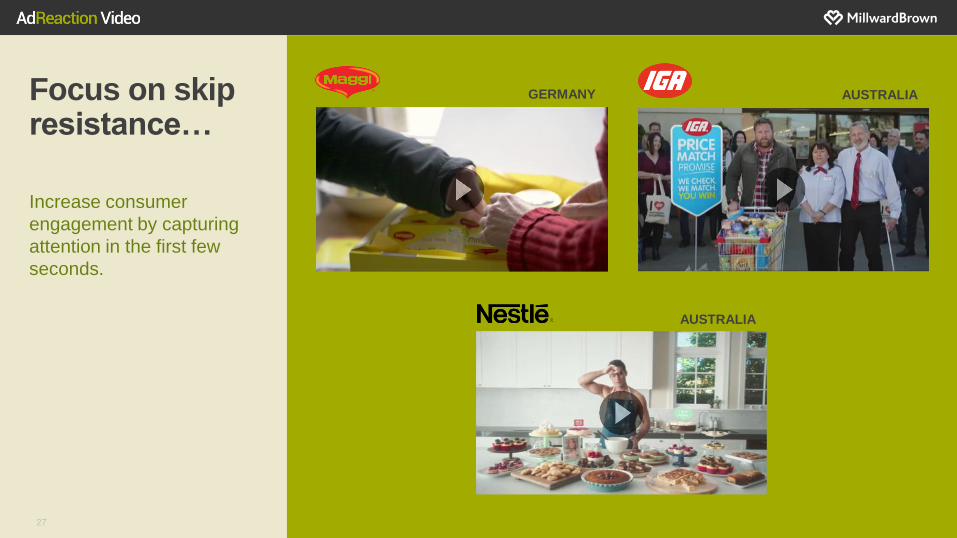
Focus on skip resistance…
Increase consumer
engagement by capturing
attention in the first few
seconds.
GERMANY
AUSTRALIA
AUSTRALIA
28
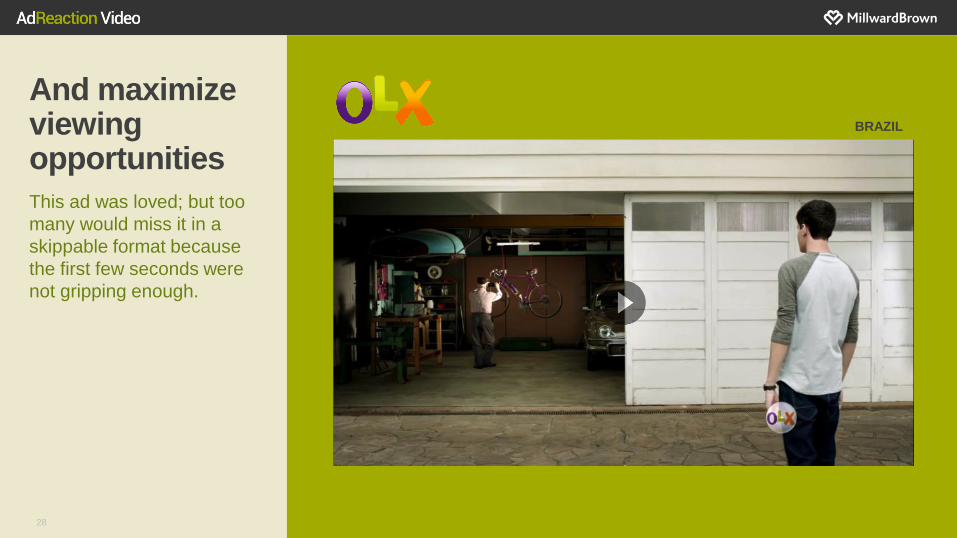
And maximize viewing opportunities
This ad was loved; but too
many would miss it in a
skippable format because
the first few seconds were
not gripping enough.
BRAZIL
29
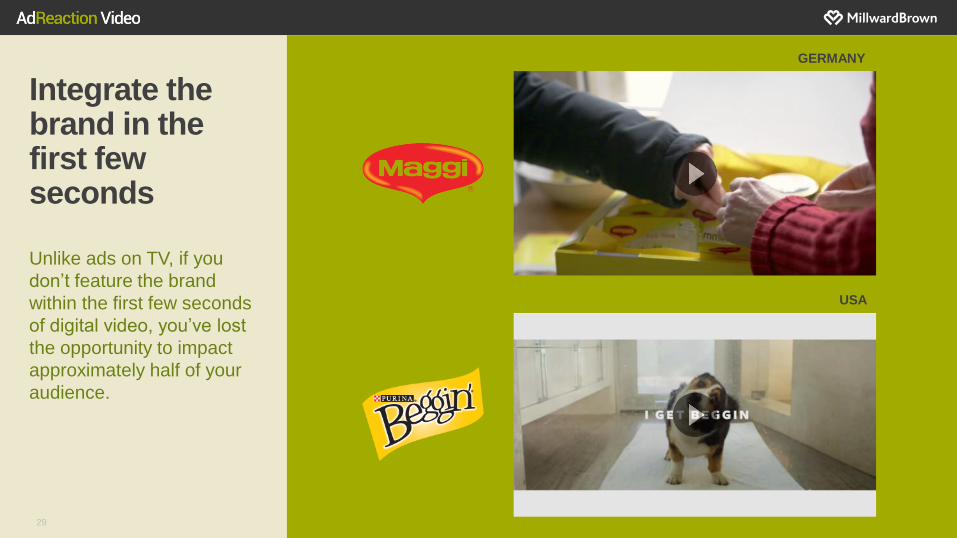
Integrate the brand in the first few seconds
Unlike ads on TV, if you
don’t feature the brand
within the first few seconds
of digital video, you’ve lost
the opportunity to impact
approximately half of your
audience.
GERMANY
USA
30
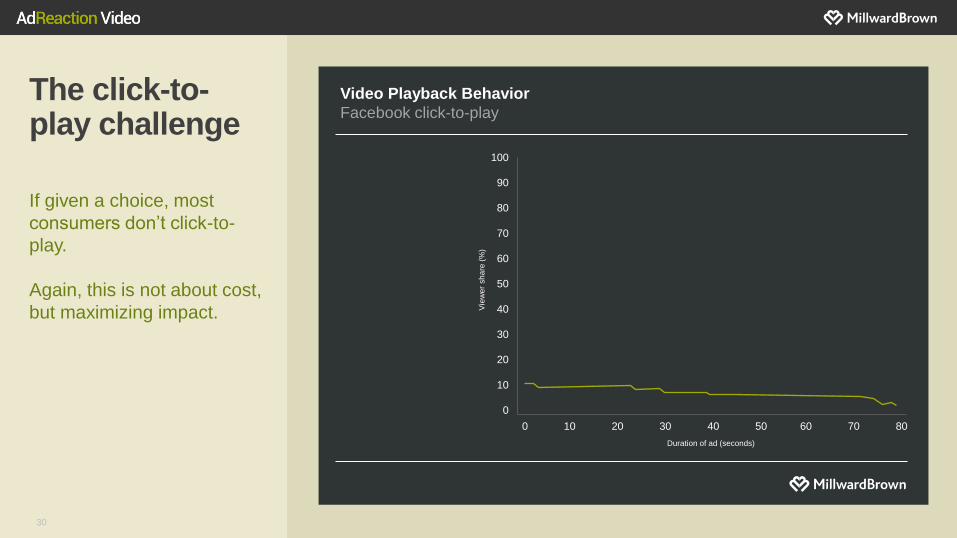
The click-to-play challenge
If given a choice, most
consumers don’t click-to-
play.
Again, this is not about cost,
but maximizing impact. Vie
we
r sh
are
(%
)
Duration of ad (seconds)
Video Playback Behavior
Facebook click-to-play
0 10 20 30 40 50 60 70 80
100
90
80
70
60
50
40
30
20
10
0
31
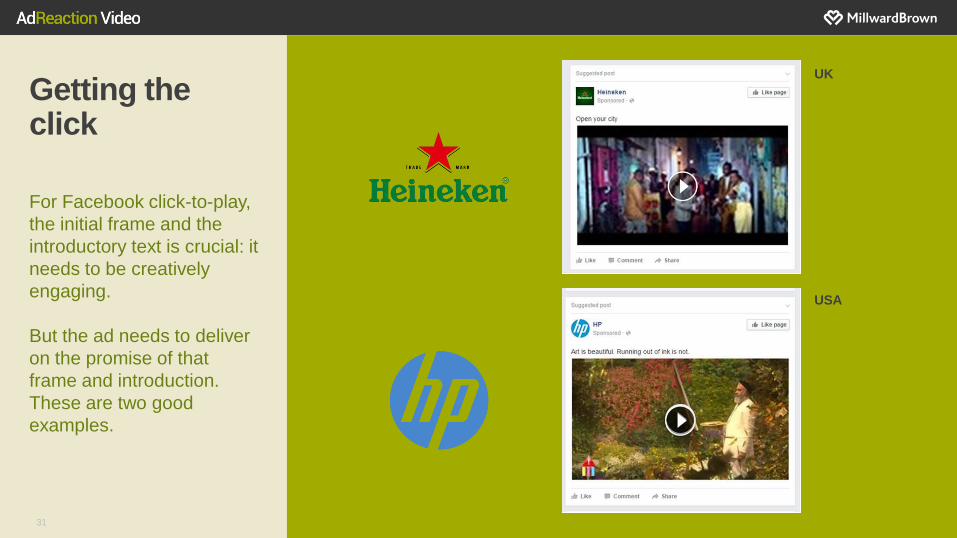
Getting the click
For Facebook click-to-play,
the initial frame and the
introductory text is crucial: it
needs to be creatively
engaging.
But the ad needs to deliver
on the promise of that
frame and introduction.
These are two good
examples.
UK
USA
32
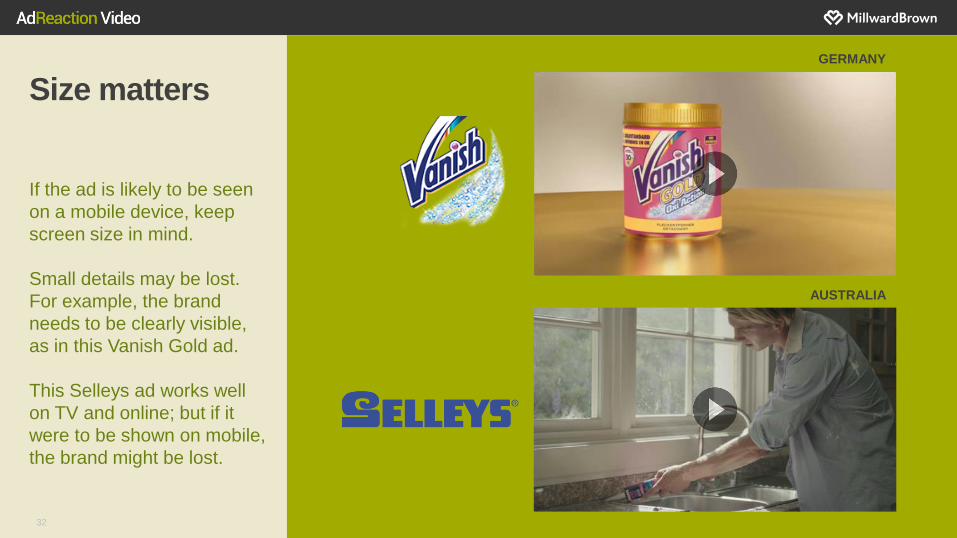
Size matters
If the ad is likely to be seen
on a mobile device, keep
screen size in mind.
Small details may be lost.
For example, the brand
needs to be clearly visible,
as in this Vanish Gold ad.
This Selleys ad works well
on TV and online; but if it
were to be shown on mobile,
the brand might be lost.
GERMANY
AUSTRALIA
33
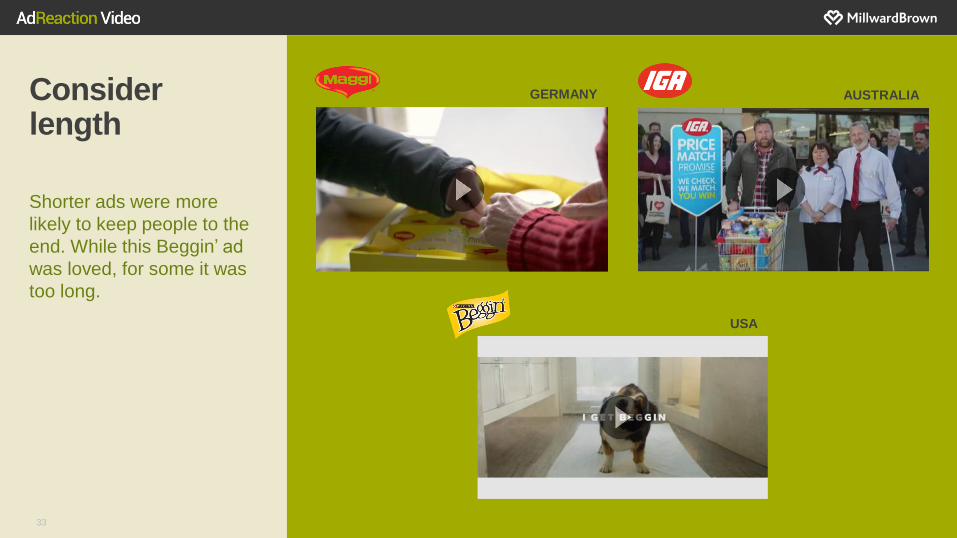
Consider length
Shorter ads were more
likely to keep people to the
end. While this Beggin’ ad
was loved, for some it was
too long.
GERMANY AUSTRALIA
USA
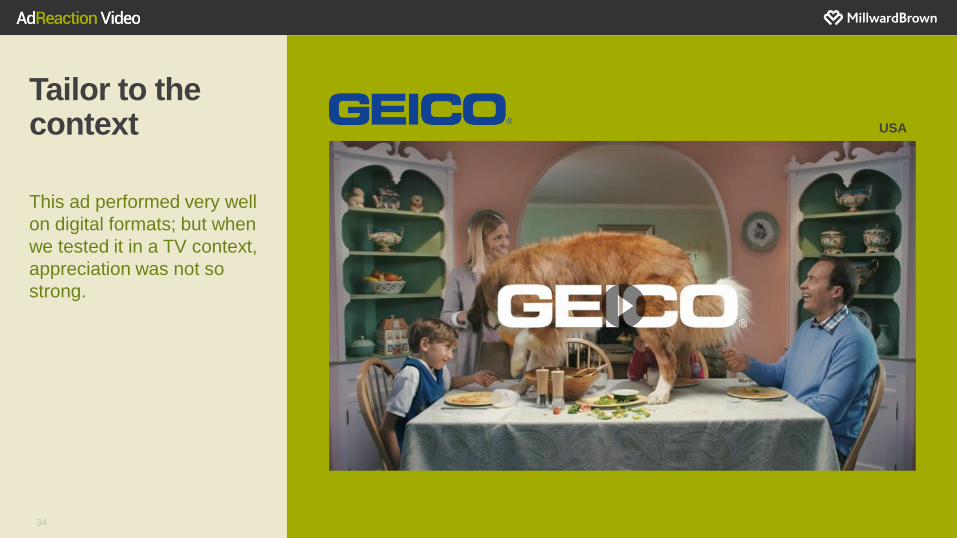
34
Tailor to the context
This ad performed very well
on digital formats; but when
we tested it in a TV context,
appreciation was not so
strong.
USA
35
Right Content – Summary
CREATIVELY capture attention
ENGAGE in the first few
seconds
TAILOR length to the context
Effectiveness learning and further reading
36
37
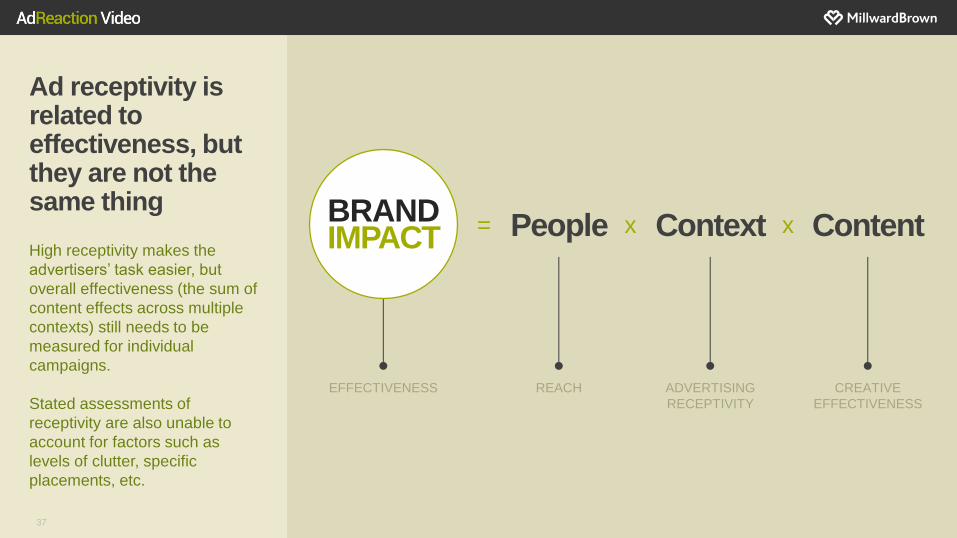
Ad receptivity is related to effectiveness, but they are not the same thing
High receptivity makes the
advertisers’ task easier, but
overall effectiveness (the sum of
content effects across multiple
contexts) still needs to be
measured for individual
campaigns.
Stated assessments of
receptivity are also unable to
account for factors such as
levels of clutter, specific
placements, etc.
EFFECTIVENESS REACH ADVERTISING
RECEPTIVITY
CREATIVE
EFFECTIVENESS
= BRAND IMPACT
x x People Context Content
38
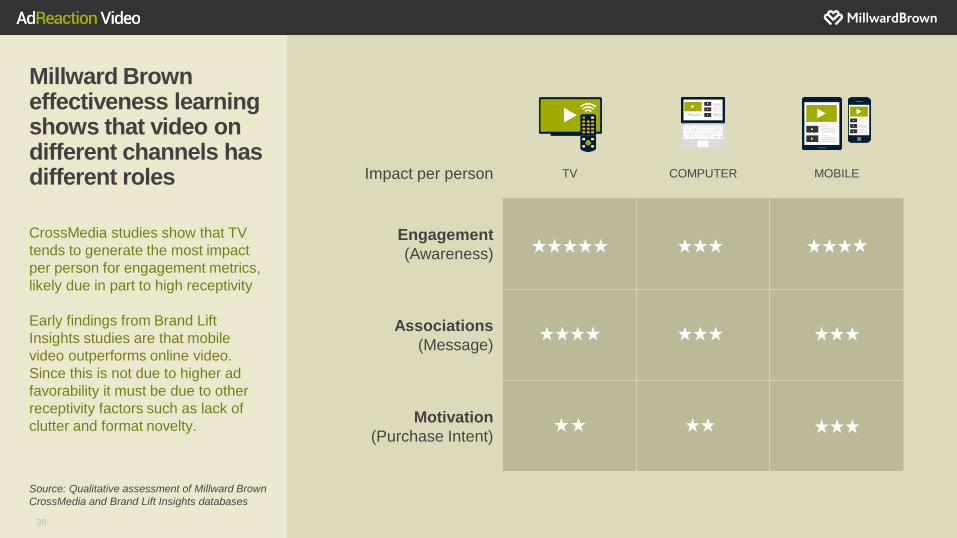
Millward Brown effectiveness learning shows that video on different channels has different roles
CrossMedia studies show that TV
tends to generate the most impact
per person for engagement metrics,
likely due in part to high receptivity
Early findings from Brand Lift
Insights studies are that mobile
video outperforms online video.
Since this is not due to higher ad
favorability it must be due to other
receptivity factors such as lack of
clutter and format novelty.
Impact per person TV COMPUTER MOBILE
Engagement
(Awareness)
Associations
(Message)
Motivation
(Purchase Intent)
Source: Qualitative assessment of Millward Brown
CrossMedia and Brand Lift Insights databases
39
More detailed AdReaction Video data
Free country level data can
be found on the AdReaction
Video website.
For more detailed local
country reports with
analysis and insights,
please contact your local
Millward Brown office.
40
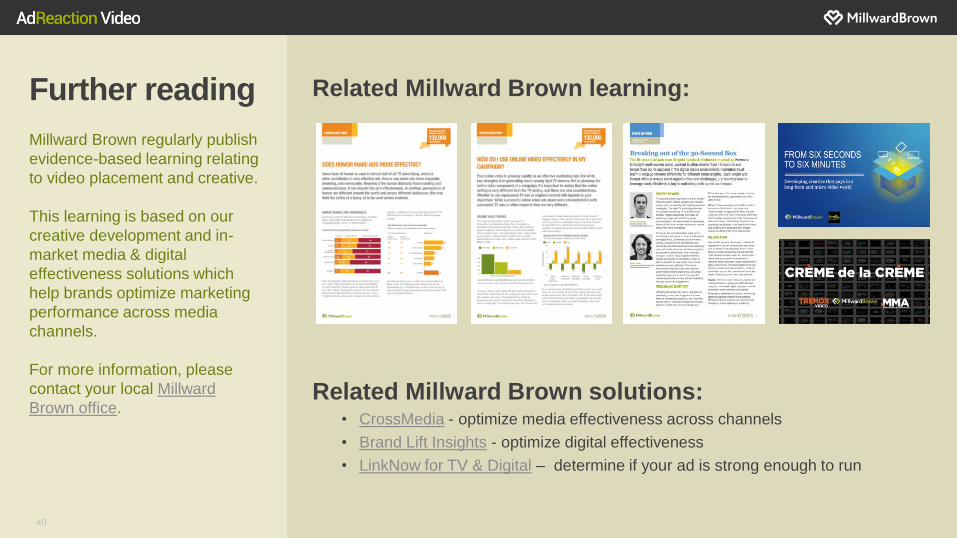
Further reading
Millward Brown regularly publish
evidence-based learning relating
to video placement and creative.
This learning is based on our
creative development and in-
market media & digital
effectiveness solutions which
help brands optimize marketing
performance across media
channels.
For more information, please
contact your local Millward
Brown office.
Related Millward Brown learning:
Related Millward Brown solutions: • CrossMedia - optimize media effectiveness across channels
• Brand Lift Insights - optimize digital effectiveness
• LinkNow for TV & Digital – determine if your ad is strong enough to run

VIDEO CREATIVE IN A DIGITAL WORLD Appendix
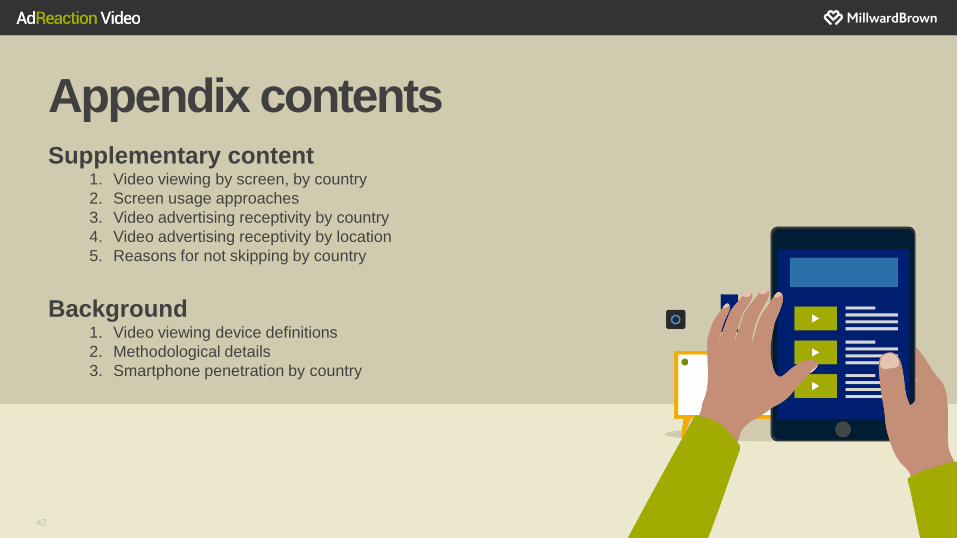
Appendix contents
42
Supplementary content 1. Video viewing by screen, by country
2. Screen usage approaches
3. Video advertising receptivity by country
4. Video advertising receptivity by location
5. Reasons for not skipping by country
Background 1. Video viewing device definitions
2. Methodological details
3. Smartphone penetration by country
43 30
24
32
49
32
21
39
34
30
18
23
32
29
40
18
14
41
23
31
39
32
25
32
30
12
25
20
19
15
17
17
23
22
12
4
20
20
15
17
10
18
13
17
14
16
19
17
18
18
20
21
16
15
22
16
18
21
17
24
16
16
18
13
11
8
8
9
10
9
10
8
14
11
7
11
10
20
13
12
13
7
9
10
19
17
15
15
15
32
16
24
26
31
27
24
26
30
24
32
30
26
28
26
22
Ireland
Canada
UK
France
South Africa
Saudi Arabia
Argentina
Indonesia
Kenya
Hong Kong
Mexico
Brazil
Taiwan
Phillipines
China
Vietnam
Thailand
Malaysia
Colombia
Nigeria
Global
LIVE TV ON DEMAND TV COMPUTER TABLET SMART
PHONE
Total Min
204
272
259
256
248
243
243
241
240
240
240
237
236
229
228
224
215
214
212
212
212
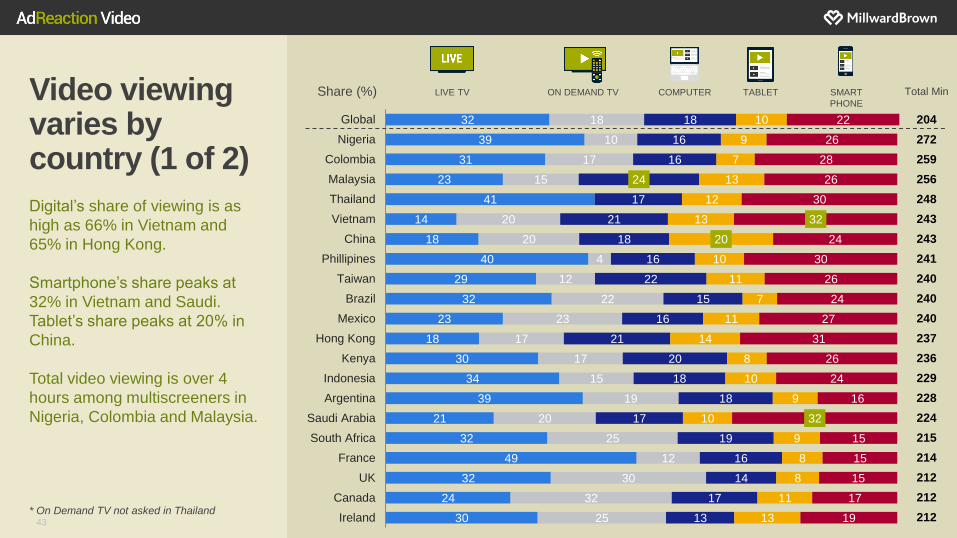
Video viewing varies by country (1 of 2)
Digital’s share of viewing is as
high as 66% in Vietnam and
65% in Hong Kong.
Smartphone’s share peaks at
32% in Vietnam and Saudi.
Tablet’s share peaks at 20% in
China.
Total video viewing is over 4
hours among multiscreeners in
Nigeria, Colombia and Malaysia.
* On Demand TV not asked in Thailand
Share (%)
44 40
32
50
45
29
37
38
24
30
43
44
23
37
43
37
19
32
43
31
29
31
35
32
15
16
17
14
27
12
24
24
29
15
15
26
11
8
11
34
12
14
19
26
33
11
18
18
22
11
21
18
19
17
17
15
16
18
22
23
19
25
19
21
15
23
15
10
22
18
8
11
6
5
9
10
7
6
9
7
8
10
8
8
11
10
10
8
8
12
9
8
10
19
19
17
15
17
23
14
30
18
19
16
18
20
22
16
18
25
20
18
18
18
24
22
Hungary
Greece
Japan
Czech Republic
Denmark
Italy
Netherlands
South Korea
Finland
Germany
Slovakia
Norway
Romania
Poland
Russia
Sweden
Turkey
Spain
New Zealand
Australia
US
India
Global 204
207
202
197
197
194
193
182
182
180
178
176
176
174
172
166
165
164
160
160
158
152
145
Total Min LIVE TV ON DEMAND TV COMPUTER TABLET SMART
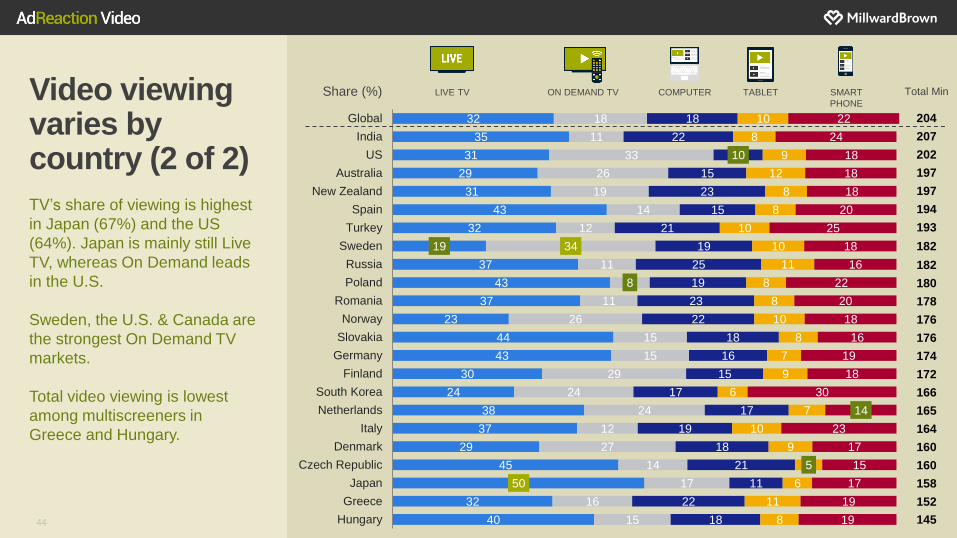
PHONE Video viewing varies by country (2 of 2)
TV’s share of viewing is highest
in Japan (67%) and the US
(64%). Japan is mainly still Live
TV, whereas On Demand leads
in the U.S.
Sweden, the U.S. & Canada are
the strongest On Demand TV
markets.
Total video viewing is lowest
among multiscreeners in
Greece and Hungary.
Share (%)
45
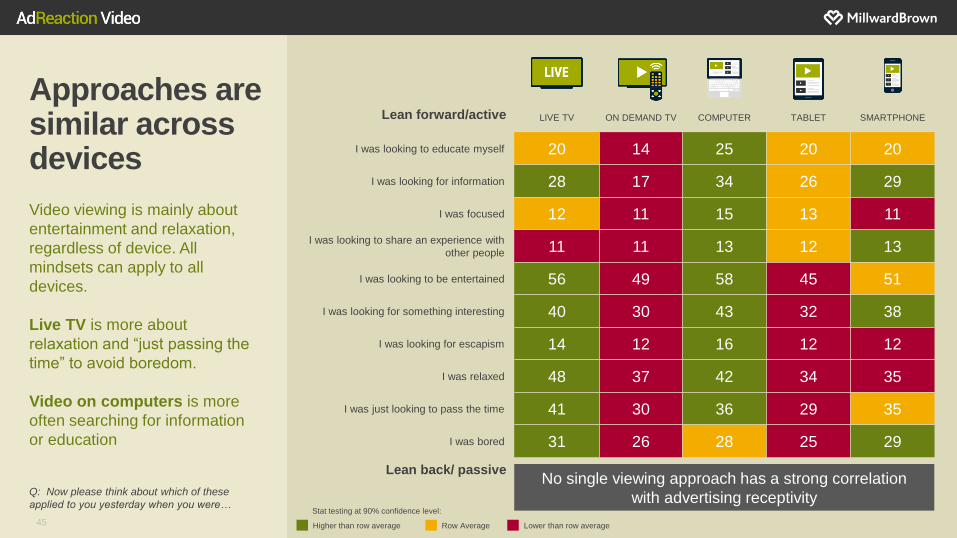
Approaches are similar across devices
Video viewing is mainly about
entertainment and relaxation,
regardless of device. All
mindsets can apply to all
devices.
Live TV is more about
relaxation and “just passing the
time” to avoid boredom.
Video on computers is more
often searching for information
or education
LIVE TV ON DEMAND TV COMPUTER TABLET SMARTPHONE
I was looking to educate myself 20 14 25 20 20
I was looking for information 28 17 34 26 29
I was focused 12 11 15 13 11
I was looking to share an experience with
other people 11 11 13 12 13
I was looking to be entertained 56 49 58 45 51
I was looking for something interesting 40 30 43 32 38
I was looking for escapism 14 12 16 12 12
I was relaxed 48 37 42 34 35
I was just looking to pass the time 41 30 36 29 35
I was bored 31 26 28 25 29
Q: Now please think about which of these
applied to you yesterday when you were…
Row Average Higher than row average Lower than row average
Stat testing at 90% confidence level:
Lean forward/active
Lean back/ passive No single viewing approach has a strong correlation
with advertising receptivity
46
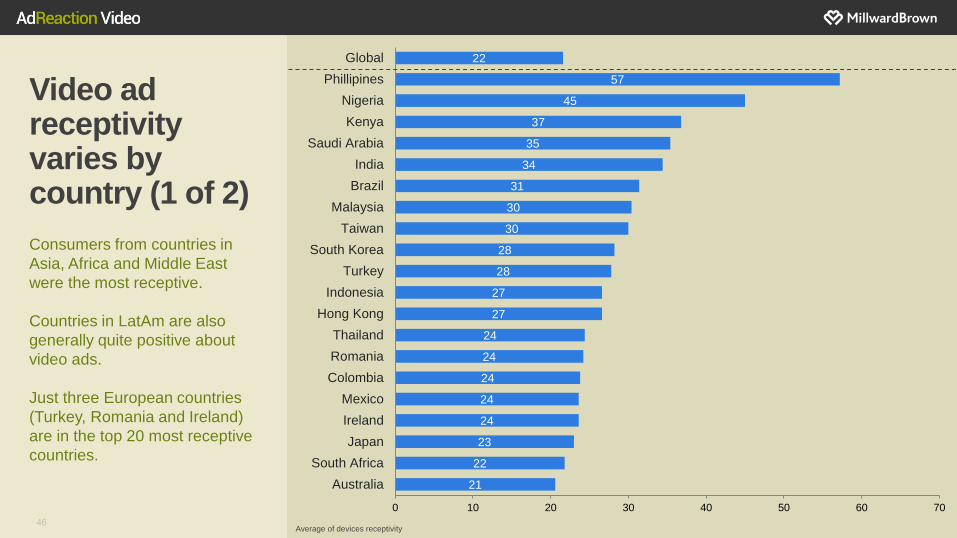
Video ad receptivity varies by country (1 of 2)
Consumers from countries in
Asia, Africa and Middle East
were the most receptive.
Countries in LatAm are also
generally quite positive about
video ads.
Just three European countries
(Turkey, Romania and Ireland)
are in the top 20 most receptive
countries.
21
22
23
24
24
24
24
24
27
27
28
28
30
30
31
34
35
37
45
57
22
0 10 20 30 40 50 60 70
Australia
South Africa
Japan
Ireland
Mexico
Colombia
Romania
Thailand
Hong Kong
Indonesia
Turkey
South Korea
Taiwan
Malaysia
Brazil
India
Saudi Arabia
Kenya
Nigeria
Phillipines
Global
Average of devices receptivity
47
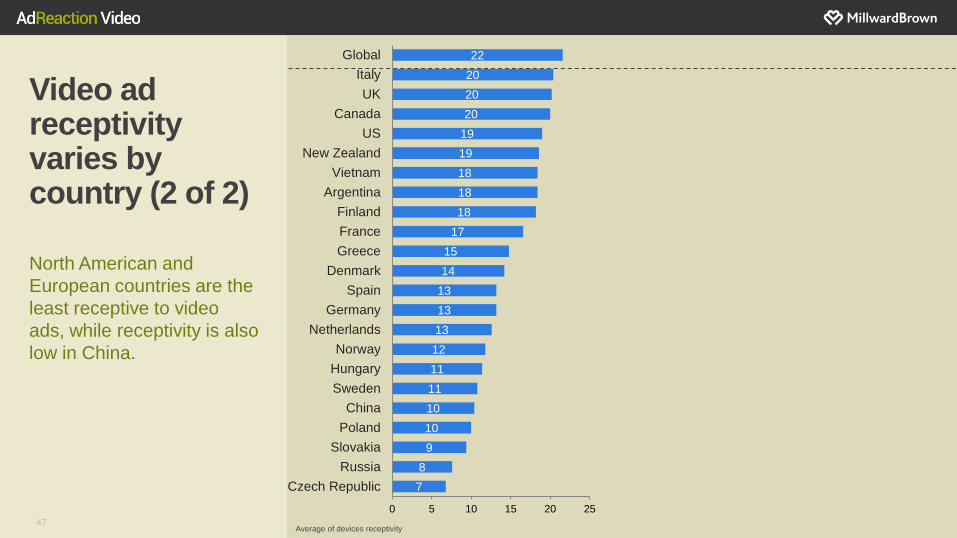
Video ad receptivity varies by country (2 of 2)
North American and
European countries are the
least receptive to video
ads, while receptivity is also
low in China.
Average of devices receptivity
7
8
9
10
10
11
11
12
13
13
13
14
15
17
18
18
18
19
19
20
20
20
22
0 5 10 15 20 25
Czech Republic
Russia
Slovakia
Poland
China
Sweden
Hungary
Norway
Netherlands
Germany
Spain
Denmark
Greece
France
Finland
Argentina
Vietnam
New Zealand
US
Canada
UK
Italy
Global
48
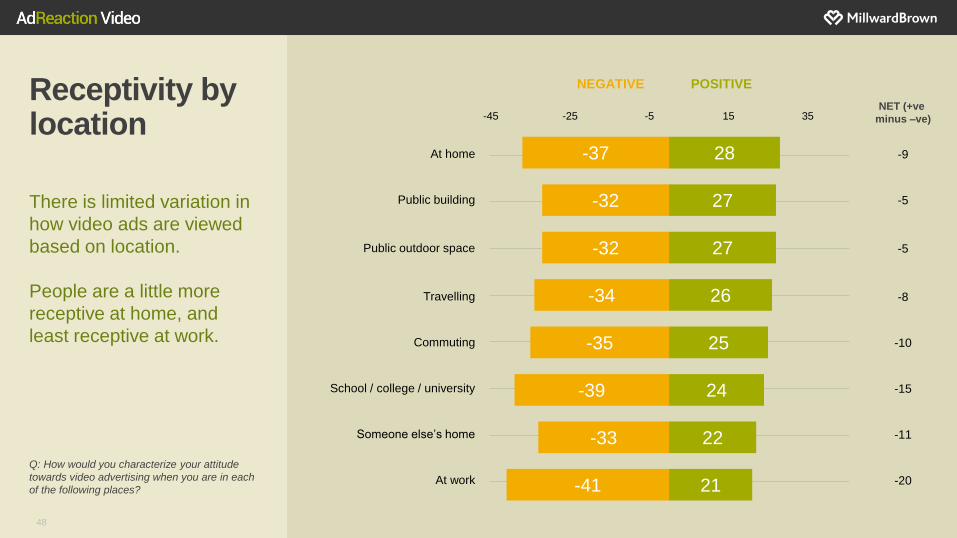
Receptivity by location
There is limited variation in
how video ads are viewed
based on location.
People are a little more
receptive at home, and
least receptive at work.
Q: How would you characterize your attitude
towards video advertising when you are in each
of the following places?
-37
-32
-32
-34
-35
-39
-33
-41
28
27
27
26
25
24
22
21
-45 -25 -5 15 35
NEGATIVE POSITIVE
NET (+ve
minus –ve)
At home
Public building
Public outdoor space
Travelling
Commuting
School / college / university
Someone else’s home
At work
-9
-5
-5
-8
-10
-15
-11
-20
49
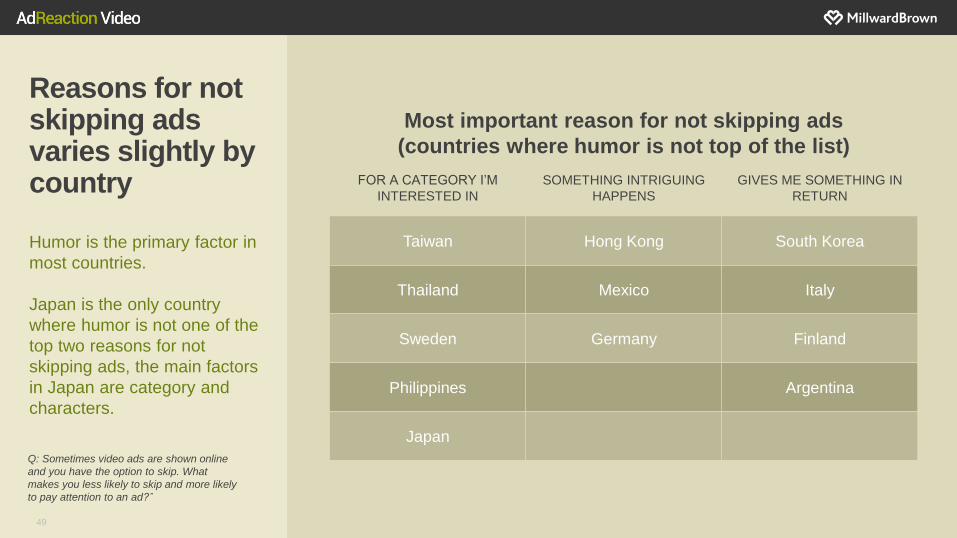
Reasons for not skipping ads varies slightly by country
Most important reason for not skipping ads
(countries where humor is not top of the list)
Humor is the primary factor in
most countries.
Japan is the only country
where humor is not one of the
top two reasons for not
skipping ads, the main factors
in Japan are category and
characters.
Q: Sometimes video ads are shown online
and you have the option to skip. What
makes you less likely to skip and more likely
to pay attention to an ad?ˆ
FOR A CATEGORY I’M
INTERESTED IN
SOMETHING INTRIGUING
HAPPENS
GIVES ME SOMETHING IN
RETURN
Taiwan Hong Kong South Korea
Thailand Mexico Italy
Sweden Germany Finland
Philippines Argentina
Japan
50
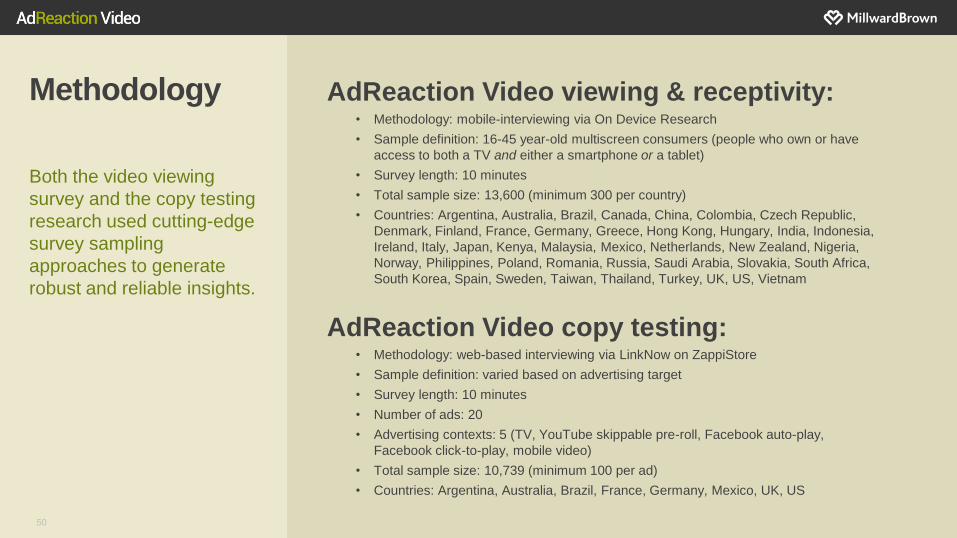
Methodology
Both the video viewing
survey and the copy testing
research used cutting-edge
survey sampling
approaches to generate
robust and reliable insights.
AdReaction Video viewing & receptivity: • Methodology: mobile-interviewing via On Device Research
• Sample definition: 16-45 year-old multiscreen consumers (people who own or have
access to both a TV and either a smartphone or a tablet)
• Survey length: 10 minutes
• Total sample size: 13,600 (minimum 300 per country)
• Countries: Argentina, Australia, Brazil, Canada, China, Colombia, Czech Republic,
Denmark, Finland, France, Germany, Greece, Hong Kong, Hungary, India, Indonesia,
Ireland, Italy, Japan, Kenya, Malaysia, Mexico, Netherlands, New Zealand, Nigeria,
Norway, Philippines, Poland, Romania, Russia, Saudi Arabia, Slovakia, South Africa,
South Korea, Spain, Sweden, Taiwan, Thailand, Turkey, UK, US, Vietnam
AdReaction Video copy testing: • Methodology: web-based interviewing via LinkNow on ZappiStore
• Sample definition: varied based on advertising target
• Survey length: 10 minutes
• Number of ads: 20
• Advertising contexts: 5 (TV, YouTube skippable pre-roll, Facebook auto-play,
Facebook click-to-play, mobile video)
• Total sample size: 10,739 (minimum 100 per ad)
• Countries: Argentina, Australia, Brazil, France, Germany, Mexico, UK, US
51
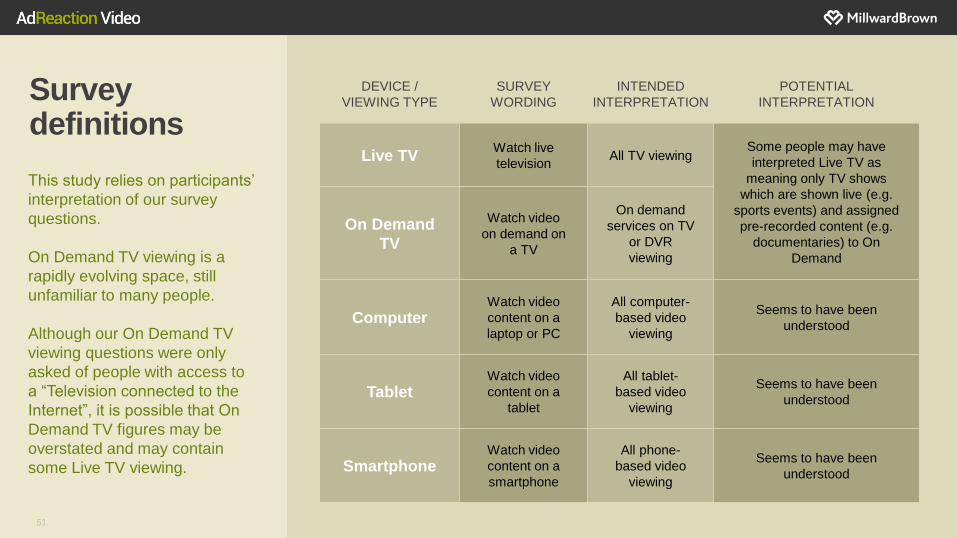
Survey definitions
This study relies on participants’
interpretation of our survey
questions.
On Demand TV viewing is a
rapidly evolving space, still
unfamiliar to many people.
Although our On Demand TV
viewing questions were only
asked of people with access to
a “Television connected to the
Internet”, it is possible that On
Demand TV figures may be
overstated and may contain
some Live TV viewing.
DEVICE /
VIEWING TYPE
SURVEY
WORDING
INTENDED
INTERPRETATION
POTENTIAL
INTERPRETATION
Live TV Watch live
television All TV viewing
Some people may have
interpreted Live TV as
meaning only TV shows
which are shown live (e.g.
sports events) and assigned
pre-recorded content (e.g.
documentaries) to On
Demand
On Demand
TV
Watch video
on demand on
a TV
On demand
services on TV
or DVR
viewing
Computer Watch video
content on a
laptop or PC
All computer-
based video
viewing
Seems to have been
understood
Tablet Watch video
content on a
tablet
All tablet-
based video
viewing
Seems to have been
understood
Smartphone Watch video
content on a
smartphone
All phone-
based video
viewing
Seems to have been
understood
52
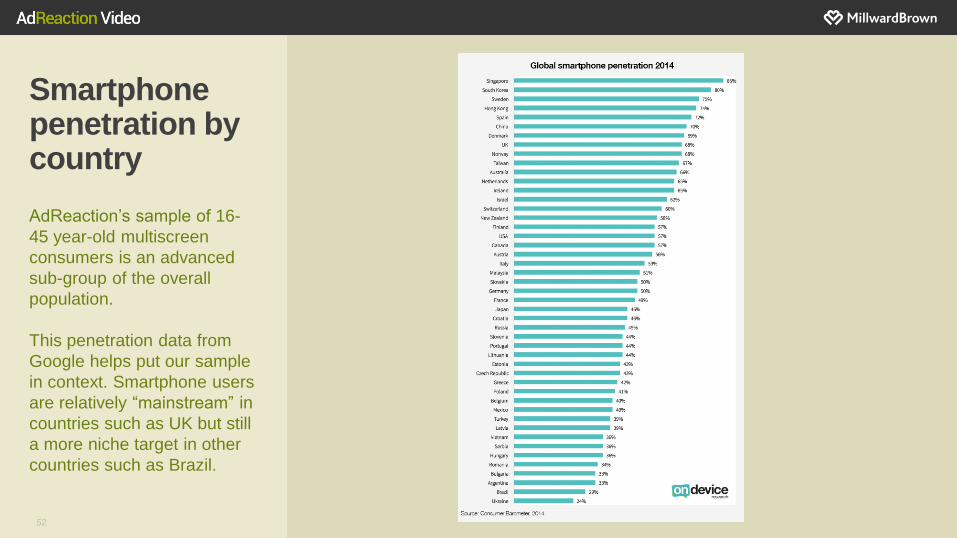
Smartphone penetration by country
AdReaction’s sample of 16-
45 year-old multiscreen
consumers is an advanced
sub-group of the overall
population.
This penetration data from
Google helps put our sample
in context. Smartphone users
are relatively “mainstream” in
countries such as UK but still
a more niche target in other
countries such as Brazil.

VIDEO CREATIVE IN A DIGITAL WORLD #AdReaction Visit AdReaction Video


