Page 1
151
Chapter 6
Adsorption and photocatalytic degradation of Acid
Red 112 by TiO2 nanoparticles
Titanium dioxide (TiO2), also known as titanium (IV) oxide or titania is the naturally
occurring oxide of titanium [1]. Titania is a very well-known and well researched
material due to the stability of its chemical structure, biocompatibility and better physical,
optical and electrical properties [2]. Basic chemistry and physical properties of TiO2 have
been understood and used by man for centuries. TiO2 naturally occurs in three crystalline
phases: anatase, rutile, and brookite. Of these, anatase and rutile are the most commonly
encountered phases. Rutile is the thermodynamically stable form of TiO2 at all
temperatures and at normal pressures. The melting point of rutile ranges from 1830 °C to
1850 °C. Anatase transitions to rutile upon heating and this phase transformation occurs
across a broad temperature range of about 500 °C to 900 °C, depending on the type of
sample.
Historical applications of titanium dioxide
Due to its refractive index, macroscale bulk TiO2 has found many uses as a pigment for
both white and color systems for decades. TiO2 is often used as a white pigment not only
due to its opacifying properties but also because the technology is available to
manufacture pigment TiO2 at the necessary size range and purity. Pigmentary TiO2 is
often manufactured with a particle size of 250 nm to 350 nm.
The most common pigment
use of TiO2 is in surface coatings. Surface coatings include liquid paints and powder
Page 2
Chapter – 6 Adsorption and photocatalytic degradation of Acid Red 112 by TiO2 nanoparticles
152
coatings. After surface coatings, the largest use of pigmentary TiO2 is in plastics.
Applications of pigment TiO2 also include paper, printing inks and fibers. TiO2 may be
incorporated into rubber and leather products in small quantities to impart a high degree
of whiteness while permitting the product to retain most of the natural properties of the
rubber or leather.
Pigment grade TiO2 is often used in applications where its chemical and
biological inert properties as well as pigment properties are advantageous. These inert
properties also lead to its use in cosmetics, soaps, pharmaceuticals and certain food
products where whiteness is desired for marketing reasons. The inert properties of
macroscale TiO2 also allow its use as a support for catalysts. Macroscale TiO2 also finds
use in non-pigment applications. TiO2 is used in welding electrodes as a fluxing agent,
slag former and shade modifier. It is also used in ceramics due to its chemical properties
in addition to its pigment properties. Specifically, TiO2 is used to produce a white hue, as
a pigment, or provide a high refractive index of the glass as an opacifier. It is also
incorporated into electroceramics due to its high dielectric constant.
Applications of nanoscale titanium dioxide
Contrary to pigmentary TiO2, nano TiO2 is not inert and is a UV light attenuator.
Therefore, it finds applications as a catalyst and as a UV light attenuator. The
applications of nano TiO2 generally fall into one of two categories: 1) applications that
use nano TiO2 to attenuate UV light and 2) applications that use nano TiO2 as a catalyst
or semiconductor.
Applications that use nano TiO2 to attenuate UV light include consumer products
such as sunscreens or similar cosmetics, various plastic-based products and containers
Page 3
Chapter – 6 Adsorption and photocatalytic degradation of Acid Red 112 by TiO2 nanoparticles
153
and clothing. Applications that use nano TiO2 as a catalyst include various consumer
products such as household cleaning products, household self-cleaning coatings,
household air filtration devices, electronics and hair styling devices. Commercial
applications also include cleaning products, self-cleaning coatings, air filtration devices,
and environmental remediation of pollutants [3]. Emerging applications include solar
cells that use nano TiO2 for its electron transfer properties.
Photocatalysis is an important application of several semiconductor nanoparticles.
Many chalcogenide semiconductors such as TiO2, ZnO, ZrO2, CdS, MoS2, Fe2O3 and
WO3 have been examined and used as photocatalysts for the degradation of organic
contaminants [4]. In spite of the constant vigorous research activities over the past few
decades in search for an ideal photocatalyst, titania in its anatase modification has
remained a benchmark against which any emerging material candidate will be measured
[5]. The anatase form of titania is reported to give the best combination of photoactivity
and photostability [6]. The potential advantages of using titanium dioxide nanoparticle
for the degradation of wastewater pollutants are: (1) complete mineralization of organic
pollutants to CO2, water and mineral acids, (2) no waste-solids disposal problem and (3)
only mild temperature and pressure conditions are necessary [7 - 10].
Mechanism for TiO2 assisted photocatalytic degradation of dyes
The general mechanism for TiO2 assisted phoocatalytic degradation of dyes has been
widely reported in the literature [2, 11]. According to Akpan and Hameed, the
photoinduced reactions are activated by the absorption of a photon with sufficient energy
by TiO2 [12]. The absorption leads to a charge separation due to promotion of an electron
(e−) from the valence band of the semiconductor catalyst to the conduction band, thus
Page 4
Chapter – 6 Adsorption and photocatalytic degradation of Acid Red 112 by TiO2 nanoparticles
154
generating a hole (h+) in the valence band [13]. The recombination of the electron and the
hole must be prevented as much as possible if a photocatalyzed reaction must be favored.
The ultimate goal of the process is to have a reaction between the activated electrons with
an oxidant to produce a reduced product and also a reaction between the generated holes
with a reductant to produce an oxidized product. The photogenerated electrons could
reduce the dye or react with electron acceptors such as O2 adsorbed on the Ti(III)-surface
or dissolved in water, reducing it to superoxide radical anion O2−•
[14]. The
photogenerated holes can oxidize the organic molecule to form R+, or react with OH
− or
H2O oxidizing them into •OH radicals. Together with other highly oxidant species
(peroxide radicals) they are reported to be responsible for the heterogeneous TiO2
assisted photodecomposition of organic substrates such as dyes. The resulting •OH
radical, being a very strong oxidizing agent (standard redox potential +2.8 V) can oxidize
most azo dyes to the mineral end products. According to this, the relevant reactions at the
semiconductor surface causing the degradation of dyes can be expressed as follows [14]:
)h+(eTiO(UV)h+ TiO +- VBCB22 (6.1)
OHOH HTiO)(hTiO 22VB2 + (6.2)
OHOH 2VB2 TiO)(hTiO + (6.3)
222CB2 TiO)(eTiO - OO (6.4)
22 OHHO (6.5)
Dye + •OH → degradation products (6.6)
Page 5
Chapter – 6 Adsorption and photocatalytic degradation of Acid Red 112 by TiO2 nanoparticles
155
In the present work, titanium dioxide nanoparticles have been synthesized by sol-
gel technique. The synthesized nanoparticles have been characterized by powder X-ray
diffraction, FTIR spectroscopy, FESEM and EDS techniques. These TiO2 nanoparticles
have been utilized for the photocatalytic degradation of Acid Red 112 (AR 112) dye.
However, before testing the photocatalytic activity of TiO2 nanoparticles, its adsorption
performance towards AR 112 has been studied. The effect of parameters such as pH and
contact time on the adsorption capacity of TiO2 has been studied. The adsorption
isotherm studies have been carried out by using Langmuir and Freundlich isotherm
models.
6.1 Structural characterization
6.1.1 X-ray diffraction studies
The XRD pattern of TiO2 nanoparticles calcined at 500 ºC is shown in Figure 6.1. All the
diffraction peaks matched well with the tetragonal anatase TiO2 according to the standard
pattern (JCPDS card No. 86-1157). The major peaks at 2θ values of 25.5º, 37.9º, 48.2º,
54.1º, 55.2º and 68.9º can be indexed to the lattice planes of (101), (004), (200), (105),
(211) and (204) respectively. Furthermore, no characteristic peaks from other crystalline
impurities were detected by XRD, suggesting that the product was of pure anatase
titanium dioxide. The average crystallite size of the synthesized TiO2 was calculated from
the Scherrer equation and was found to be 21 nm.
Page 6
Chapter – 6 Adsorption and photocatalytic degradation of Acid Red 112 by TiO2 nanoparticles
156
Figure-6.1: X-ray diffraction pattern of anatase TiO2 nanoparticles.
6.1.2 FESEM/EDAX analysis
Figure-6.2: Low and high magnification FESEM images of TiO2 nanoparticles.
Page 7
Chapter – 6 Adsorption and photocatalytic degradation of Acid Red 112 by TiO2 nanoparticles
157
Figure-6.3: EDAX pattern of TiO2 nanoparticles.
The composition and surface morphology of the product was analyzed using
FESEM fitted with EDAX. The FESEM images of TiO2 nanoparticles are shown in
Figure 6.2. From the Figure it can be seen that the product consists of spherical to
polyhedral particles of almost uniform size (27 - 30 nm). The EDAX pattern revealed the
presence of titanium and oxygen in the product (Figure 6.3). The absence of other peaks
confirmed that the product consist of pure TiO2.
6.1.3 Fourier Transform Infrared (FTIR) Spectroscopy
The FTIR studies of TiO2 nanoparticles was performed by making pellet with KBr and
the resulting FTIR spectra is shown in Figure 6.4. The absorption peaks at 3442 cm−1
and
1642 cm−1
are attributed to the O-H stretching and H-O-H bending vibrations of adsorbed
Page 8
Chapter – 6 Adsorption and photocatalytic degradation of Acid Red 112 by TiO2 nanoparticles
158
water molecules. The broad band around 450 - 900 cm- 1
in the spectra is attributed to
Ti-O stretching vibrations [15, 16].
Figure-6.4: The FTIR spectrum of TiO2 nanoparticles cacined at 500 ºC for 2 hours.
6.2 Adsorption experiments
For any photocatalyst, it is important to study the adsorption equilibrium prior to
photocataytic experiments. This step is very much essential to understand the adsorption
contribution of the photocatalyst towards dye removal. Adsorption experiments were
carried out as batch tests in an incubator shaker. The pH of AR 112 solution was adjusted
before carrying out batch experiments. Exactly 0.1 g of TiO2 nanoparticles were added to
a flask containing 50 mL of dye solution of known concentration. The contents of the
flask were agitated in an incubator shaker to achieve equilibrium.
Studies on the effect of contact time revealed that the adsorption of AR 112 on
TiO2 nanoparticles was very rapid and found to be completed within 3 - 4 minutes.
Page 9
Chapter – 6 Adsorption and photocatalytic degradation of Acid Red 112 by TiO2 nanoparticles
159
Although the adsorption performance of TiO2 nanoparticles was not superior compared to
conventional adsorbents, the study of adsorption contribution is essential to understand its
photocatalytic behavior. The following section deals with the effect of pH and isotherm
studies for the adsorption of AR 112 onto TiO2.
6.2.1 Effect of pH
The solution pH is an important parameter that controls the surface charge and adsorption
properties of a material in aqueous medium. The effect of solution pH on the adsorption
capacity of TiO2 nanoparticles was studied by varying the pH of dye solution in the range
of 2.0 - 11.0 by the addition of HCl or NaOH. About 0.1 g of TiO2 nanoparticles was
added to each flask containing 50 mL of dye solution and the adsorption experiment was
performed at 298 K.
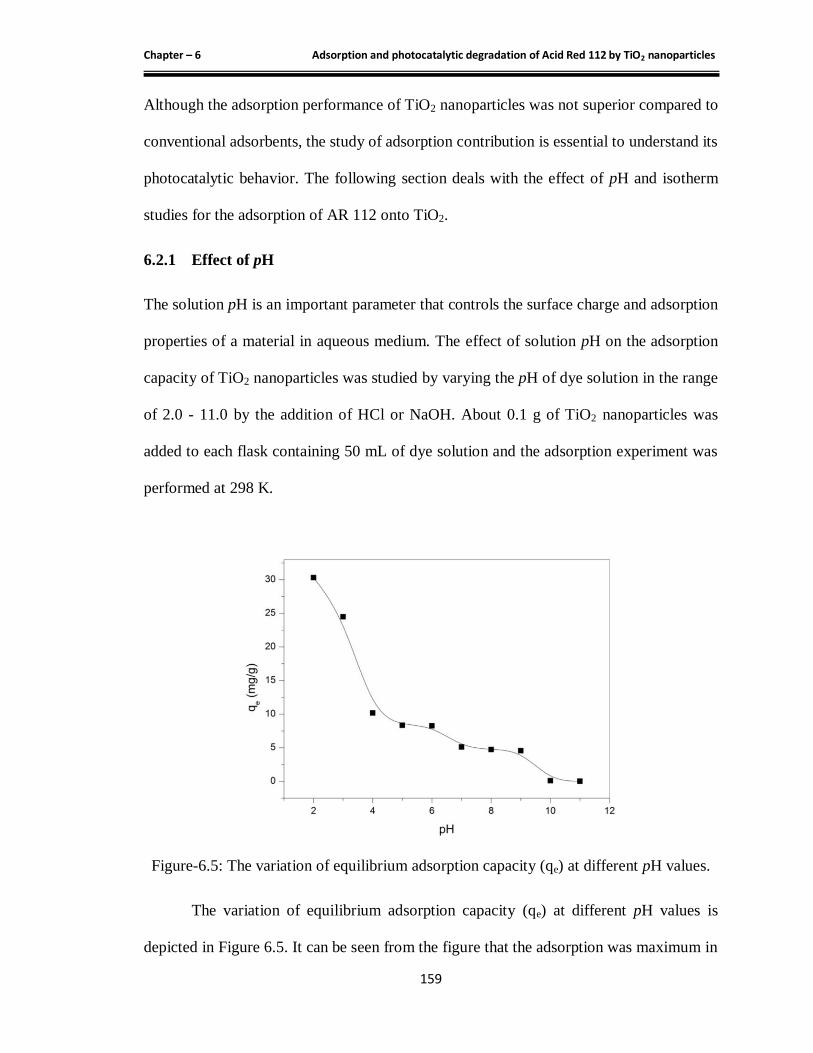
Figure-6.5: The variation of equilibrium adsorption capacity (qe) at different pH values.
The variation of equilibrium adsorption capacity (qe) at different pH values is
depicted in Figure 6.5. It can be seen from the figure that the adsorption was maximum in
Page 10
Chapter – 6 Adsorption and photocatalytic degradation of Acid Red 112 by TiO2 nanoparticles
160
acidic pH and it decreased in neutral and basic conditions. The observed trend in the qe
values may be explained on the basis of surface charge of TiO2 at different pH
environments. The value of pHzpc for TiO2 is 6.8. Hence, under acidic or alkaline
condition the surface of titania can be protonated or deprotonated respectively according
to the following reactions [17]:
2TiOHH+ TiOH (6.7)
OH2TiOOH+ TiOH (6.8)
Thus, the titania surface will remain positively charged in acidic medium
(pH < 6.8) and negatively charged in alkaline medium (pH > 6.8). The AR 112 molecules
are negatively charged due to the presence of four SO3- groups on each molecule. Thus in
acidic medium, the dye molecules were strongly attracted to the positively charged
surface of titania due to the electrostatic forces of attraction. This accounts for the high
adsorption capacity of TiO2 in acidic conditions. The steep fall of qe values observed in
the pH range 2.0 - 4.0 (Figure 6.5) may be due to reduction in positive charge density on
titania which in turn decreases the force of attraction towards dye molecules. For the
same reason, a slow and gradual decrease in the qe values was observed upto pH 7.0. The
poor adsorption of AR 112 and hence decrease in qe values observed in alkaline
conditions may be attributed to the strong electrostatic repulsion between the dye and
negatively charged titania (TiO-) molecules. From the above observations pH 2.0 was
considered as optimum and the same pH was considered for further studies.
Page 11
Chapter – 6 Adsorption and photocatalytic degradation of Acid Red 112 by TiO2 nanoparticles
161
6.2.2 Adsorption isothems
Adsorption isotherm studies were carried out in order to understand the nature and type
of adsorption of AR 112 on the surface of TiO2 nanoparticles. This is also important to
know the maximum adsorption capacity of TiO2 nanoparticles. In the present study,
Langmuir and Freundlich isotherm models were used to investigate the mechanism of
adsorption of AR 112 on TiO2 nanoparticles.
Figure-6.6: Langmuir isotherm plots for the adsorption of AR 112 onto TiO2
nanoparticles.
Table-6.1: Langmuir isotherm parameters for the adsorption of AR 112 on TiO2
nanoparticles.
Dye
Langmuir parameters
qmax (mg g-1
) KL (L mg-1
) R2 RL
AR112 38.53 1.465 0.997 0.008 - 0.021
Page 12
Chapter – 6 Adsorption and photocatalytic degradation of Acid Red 112 by TiO2 nanoparticles
162
Adsorption isotherm studies were carried out by adding 50 mg of TiO2
nanoparticles to a series of flasks containing 50 mL of dye solution of various
concentrations in the range of 30 – 100 mg L-1
. All the solutions were maintained at pH
2.0 prior to the addition of TiO2 and the equilibrium studies were carried out at 298 K.
The plot obtained for Langmuir isotherm model at 298 K is shown in Figure 6.6.
The Langmuir isotherm parameters calculated from the plot of Ce versus Ce/qe are
summarized in Table 6.1. The correlation coefficient (R2) value obtained for Langmuir
model was 0.997, which indicated a good agreement of the data. Thus the experimental
data fitted well with Langmuir isotherm, suggesting the monolayer coverage of dye on
the surface of TiO2 nanoparticles. The Freundlich model showed very poor fit for the
experimental data and hence the corresponding isotherm parameters were not shown
here. Thus it may be concluded that Langmuir model is suitable to describe the
adsorption of AR 112 on nano TiO2 and the calculated maximum adsorption capacity
(qmax) was found to be 38.53 mg g-1
at 298 K.
The feasibility of the isotherm is expressed in terms of separation factor or
equilibrium parameter RL. As shown in Table 6.1, the RL values for the adsorption of AR
112 was found to be fall in the range of 0.008 – 0.021. Thus the value of RL less than
unity indicated a favorable adsorption of dye on nano TiO2.
6.3 Photocatalytic experiments
Although nano titania adsorbs AR 112 to some extent in acidic environment, its
adsorption capacity is low compared to other conventional adsorbents (Table 4.8). Hence,
the synthesized TiO2 nanoparticles cannot be considered for the adsorption removal of
AR 112. Since the photocatalytic behavior of TiO2 is well established, the synthesized
Page 13
Chapter – 6 Adsorption and photocatalytic degradation of Acid Red 112 by TiO2 nanoparticles
163
nano TiO2 may be employed for the catalytic degradation of AR 112 under ultraviolet
light. Although several researchers have worked on the removal and degradation of AR
112 [18-22], the TiO2 assisted photocatalytic degradation has not been attempted so far.
In the present work, the synthesized TiO2 nanoparticles have been successfully
employed as catalyst for the degradation of AR 112 under UV light. The effect of
operating parameters such as irradiation time, solution pH, catalyst dosage and dye
concentration on the rate of dye degradation have been studied and optimized.
6.3.1 Effect of time
The UV-Visible spectrum of AR 112 exhibited three major absorption peaks, out of
which the characteristic peak at 520 nm was chosen for the preparation of calibration
curve and for measuring the concentration of AR 112 at different irradiation time
intervals.
As discussed in chapter 3, the experimental setup consists of artificial UV source
for photocatalytic degradation studies. The UV-Vis absorption patterns of AR 112 (100
ppm) containing 2.0 g L-1
of TiO2 nanoparticles, irradiated for different time intervals are
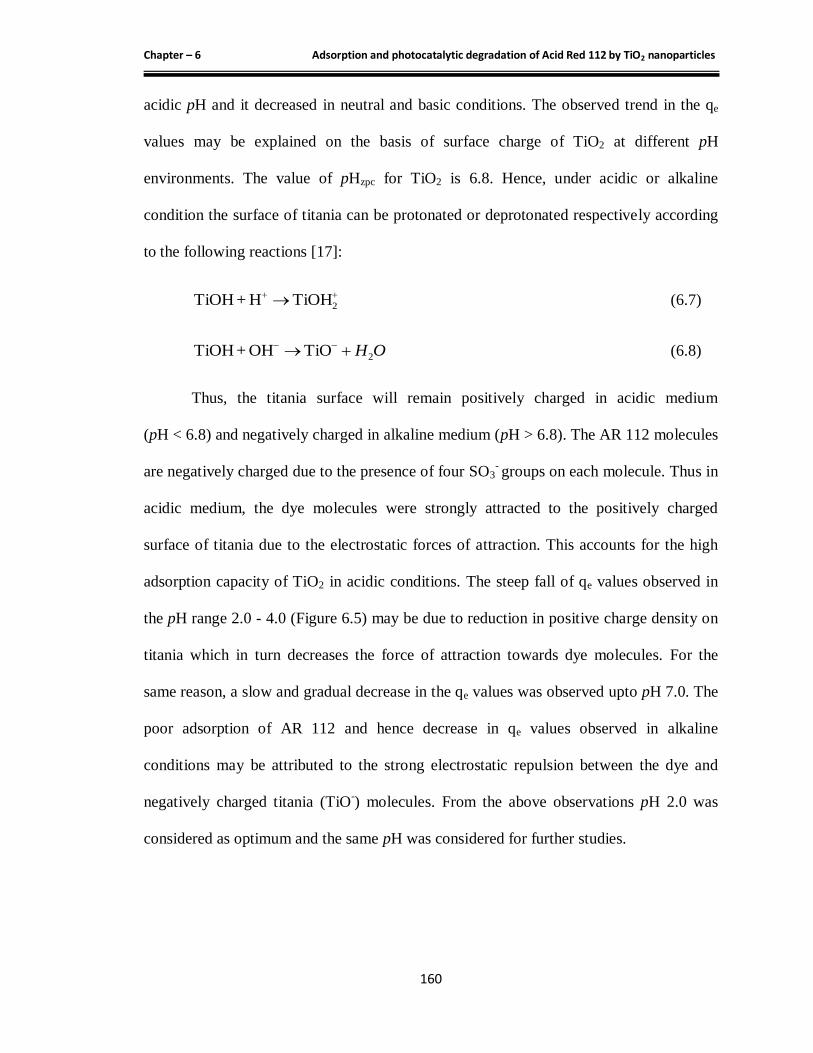
shown in Figure 6.7a. The results suggested that the photocatalytic degradation of AR
112 is driven by UV light. The decrease in the intensity of absorption peaks in both UV
and visible regions may be attributed to the reduction in the concentration of AR 112
with time. Figure 6.8b shows the depletion of COD for AR 112 with time. It can be seen
that about 98% COD removal was achieved within 120 min of irradiation (Figure 6.7b).
The control experiments were also carried out in dark and in the absence of
photocatalyst. The results clearly demonstrated that the degradation of AR 112 is indeed
Page 14
Chapter – 6 Adsorption and photocatalytic degradation of Acid Red 112 by TiO2 nanoparticles
164
catalyzed by TiO2. The kinetic investigation revealed that the photocatalytic degradation
of AR 112 follows first order kinetics, which is in good agreement with several earlier
works on photocatalytic degradation of dyes.
Figure-6.7: (a) UV-Visible absorption spectra showing the degradation of AR 112 with
time (AR 112= 100 ppm ; TiO2= 2.0 g L-1
; pH= 6.0); a→j : 0, 5, 10, 20, 30, 45, 60, 90,
120, and 150 min ; (b) COD depletion curve for AR 112.
6.3.2 Effect of catalyst loading
In order to optimize the dosage of photocatalyst, experiments were carried out by taking
different amounts of TiO2 nanoparticles (0.5 - 6.0 g L-1
) and keeping dye concentration
constant at 100 ppm (pH 6.0). The plot of rate constant (k) versus the mass of TiO2
nanoparticles is shown in Figure 6.8. There was a drastic increase in ‘k’ value up to 2.0 g
L-1
, later the ‘k’ values raised slowly and became almost constant beyond 4.0 g L-1
of
TiO2 nanoparticles. The initial rapid increase in ‘k’ is due to the increase in the number of
active sites available on the catalyst surface for the reaction, which in turn increases the
rate of radical (.OH) formation. The slow enhancement in ‘k’ beyond 2.0 g L
-1 and
attainment of constant value may be attributed to light scattering and reduction in light
penetration caused by increased number of TiO2 particles. At higher catalyst loading, the
(a) (b)
Page 15
Chapter – 6 Adsorption and photocatalytic degradation of Acid Red 112 by TiO2 nanoparticles
165
deactivation of activated molecule by collision with the ground state molecules also
dominates, thus reducing the rate of reaction [23]. A catalyst dosage of 2.0 g L-1
was
chosen for the optimization of other experimental parameters.
Figure-6.8: Effect of TiO2 loading on rate constant (k) for the photodegradation of
AR 112.
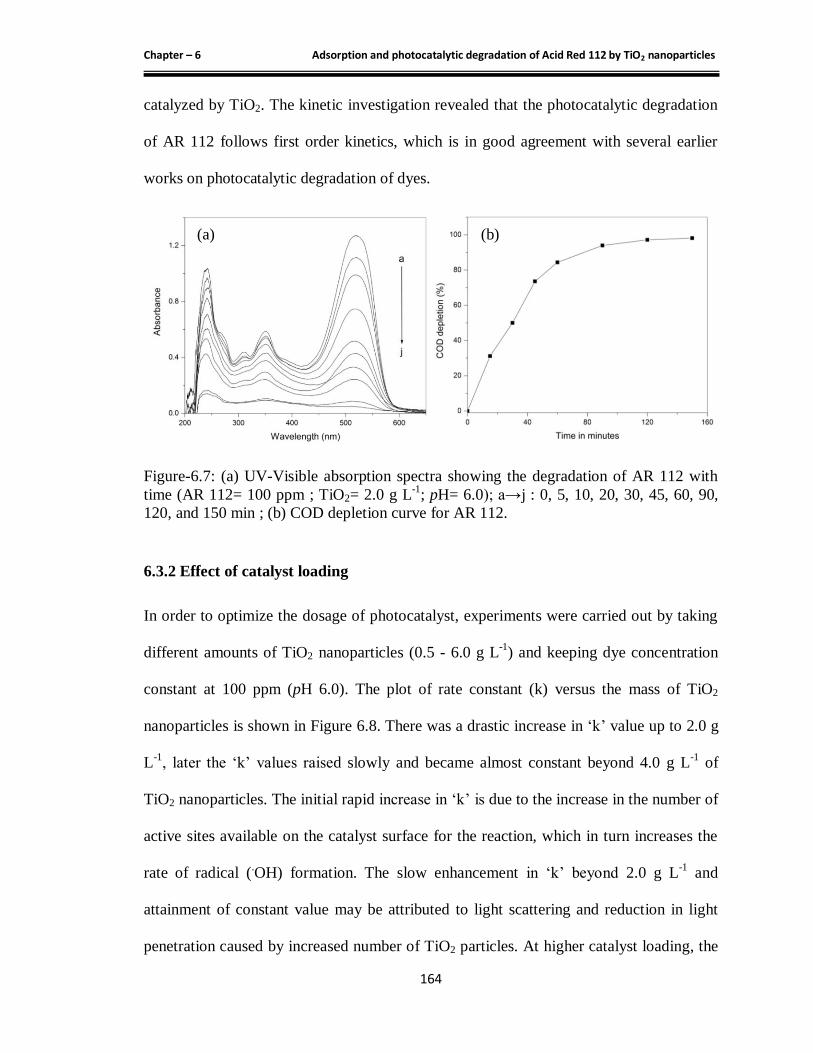
6.3.3 Effect of initial dye concentration
Experiments were also performed by varying the initial concentration of AR 112 from 25
- 100 ppm (pH 6.0) in the presence of 2.0 g L-1
of TiO2 nanoparticles. The first order
plots obtained for different initial dye concentrations are shown in Figure 6.9 and the
corresponding rate constants were found to be 60.8 × 10⁻³
, 18.3 × 10⁻³
, 10 × 10-3
and 7.4
× 10-3
min-1
for initial dye concentration of 25, 50, 75 and 100 ppm respectively. It was
observed that the rate constant decreased with increase in initial dye concentration for a
fixed mass of photocatalyst. The active surface on the catalyst available for reaction is
very crucial for the degradation to take place. As the dye concentration is increased for a
fixed catalyst mass, it results in fewer active sites for the reaction. Also, with increased
concentration of dye molecules, the solution colour becomes more intense and thereby
Page 16
Chapter – 6 Adsorption and photocatalytic degradation of Acid Red 112 by TiO2 nanoparticles
166
only fewer photons reach the catalyst surface. This limits the production of hydroxyl
radicals which in turn leads to reduced reaction rate [24].
Figure-6.9: The first order plots for the photodegradation of AR 112 at different initial
dye concentrations.
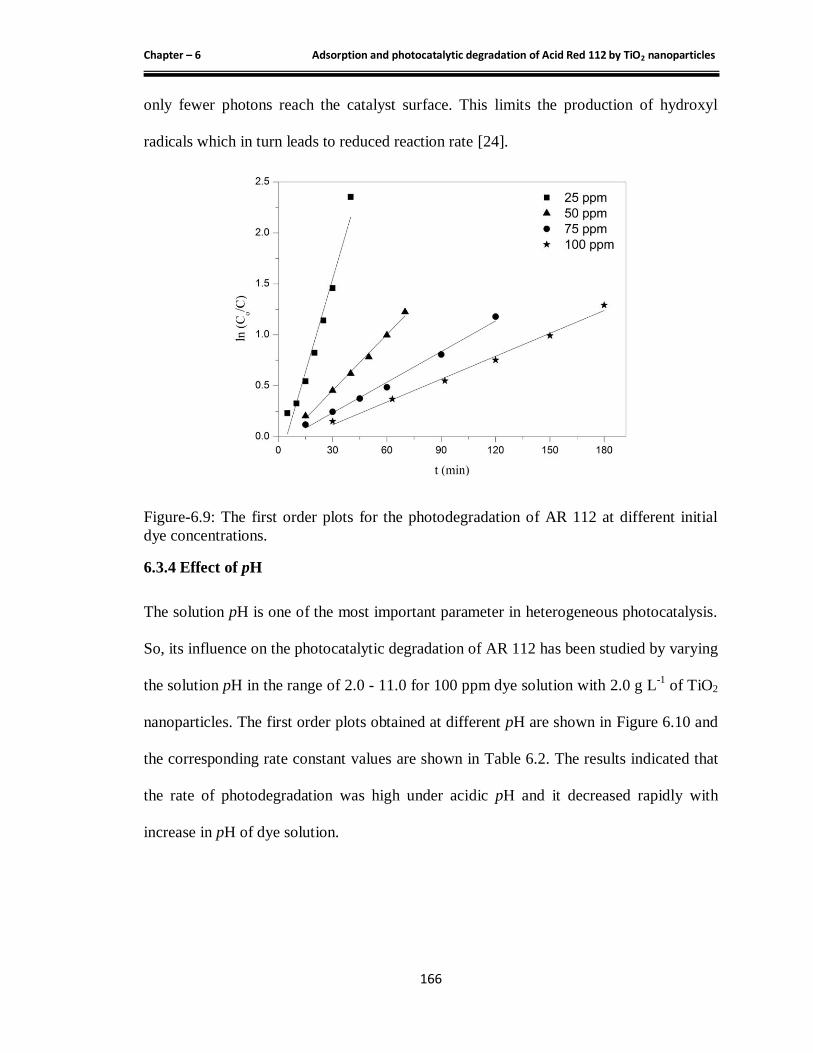
6.3.4 Effect of pH
The solution pH is one of the most important parameter in heterogeneous photocatalysis.
So, its influence on the photocatalytic degradation of AR 112 has been studied by varying
the solution pH in the range of 2.0 - 11.0 for 100 ppm dye solution with 2.0 g L-1
of TiO2
nanoparticles. The first order plots obtained at different pH are shown in Figure 6.10 and
the corresponding rate constant values are shown in Table 6.2. The results indicated that
the rate of photodegradation was high under acidic pH and it decreased rapidly with
increase in pH of dye solution.
Page 17
Chapter – 6 Adsorption and photocatalytic degradation of Acid Red 112 by TiO2 nanoparticles
167
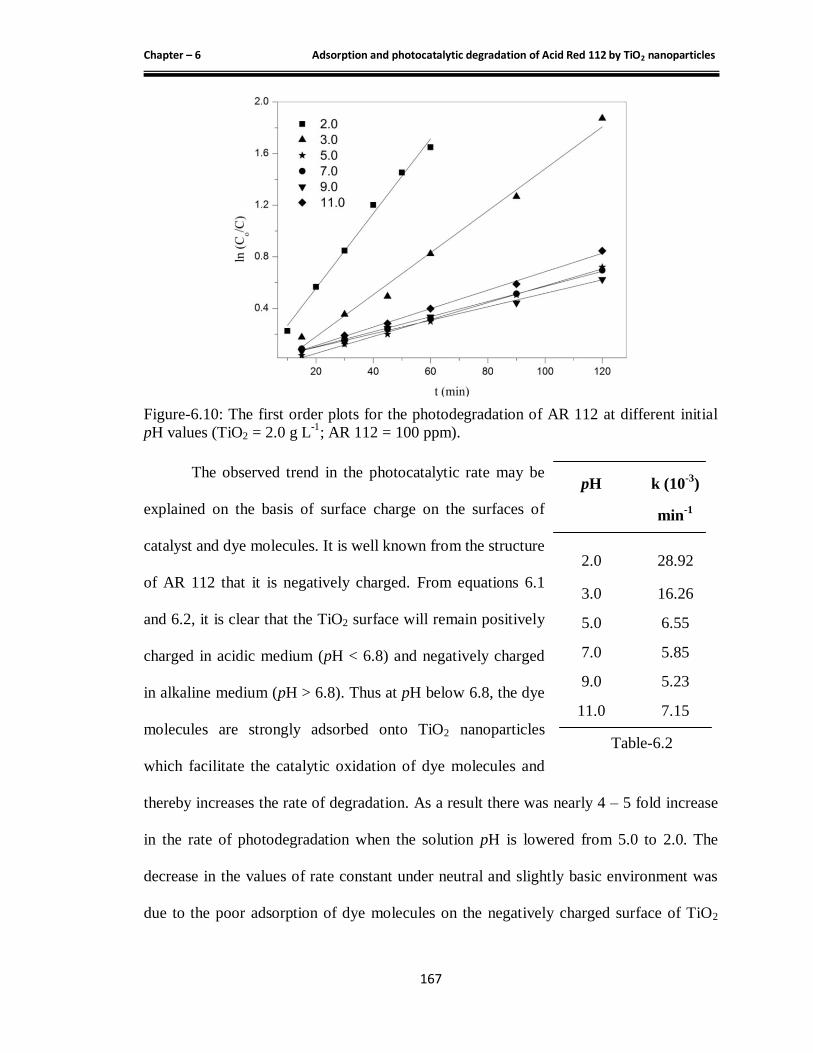
Figure-6.10: The first order plots for the photodegradation of AR 112 at different initial
pH values (TiO2 = 2.0 g L-1
; AR 112 = 100 ppm).
The observed trend in the photocatalytic rate may be
explained on the basis of surface charge on the surfaces of
catalyst and dye molecules. It is well known from the structure
of AR 112 that it is negatively charged. From equations 6.1
and 6.2, it is clear that the TiO2 surface will remain positively
charged in acidic medium (pH < 6.8) and negatively charged
in alkaline medium (pH > 6.8). Thus at pH below 6.8, the dye
molecules are strongly adsorbed onto TiO2 nanoparticles
which facilitate the catalytic oxidation of dye molecules and
thereby increases the rate of degradation. As a result there was nearly 4 – 5 fold increase
in the rate of photodegradation when the solution pH is lowered from 5.0 to 2.0. The
decrease in the values of rate constant under neutral and slightly basic environment was
due to the poor adsorption of dye molecules on the negatively charged surface of TiO2
pH k (10-3
)
min-1
2.0 28.92
3.0 16.26
5.0 6.55
7.0 5.85
9.0 5.23
11.0 7.15
Table-6.2
Page 18
Chapter – 6 Adsorption and photocatalytic degradation of Acid Red 112 by TiO2 nanoparticles
168
nanoparticles. Further, little enhancement in the reaction rate was observed under highly
alkaline pH and this could be attributed to the increase of hydroxyl ions, which induces
the formation of more hydroxyl radicals [25, 26].
6.4 Conclusions
In the present study, anatase TiO2 nanoparticles have been synthesized by sol-gel method.
The average particle size of the synthesized product was found to be 21 nm and the
particles were found to be spherical to polyhedral in shape. The dye adsorption studies
have shown that significant adsorption of AR 112 occurred at pH 2.0, which is related to
the surface charge of TiO2. Langmuir adsorption isotherm model was found suitable to
describe the adsorption of AR 112 on TiO2 nanoparticles. A maximum adsorption of
38.53 mg g-1
has been achieved at 300 K. The photocatalytic degradation studies under
UV light showed that the complete degradation of AR 112 took place after 3 hours of
irradiation with nearly 99% COD removal. The study on the effect of parameters showed
that 2.0 g L-1
of catalyst dose was optimum for the degradation of 100 ppm dye. Further,
the rate of photodegradation was found to be highest in acidic medium due to the
increased adsorption of dye molecules on the surface of TiO2 nanoparticles. The rate
constant values decreased with increase in the concentration of dye suggesting the poor
light penetration at higher dye concentrations. From the results it may be concluded that
TiO2 nanoparticles can be employed as an effective photocatalyst for the degradation of
azo dyes present in textile wastewater.
Page 19
Chapter – 6 Adsorption and photocatalytic degradation of Acid Red 112 by TiO2 nanoparticles
169
REFERENCES
[1] Y. Ma, J. Zhang, B. Tian, F. Chen, L. Wang, J. Hazard. Mater. 182 (2010) 386.
[2] U.G. Akpan, B.H. Hameed, J. Hazard. Mater. 170 (2009) 520–529.
[3] Katrina Varner, Environmental Protection Agency, USA, 2010.
[4] I.K. Konstantinou, V.A. Sakkas, T.A. Albanis, Water Res. 36 (2002) 2733.
[5] K. Rajeshwar, C.R. Chenthamarakshan, S. Goeringer, M. Djukic, Pure Appl. Chem.
73 (2001) 1849.
[6] W.A. Zeltner, D.T. Tompkin, Ashrae Transactions, vol. III, American Society of
Heating and Air-Conditioning Engineers Inc., part 2 (2005) 532.
[7] N.M. Mahmoodi, M. Arami, N.Y. Limaee, N.S. Tabrizi, J. Colloid Interf. Sci. 295
(2006) 159–164.
[8] I.K. Konstantinou, T.A. Albanis, Appl. Catal. B: Environ. 49 (2004).
[9] N.M. Mahmoodi, M. Arami, N.Y. Limaee, K. Gharanjig, F.D. Ardejani, Colloid
Surface A: Physicochem. Eng. Aspects 290 (2006) 125–131.
[10] D.S. Bhatkande, V.G. Pangarkar, A.A.C.M. Beenacker, J. Chem. Technol.
Biotechnol. 77 (2001) 102–116.
[11] Detlef Bahnemann, Solar Energy 77 (2004) 445–459.
[12] O. Carp, C.L. Huisman, A. Reller, Solid State Chem. 32 (2004) 33–177.
[13] U.I. Gaya, A.H. Abdullah, J. Photochem. Photobiol. C: Photochem. Rev. 9 (2008)
1–12.
[14] I.K. Konstantinou, T.A. Albanis, Appl. Catal. B: Environ. 49 (2004) 1–14.
[15] L. S. Yoong, F.K. Chong, Binay K. Dutta, Energ. 34 (2009)1652.
[16] L. Kumaresan, M. Mahalakshmi, M. Palanichamy, and V. Murugesan, Ind. Eng.
Chem. 49 (2010) 1480.
[17] U.I. Gaya, A.H. Abdullah, J. Photochem. Photobiol. C: Photochem. Rev. 9 (2008)
1–12.
[18] R.C. Meena, Ram Babu Pachwarya, Vijay Kumar Meena, Shakuntla Arya, Am. J.
Environ. Sci. 5 (2009) 444-450.
[19] Hanaa S. El-Desoky, Mohamed M. Ghoneim, Naglaa M. Zidan, Desalination 264
(2010) 143-150.
Page 20
Chapter – 6 Adsorption and photocatalytic degradation of Acid Red 112 by TiO2 nanoparticles
170
[20] Bharat N. Patil, D.B. Naik, V.S. Shrivastava, Desalination 269 (2011) 276-283.
[21] M.H. Vijaykumar, P.A. Vaishamapayan, Y.S. Shouche, T.B. Karegoudar, Enzyme
Microb. Technol. 40 (2007) 204-211.
[22] H. Chen, R.F. Wang, C.E. Cerniglia, Protein Expres. Pur. 34 (2004) 302-310.
[23] R. Rajeswari, S. Kanmani, J. Sci. Ind. Res. 1063 (2009) 68.
[24] H.R. Pouretedal, A. Norozi, M.H. Keshavarz, A. Semnani, J. Hazard. Mater. 674
(2009) 162.
[25] K. Byrappa, A.K. Subramani, S. Ananda, K.M.L. Rai, R. Dinesh, M. Yoshimura,
Bull. Mater. Sci., 433 (2006) 29.
[26] N. Daneshvar, S. Aber, M.S.S. Dorraji, A.R. Khataee, M.H. Rasoulifard, Sep. Purif.
Technol. 91 (2007) 58.