Adsorption and transport of gases in a supported microporous silica membrane Xuechao Gao, João C. Diniz da Costa, Suresh K. Bhatia n School of Chemical Engineering, The University of Queensland, Brisbane, Qld. 4072, Australia article info Article history: Received 10 December 2013 Received in revised form 16 February 2014 Accepted 19 February 2014 Available online 26 February 2014 Keywords: Supported microporous membrane Effective medium theory Oscillator model Transition-state theory silica micropores abstract We investigate gas adsorption and transport in a disordered microporous silica membrane having mean pore diameter 1.5 nm, coated on a porous tubular asymmetric support. The adsorption isotherms are found to be Langmuirian, with equilibrium constants that are accurately predicted for nonpolar gases, considering Lennard–Jones (LJ) interactions with a single layer of oxygen atoms on the pore surface. For the polar gas, CO 2 , the hydroxyls groups on the pore walls strongly increase the affinity with the pore walls, and a superposition of the LJ potential and an empirically represented electrostatic interaction is found to be adequate in correlating the Langmuirian equilibrium constant. The gas transport in the microporous silica layer is investigated using effective medium theory, with single pore transport represented by combination of pore mouth and internal pore diffusion resistances. Good agreement is observed for all the gases using different coordination numbers, indicating that the essential features of the transport in the silica micropores are captured in the approach. It is found that the overall transport resistance is dominated by the pore mouth barrier; however, the internal diffusion resistance in the relatively smaller pores is significant, especially for weakly adsorbed gases at higher temperature. In addition, the dependence of the pore mouth barrier coefficient on temperature and diffusing species are in good agreement with predictions of transition-state theory, with larger more strongly adsorbed molecules having higher activation energy. The proposed methodology is validated against experiment by comparison of the predicted flux for different gases in the supported membrane at various feed pressures in the low pressure range of 200–400 kPa, using the parameters obtained at 200 kPa. & 2014 Elsevier B.V. All rights reserved. 1. Introduction The modeling of fluid transport in narrow pores and confined spaces has attracted considerable interest among scientists and engineers for over a century [1–3], due to its importance to a variety of conventional applications in adsorptive gas separation as well as in heterogeneous catalysis and electrochemical process. Interest in the subject has considerably increased in the last two decades, as a consequence of the development of a vast array of novel disordered and ordered nanoporous materials [4–9], having potential for use in these as well as in emerging applications such as in gas storage [10], molecular sieve membranes [11], drug delivery [12] and biosensors [13], all of which involve the move- ment of fluids through highly confined spaces. The established and most popular approach to modeling gas transport in narrow pores is that of Knudsen [1], dating back to the first decade of the 20th century, and neglects the effects of dispersive fluid–solid interac- tions on the diffusion. While this simplification is justified for the relatively large tubes of 33–145 μm used by Knudsen in his original experimental verification [1], its applicability to nanoscale pores where the density profile is highly nonuniform has been questioned [2,14–16]. However, due to its simplicity and ease of use, the Knudsen model and its analogs have been routinely applied to gas transport in narrow pore materials [17–20]. In actual practice, the intermolecular interaction is non-negli- gible, and must be considered when the mean free path in the pressure range of interest (generally in the region of a few hundred kilopascals) is not much larger than the pore size. In the case of macropores the effect of intermolecular interactions may be included by means of an additive viscous contribution [21– 23]. The most popular method based on this principle is the Dusty Gas Model (DGM) of Mason and coworkers, which arbitrarily divides the total flux vector into a wall-affected diffusive and a hydrodynamic non-segregative contribution [24]. When adsorp- tion is negligible, the pore wall-affected diffusion is often repre- sented by the Knudsen model, which is supplemented by a surface diffusion contribution when adsorption is significant in mesopores [25]. Consequently, the intrinsic characteristics of the Knudsen model are inherited in this approach, and the confirmation of the diffusion model still largely relies on the correlation of diffusion Contents lists available at ScienceDirect journal homepage: www.elsevier.com/locate/memsci Journal of Membrane Science http://dx.doi.org/10.1016/j.memsci.2014.02.028 0376-7388 & 2014 Elsevier B.V. All rights reserved. n Corresponding author. E-mail address: [email protected](S.K. Bhatia). Journal of Membrane Science 460 (2014) 46–61
Transcript
Adsorption and transport of gases in a supported microporoussilica membrane
Xuechao Gao, João C. Diniz da Costa, Suresh K. Bhatia n
School of Chemical Engineering, The University of Queensland, Brisbane, Qld. 4072, Australia
a r t i c l e i n f o
Article history:Received 10 December 2013Received in revised form16 February 2014Accepted 19 February 2014Available online 26 February 2014
Keywords:Supported microporous membraneEffective medium theoryOscillator modelTransition-state theorysilica micropores
a b s t r a c t
We investigate gas adsorption and transport in a disordered microporous silica membrane having meanpore diameter 1.5 nm, coated on a porous tubular asymmetric support. The adsorption isotherms arefound to be Langmuirian, with equilibrium constants that are accurately predicted for nonpolar gases,considering Lennard–Jones (LJ) interactions with a single layer of oxygen atoms on the pore surface. Forthe polar gas, CO2, the hydroxyls groups on the pore walls strongly increase the affinity with the porewalls, and a superposition of the LJ potential and an empirically represented electrostatic interaction isfound to be adequate in correlating the Langmuirian equilibrium constant. The gas transport in themicroporous silica layer is investigated using effective medium theory, with single pore transportrepresented by combination of pore mouth and internal pore diffusion resistances. Good agreement isobserved for all the gases using different coordination numbers, indicating that the essential features ofthe transport in the silica micropores are captured in the approach. It is found that the overall transportresistance is dominated by the pore mouth barrier; however, the internal diffusion resistance in therelatively smaller pores is significant, especially for weakly adsorbed gases at higher temperature. Inaddition, the dependence of the pore mouth barrier coefficient on temperature and diffusing species arein good agreement with predictions of transition-state theory, with larger more strongly adsorbedmolecules having higher activation energy. The proposed methodology is validated against experimentby comparison of the predicted flux for different gases in the supported membrane at various feedpressures in the low pressure range of 200–400 kPa, using the parameters obtained at 200 kPa.
& 2014 Elsevier B.V. All rights reserved.
1. Introduction
The modeling of fluid transport in narrow pores and confinedspaces has attracted considerable interest among scientists andengineers for over a century [1–3], due to its importance to avariety of conventional applications in adsorptive gas separationas well as in heterogeneous catalysis and electrochemical process.Interest in the subject has considerably increased in the last twodecades, as a consequence of the development of a vast array ofnovel disordered and ordered nanoporous materials [4–9], havingpotential for use in these as well as in emerging applications suchas in gas storage [10], molecular sieve membranes [11], drugdelivery [12] and biosensors [13], all of which involve the move-ment of fluids through highly confined spaces. The established andmost popular approach to modeling gas transport in narrow poresis that of Knudsen [1], dating back to the first decade of the 20thcentury, and neglects the effects of dispersive fluid–solid interac-tions on the diffusion. While this simplification is justified for the
relatively large tubes of 33–145 μm used by Knudsen in hisoriginal experimental verification [1], its applicability to nanoscalepores where the density profile is highly nonuniform has beenquestioned [2,14–16]. However, due to its simplicity and ease ofuse, the Knudsen model and its analogs have been routinelyapplied to gas transport in narrow pore materials [17–20].
In actual practice, the intermolecular interaction is non-negli-gible, and must be considered when the mean free path in thepressure range of interest (generally in the region of a fewhundred kilopascals) is not much larger than the pore size. Inthe case of macropores the effect of intermolecular interactionsmay be included by means of an additive viscous contribution [21–23]. The most popular method based on this principle is the DustyGas Model (DGM) of Mason and coworkers, which arbitrarilydivides the total flux vector into a wall-affected diffusive and ahydrodynamic non-segregative contribution [24]. When adsorp-tion is negligible, the pore wall-affected diffusion is often repre-sented by the Knudsen model, which is supplemented by a surfacediffusion contribution when adsorption is significant in mesopores[25]. Consequently, the intrinsic characteristics of the Knudsenmodel are inherited in this approach, and the confirmation of thediffusion model still largely relies on the correlation of diffusion
Contents lists available at ScienceDirect
journal homepage: www.elsevier.com/locate/memsci
Journal of Membrane Science
http://dx.doi.org/10.1016/j.memsci.2014.02.0280376-7388 & 2014 Elsevier B.V. All rights reserved.
n Corresponding author.E-mail address: [email protected] (S.K. Bhatia).
p, where M is molecular weight, as predicted by the
Knudsen model [26]. Although it lacks a firm molecular basis, due toits simplicity the DGM approach is commonly employed to explorethe diffusion mechanism in newly-synthesized materials; this isgenerally done by empirically correlating experimental data using arepresentative pore size, while determining a structure-relatedparameter such as tortuosity [27]. Use of a single pore size is a keydeficiency of this method as the pore size distribution (PSD) hassignificant influence on the transport, especially for materials withseveral nanometers. Another weakness inherent to the Knudsenmodel is the disregard of the dispersive solid–fluid interaction arisingfrom the presence of the wall; the dispersive van der Waalsinteraction, for example via the Lennard–Jones (LJ) interaction model,dramatically decreases the diffusivity by reducing the travel timebetween successive collisions [15]. As a result of the dispersiveinteraction, the fluid density in the pore is non-uniform, andsignificantly differs from that in the bulk, and is strongly dependenton the pore radius and gas species as well as temperature [2,28].
Traditionally, the tortuosity factor is incorporated as an effec-tive parameter and assumed to be exclusively determined by theproperties of the porous medium. However, it has been theoreti-cally and experimentally shown that in nanoscale pores theapparent tortuosity is influenced by operating conditions such astemperature, pressure and gas species [14,15,21–29]. All errorsarising from the neglect of such dependence are therefore lumpedwithin the fitted tortuosity, masking errors related to the transportmodel itself [21]. Consequently, unambiguous confirmation of thevalidity of the Knudsen diffusion in nanosized pores, to which theKnudsen model is frequently employed, is not possible by simplecorrelation. Indeed, it has been extensively demonstrated thatwhile the DGM can empirically correlate experimental data,extremely high tortuosities are often obtained for mesoporousmaterials when the Knudsen model is utilized [17,30–32]. This ismainly due to the omission of adsorption effects and overpredic-tion of the diffusivity by the Knudsen equation, and to a lesserextent due to the disregard of the pore size distribution when asingle representative pore size is used [14,15–33].
For small pore sizes, approaching the micropore scale, it isfrequently assumed that the gas molecules adsorb on the porewalls, and migrate on the pore surface as an adsorbed species. Inthis spirit, models comprising surface diffusion and Knudsen flowin parallel have been formulated in order to provide strongertemperature dependence and yield an acceptable tortuosity[18,34]; however, such models often lead to tortuosities thatincrease greatly for weakly adsorbed gases [18]. Substantial workhas been devoted to develop rigorous theories based on molecularprinciples to account for the effect of dispersive solid–fluidinteraction on the transport [35–39], or otherwise indirectlyconsider the effect of interactions by using measured pure com-ponent diffusivities in mixture transport models [25]. However,most interpretations of experimental data largely rely on arbitrarymodification of the Knudsen equation by introducing anArrhenius-type factor to better capture the effect of temperaturein micropores [17,19–35]. The most widely used model followingthis approach, originally used for hydrocarbons and known as thegas translation (GT) theory, is that of Xiao and Wei [35]. Later, thetheory was extended to any adsorptive gases by Yoshioka et al.[19] by considering the effective diffusion length instead of theactual pore size. However, the original derivation of the GT theoryis semi-empirical, as the estimation of the activation energy basedon the difference of LJ potential energy between the pore channeland intersection lacks a firm molecular basis [39]. For instance, in asilica pore of 3 nm, the diffusivity of CH4 as modeled by the GTapproach falls in the Knudsen regime due to the low apparentactivation energy for such a small molecule [35], which is contra-dicted by molecular dynamics (MD) simulations [2,35–40].
Considerable success has been accomplished recently in thislaboratory, through the development of a statistical mechanicaltheory of transport in nanopores, aided by the finding from MDsimulations that the nonuniform equilibrium density profile of thefluid is essentially preserved during the transport [41]. The newmodel, termed as ‘Oscillator model’, considers the dispersive solid–fluid interaction, and the adsorption effect is represented throughthe canonical energy distribution in the pore [36], overcoming thelimitations of the Knudsen approach. In particular, as a result ofexplicit consideration of the fluid–solid interaction, the Oscillatormodel diffusion coefficient represents the overall transport coeffi-cient in the pore, overcoming the need to supplement the Knudsendiffusivity with an empirical surface diffusion coefficient, as hasbeen the common practice. Not only has the new theory beenextensively validated against MD simulations [36–39], but it hasalso been successfully used to interpret experimental data [14,16–29]. Indeed, comparison of the Knudsen and Oscillator modeldiffusivities with those from MD simulations for silica pores showsthat the Knudsen equation significantly overpredicts the diffusivityfor methane at 450 K by 30% even for a pore diameter of 10 nm,indicating the importance of considering the effect of van der Waalsforces on pore diffusion even when the molecule/channel size ratiois less than 5% [39]. However, in disordered materials narrow porenecks may affect the rate of entry of molecules in the pores,although this has little impact on the equilibrium constant, whichprincipally depends on the size of the pore body. This effect may beconsidered by means of transition-state theory (TST) [37,42–44],and the GT theory of Xiao and Wei [35] may be envisioned in thislight. While the pore mouth resistance may be expected to controlin materials with very narrow molecularly sized entries, in systemswith transitional pores the internal pore diffusion may also havesignificant resistance. Membrane transport models involving suchdual resistances have yet to be formulated, but may be derived bycombining the Oscillator model with a TST-based pore mouthresistance model to investigate the transport in such disorderedmicroporous materials.
Another significant impediment in the application of anydiffusion theory to microporous or mesoporous materials is thecomplexity of the pore network, including the pore connectivity,and the presence of a pore size distribution as well as surfaceroughness. This is particularly challenging for the investigation ofsupported membranes, in which the system comprises a thinselective top layer and a mesoporous interlayer coated on amacroporous substrate. Not only must the pore size distributionof each layer be considered, but also the aspect ratio and poreshape are of importance. Effective medium theory (EMT) providesthe necessary machinery for resolving such issues, and has beenused to derive fundamental insights into transport in disorderednanoporous materials [14,16,21–29]. In this method, a nonuniformpore network with a distribution of conductance is replaced by auniform one in which each conductance is assigned an effectivevalue. This allows explicit modeling of network-related effects,thereby permitting more direct verification of transport models.In our previous work [16] employing this technique we havedemonstrated that the transport in a mesoporous silica membranehaving pores of mean size 3.7 nm is not well represented by theKnudsen model due to overestimation of the diffusivity andneglect of adsorption effects, and that the Oscillator model, whichaccounts for these factors provides a more accurate result. Follow-ing the line of our previous work [16], here we further develop thisapproach to include also a pore mouth resistance, and investigatethe diffusion for a microporous supported silica membrane, havinga mean pore diameter of 1.5 nm, coated on an asymmetric aluminasupport, while also considering the pore size distribution for eachlayer. The results permit an understanding of the mechanism offluid transport in the microporous silica layer, and demonstrate
X. Gao et al. / Journal of Membrane Science 460 (2014) 46–61 47
the importance of considering both the dispersive interaction andpore mouth restriction effect in the silica micropores.
2. Materials characterization and experiments
2.1. Asymmetric support
As described in a recent publication from this laboratory [29],the asymmetric support was synthesized by dip-coating a dilutedγ-alumina solution (2 wt% from Sigma-Aldrich) on the outer sur-face of a tubular α-alumina substrate (Australia Chemtech Trading& Service Company), having an inner radius of 4.25 mm and anouter radius of 6.38 mm, and a length of 8.20 cm. Since the poresof the substrate and interlayer are mainly made of interstitialspaces between crystal particles by sintering at high temperature,the particle size has significant influence on the size of the pores.Therefore, before conducting any adsorption-based characteriza-tion, the pore network structure of the substrate and interlayerwas investigated by scanning electron microscopy (SEM), reveal-ing the mean particle sizes to be 3 μm and 50 nm, respectively,with an interlayer thickness of around 2 μm. A more accurate poresize distribution of the substrate was determined by mercuryporosimetry (Micromeritics, IV 9500), indicating a mean poreradius of 250 nm. The pore size distribution (PSD) of the interlayerwas assumed to be represented by that of the agglomeratedγ-alumina powder, which was analyzed by N2 adsorption at77 K, using a Micromeritics ASAP2020 volumetric analyzer. Theadsorption isothermwas interpreted by nonlinear density functiontheory (NLDFT) assuming cylindrical pore with an oxide surface,and the indicative pore radius was around 5.2 nm. The details ofcharacterization of the pore network for the substrate and theinterlayer can be found in our recent work [29].
2.2. Microporous silica preparation
The microporous silica membrane used in this work wasprepared by the sol–gel process, which comprises two steps:(1) preparation of the colloidal sol, and (2) sol-coating on thepre-synthesized asymmetric support and firing [45,46]. In the firststep, the silica colloidal-sol solution was prepared by co-polymerization of methyltriethoxysilane (TEOS) and tetraethy-lorthosilane (MTES) using a two-step acid–catalyst process.A mixture of 13.50 mL MTES, 29.0 mL TEOS, 39.20 mL EtOH, 3.90mL H2O and 0.06 mL diluted HCl (2.30 mol/L) was refluxed at333 K for 90 min with stirring at 200 rpm, then additional 4.54 mLwater and 4.80 mL HCl were added to the solution, resulting in thefinal molar ratio of 0.35:0.65:3.8:5.1:0.056. In the second step, theasymmetric support was dipped into the solution, using a dip-coating apparatus, at a rate of 10 cm/min. The support was immer-sed for 1 min, and subsequently oven-dried at 333 K for 2 h. Themembrane was then heated at 1 K/min to 673 K, and calcined atthis temperature for 30 min. To ensure full coverage of themembrane, ten layers were coated on the asymmetric support,and each layer was processed under the same conditions as thefirst layer. After completing the coating on the support, theremained sol was dried and ground using a mortar and pestle,then calcined under the same conditions as the membrane, andsubsequently characterized for its pore size distribution using N2
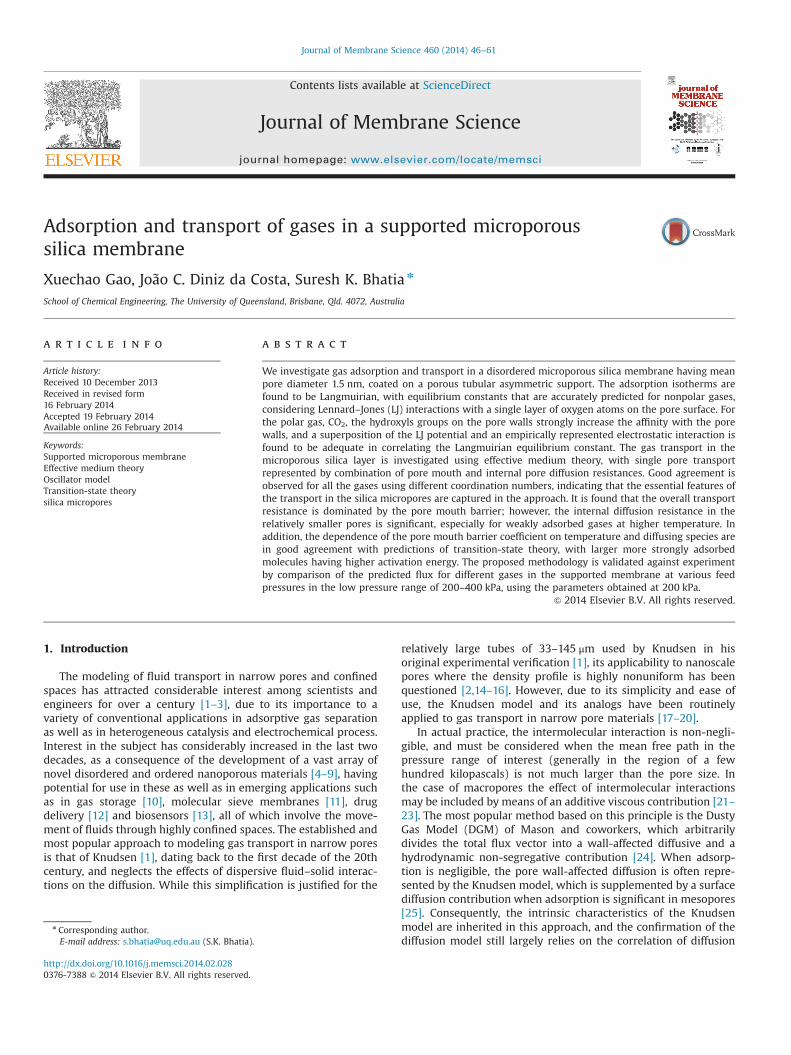
adsorption at 77 K, as above. This PSD was used to represent thepore network of the membrane layer. The calcination conditionwas designed based on the decomposition curve of the uncalcinedxerogels by thermogravimetric analysis (TGA), which indicatedthat the selected temperature was sufficient to remove the non-hydrolyzed groups. As seen in Fig. 1(a), at temperatures less than373 K the weight loss was mainly caused by the vaporization of
water; after 523 K, the nonhydrolyzed groups began to decomposeand condensation reactions continued to occur in the silica matrixuntil 1073 K. The complete disappearance of the nonhydrolyzedgroups in the membrane layer is further demonstrated by Fouriertransform infrared spectroscopy (FTIR) for the calcined and uncal-cined xerogels in Fig. 1(b), in which the characteristic band of CH3
and CH2 in TEOS and MTES (around 2900 cm�1) was completelyeliminated after calcination, indicating the absence of any organicresiduals in the silica sample [16].
2.3. Microporous silica characterization
2.3.1. Low temperature nitrogen adsorptionThe pore size distribution of the calcined silica powder was
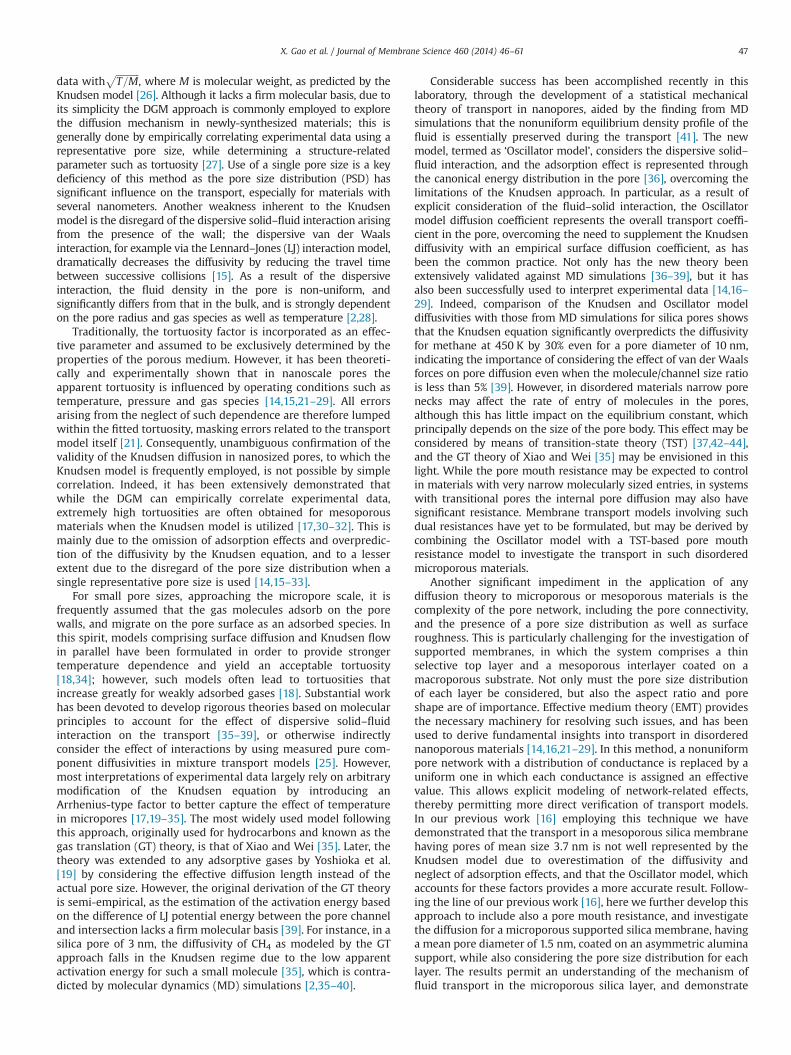
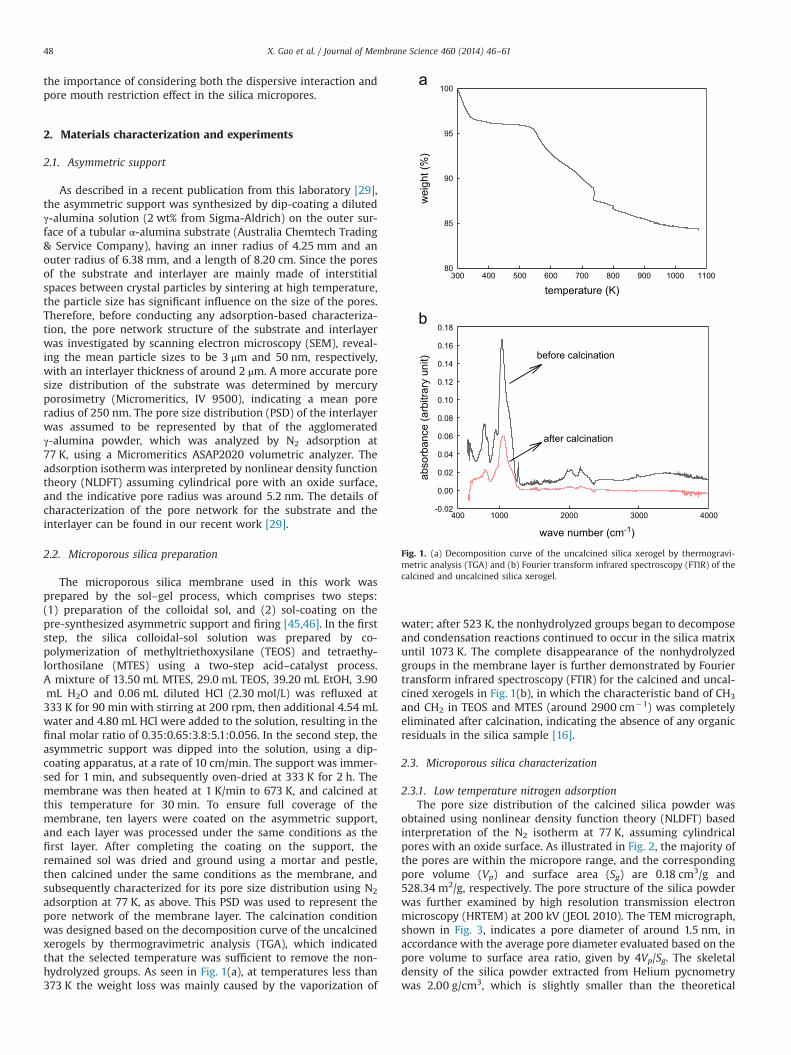
obtained using nonlinear density function theory (NLDFT) basedinterpretation of the N2 isotherm at 77 K, assuming cylindricalpores with an oxide surface. As illustrated in Fig. 2, the majority ofthe pores are within the micropore range, and the correspondingpore volume (Vp) and surface area (Sg) are 0.18 cm3/g and528.34 m2/g, respectively. The pore structure of the silica powderwas further examined by high resolution transmission electronmicroscopy (HRTEM) at 200 kV (JEOL 2010). The TEM micrograph,shown in Fig. 3, indicates a pore diameter of around 1.5 nm, inaccordance with the average pore diameter evaluated based on thepore volume to surface area ratio, given by 4Vp/Sg. The skeletaldensity of the silica powder extracted from Helium pycnometrywas 2.00 g/cm3, which is slightly smaller than the theoretical
temperature (K)
wei
ght (
%)
80
85
90
95
100
before calcination
300 400 500 600 700 800 900 1000 1100
1000 2000 3000 4000-0.02
0.00
0.02
0.04
0.06
0.08
0.10
0.12
0.14
0.16
0.18
abso
rban
ce (a
rbitr
ary
unit)
wave number (cm-1)
after calcination
400
Fig. 1. (a) Decomposition curve of the uncalcined silica xerogel by thermogravi-metric analysis (TGA) and (b) Fourier transform infrared spectroscopy (FTIR) of thecalcined and uncalcined silica xerogel.
X. Gao et al. / Journal of Membrane Science 460 (2014) 46–6148
density of around 2.30 g/cm3 [47], suggesting the presence ofpores inaccessible to He inside the amorphous silica. The acces-sible porosity of the powder can be determined by
ε¼ Vpρ
1þVpρð1Þ
in which ρ is the true density from Helium pycnometry. FollowingEq. (1), the accessible porosity of the microporous silica isestimated to be 0.26.
2.3.2. ThermogravimetryCharacterization of hydroxyl groups on the pore surface was
performed on the calcined silica powder by thermogravimetry,following the method of Markovic et al. [17]. The surface density ofthe hydroxyl groups can be estimated by
NOH ¼ 2000wm
3Sgð2Þ
in which wm is the percentage weight loss and NOH is theconcentration of hydroxyl groups in nm�2. By excluding thephysically adsorbed water on the silica surface, the measuredweight loss of the sample during temperature increase (473–1273 K) is 5.9%, which yields a surface density of the hydroxylgroups of approximately 7.5 nm�2. This value is significantly largerthan the density of hydroxyl groups in the silica glass membranesynthesized by Markovic [18], for which a low value of 3.8 nm�2
was obtained. More polar hydroxyl groups on the surface increasethe adsorption affinity for polar gases due to the additional dipolarinteractions besides the dispersive force [17].
2.3.3. Scanning electron microscopyKnowledge of the dimension of each layer is crucial to model-
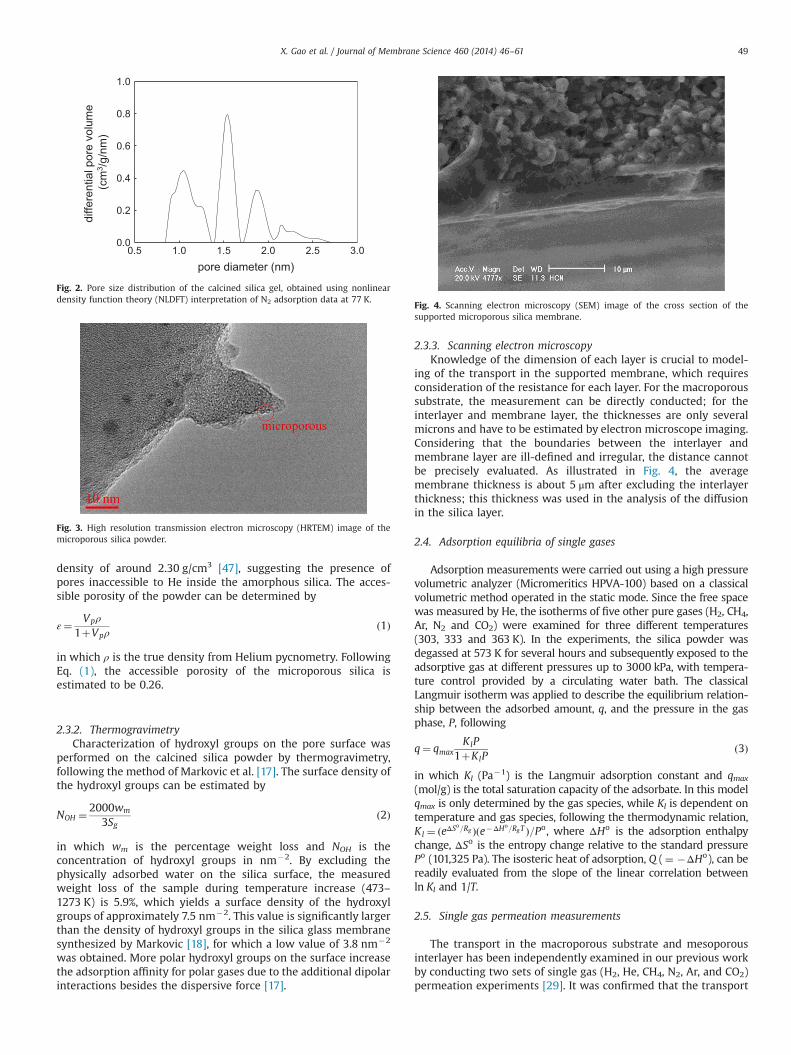
ing of the transport in the supported membrane, which requiresconsideration of the resistance for each layer. For the macroporoussubstrate, the measurement can be directly conducted; for theinterlayer and membrane layer, the thicknesses are only severalmicrons and have to be estimated by electron microscope imaging.Considering that the boundaries between the interlayer andmembrane layer are ill-defined and irregular, the distance cannotbe precisely evaluated. As illustrated in Fig. 4, the averagemembrane thickness is about 5 μm after excluding the interlayerthickness; this thickness was used in the analysis of the diffusionin the silica layer.
2.4. Adsorption equilibria of single gases
Adsorption measurements were carried out using a high pressurevolumetric analyzer (Micromeritics HPVA-100) based on a classicalvolumetric method operated in the static mode. Since the free spacewas measured by He, the isotherms of five other pure gases (H2, CH4,Ar, N2 and CO2) were examined for three different temperatures(303, 333 and 363 K). In the experiments, the silica powder wasdegassed at 573 K for several hours and subsequently exposed to theadsorptive gas at different pressures up to 3000 kPa, with tempera-ture control provided by a circulating water bath. The classicalLangmuir isotherm was applied to describe the equilibrium relation-ship between the adsorbed amount, q, and the pressure in the gasphase, P, following
q¼ qmaxKlP
1þKlPð3Þ
in which Kl (Pa�1) is the Langmuir adsorption constant and qmax
(mol/g) is the total saturation capacity of the adsorbate. In this modelqmax is only determined by the gas species, while Kl is dependent ontemperature and gas species, following the thermodynamic relation,Kl ¼ ðeΔSo=Rg Þðe�ΔHo=RgT Þ=Po, where ΔHo is the adsorption enthalpychange, ΔSo is the entropy change relative to the standard pressurePo (101,325 Pa). The isosteric heat of adsorption, Q (¼ �ΔHo), can bereadily evaluated from the slope of the linear correlation betweenln Kl and 1/T.
2.5. Single gas permeation measurements
The transport in the macroporous substrate and mesoporousinterlayer has been independently examined in our previous workby conducting two sets of single gas (H2, He, CH4, N2, Ar, and CO2)permeation experiments [29]. It was confirmed that the transport
0.5 1.0 1.5 2.0 2.5 3.00.0
0.2
0.4
0.6
0.8
1.0di
ffere
ntia
l por
e vo
lum
e (c
m3 /g
/nm
)
pore diameter (nm)
Fig. 2. Pore size distribution of the calcined silica gel, obtained using nonlineardensity function theory (NLDFT) interpretation of N2 adsorption data at 77 K.
Fig. 3. High resolution transmission electron microscopy (HRTEM) image of themicroporous silica powder.
Fig. 4. Scanning electron microscopy (SEM) image of the cross section of thesupported microporous silica membrane.
X. Gao et al. / Journal of Membrane Science 460 (2014) 46–61 49
in the macroporous substrate at low pressure can be adequatelyrepresented by a combination of Knudsen diffusion and viscousflow. The corresponding transport for the interlayer can beadequately modeled by any of three different diffusion models;these are the classical Knudsen model, a modified Knudsen modelcorrected for finite molecular size, and the Oscillator model. Toexplore the diffusion mechanism in the microporous silica layer,single gas permeation experiments were carried out at temperaturesbetween 303 K and 573 K for several feed pressures (198, 298 and398 kPa). Details of the experimental setup and procedure can befound in our previous work [16].
In the analysis to follow, to distinguish the driving force for eachlayer, the outlet pressure (equal to the atmosphere pressure) is labeledas Po, and the feed pressure is represented by PF. Further, the interfacialpressure between the interlayer and substrate is given as P1, while theinterfacial pressure between the interlayer and membrane layer isrepresented by P2. To distinguish the flow rates and structuralparameters for the substrate, interlayer and membrane layers, thesubscripts s, c and m are used for these layers, respectively.
3. Transport models
3.1. Transport in a single pore
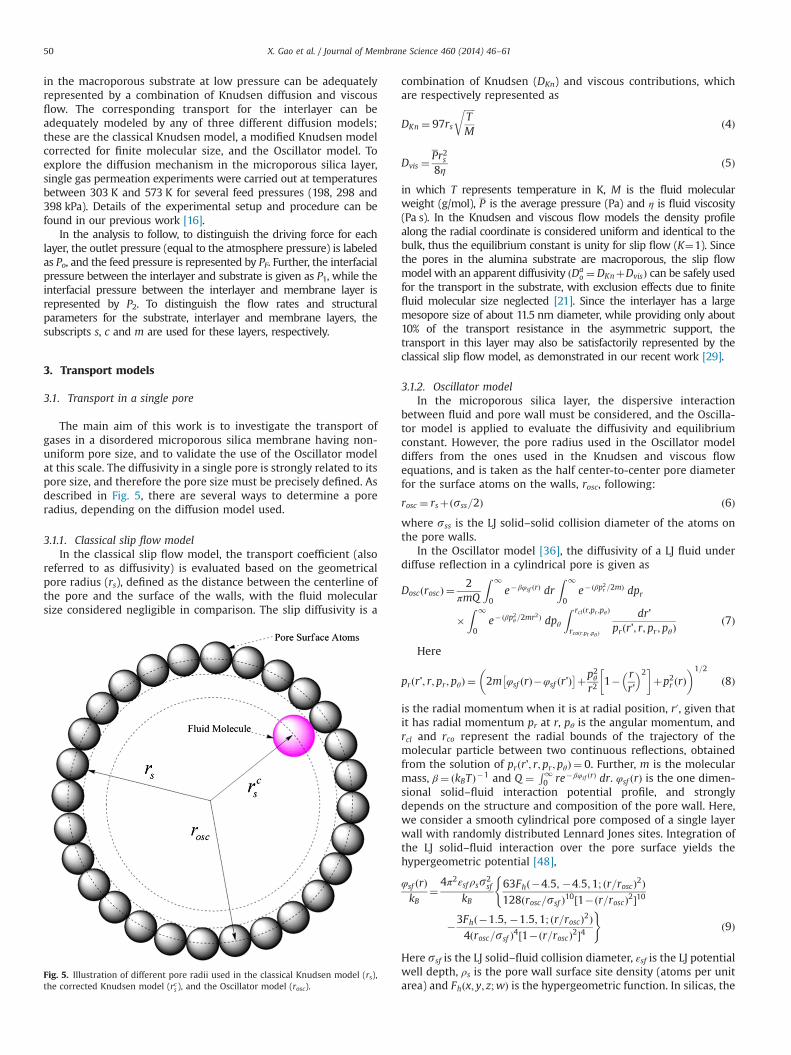
The main aim of this work is to investigate the transport ofgases in a disordered microporous silica membrane having non-uniform pore size, and to validate the use of the Oscillator modelat this scale. The diffusivity in a single pore is strongly related to itspore size, and therefore the pore size must be precisely defined. Asdescribed in Fig. 5, there are several ways to determine a poreradius, depending on the diffusion model used.
3.1.1. Classical slip flow modelIn the classical slip flow model, the transport coefficient (also
referred to as diffusivity) is evaluated based on the geometricalpore radius (rs), defined as the distance between the centerline ofthe pore and the surface of the walls, with the fluid molecularsize considered negligible in comparison. The slip diffusivity is a
combination of Knudsen (DKn) and viscous contributions, whichare respectively represented as
DKn ¼ 97rs
ffiffiffiffiffiTM
rð4Þ
Dvis ¼Pr2s8η
ð5Þ
in which T represents temperature in K, M is the fluid molecularweight (g/mol), P is the average pressure (Pa) and η is fluid viscosity(Pa s). In the Knudsen and viscous flow models the density profilealong the radial coordinate is considered uniform and identical to thebulk, thus the equilibrium constant is unity for slip flow (K¼1). Sincethe pores in the alumina substrate are macroporous, the slip flowmodel with an apparent diffusivity ðDa
o ¼DKnþDvisÞ can be safely usedfor the transport in the substrate, with exclusion effects due to finitefluid molecular size neglected [21]. Since the interlayer has a largemesopore size of about 11.5 nm diameter, while providing only about10% of the transport resistance in the asymmetric support, thetransport in this layer may also be satisfactorily represented by theclassical slip flow model, as demonstrated in our recent work [29].
3.1.2. Oscillator modelIn the microporous silica layer, the dispersive interaction
between fluid and pore wall must be considered, and the Oscilla-tor model is applied to evaluate the diffusivity and equilibriumconstant. However, the pore radius used in the Oscillator modeldiffers from the ones used in the Knudsen and viscous flowequations, and is taken as the half center-to-center pore diameterfor the surface atoms on the walls, rosc, following:
rosc ¼ rsþðsss=2Þ ð6Þwhere sss is the LJ solid–solid collision diameter of the atoms onthe pore walls.
In the Oscillator model [36], the diffusivity of a LJ fluid underdiffuse reflection in a cylindrical pore is given as
DoscðroscÞ ¼2
πmQ
Z 1
0e�βφsf ðrÞ dr
Z 1
0e�ðβp2r =2mÞ dpr
�Z 1
0e�ðβp2θ =2mr2Þ dpθ
Z rclðr;pr ;pθÞ
rcoðr;pr ;pθ Þ
dr'prðr'; r; pr ; pθÞ
ð7Þ
Here
prðr'; r; pr ; pθÞ ¼ 2m φsf ðrÞ�φsf ðr'Þ� �þp2θ
r21� r
r'
� �2� �
þp2r ðrÞ 1=2
ð8Þ
is the radial momentum when it is at radial position, r0, given thatit has radial momentum pr at r, pθ is the angular momentum, andrcl and rco represent the radial bounds of the trajectory of themolecular particle between two continuous reflections, obtainedfrom the solution of prðr'; r; pr ;pθÞ ¼ 0. Further, m is the molecularmass, β¼ ðkBTÞ�1 and Q ¼ R1
0 re�βφsf ðrÞ dr. φsf ðrÞ is the one dimen-sional solid–fluid interaction potential profile, and stronglydepends on the structure and composition of the pore wall. Here,we consider a smooth cylindrical pore composed of a single layerwall with randomly distributed Lennard Jones sites. Integration ofthe LJ solid–fluid interaction over the pore surface yields thehypergeometric potential [48],
Here ssf is the LJ solid–fluid collision diameter, εsf is the LJ potentialwell depth, ρs is the pore wall surface site density (atoms per unitarea) and Fhðx; y; z;wÞ is the hypergeometric function. In silicas, the
Fig. 5. Illustration of different pore radii used in the classical Knudsen model (rs),the corrected Knudsen model (rcs ), and the Oscillator model (rosc).
X. Gao et al. / Journal of Membrane Science 460 (2014) 46–6150
interaction between the fluid and pore walls is often considered tobe dominated by a surface layer of oxygen ions, and the LJparameters for the solid are evaluated based on the results fromNeimark et al. [49] as εss/kB¼492.7 K, sss¼0.28 nm, with ρs¼10.47 nm�2. The Lorentz–Berthelot mixing rules are applied toestimate the solid–fluid LJ parameters εsf/kB and ssf, using the LJparameters of the gases listed in Table 1.
The low density equilibrium constant (K) for a given poreradius is readily obtained from
KðroscÞ ¼2r2osc
Z rosc
0e�φsf ðrÞ=kBT r dr ð10Þ
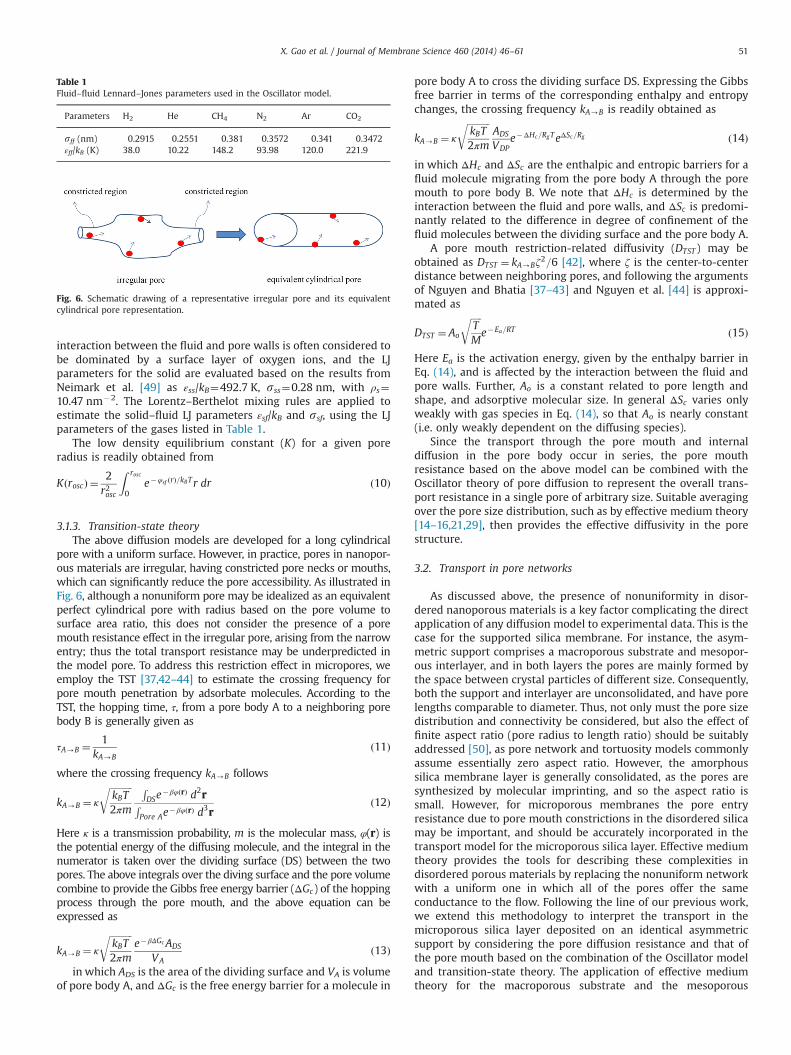
3.1.3. Transition-state theoryThe above diffusion models are developed for a long cylindrical
pore with a uniform surface. However, in practice, pores in nanopor-ous materials are irregular, having constricted pore necks or mouths,which can significantly reduce the pore accessibility. As illustrated inFig. 6, although a nonuniform pore may be idealized as an equivalentperfect cylindrical pore with radius based on the pore volume tosurface area ratio, this does not consider the presence of a poremouth resistance effect in the irregular pore, arising from the narrowentry; thus the total transport resistance may be underpredicted inthe model pore. To address this restriction effect in micropores, weemploy the TST [37,42–44] to estimate the crossing frequency forpore mouth penetration by adsorbate molecules. According to theTST, the hopping time, τ, from a pore body A to a neighboring porebody B is generally given as
τA-B ¼1
kA-Bð11Þ
where the crossing frequency kA-B follows
kA-B ¼ κ
ffiffiffiffiffiffiffiffiffiffikBT2πm
r RDSe
�βφðrÞ d2rRPore Ae
�βφðrÞ d3rð12Þ
Here κ is a transmission probability, m is the molecular mass, φ(r) isthe potential energy of the diffusing molecule, and the integral in thenumerator is taken over the dividing surface (DS) between the twopores. The above integrals over the diving surface and the pore volumecombine to provide the Gibbs free energy barrier (ΔGc) of the hoppingprocess through the pore mouth, and the above equation can beexpressed as
kA-B ¼ κ
ffiffiffiffiffiffiffiffiffiffikBT2πm
re�βΔGcADS
VAð13Þ
in which ADS is the area of the dividing surface and VA is volumeof pore body A, and ΔGc is the free energy barrier for a molecule in
pore body A to cross the dividing surface DS. Expressing the Gibbsfree barrier in terms of the corresponding enthalpy and entropychanges, the crossing frequency kA-B is readily obtained as
kA-B ¼ κ
ffiffiffiffiffiffiffiffiffiffikBT2πm
rADS
VDPe�ΔHc=RgTeΔSc=Rg ð14Þ
in which ΔHc and ΔSc are the enthalpic and entropic barriers for afluid molecule migrating from the pore body A through the poremouth to pore body B. We note that ΔHc is determined by theinteraction between the fluid and pore walls, and ΔSc is predomi-nantly related to the difference in degree of confinement of thefluid molecules between the dividing surface and the pore body A.
A pore mouth restriction-related diffusivity (DTST ) may beobtained as DTST ¼ kA-Bζ
2=6 [42], where ζ is the center-to-centerdistance between neighboring pores, and following the argumentsof Nguyen and Bhatia [37–43] and Nguyen et al. [44] is approxi-mated as
DTST ¼ Ao
ffiffiffiffiffiTM
re�Ea=RT ð15Þ
Here Ea is the activation energy, given by the enthalpy barrier inEq. (14), and is affected by the interaction between the fluid andpore walls. Further, Ao is a constant related to pore length andshape, and adsorptive molecular size. In general ΔSc varies onlyweakly with gas species in Eq. (14), so that Ao is nearly constant(i.e. only weakly dependent on the diffusing species).
Since the transport through the pore mouth and internaldiffusion in the pore body occur in series, the pore mouthresistance based on the above model can be combined with theOscillator theory of pore diffusion to represent the overall trans-port resistance in a single pore of arbitrary size. Suitable averagingover the pore size distribution, such as by effective medium theory[14–16,21,29], then provides the effective diffusivity in the porestructure.
3.2. Transport in pore networks
As discussed above, the presence of nonuniformity in disor-dered nanoporous materials is a key factor complicating the directapplication of any diffusion model to experimental data. This is thecase for the supported silica membrane. For instance, the asym-metric support comprises a macroporous substrate and mesopor-ous interlayer, and in both layers the pores are mainly formed bythe space between crystal particles of different size. Consequently,both the support and interlayer are unconsolidated, and have porelengths comparable to diameter. Thus, not only must the pore sizedistribution and connectivity be considered, but also the effect offinite aspect ratio (pore radius to length ratio) should be suitablyaddressed [50], as pore network and tortuosity models commonlyassume essentially zero aspect ratio. However, the amorphoussilica membrane layer is generally consolidated, as the pores aresynthesized by molecular imprinting, and so the aspect ratio issmall. However, for microporous membranes the pore entryresistance due to pore mouth constrictions in the disordered silicamay be important, and should be accurately incorporated in thetransport model for the microporous silica layer. Effective mediumtheory provides the tools for describing these complexities indisordered porous materials by replacing the nonuniform networkwith a uniform one in which all of the pores offer the sameconductance to the flow. Following the line of our previous work,we extend this methodology to interpret the transport in themicroporous silica layer deposited on an identical asymmetricsupport by considering the pore diffusion resistance and that ofthe pore mouth based on the combination of the Oscillator modeland transition-state theory. The application of effective mediumtheory for the macroporous substrate and the mesoporous
Table 1Fluid–fluid Lennard–Jones parameters used in the Oscillator model.
Fig. 6. Schematic drawing of a representative irregular pore and its equivalentcylindrical pore representation.
X. Gao et al. / Journal of Membrane Science 460 (2014) 46–61 51
interlayer, while using the classical slip flow model in each layer,has been demonstrated elsewhere [16], so only the derivation ofEMT for the microporous silica layer is given in the current work.
For a cylindrical pore of radius rp, the conductance, λ can beexpressed in terms of the pore mouth and Oscillator modeltransport coefficients, following the series resistance model
1λ¼ lπr2pKoscðrpÞ
1DoscðrpÞ
þ 1DTST
ð16Þ
It is assumed that local equilibrium prevails at the nanoscale sothat the pseudo-pressure drop in the pores is independent of thesize of the pores. The effective medium conductance, λe, isestimated by the solution to [51]
ðλ�λeÞðλþðN=2�1ÞλeÞ
� �¼ 0 ð17Þ
where N is the coordination number or pore connectivity, i.e., theaverage number of pores meeting at each node, and Uh i representsa number average over the pores. For the effective medium, the
pore flux is obtained as
jðrpÞ ¼λel
πr2pRgT�dPdz
ð18Þ
Considering that the pseudo-bulk pressure is uniform in the poresof the membrane, and the silica material is consolidated, the netflux in the equivalent uniform network is obtained by integrationof Eq. (18) over the pore volume distribution, to yield [16,52,53]
Jm ¼ εmλe⟨lm2⟩
3π⟨r2plm⟩RgTNm�1Nmþ1
�dPdz
ð19Þ
At steady state, the flow rate (F) in the tubular supportedmembrane is constant, and integration of Eq. (19) over the radialcoordinate of the silica membrane layer provides [16]
Fm ¼ 2εmRoλeL⟨lm2⟩
3zm⟨r2plm⟩RgTNm�1Nmþ1
ð�ΔPÞ ð20Þ
where Ro is the outer radius of the tube (Ro¼6.38 mm), and zm isthe membrane thickness and L is the tube length (L¼8.20 cm). It isto be noted that the predicted flow rate in the silica layer is
presssure (kPa)
0 500 1000 1500 2000 2500 3000
adso
rbed
am
ount
(mm
ol/g
)
0.00
0.05
0.10
0.15
0.20
0.25
0.30
303 K 333 K 363 K model
H2
pressure (kPa)0 500 1000 1500 2000 2500 3000
adso
rbed
am
ount
(mm
ol/g
)
0.0
0.2
0.4
0.6
0.8
1.0
1.2
1.4
1.6
1.8
303 K 333 K363 Kmodel
CH4
pressure (kPa)
0 500 1000 1500 2000 2500 3000
adso
rbed
am
ount
(mm
ol/g
)
0.0
0.2
0.4
0.6
0.8
303 K333 K363 Kmodel
N2Ar
pressure (kPa)0 500 1000 1500 2000 2500 3000
adso
rbed
am
ount
(mm
ol/g
)
0.0
0.2
0.4
0.6
0.8
1.0
1.2
303 K333 K363 Kmodel
pressure (kPa)0 500 1000 1500 2000 2500 3000
adso
rbed
am
ount
(mm
ol/g
)
0
1
2
3
4
303 K333 K363 Kmodel
CO2
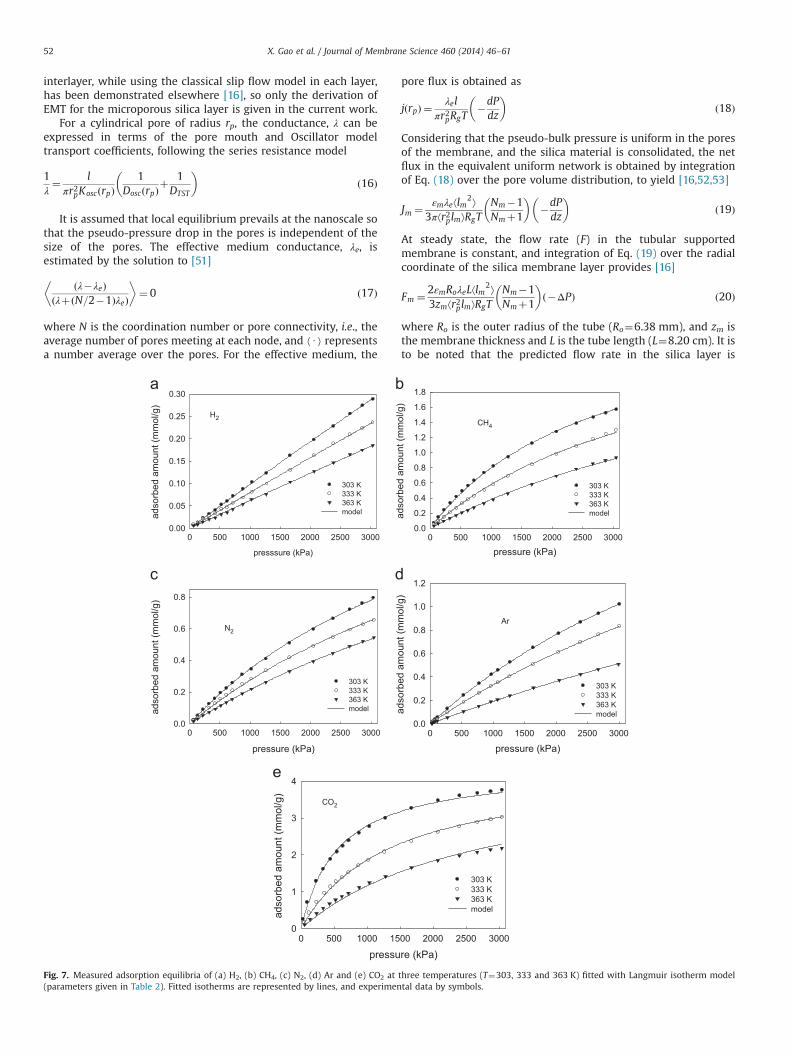
Fig. 7. Measured adsorption equilibria of (a) H2, (b) CH4, (c) N2, (d) Ar and (e) CO2 at three temperatures (T¼303, 333 and 363 K) fitted with Langmuir isotherm model(parameters given in Table 2). Fitted isotherms are represented by lines, and experimental data by symbols.
X. Gao et al. / Journal of Membrane Science 460 (2014) 46–6152
independent of l, as the effective conductance, λe, is inverselyproportional to l, so that the l factor cancels out in Eq. (20). Thederivation of the EMT expressions for the flow rate for thesubstrate (Fs) and the interlayer (Fc) can be found elsewhere [29].
The estimation of the theoretical flow rate requires solving theflow rate relationships for the three layers
FsðPF ; P1;Ns; lsÞ ¼ FcðP1; P2;Nc; lcÞ ¼ FmðP2; Po;Nm; Ea; lmÞ ð21Þto determine the interfacial pressures, P1 and P2. For the asym-metric support used here the structural parameters of the uncon-solidated structure of the support (Ns, ls) and interlayer (Nc, lc) havebeen determined in our prior study [29], and have the valuesNs¼Nc¼12, ls¼300 nm, lc¼5 nm. These values have been used inthe present work in conjunction with effective medium theory todetermine the pore structure and activation energy in the micro-porous silica layer.
4. Results and discussion
4.1. Adsorption isotherms
Fig. 7(a–e) depicts the experimental isotherms (symbols) andthe Langmuir model fittings (solid lines) for various adsorptivegases (H2, CH4, N2, Ar and CO2) in the microporous silica powder attemperatures of 303, 333 and 363 K, with the adsorption capacityqmax assumed constant for each gas at the different temperatures.It is evident that CO2 is the most strongly adsorbed molecule,followed by CH4, while N2 and Ar have comparatively weakeradsorption, and H2 is the least-adsorbed gas. For H2 the isothermsare nearly linear and show very small amount of adsorption in thegiven condition. It is also seen that the Langmuir model (solidlines) provides good agreement with the experimental data for allthe gases, over the pressure range below 3000 kPa, suggesting thatfluid–solid interaction dominates under these conditions. Thefitted Langmuir parameters, obtained using Eq. (3) with a non-linear fitting method, are listed in Table 2. We note that theobtained Langmuir parameters in Eq. (3) are only the ‘apparent’values (qmax and Kl) for the silica material due to the nonunifor-mity of the pore structure. Since Kl is related to the adsorptionaffinity, it is meaningful to compare the values between the gases.It is evident that Kl tends to be lower at higher temperature for allthe gases as is to be expected, and follows the patternCO24CH44N24Ar4H2, which is consistent with the orderingof the adsorption affinities based on the isotherms discussedabove. Further, the adsorption isosteric heat (Q), based on thelinear fitting of the correlation between ln(Kl) and 1/T, is alsogiven in Table 2, and will be subsequently compared with theactivation energy for the silica membrane layer obtained byeffective medium theory in the next.
The equilibrium constant in Eq. (10) represents the ratiobetween the pore density and the bulk gas density at low densityin a pore of radius rosc. Averaging over the pore volume yields theeffective low density equilibrium constant of the silica micropores
K ¼ 1R10 f vðrpÞ drp
Z 1
0KoscðrpÞf vðrpÞ drp ð22Þ
which is related to the Langmuir constant Kl in Eq. (3) by
K ¼ KlRgTqmax
Vpð23Þ
Here fv(rp) is the pore volume distribution of the micropores, towhich the pore volume Vp is related by Vp ¼
R10 f vðrpÞ drp.
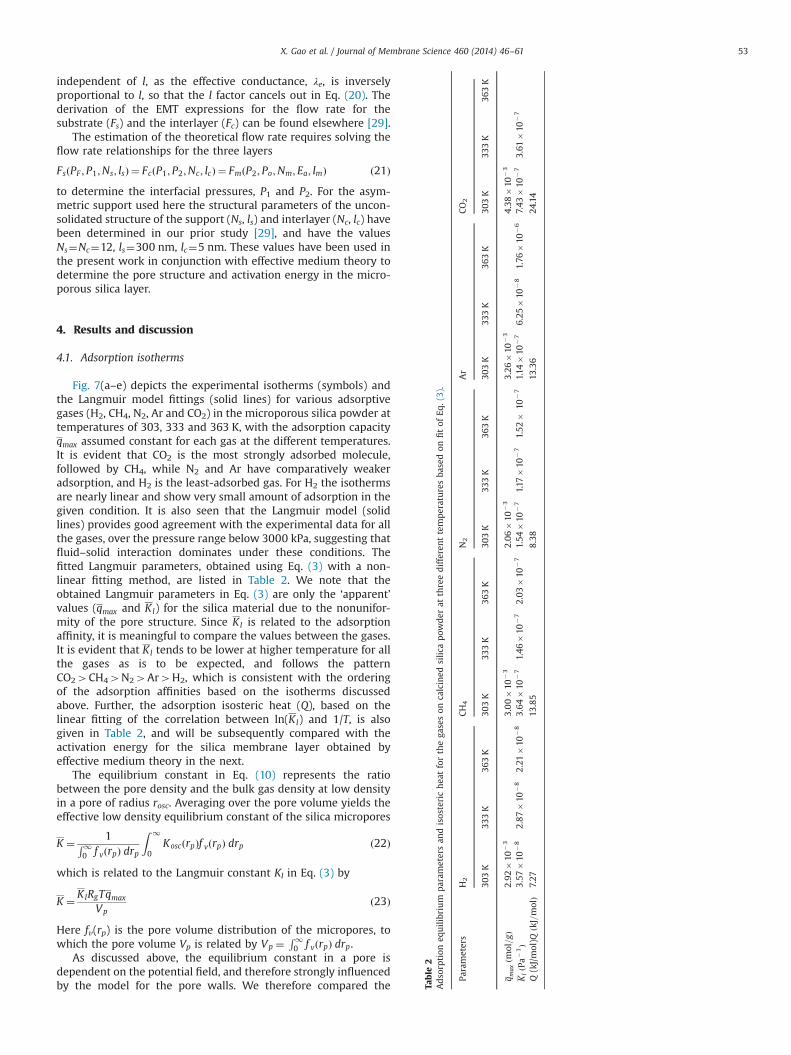
As discussed above, the equilibrium constant in a pore isdependent on the potential field, and therefore strongly influencedby the model for the pore walls. We therefore compared the Ta
ble
2Adsorption
equilibrium
param
etersan
disosterichea
tforthega
seson
calcined
silic
apow
der
atthreedifferenttemperaturesba
sedon
fitof
Eq.(3).
Parameters
H2
CH4
N2
Ar
CO2
303K
333K
363K
303K
333K
363K
303K
333K
363K
303K
333K
363K
303K
333K
363K
q max
ðmol=gÞ
2.92
�10
�3
3.00�10
�3
2.06
�10
�3
3.26
�10
�3
4.38
�10
�3
KlðPa�1Þ
3.57
�10
�8
2.87
�10
�8
2.21
�10
�8
3.64
�10
�7
1.46
�10
�7
2.03
�10
�7
1.54
�10
�7
1.17
�10
�7
1.52
�10
�7
1.14
�10
�7
6.25
�10
�8
1.76
�10
�6
7.43
�10
�7
3.61
�10
�7
Q(kJ/mol)Q
ðkJ=molÞ
7.27
13.85
8.38
13.36
24.14
X. Gao et al. / Journal of Membrane Science 460 (2014) 46–61 53
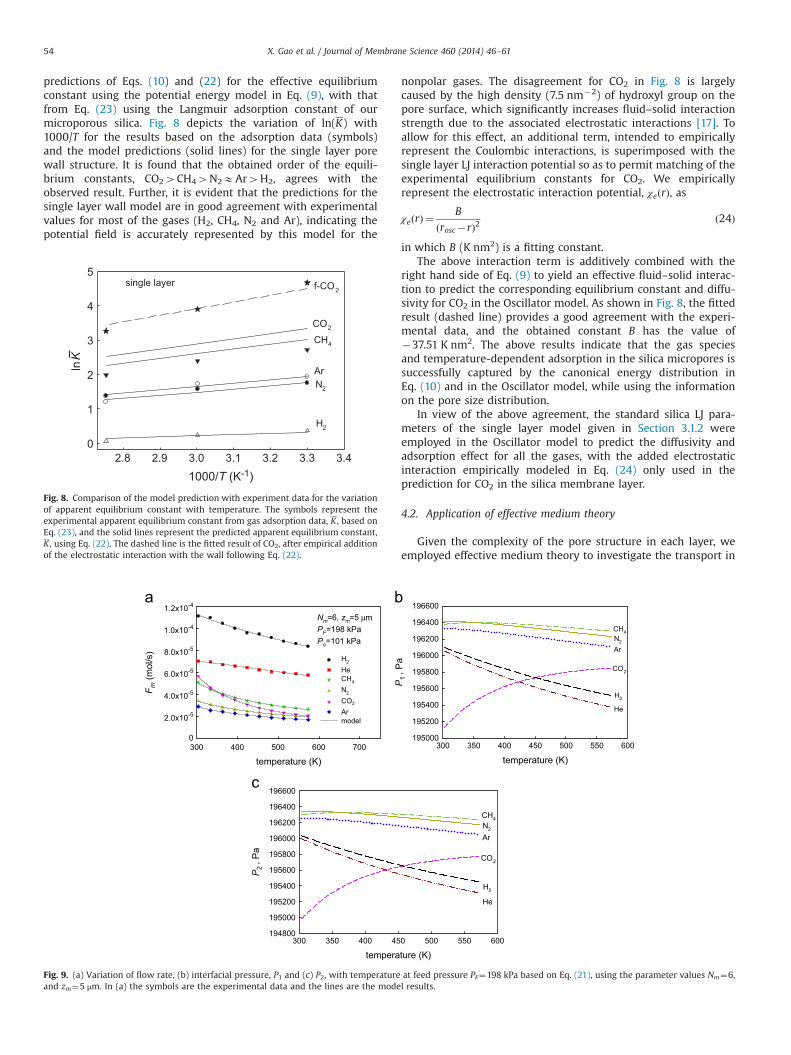
predictions of Eqs. (10) and (22) for the effective equilibriumconstant using the potential energy model in Eq. (9), with thatfrom Eq. (23) using the Langmuir adsorption constant of ourmicroporous silica. Fig. 8 depicts the variation of ln(K) with1000/T for the results based on the adsorption data (symbols)and the model predictions (solid lines) for the single layer porewall structure. It is found that the obtained order of the equili-brium constants, CO24CH44N2EAr4H2, agrees with theobserved result. Further, it is evident that the predictions for thesingle layer wall model are in good agreement with experimentalvalues for most of the gases (H2, CH4, N2 and Ar), indicating thepotential field is accurately represented by this model for the
nonpolar gases. The disagreement for CO2 in Fig. 8 is largelycaused by the high density (7.5 nm�2) of hydroxyl group on thepore surface, which significantly increases fluid–solid interactionstrength due to the associated electrostatic interactions [17]. Toallow for this effect, an additional term, intended to empiricallyrepresent the Coulombic interactions, is superimposed with thesingle layer LJ interaction potential so as to permit matching of theexperimental equilibrium constants for CO2. We empiricallyrepresent the electrostatic interaction potential, χeðrÞ, as
χeðrÞ ¼B
ðrosc�rÞ2ð24Þ
in which B (K nm2) is a fitting constant.The above interaction term is additively combined with the
right hand side of Eq. (9) to yield an effective fluid–solid interac-tion to predict the corresponding equilibrium constant and diffu-sivity for CO2 in the Oscillator model. As shown in Fig. 8, the fittedresult (dashed line) provides a good agreement with the experi-mental data, and the obtained constant B has the value of�37.51 K nm2. The above results indicate that the gas speciesand temperature-dependent adsorption in the silica micropores issuccessfully captured by the canonical energy distribution inEq. (10) and in the Oscillator model, while using the informationon the pore size distribution.
In view of the above agreement, the standard silica LJ para-meters of the single layer model given in Section 3.1.2 wereemployed in the Oscillator model to predict the diffusivity andadsorption effect for all the gases, with the added electrostaticinteraction empirically modeled in Eq. (24) only used in theprediction for CO2 in the silica membrane layer.
4.2. Application of effective medium theory
Given the complexity of the pore structure in each layer, weemployed effective medium theory to investigate the transport in
1000/T (K-1)2.8 2.9 3.0 3.1 3.2 3.3 3.4
0
1
2
3
4
5
ArN2
H2
CH4
f-CO2
CO2
lnK
single layer
Fig. 8. Comparison of the model prediction with experiment data for the variationof apparent equilibrium constant with temperature. The symbols represent theexperimental apparent equilibrium constant from gas adsorption data, K , based onEq. (23), and the solid lines represent the predicted apparent equilibrium constant,K , using Eq. (22). The dashed line is the fitted result of CO2, after empirical additionof the electrostatic interaction with the wall following Eq. (22).
temperature (K)
195000
195200
195400
195600
195800
196000
196200
196400
196600
He
H
CO
ArNCH
temperature (K)
300 350 400 450 500 550 600
300 350 400 450 500 550 600
P2
, Pa
P1
, Pa
194800
195000
195200
195400
195600
195800
196000
196200
196400
196600
He
H
CO
ArNCH
temperature (K)300 400 500 600 700
F m (m
ol/s
)
0
2.0x10⁻⁵
4.0x10⁻⁵
6.0x10⁻⁵
8.0x10⁻⁵
1.2x10⁻⁴
HHeCHNCOArmodel
1.0x10⁻⁴N =6, z =5 μmP =198 kPaP =101 kPa
Fig. 9. (a) Variation of flow rate, (b) interfacial pressure, P1 and (c) P2, with temperature at feed pressure PF¼198 kPa based on Eq. (21), using the parameter values Nm¼6,and zm¼5 μm. In (a) the symbols are the experimental data and the lines are the model results.
X. Gao et al. / Journal of Membrane Science 460 (2014) 46–6154
the supported microporous silica layer using the proposed theo-retical description of gas diffusivity discussed above in Eq. (16).The advantage of this approach is that the entire pore sizedistribution for each layer is appropriately considered, rather usingan arbitrary mean pore radius for empirical correlation. By utiliz-ing the relationship between the macroscopic flow rate and thepore structure, following Eq. (20), the diffusion model can bedirectly validated, using the activation energy, Ea, and coefficientAo in Eq. (15) as the only fitting parameters for any coordinationnumber Nm.
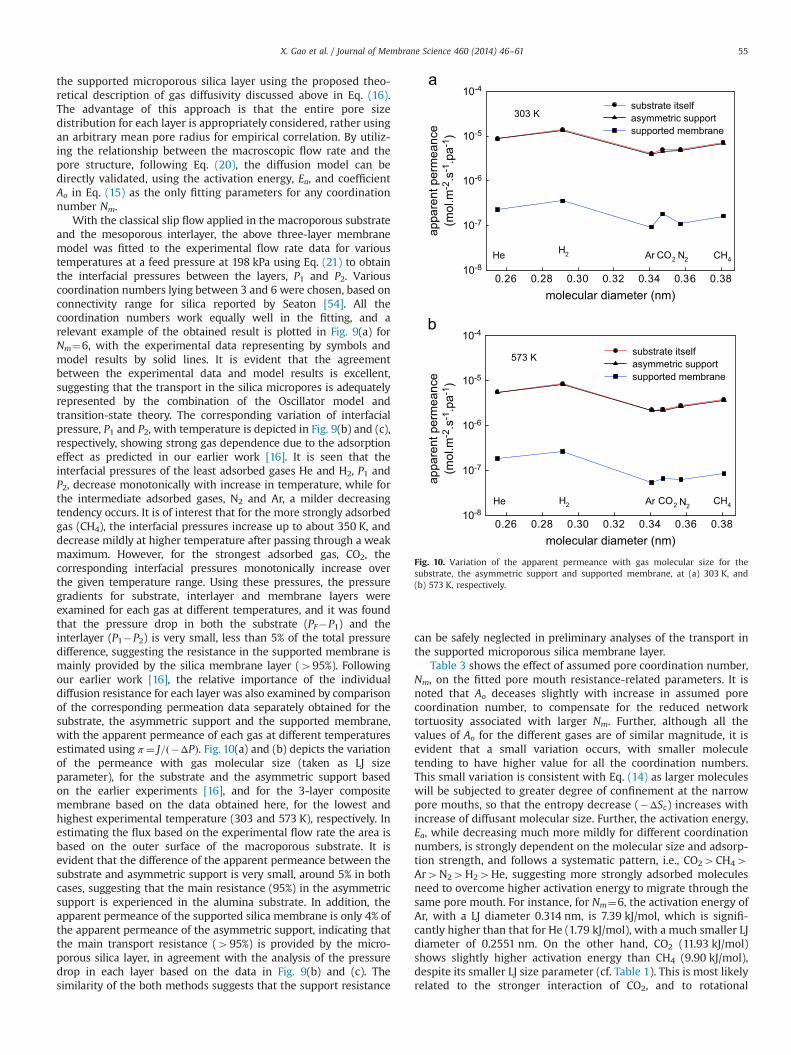
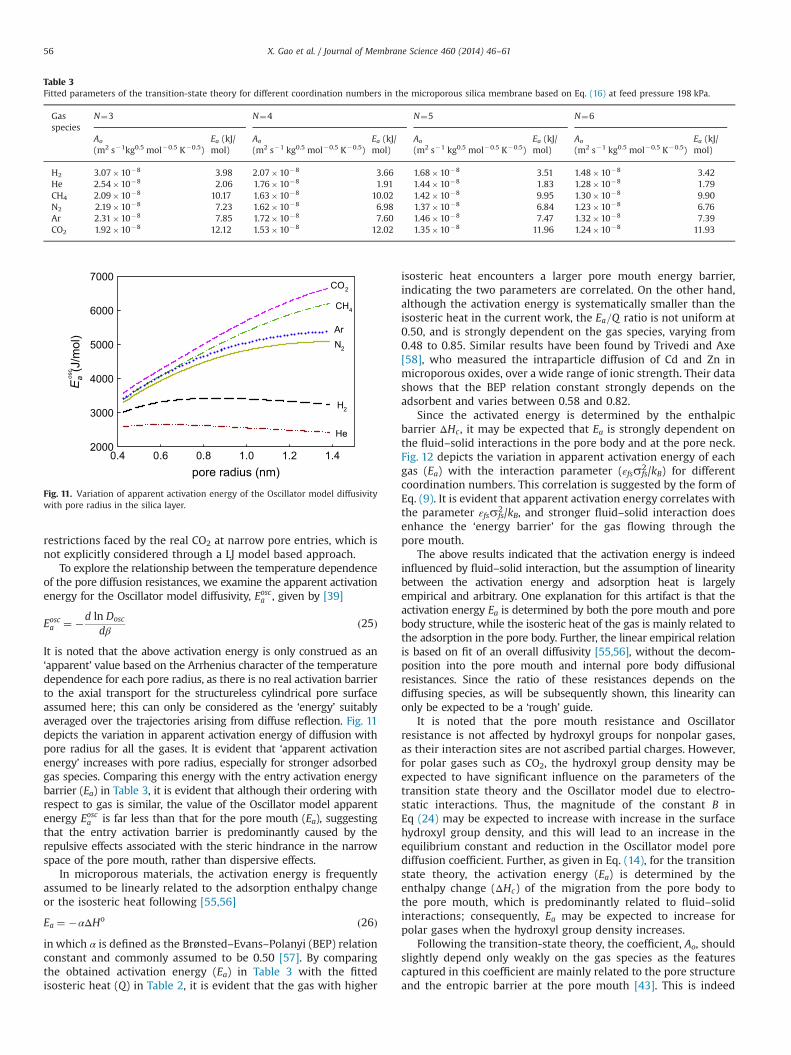
With the classical slip flow applied in the macroporous substrateand the mesoporous interlayer, the above three-layer membranemodel was fitted to the experimental flow rate data for varioustemperatures at a feed pressure at 198 kPa using Eq. (21) to obtainthe interfacial pressures between the layers, P1 and P2. Variouscoordination numbers lying between 3 and 6 were chosen, based onconnectivity range for silica reported by Seaton [54]. All thecoordination numbers work equally well in the fitting, and arelevant example of the obtained result is plotted in Fig. 9(a) forNm¼6, with the experimental data representing by symbols andmodel results by solid lines. It is evident that the agreementbetween the experimental data and model results is excellent,suggesting that the transport in the silica micropores is adequatelyrepresented by the combination of the Oscillator model andtransition-state theory. The corresponding variation of interfacialpressure, P1 and P2, with temperature is depicted in Fig. 9(b) and (c),respectively, showing strong gas dependence due to the adsorptioneffect as predicted in our earlier work [16]. It is seen that theinterfacial pressures of the least adsorbed gases He and H2, P1 andP2, decrease monotonically with increase in temperature, while forthe intermediate adsorbed gases, N2 and Ar, a milder decreasingtendency occurs. It is of interest that for the more strongly adsorbedgas (CH4), the interfacial pressures increase up to about 350 K, anddecrease mildly at higher temperature after passing through a weakmaximum. However, for the strongest adsorbed gas, CO2, thecorresponding interfacial pressures monotonically increase overthe given temperature range. Using these pressures, the pressuregradients for substrate, interlayer and membrane layers wereexamined for each gas at different temperatures, and it was foundthat the pressure drop in both the substrate (PF�P1) and theinterlayer (P1�P2) is very small, less than 5% of the total pressuredifference, suggesting the resistance in the supported membrane ismainly provided by the silica membrane layer (495%). Followingour earlier work [16], the relative importance of the individualdiffusion resistance for each layer was also examined by comparisonof the corresponding permeation data separately obtained for thesubstrate, the asymmetric support and the supported membrane,with the apparent permeance of each gas at different temperaturesestimated using π ¼ J=ð�ΔPÞ. Fig. 10(a) and (b) depicts the variationof the permeance with gas molecular size (taken as LJ sizeparameter), for the substrate and the asymmetric support basedon the earlier experiments [16], and for the 3-layer compositemembrane based on the data obtained here, for the lowest andhighest experimental temperature (303 and 573 K), respectively. Inestimating the flux based on the experimental flow rate the area isbased on the outer surface of the macroporous substrate. It isevident that the difference of the apparent permeance between thesubstrate and asymmetric support is very small, around 5% in bothcases, suggesting that the main resistance (95%) in the asymmetricsupport is experienced in the alumina substrate. In addition, theapparent permeance of the supported silica membrane is only 4% ofthe apparent permeance of the asymmetric support, indicating thatthe main transport resistance (495%) is provided by the micro-porous silica layer, in agreement with the analysis of the pressuredrop in each layer based on the data in Fig. 9(b) and (c). Thesimilarity of the both methods suggests that the support resistance
can be safely neglected in preliminary analyses of the transport inthe supported microporous silica membrane layer.
Table 3 shows the effect of assumed pore coordination number,Nm, on the fitted pore mouth resistance-related parameters. It isnoted that Ao deceases slightly with increase in assumed porecoordination number, to compensate for the reduced networktortuosity associated with larger Nm. Further, although all thevalues of Ao for the different gases are of similar magnitude, it isevident that a small variation occurs, with smaller moleculetending to have higher value for all the coordination numbers.This small variation is consistent with Eq. (14) as larger moleculeswill be subjected to greater degree of confinement at the narrowpore mouths, so that the entropy decrease (�ΔSc) increases withincrease of diffusant molecular size. Further, the activation energy,Ea, while decreasing much more mildly for different coordinationnumbers, is strongly dependent on the molecular size and adsorp-tion strength, and follows a systematic pattern, i.e., CO24CH44Ar4N24H24He, suggesting more strongly adsorbed moleculesneed to overcome higher activation energy to migrate through thesame pore mouth. For instance, for Nm¼6, the activation energy ofAr, with a LJ diameter 0.314 nm, is 7.39 kJ/mol, which is signifi-cantly higher than that for He (1.79 kJ/mol), with a much smaller LJdiameter of 0.2551 nm. On the other hand, CO2 (11.93 kJ/mol)shows slightly higher activation energy than CH4 (9.90 kJ/mol),despite its smaller LJ size parameter (cf. Table 1). This is most likelyrelated to the stronger interaction of CO2, and to rotational
molecular diameter (nm)
appa
rent
per
mea
nce
(mol
.m-2
.s-1
.pa-
1 )ap
pare
nt p
erm
eanc
e(m
ol.m
-2.s
-1.p
a-1 )
10-8
10-7
10-6
10-5
10-4
substrate itselfasymmetric support supported membrane
Fig. 10. Variation of the apparent permeance with gas molecular size for thesubstrate, the asymmetric support and supported membrane, at (a) 303 K, and(b) 573 K, respectively.
X. Gao et al. / Journal of Membrane Science 460 (2014) 46–61 55
restrictions faced by the real CO2 at narrow pore entries, which isnot explicitly considered through a LJ model based approach.
To explore the relationship between the temperature dependenceof the pore diffusion resistances, we examine the apparent activationenergy for the Oscillator model diffusivity, Eosca , given by [39]
Eosca ¼ �d ln Dosc
dβð25Þ
It is noted that the above activation energy is only construed as an‘apparent’ value based on the Arrhenius character of the temperaturedependence for each pore radius, as there is no real activation barrierto the axial transport for the structureless cylindrical pore surfaceassumed here; this can only be considered as the ‘energy’ suitablyaveraged over the trajectories arising from diffuse reflection. Fig. 11depicts the variation in apparent activation energy of diffusion withpore radius for all the gases. It is evident that ‘apparent activationenergy’ increases with pore radius, especially for stronger adsorbedgas species. Comparing this energy with the entry activation energybarrier (Ea) in Table 3, it is evident that although their ordering withrespect to gas is similar, the value of the Oscillator model apparentenergy Eosca is far less than that for the pore mouth (Ea), suggestingthat the entry activation barrier is predominantly caused by therepulsive effects associated with the steric hindrance in the narrowspace of the pore mouth, rather than dispersive effects.
In microporous materials, the activation energy is frequentlyassumed to be linearly related to the adsorption enthalpy changeor the isosteric heat following [55,56]
Ea ¼ �αΔHo ð26Þin which α is defined as the Brønsted–Evans–Polanyi (BEP) relationconstant and commonly assumed to be 0.50 [57]. By comparingthe obtained activation energy (Ea) in Table 3 with the fittedisosteric heat (Q) in Table 2, it is evident that the gas with higher
isosteric heat encounters a larger pore mouth energy barrier,indicating the two parameters are correlated. On the other hand,although the activation energy is systematically smaller than theisosteric heat in the current work, the Ea=Q ratio is not uniform at0.50, and is strongly dependent on the gas species, varying from0.48 to 0.85. Similar results have been found by Trivedi and Axe[58], who measured the intraparticle diffusion of Cd and Zn inmicroporous oxides, over a wide range of ionic strength. Their datashows that the BEP relation constant strongly depends on theadsorbent and varies between 0.58 and 0.82.
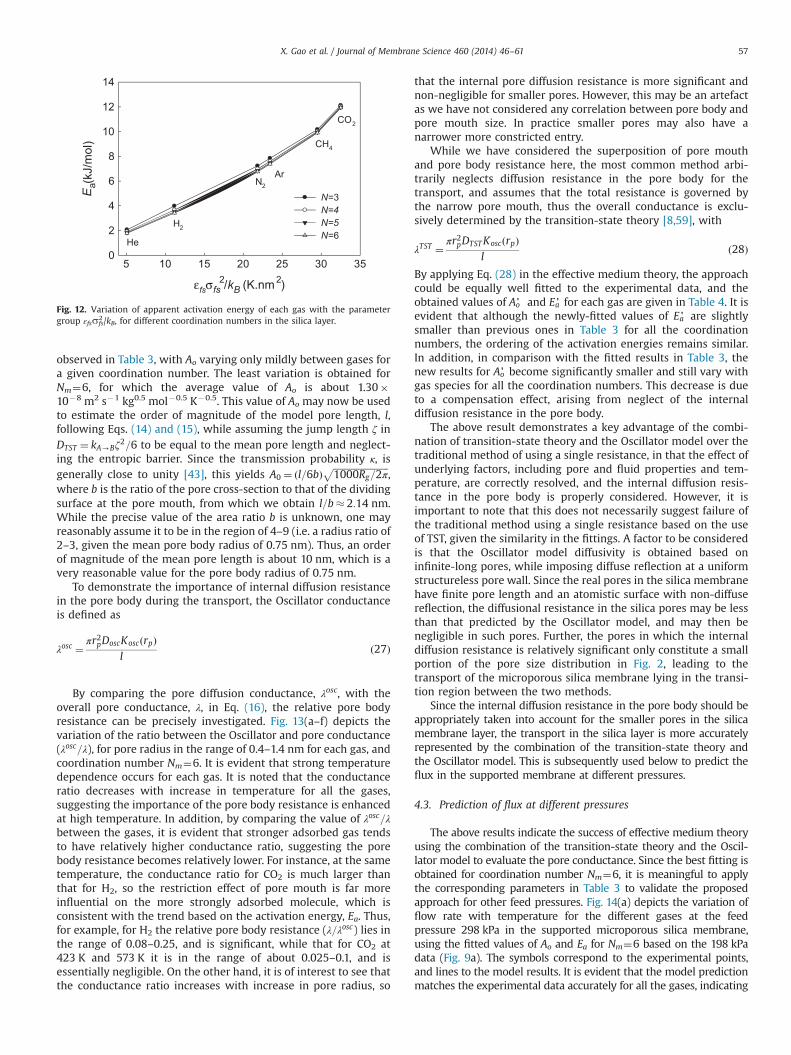
Since the activated energy is determined by the enthalpicbarrier ΔHc , it may be expected that Ea is strongly dependent onthe fluid–solid interactions in the pore body and at the pore neck.Fig. 12 depicts the variation in apparent activation energy of eachgas (Ea) with the interaction parameter (εfssfs
2/kB) for differentcoordination numbers. This correlation is suggested by the form ofEq. (9). It is evident that apparent activation energy correlates withthe parameter εfssfs
2/kB, and stronger fluid–solid interaction doesenhance the ‘energy barrier’ for the gas flowing through thepore mouth.
The above results indicated that the activation energy is indeedinfluenced by fluid–solid interaction, but the assumption of linearitybetween the activation energy and adsorption heat is largelyempirical and arbitrary. One explanation for this artifact is that theactivation energy Ea is determined by both the pore mouth and porebody structure, while the isosteric heat of the gas is mainly related tothe adsorption in the pore body. Further, the linear empirical relationis based on fit of an overall diffusivity [55,56], without the decom-position into the pore mouth and internal pore body diffusionalresistances. Since the ratio of these resistances depends on thediffusing species, as will be subsequently shown, this linearity canonly be expected to be a ‘rough’ guide.
It is noted that the pore mouth resistance and Oscillatorresistance is not affected by hydroxyl groups for nonpolar gases,as their interaction sites are not ascribed partial charges. However,for polar gases such as CO2, the hydroxyl group density may beexpected to have significant influence on the parameters of thetransition state theory and the Oscillator model due to electro-static interactions. Thus, the magnitude of the constant B inEq (24) may be expected to increase with increase in the surfacehydroxyl group density, and this will lead to an increase in theequilibrium constant and reduction in the Oscillator model porediffusion coefficient. Further, as given in Eq. (14), for the transitionstate theory, the activation energy (Ea) is determined by theenthalpy change (ΔHc) of the migration from the pore body tothe pore mouth, which is predominantly related to fluid–solidinteractions; consequently, Ea may be expected to increase forpolar gases when the hydroxyl group density increases.
Following the transition-state theory, the coefficient, Ao, shouldslightly depend only weakly on the gas species as the featurescaptured in this coefficient are mainly related to the pore structureand the entropic barrier at the pore mouth [43]. This is indeed
Table 3Fitted parameters of the transition-state theory for different coordination numbers in the microporous silica membrane based on Eq. (16) at feed pressure 198 kPa.
Fig. 11. Variation of apparent activation energy of the Oscillator model diffusivitywith pore radius in the silica layer.
X. Gao et al. / Journal of Membrane Science 460 (2014) 46–6156
observed in Table 3, with Ao varying only mildly between gases fora given coordination number. The least variation is obtained forNm¼6, for which the average value of Ao is about 1.30�10�8 m2 s�1 kg0.5 mol�0.5 K�0.5. This value of Ao may now be usedto estimate the order of magnitude of the model pore length, l,following Eqs. (14) and (15), while assuming the jump length ζ inDTST ¼ kA-Bζ
2=6 to be equal to the mean pore length and neglect-ing the entropic barrier. Since the transmission probability κ, isgenerally close to unity [43], this yields A0 ¼ ðl=6bÞ ffiffiffiffiffiffiffiffiffiffiffiffiffiffiffiffiffiffiffiffiffiffiffiffi
1000Rg=2πp
,where b is the ratio of the pore cross-section to that of the dividingsurface at the pore mouth, from which we obtain l=b� 2:14 nm.While the precise value of the area ratio b is unknown, one mayreasonably assume it to be in the region of 4–9 (i.e. a radius ratio of2–3, given the mean pore body radius of 0.75 nm). Thus, an orderof magnitude of the mean pore length is about 10 nm, which is avery reasonable value for the pore body radius of 0.75 nm.
To demonstrate the importance of internal diffusion resistancein the pore body during the transport, the Oscillator conductanceis defined as
λosc ¼ πr2pDoscKoscðrpÞl
ð27Þ
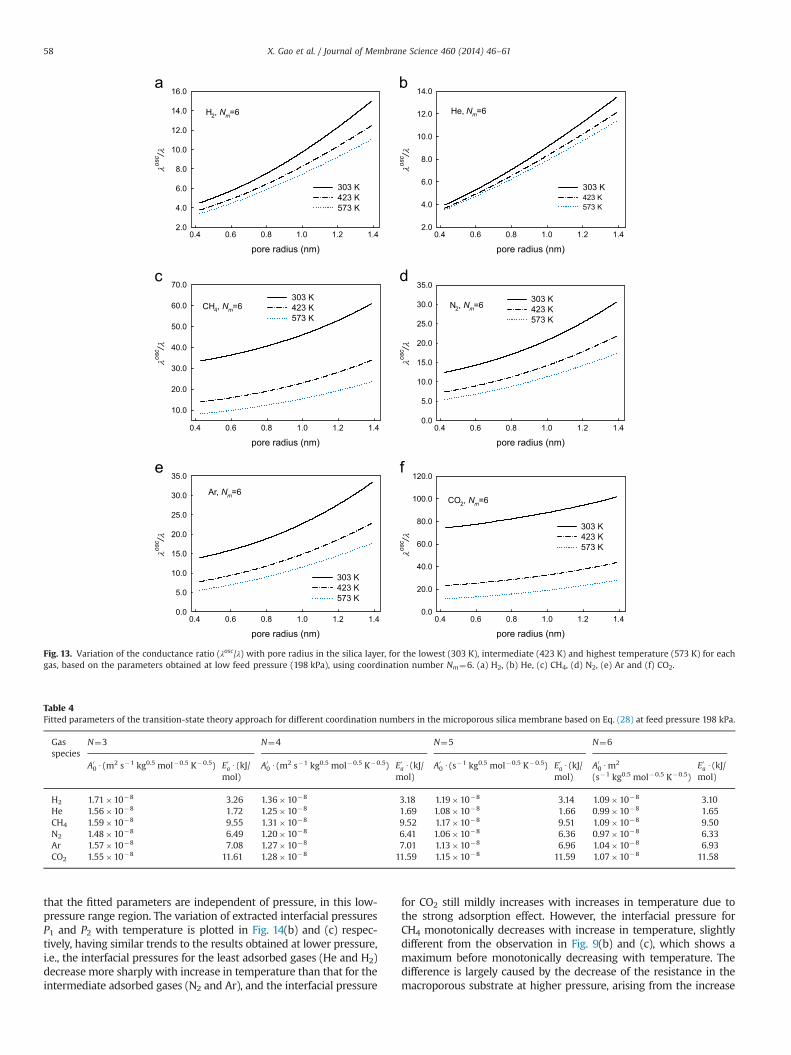
By comparing the pore diffusion conductance, λosc, with theoverall pore conductance, λ, in Eq. (16), the relative pore bodyresistance can be precisely investigated. Fig. 13(a–f) depicts thevariation of the ratio between the Oscillator and pore conductance(λosc=λ), for pore radius in the range of 0.4–1.4 nm for each gas, andcoordination number Nm¼6. It is evident that strong temperaturedependence occurs for each gas. It is noted that the conductanceratio decreases with increase in temperature for all the gases,suggesting the importance of the pore body resistance is enhancedat high temperature. In addition, by comparing the value of λosc=λbetween the gases, it is evident that stronger adsorbed gas tendsto have relatively higher conductance ratio, suggesting the porebody resistance becomes relatively lower. For instance, at the sametemperature, the conductance ratio for CO2 is much larger thanthat for H2, so the restriction effect of pore mouth is far moreinfluential on the more strongly adsorbed molecule, which isconsistent with the trend based on the activation energy, Ea. Thus,for example, for H2 the relative pore body resistance (λ=λosc) lies inthe range of 0.08–0.25, and is significant, while that for CO2 at423 K and 573 K it is in the range of about 0.025–0.1, and isessentially negligible. On the other hand, it is of interest to see thatthe conductance ratio increases with increase in pore radius, so
that the internal pore diffusion resistance is more significant andnon-negligible for smaller pores. However, this may be an artefactas we have not considered any correlation between pore body andpore mouth size. In practice smaller pores may also have anarrower more constricted entry.
While we have considered the superposition of pore mouthand pore body resistance here, the most common method arbi-trarily neglects diffusion resistance in the pore body for thetransport, and assumes that the total resistance is governed bythe narrow pore mouth, thus the overall conductance is exclu-sively determined by the transition-state theory [8,59], with
λTST ¼ πr2pDTSTKoscðrpÞl
ð28Þ
By applying Eq. (28) in the effective medium theory, the approachcould be equally well fitted to the experimental data, and theobtained values of Ao' and Ea' for each gas are given in Table 4. It isevident that although the newly-fitted values of Ea' are slightlysmaller than previous ones in Table 3 for all the coordinationnumbers, the ordering of the activation energies remains similar.In addition, in comparison with the fitted results in Table 3, thenew results for Ao' become significantly smaller and still vary withgas species for all the coordination numbers. This decrease is dueto a compensation effect, arising from neglect of the internaldiffusion resistance in the pore body.
The above result demonstrates a key advantage of the combi-nation of transition-state theory and the Oscillator model over thetraditional method of using a single resistance, in that the effect ofunderlying factors, including pore and fluid properties and tem-perature, are correctly resolved, and the internal diffusion resis-tance in the pore body is properly considered. However, it isimportant to note that this does not necessarily suggest failure ofthe traditional method using a single resistance based on the useof TST, given the similarity in the fittings. A factor to be consideredis that the Oscillator model diffusivity is obtained based oninfinite-long pores, while imposing diffuse reflection at a uniformstructureless pore wall. Since the real pores in the silica membranehave finite pore length and an atomistic surface with non-diffusereflection, the diffusional resistance in the silica pores may be lessthan that predicted by the Oscillator model, and may then benegligible in such pores. Further, the pores in which the internaldiffusion resistance is relatively significant only constitute a smallportion of the pore size distribution in Fig. 2, leading to thetransport of the microporous silica membrane lying in the transi-tion region between the two methods.
Since the internal diffusion resistance in the pore body should beappropriately taken into account for the smaller pores in the silicamembrane layer, the transport in the silica layer is more accuratelyrepresented by the combination of the transition-state theory andthe Oscillator model. This is subsequently used below to predict theflux in the supported membrane at different pressures.
4.3. Prediction of flux at different pressures
The above results indicate the success of effective medium theoryusing the combination of the transition-state theory and the Oscil-lator model to evaluate the pore conductance. Since the best fitting isobtained for coordination number Nm¼6, it is meaningful to applythe corresponding parameters in Table 3 to validate the proposedapproach for other feed pressures. Fig. 14(a) depicts the variation offlow rate with temperature for the different gases at the feedpressure 298 kPa in the supported microporous silica membrane,using the fitted values of Ao and Ea for Nm¼6 based on the 198 kPadata (Fig. 9a). The symbols correspond to the experimental points,and lines to the model results. It is evident that the model predictionmatches the experimental data accurately for all the gases, indicating
5 10 15 20 25 30 350
2
4
6
8
10
12
14
N=3 N=4 N=5 N=6
Ea(
kJ/m
ol)
H2
N2
Ar
CH4
CO2
He
fs fs2/kB (K.nm 2)ε σ
Fig. 12. Variation of apparent activation energy of each gas with the parametergroup εfssfs
2/kB, for different coordination numbers in the silica layer.
X. Gao et al. / Journal of Membrane Science 460 (2014) 46–61 57
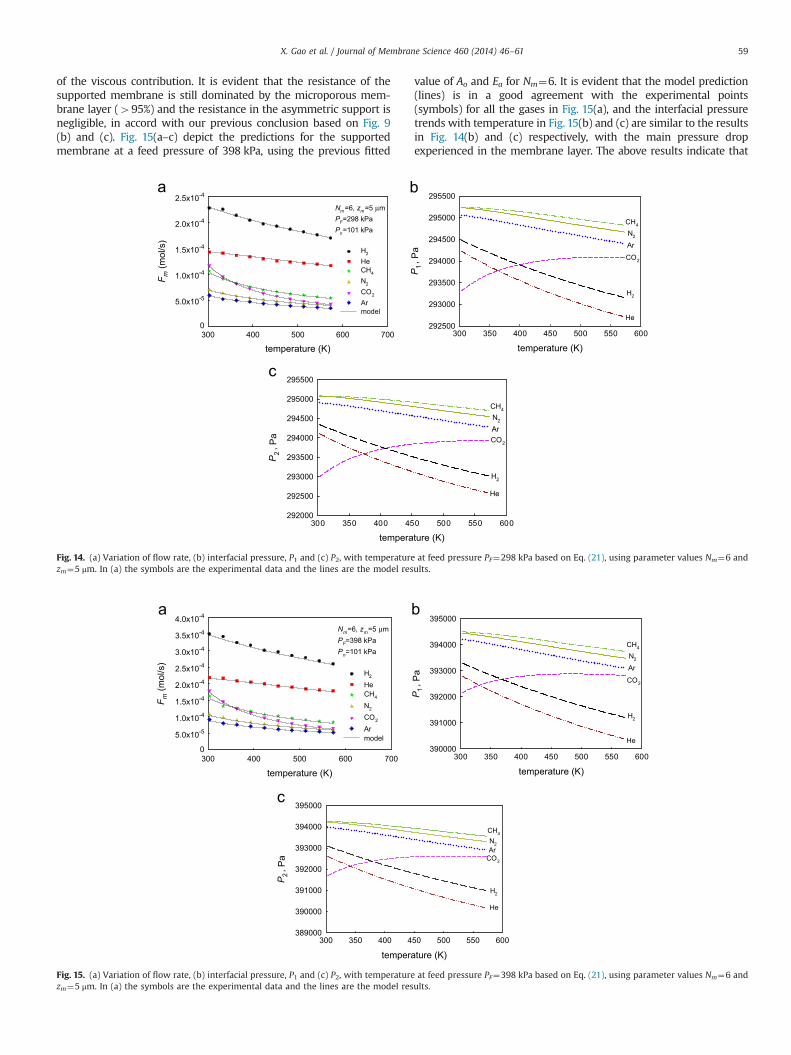
that the fitted parameters are independent of pressure, in this low-pressure range region. The variation of extracted interfacial pressuresP1 and P2 with temperature is plotted in Fig. 14(b) and (c) respec-tively, having similar trends to the results obtained at lower pressure,i.e., the interfacial pressures for the least adsorbed gases (He and H2)decrease more sharply with increase in temperature than that for theintermediate adsorbed gases (N2 and Ar), and the interfacial pressure
for CO2 still mildly increases with increases in temperature due tothe strong adsorption effect. However, the interfacial pressure forCH4 monotonically decreases with increase in temperature, slightlydifferent from the observation in Fig. 9(b) and (c), which shows amaximum before monotonically decreasing with temperature. Thedifference is largely caused by the decrease of the resistance in themacroporous substrate at higher pressure, arising from the increase
Fig. 13. Variation of the conductance ratio (λosc/λ) with pore radius in the silica layer, for the lowest (303 K), intermediate (423 K) and highest temperature (573 K) for eachgas, based on the parameters obtained at low feed pressure (198 kPa), using coordination number Nm¼6. (a) H2, (b) He, (c) CH4, (d) N2, (e) Ar and (f) CO2.
Table 4Fitted parameters of the transition-state theory approach for different coordination numbers in the microporous silica membrane based on Eq. (28) at feed pressure 198 kPa.
X. Gao et al. / Journal of Membrane Science 460 (2014) 46–6158
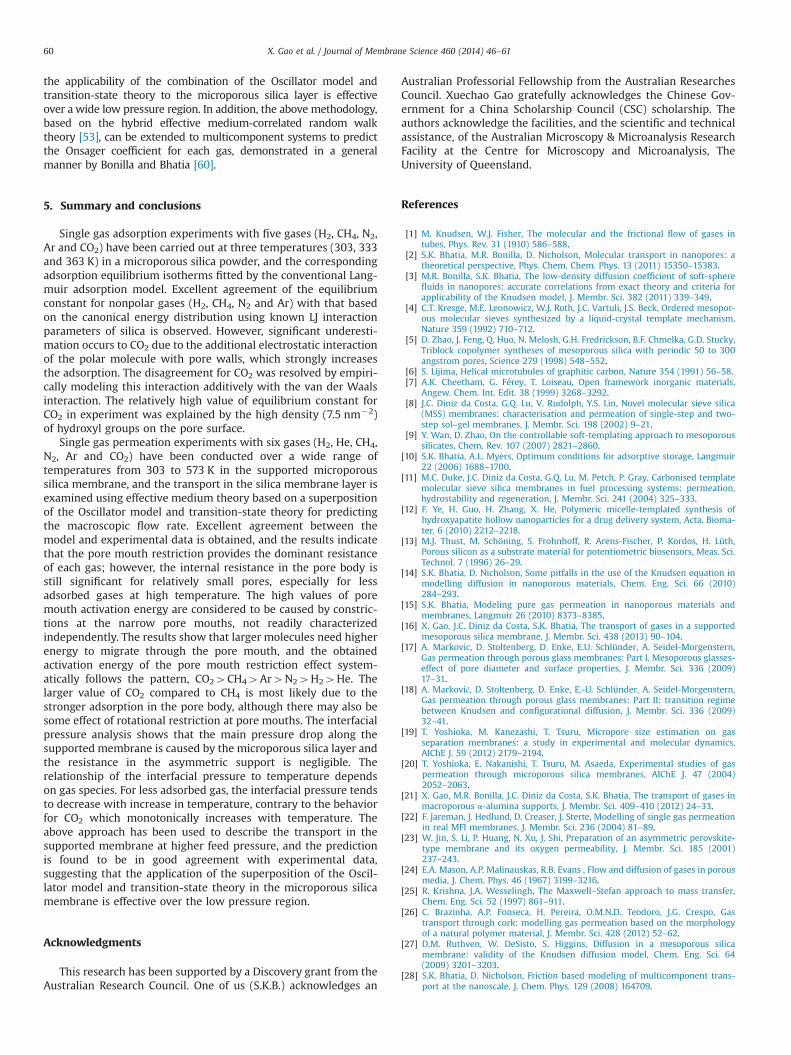
of the viscous contribution. It is evident that the resistance of thesupported membrane is still dominated by the microporous mem-brane layer (495%) and the resistance in the asymmetric support isnegligible, in accord with our previous conclusion based on Fig. 9(b) and (c). Fig. 15(a–c) depict the predictions for the supportedmembrane at a feed pressure of 398 kPa, using the previous fitted
value of Ao and Ea for Nm¼6. It is evident that the model prediction(lines) is in a good agreement with the experimental points(symbols) for all the gases in Fig. 15(a), and the interfacial pressuretrends with temperature in Fig. 15(b) and (c) are similar to the resultsin Fig. 14(b) and (c) respectively, with the main pressure dropexperienced in the membrane layer. The above results indicate that
temperature (K)
P 1 , P
a
292500
293000
293500
294000
294500
295000
295500
He
H
CO
ArN
CH
temperature (K)
300 350 400 450 500 550 600
300 350 400 450 500 550 600
P2
, Pa
292000
292500
293000
293500
294000
294500
295000
295500
He
H
COArNCH
temperature (K)300 400 500 600 700
F m (m
ol/s
)
0
5.0x10⁻⁵
1.5x10⁻⁴
2.0x10⁻⁴
2.5x10⁻⁴
HHeCHNCOArmodel
1.0x10⁻⁴
N =6, z =5 μmP =298 kPaP =101 kPa
Fig. 14. (a) Variation of flow rate, (b) interfacial pressure, P1 and (c) P2, with temperature at feed pressure PF¼298 kPa based on Eq. (21), using parameter values Nm¼6 andzm¼5 μm. In (a) the symbols are the experimental data and the lines are the model results.
temperature (K)
P 1 , P
a
390000
391000
392000
393000
394000
395000
He
H
CO
ArN
CH
temperature (K)
300 350 400 450 500 550 600
300 350 400 450 500 550 600
P 2 ,
Pa
389000
390000
391000
392000
393000
394000
395000
He
H
COArNCH
temperature (K)300 400 500 600 700
F m (m
ol/s
)
0
5.0x10⁻⁵
1.5x10⁻⁴
2.0x10⁻⁴
2.5x10⁻⁴
3.0x10⁻⁴
3.5x10⁻⁴
4.0x10⁻⁴
HHeCHNCOArmodel
1.0x10⁻⁴
N =6, z =5 μmP =398 kPaP =101 kPa
Fig. 15. (a) Variation of flow rate, (b) interfacial pressure, P1 and (c) P2, with temperature at feed pressure PF¼398 kPa based on Eq. (21), using parameter values Nm¼6 andzm¼5 μm. In (a) the symbols are the experimental data and the lines are the model results.
X. Gao et al. / Journal of Membrane Science 460 (2014) 46–61 59
the applicability of the combination of the Oscillator model andtransition-state theory to the microporous silica layer is effectiveover a wide low pressure region. In addition, the above methodology,based on the hybrid effective medium-correlated random walktheory [53], can be extended to multicomponent systems to predictthe Onsager coefficient for each gas, demonstrated in a generalmanner by Bonilla and Bhatia [60].
5. Summary and conclusions
Single gas adsorption experiments with five gases (H2, CH4, N2,Ar and CO2) have been carried out at three temperatures (303, 333and 363 K) in a microporous silica powder, and the correspondingadsorption equilibrium isotherms fitted by the conventional Lang-muir adsorption model. Excellent agreement of the equilibriumconstant for nonpolar gases (H2, CH4, N2 and Ar) with that basedon the canonical energy distribution using known LJ interactionparameters of silica is observed. However, significant underesti-mation occurs to CO2 due to the additional electrostatic interactionof the polar molecule with pore walls, which strongly increasesthe adsorption. The disagreement for CO2 was resolved by empiri-cally modeling this interaction additively with the van der Waalsinteraction. The relatively high value of equilibrium constant forCO2 in experiment was explained by the high density (7.5 nm�2)of hydroxyl groups on the pore surface.
Single gas permeation experiments with six gases (H2, He, CH4,N2, Ar and CO2) have been conducted over a wide range oftemperatures from 303 to 573 K in the supported microporoussilica membrane, and the transport in the silica membrane layer isexamined using effective medium theory based on a superpositionof the Oscillator model and transition-state theory for predictingthe macroscopic flow rate. Excellent agreement between themodel and experimental data is obtained, and the results indicatethat the pore mouth restriction provides the dominant resistanceof each gas; however, the internal resistance in the pore body isstill significant for relatively small pores, especially for lessadsorbed gases at high temperature. The high values of poremouth activation energy are considered to be caused by constric-tions at the narrow pore mouths, not readily characterizedindependently. The results show that larger molecules need higherenergy to migrate through the pore mouth, and the obtainedactivation energy of the pore mouth restriction effect system-atically follows the pattern, CO24CH44Ar4N24H24He. Thelarger value of CO2 compared to CH4 is most likely due to thestronger adsorption in the pore body, although there may also besome effect of rotational restriction at pore mouths. The interfacialpressure analysis shows that the main pressure drop along thesupported membrane is caused by the microporous silica layer andthe resistance in the asymmetric support is negligible. Therelationship of the interfacial pressure to temperature dependson gas species. For less adsorbed gas, the interfacial pressure tendsto decrease with increase in temperature, contrary to the behaviorfor CO2 which monotonically increases with temperature. Theabove approach has been used to describe the transport in thesupported membrane at higher feed pressure, and the predictionis found to be in good agreement with experimental data,suggesting that the application of the superposition of the Oscil-lator model and transition-state theory in the microporous silicamembrane is effective over the low pressure region.
Acknowledgments
This research has been supported by a Discovery grant from theAustralian Research Council. One of us (S.K.B.) acknowledges an
Australian Professorial Fellowship from the Australian ResearchesCouncil. Xuechao Gao gratefully acknowledges the Chinese Gov-ernment for a China Scholarship Council (CSC) scholarship. Theauthors acknowledge the facilities, and the scientific and technicalassistance, of the Australian Microscopy & Microanalysis ResearchFacility at the Centre for Microscopy and Microanalysis, TheUniversity of Queensland.
References
[1] M. Knudsen, W.J. Fisher, The molecular and the frictional flow of gases intubes, Phys. Rev. 31 (1910) 586–588.
[2] S.K. Bhatia, M.R. Bonilla, D. Nicholson, Molecular transport in nanopores: atheoretical perspective, Phys. Chem. Chem. Phys. 13 (2011) 15350–15383.
[3] M.R. Bonilla, S.K. Bhatia, The low-density diffusion coefficient of soft-spherefluids in nanopores: accurate correlations from exact theory and criteria forapplicability of the Knudsen model, J. Membr. Sci. 382 (2011) 339–349.
[5] D. Zhao, J. Feng, Q. Huo, N. Melosh, G.H. Fredrickson, B.F. Chmelka, G.D. Stucky,Triblock copolymer syntheses of mesoporous silica with periodic 50 to 300angstrom pores, Science 279 (1998) 548–552.
[6] S. Lijima, Helical microtubules of graphitic carbon, Nature 354 (1991) 56–58.[7] A.K. Cheetham, G. Férey, T. Loiseau, Open framework inorganic materials,
[11] M.C. Duke, J.C. Diniz da Costa, G.Q. Lu, M. Petch, P. Gray, Carbonised templatemolecular sieve silica membranes in fuel processing systems: permeation,hydrostability and regeneration, J. Membr. Sci. 241 (2004) 325–333.
[12] F. Ye, H. Guo, H. Zhang, X. He, Polymeric micelle-templated synthesis ofhydroxyapatite hollow nanoparticles for a drug delivery system, Acta. Bioma-ter. 6 (2010) 2212–2218.
[13] M.J. Thust, M. Schöning, S. Frohnhoff, R. Arens-Fischer, P. Kordos, H. Lüth,Porous silicon as a substrate material for potentiometric biosensors, Meas. Sci.Technol. 7 (1996) 26–29.
[14] S.K. Bhatia, D. Nicholson, Some pitfalls in the use of the Knudsen equation inmodelling diffusion in nanoporous materials, Chem. Eng. Sci. 66 (2010)284–293.
[15] S.K. Bhatia, Modeling pure gas permeation in nanoporous materials andmembranes, Langmuir 26 (2010) 8373–8385.
[16] X. Gao, J.C. Diniz da Costa, S.K. Bhatia, The transport of gases in a supportedmesoporous silica membrane, J. Membr. Sci. 438 (2013) 90–104.
[17] A. Markovic, D. Stoltenberg, D. Enke, E.U. Schlünder, A. Seidel-Morgenstern,Gas permeation through porous glass membranes: Part I. Mesoporous glasses-effect of pore diameter and surface properties, J. Membr. Sci. 336 (2009)17–31.
[18] A. Marković, D. Stoltenberg, D. Enke, E.-U. Schlünder, A. Seidel-Morgenstern,Gas permeation through porous glass membranes: Part II: transition regimebetween Knudsen and configurational diffusion, J. Membr. Sci. 336 (2009)32–41.
[19] T. Yoshioka, M. Kanezashi, T. Tsuru, Micropore size estimation on gasseparation membranes: a study in experimental and molecular dynamics,AIChE J. 59 (2012) 2179–2194.
[20] T. Yoshioka, E. Nakanishi, T. Tsuru, M. Asaeda, Experimental studies of gaspermeation through microporous silica membranes, AIChE J. 47 (2004)2052–2063.
[21] X. Gao, M.R. Bonilla, J.C. Diniz da Costa, S.K. Bhatia, The transport of gases inmacroporous α-alumina supports, J. Membr. Sci. 409–410 (2012) 24–33.
[22] F. Jareman, J. Hedlund, D. Creaser, J. Sterte, Modelling of single gas permeationin real MFI membranes, J. Membr. Sci. 236 (2004) 81–89.
[23] W. Jin, S. Li, P. Huang, N. Xu, J. Shi, Preparation of an asymmetric perovskite-type membrane and its oxygen permeability, J. Membr. Sci. 185 (2001)237–243.
[24] E.A. Mason, A.P. Malinauskas, R.B. Evans , Flow and diffusion of gases in porousmedia, J. Chem. Phys. 46 (1967) 3199–3216.
[25] R. Krishna, J.A. Wesselingh, The Maxwell–Stefan approach to mass transfer,Chem. Eng. Sci. 52 (1997) 861–911.
[26] C. Brazinha, A.P. Fonseca, H. Pereira, O.M.N.D. Teodoro, J.G. Crespo, Gastransport through cork: modelling gas permeation based on the morphologyof a natural polymer material, J. Membr. Sci. 428 (2012) 52–62.
[27] D.M. Ruthven, W. DeSisto, S. Higgins, Diffusion in a mesoporous silicamembrane: validity of the Knudsen diffusion model, Chem. Eng. Sci. 64(2009) 3201–3203.
[28] S.K. Bhatia, D. Nicholson, Friction based modeling of multicomponent trans-port at the nanoscale, J. Chem. Phys. 129 (2008) 164709.
X. Gao et al. / Journal of Membrane Science 460 (2014) 46–6160
[29] X. Gao, M.R. Bonilla, J.C. Diniz da Costa, S.K. Bhatia, The transport of gases in amesoporous γ-alumina supported membrane, J. Membr. Sci. 428 (2013) 357–370.
[30] H. Preising, D. Enke, Relations between texture and transport properties in theprimary pore system of catalyst supports, Colloids Surf. A 300 (2007) 21–29.
[31] J. Kärger, F. Stallmach, S. Vasenkov, Structure-mobility relations of moleculardiffusion in nanoporous materials, Magn. Reson. Imaging 21 (2003) 185–191.
[32] P. Uchytil, O. Schramm, A. Seidel-Morgenstern, Influence of the transportdirection on gas permeation in two-layer ceramic membranes, J. Membr. Sci.170 (2000) 215–224.
[33] X. Gao, J.C. Diniz da Costa, S.K. Bhatia, Understanding the diffusional tortuosityof porous materials: an effective medium theory perspective, Chem. Eng. Sci.http://dx.doi.org/10.1016/j.ces.2013.09.050 (in press).
[34] S. Hwang, Fundamentals of membrane transport, Korean J. Chem. Eng. 28(2011) 1–15.
[35] J. Xiao, J. Wei, Diffusion mechanism of hydrocarbons in zeolites—I. Theory,Chem. Eng. Sci. 47 (1992) 1123–1141.
[36] O.G. Jepps, S.K. Bhatia, D.J. Searles, Wall mediated transport in confinedspaces: exact theory for low density, Phys. Rev. Lett. 91 (2003) 126102.
[37] T.X. Nguyen, S.K. Bhatia, Kinetic restriction of simple gases in porous carbons:transition-state theory study, Langmuir 24 (2008) 146–154.
[38] J. van den Bergh, S. Ban, T.J.H. Vlugt, F. Kapteijn, Modeling the loadingdependency of diffusion in zeolites: the relevant site model, J. Phys. Chem. C113 (2009) 17840–17850.
[39] S.K. Bhatia, O. Jepps, D. Nicholson, Tractable molecular theory of transport ofLennard-Jones fluids in nanopores, J. Chem. Phys. 120 (2004) 4472–4485.
[40] R. Krishna, J.M. van Baten, An investigation of the characteristics of Maxwell–Stefan diffusivities of binary mixtures in silica nanopores, Chem. Eng. Sci. 64(2009) 870–882.
[41] S.K. Bhatia, D. Nicholson, Hydrodynamic origin of diffusion in nanopores, Phys.Rev. Lett. 90 (2003) 016105.
[42] E. Beerdsen, B. Smit, D. Dubbeldam, Molecular simulation of loading depen-dent slow diffusion in confined systems, Phys. Rev. Lett. 93 (2004) 248301.
[43] T.X. Nguyen, S.K. Bhatia, Determination of pore accessibility in disorderednanoporous materials, J. Phys. Chem. C 111 (2007) 2212–2222.
[44] T.X. Nguyen, H. Jobic, S.K. Bhatia, Microscopic observation of kinetic molecularsieving of hydrogen isotopes in a nanoporous material, Phys. Rev. Lett. 105(2010) 085901.
[45] C.J. Brinker, G.W. Scherer, Sol—Gel Science: The Physics and Chemistry ofSol—Gel Processing, Academic Press, San Diego, CA, 1990.
[46] N.K. Raman, C.J. Brinker, Organic “template” approach to molecular sievingsilica membranes, J. Membr. Sci. 105 (1995) 273–279.
[47] K. Vollmayr, W. Kob, K. Binder, Cooling-rate effects in amorphous silica: acomputer-simulation study, Phys. Rev. B 54 (1996) 15808–15827.
[48] W.A. Steele, M.J. Bojan, Simulation studies of sorption in model cylindricalmicropores, Adv. Colloid Interface 76 (1998) 153–178.
[49] A.V. Neimark, P.I. Ravikovitch, M. Grün, F. Schüth, K.K. Unger, Pore size analysisof MCM-41 type adsorbents by means of nitrogen and argon adsorption, J.Colloid Interface Sci. 207 (1998) 159–169.
[50] S.K. Bhatia, Capillary network models for transport in packed beds: considera-tions of pore aspect ratio, Chem. Eng. Commun. 154 (1996) 183–202.
[51] S. Kirkpatrick, Percolation and conduction, Rev. Mod. Phys. 45 (1973) 574–588.[52] S.K. Bhatia, Stochastic theory of transport in inhomogeneous media, Chem.
Eng. Sci. 41 (1986) 1311–1324.[53] P.D. Deepak, S.K. Bhatia, Transport in capillary network models of porous
media: theory and simulation, Chem. Eng. Sci. 49 (1994) 245–257.[54] N.A. Seaton, Determination of the connectivity of porous solids from nitrogen
sorption measurements, Chem. Eng. Sci. 46 (1992) 1895–1909.[55] V.J. Inglezakis, A.A. Zorpas, Heat of adsorption, adsorption energy and
activation energy in adsorption and ion exchange systems, Desalination WaterTreat. 39 (2012) 149–157.
[56] M. Suzuki, Adsorption Engineering, Co-published by Kodansha Ltd., Tokyo andElsevier Science Publishers B.V., Amsterdam, 1990.
[57] A. Michaelides, Z. Liu, C. Zhang, A. Alavi, D.A. King, P. Hu, Identification ofgeneral linear relationships between activation energies and enthalpy changesfor dissociation reactions at surfaces, J. Am Chem. Soc. 125 (2003) 3704–3705.
[58] P. Trivedi, L. Axe, Modeling Cd and Zn sorption to hydrous metal oxides,Environ. Sci. Technol. 34 (2000) 2215–2223.
[59] A.J. Burggraaf, Single gas permeation of thin zeolite (MFI) membranes:theory and analysis of experimental observations, J. Membr. Sci. 155 (1999)45–65.
[60] M.R. Bonilla, S.K. Bhatia, Multicomponent effective medium-correlated ran-dom walk theory for the diffusion of fluid mixtures through porous media,Langmuir 28 (2011) 517–533.
X. Gao et al. / Journal of Membrane Science 460 (2014) 46–61 61