Introduction The properties of systems containing oppositely charged surfactants have been the subject of extensive experi- mental and theoretical investigations [1–23]. Competi- tion between various molecular interactions (van der Waals, hydrophobic, electrostatic, hydration forces, etc.) may result in a variety of microstructures, catanionic surfactant salts, mixed micelles, catanionic vesicles, etc. A catanionic surfactant is an amphiphilic compound that contains amphiphilic cations and amphiphilic anions in an equimolar ratio, while a catanionic vesicle is a vesicle that contains amphiphilic cations and amphiphilic anions. Recently, a growing body of literature has confirmed the potential of such investiga- tions in many applicable aspects (design of ecient detergents, microemulsions for tertiary oil recovery, drug carrier systems, etc.). Spontaneous vesicle formation has rarely been ob- served in single-tailed chain systems without adequate chemical or mechanical treatment [23–25], but in cationic/anionic surfactant mixtures spontaneous for- mation of vesicles is frequently observed. Recently, we have described the phase transition from the planar to the curved lamellar phase and the formation of catan- ionic vesicles in symmetric mixtures of a cationic and anionic surfactant [5, 26]. The physical forces driving this phase transition are mostly of electrostatic origin. It was found that with increasing mole fraction of one of the surfactants the phase transition proceeds in several Colloid Polym Sci 277:153–163 (1999) Ó Springer-Verlag 1999 ORIGINAL CONTRIBUTION V. Tomasˇ ic´ I. S ˇ tefanic´ N. Filipovic´ -Vincekovic´ Adsorption, association and precipitation in hexadecyltrimethylammonium bromide/sodium dodecyl sulfate mixtures Received: 9 June 1998 Accepted: 18 August 1998 V. Tomasˇ ic´ Æ I. S ˇ tefanic´ Æ N. Filipovic´-Vincekovic´ (&) Department of Physical Chemistry Rud ˇ er Bosˇkovic´ Institute P.O. Box 1016, HR-10001 Zagreb Croatia e-mail: fi[email protected]Abstract The phase equilibria of surfactant aqueous mixtures, hex- adecyltrimethylammonium bromide and sodium dodecyl sulfate, have been studied by polarizing micros- copy, quasielastic light scattering, conductivity, potentiometric, elec- trophoretic, and surface tension measurements. Adsorption at the air/solution interface, association and precipitation in bulk solution strongly depended on the molar ratio and the concentration of sur- factants. Catanionic vesicles coex- isted with crystalline catanionic salts in a broad concentration range. The relative proportions of crystallites and vesicles varied according to the concentration and the molar ratio of the surfactants. The solid crystalline phase was progressively converted to catanionic vesicles with increasing surfactant molar ratio. At the high- est excess of one of the surfactants transition from catanionic vesicles to mixed micelles occurred. The for- mation and stability of dierent phases are discussed in terms of surfactant molecular packing con- straints and electrostatic interactions in the headgroup region. Surfactant tail-length asymmetry and the change of electrostatic interactions in the headgroup region from at- tractive to repulsive are governing factors for the transition from pla- nar to curved bilayers. Key words Catanionic surfactant – hexadecyltrimethylammonium bromide – mixed micelles – mixed monolayer – sodium dodecyl sulfate – vesicles
Transcript
Introduction
The properties of systems containing oppositely chargedsurfactants have been the subject of extensive experi-mental and theoretical investigations [1±23]. Competi-tion between various molecular interactions (van derWaals, hydrophobic, electrostatic, hydration forces, etc.)may result in a variety of microstructures, catanionicsurfactant salts, mixed micelles, catanionic vesicles, etc.A catanionic surfactant is an amphiphilic compoundthat contains amphiphilic cations and amphiphilicanions in an equimolar ratio, while a catanionic vesicleis a vesicle that contains amphiphilic cations andamphiphilic anions. Recently, a growing body ofliterature has con®rmed the potential of such investiga-
tions in many applicable aspects (design of e�cientdetergents, microemulsions for tertiary oil recovery,drug carrier systems, etc.).
Spontaneous vesicle formation has rarely been ob-served in single-tailed chain systems without adequatechemical or mechanical treatment [23±25], but incationic/anionic surfactant mixtures spontaneous for-mation of vesicles is frequently observed. Recently, wehave described the phase transition from the planar tothe curved lamellar phase and the formation of catan-ionic vesicles in symmetric mixtures of a cationic andanionic surfactant [5, 26]. The physical forces drivingthis phase transition are mostly of electrostatic origin. Itwas found that with increasing mole fraction of one ofthe surfactants the phase transition proceeds in several
Colloid Polym Sci 277:153±163 (1999)Ó Springer-Verlag 1999 ORIGINAL CONTRIBUTION
V. TomasÏ icÂI. SÏ tefanicÂN. Filipovic -VincekovicÂ
Adsorption, association and precipitationin hexadecyltrimethylammoniumbromide/sodium dodecyl sulfate mixtures
Received: 9 June 1998Accepted: 18 August 1998
V. TomasÏ ic á I. SÏ tefanic áN. Filipovic -Vincekovic (&)Department of Physical Chemistry
Abstract The phase equilibria ofsurfactant aqueous mixtures, hex-adecyltrimethylammonium bromideand sodium dodecyl sulfate, havebeen studied by polarizing micros-copy, quasielastic light scattering,conductivity, potentiometric, elec-trophoretic, and surface tensionmeasurements. Adsorption at theair/solution interface, associationand precipitation in bulk solutionstrongly depended on the molarratio and the concentration of sur-factants. Catanionic vesicles coex-isted with crystalline catanionic saltsin a broad concentration range. Therelative proportions of crystallitesand vesicles varied according to theconcentration and the molar ratio ofthe surfactants. The solid crystallinephase was progressively converted tocatanionic vesicles with increasing
surfactant molar ratio. At the high-est excess of one of the surfactantstransition from catanionic vesicles tomixed micelles occurred. The for-mation and stability of di�erentphases are discussed in terms ofsurfactant molecular packing con-straints and electrostatic interactionsin the headgroup region. Surfactanttail-length asymmetry and thechange of electrostatic interactionsin the headgroup region from at-tractive to repulsive are governingfactors for the transition from pla-nar to curved bilayers.
stages. In the ®rst stage the surfactant in excess isincorporated into a planar bilayer of the catanionic salt.This leads to curving of planar lamellae and ®nally tothe formation of a closed lamellar structure, i.e. vesicles.At this stage coexistence of the catanionic crystallinephase and vesicles was usually observed. At the highestexcess of one of the surfactants only mixed micellesexisted.
The present article deals with the properties of themonolayer at the air/solution interface, phase behaviorand solution microstructures in asymmetric mixtures ofa cationic and anionic surfactant, hexadecyl-trimethylammonium bromide (CTAB) and sodiumdodecyl sulfate (NaDS). The sequence of aggregatestructures (planar bilayers±vesicles±micelles) formed byshifting the composition of mixtures from the equimolarrange may, at least in part, be explained by bothelectrostatic interactions in the head-group region andby chain packing considerations for the asymmetrichydrophobic tails in the bilayer.
Experimental
Materials and methods
NaDS, especially pure, obtained from BDH ChemicalLtd. was recrystallized from ethanol. CTAB was pur-chased from Merck and recrystallized several times fromacetone. The purity of the surfactants was tested bysurface tension measurements. Systems were preparedwith a constant anionic and an increasing cationicsurfactant concentration and vice versa; the cationicsurfactant was always added to the anionic surfactant.They were equilibrated 1 day before the measurementwas performed. All experiments were carried out at303 K in order to approach experimental conditionsabove the Kra�t points of both NaDS and CTAB. TheKra�t point of CTAB is 297 K (determined by measur-ing the change of speci®c conductivity of a 0.1%solution with temperature). The surface tension mea-surements were performed with an interfacial tensiome-ter (K8, KruÈ ss, Hamburg).
Solution microstructures were investigated using acombination of quasielastic light scattering (QELS) andlight microscopy. A Brookhaven Bi-200SM goniometer,a BI-2030AT correlator and a 300 mV Ar Lexel laserwere used for light-scattering measurements. A LeitzOrthoplan microscope was equipped with photographicapparatus in a bright ®eld and a polarizing mode andphase contrast. The liquid crystalline phases wereidenti®ed by comparison of textures with photomicro-graphs from the literature [27].
Electrophoretic experiments (Pen Kem, BedfordHills) were applied to determine the charge and electro-phoretic mobility of the particles. The activities of Na+
and Br) ions were determined with the correspondingion-selective electrode and an Orion Research Inc. digitalpH/mV meter as was previously described [28]. Conduc-tivity measurements were carried out with a conducto-meter (conductivity meter MA 5964, Iskra, Kranj).
Interpretation of data
The adsorption of a single surfactant at the air/solutioninterface was determined from the slope of the surfacetension c, versus ln cCTAB or versus ln cNaDS with theconcentration of the other surfactant being constant. Inthe absence of electrolyte the maximum surface excess ofCTAB, Gmax (CTAB) or NaDS, Gmax (NaDS), surfact-ant, respectively, is calculated [29] by the followingequations.
Cmax�CTAB� � ÿ1=2RT �dc=dln cCTAB� �1�and
Cmax�NaDS� � ÿ1=2RT �dc=dln cNaDS� �2�where c denotes concentration, R is the gas constant andT is the absolute temperature. The minimum areaoccupied by a surfactant molecule adsorbed at the air/solution interface, Amin, (nm
2), when Gmax is expressed inunits of moles per centimeter squared is
Amin � 1014=CmaxNA ; �3�where NA is Avogadro,s number.
Using regular solution theory and the standard-statesurface tension method [30±32] the composition of themixed monolayer, the surface activity coe�cient of thecomponents (fCTAB and fNaDS) and the monolayerinteraction parameter, bmon, were determined. The valueof the standard surface tension is arbitrarily chosen tobe in the region where the complete monolayer isformed, but corresponding to concentrations su�cientlybelow the critical micelle concentration (cmc). Thismethod requires only one set of data for thermodynamicparameter calculations. The molar fraction of NaDS inthe mixed monolayer (XNaDS) was estimated fromsolution molar concentrations of the individual surfact-ants NaDS (cNaDS) and CTAB (cCTAB) and theirmixture (cCTAB+NaDS), required to obtain the samevalue of the surface tension in all three cases. The basicequation is
�4�where aNaDS is the mole fraction of NaDS in solution.The iterative solution of the above equation givesXNaDS. The surface molecular interaction parameter(bmon) and the surface activity coe�cients for NaDS
154
(fNaDS) and CTAB (fCTAB) in the mixed monolayer arecalculated according to the following equations:
bmon �ln�aNaDScCTAB�NaDS=cNaDSXNaDS�
�1ÿ XNaDS�2; �5�
fNaDS � exp bmon�1ÿ XNaDS�2 �6�and
fCTAB � exp bmon�XNaDS�2 : �7�Regular solution theory attributes all nonideality in
mixing to the heat of mixing, represented by aninteraction parameter. Theoretically, the excess enthalpyof mixing (DHE) is equal to the excess free energy ofmixing (DGE)
DGE � DHE � bmonXNaDSXCTABRT ; �8�where XNaDS and XCTAB are the mole fractions of thetwo surfactants in the mixed monolayer, R is the gasconstant and T is the absolute temperature.
The parameters for mixed micelles, mole fraction ofNaDS in mixed micelles (xNaDS), corresponding activitycoe�cients and the molecular interaction parameter(bmic) are calculated using Eqs. (4)±(7). In the calcula-tions the cmc's of the individual surfactants and theirmixture at a mole fraction a, were used instead of cNaDS,cCTAB and cCTAB+NaDS [32].
The precipitation/solubility boundary was deter-mined visually (light microscopy). The boundary wastaken as the maximum concentration of reactants thatdid not result in the solid phase formation. Themonomer-catanionic surfactant salt equilibrium is
The aggregation properties of CTAB/NaDS mixtureshave been characterized through the cmc and counterionbinding (results are presented as the apparent degree ofcounterion dissociation, a, from the micelle/solutioninterface) deduced from speci®c conductivity and po-tentiometric measurements [28]. To a ®rst approxima-tion a was taken as the ratio of the slope above andbelow breaks in curves of conductivity j, versus c andconcentration of free counterions (counterions notbound to the mixed micelle) versus the total concentra-tion of surfactant in excess, respectively.
Light-scattering measurements yield informationabout sizes and polydispersities of the particle popula-tions. The measured autocorrelation functions wereanalyzed by two-component analysis [33].
Results
Adsorption at the air/water interface
The surface adsorption studies showed that there exists astrong synergism between cationic and anionic surfact-ants due to electrostatic interactions between oppositelycharged headgroups of surfactant molecules [10, 34, 35].The surface activity of oppositely charged surfactantmixtures is generally greater than that which would beexpected for other types of mixtures. This synergistic
Fig. 1 Surface tension, c, vsconcentration, c, [total surfact-ant concentrations for singlehexadecyltrimethylammoniumbromide, CTAB, (h), singlesodium dodecyl sulfate, NaDS,(s) and their equimolar mix-ture (d)]. The temperature is303 K and the aging time is1 day
155
e�ect has also been demonstrated in CTAB/NaDSequimolar mixtures.
Typical c versus log c curves for NaDS, CTAB andtheir mixed solutions at an equimolar ratio are shown inFig. 1. It can be seen that a much lower concentrationfor the equimolar mixture than that for the cationic oranionic surfactant alone is required to reach a constantsurface tension value. The break point between a steeplydescending and fairly constant branch of a c versus log ccurve for a mixed solution corresponds to the precipi-tation of the catanionic surfactant, CTADS.
By applying regular solution theory, the compositionof the mixed monolayer, the surface activity coe�cients,the molecular interaction parameter and the change ofstandard mixing enthalpy for equimolar mixtures werecalculated using a surface tension value of 40 mN m)1
as the standard state. The results presented in Table 1show almost equimolar monolayer formation withactivity coe�cient values much less than unity indicatinga large deviation from ideality. The formation of anequimolar adsorption ®lm is in accord with the literaturedata [10, 34]. According to its de®nition, a negative bmon
value is related to attractive molecular interactions in themixed monolayer. The relatively high negative value ofbmon indicates a strong attractive interaction betweenadsorbed CTA+ and DS) ions.
The maximum surface excess concentrations of eachsurfactant and their equimolar mixtures obtained fromthe premicellar slope of the surface tension-concentra-tion curve are presented in Table 2. The smaller Gmax
and consequently higher Amin for a single NaDSmolecule compared with those for a single CTABmolecule are due to the smaller surface activity ofNaDS. The addition of an oppositely charged surfactantincreased Gmax, i.e. packing at the air/water interface wasenhanced.
Changes in the surface tension with surfactantconcentration in the series of mixtures with constantNaDS and varying CTAB concentrations and vice versawere used for determination of the premicellar slope.Addition of a small quantity of an oppositely chargedsurfactant shifts the premicellar slope of mixturestowards higher values. The changes in Gmax of CTABor NaDS are presented in Fig. 2. Both curves, Gmax
(CTAB) and Gmax (NaDS) versus concentration revealedthat the addition of an oppositely charged surfactantenhanced the maximum concentration which CTAB orNaDS can attain at the air/solution interface.
The maximum adsorption of either surfactant in amixed adsorption ®lm is in¯uenced by the e�ectiveheadgroup area of each single surfactant and by theinteraction between them at the interface. The increaseof Gmax and the decrease of Amin are the results of strongelectrostatic attraction between oppositely chargedheadgroups. Each component occupies a greater areaper molecule due to electrostatic repulsion, while thepresence of oppositely charged surfactants reduces therepulsion between headgroups and the area per moleculedecreases.
Bulk properties: association and precipitation
The solution properties of CTAB/NaDS mixtures ex-hibited complex phase behavior over the entire concen-tration range. Figure 3 shows the precipitation/solubility boundary and the decrease of the cmc of bothCTAB and NaDS with the addition of an oppositelycharged surfactant. Inside the precipitation region aphase transition from turbid to isotropic was observedwhen one of the surfactants was continuously added tothe equimolar mixtures.
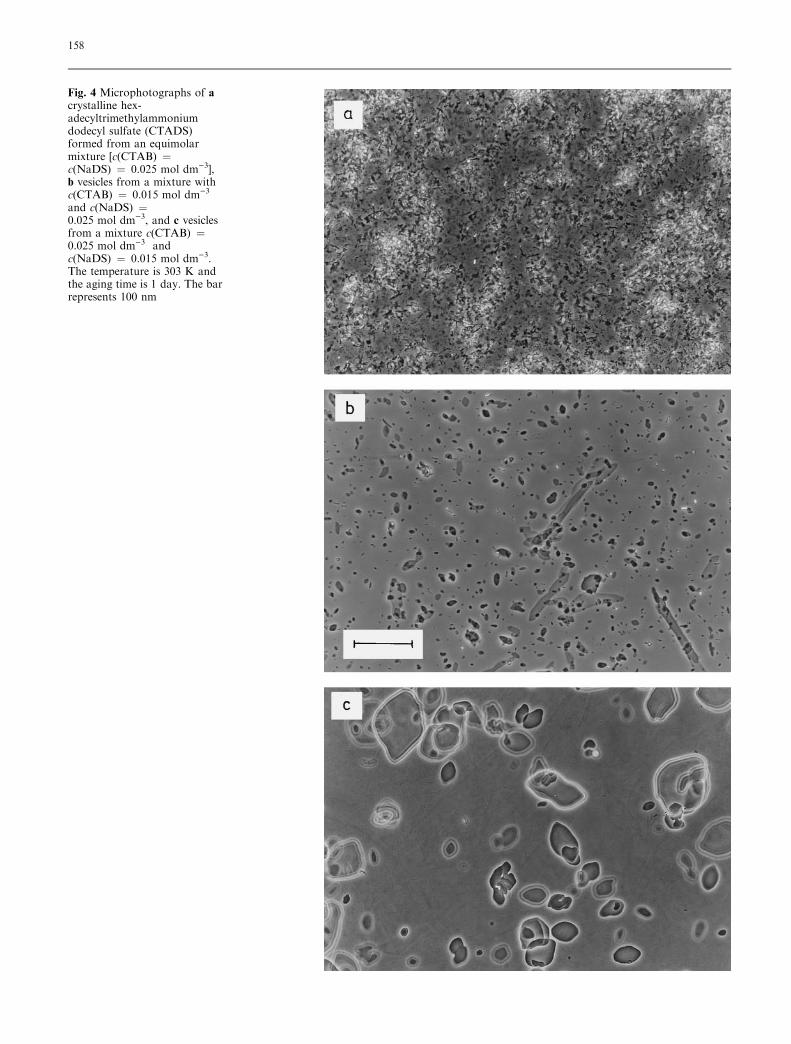
The phase separation process was observed above themolar ratio of surfactants ³0.01. Examination ofsamples from the turbid region by light microscopyshowed heterogeneous mixtures of irregularly shapedcrystals (Fig. 4a) and slightly anisotropic spherical andellipsoidal structures (Fig. 4b, c). Under polarized lightthe appearance of spherulites with Maltese crosses wasobserved. The crystalline phase was identi®ed as thecatanionic surfactant salt, CTADS [36]. Microscopicexamination revealed the presence of vesicles, but nofurther information could be obtained regarding vesic-ular morphology, i.e. whether vesicles are unilamellar ormultilamellar. The fraction of the solid crystalline phasedecreases as the sample composition deviates from theequimolar line.
Two cross-sections were examined by microelectro-phoretic and QELS measurements; with a constantc(CTAB) � 1 ´ 10)4 mol dm)3 and varying c(NaDS)or with a constant c(NaDS) � 1 ´ 10)4 mol dm)3 andvarying c(CTAB). The results of microelectrophoreticmeasurements are illustrated in Fig. 5. The f potentialvaried in relation to the surfactant concentration and themolar ratio. The reversal of particle charge almostcoincided with equimolar mixtures. The particles were
Table 1 Surface mole fraction of sodium dodecyl sulfate (NaDS)in a mixed monolayer, XNaDS, activity coe�cients of NaDS, fNaDS,and of hexadecyltrimethylammonium bromide (CTAB), fCTAB, the
monolayer interaction parameter, bmon, and the excess enthalpy ofmixing, DHE, in a CTAB/NaDS equimolar mixture at the standardsurface tension c = 40.0 mN m)1. Temperature is 303 K
XNaDS fNaDS fCTAB bmon DHE/kJ mol)1
0.48 0.001 0.003 )25.2 )15.8
156
positively charged in the mixtures with CTAB in excessand vice versa. The charge of the particles and the fpotential depended on the relative amounts of eachsurfactant. Microelectrophoretic measurements con-®rmed a surfactant molar ratio-induced change in thevesicle composition. This di�erence in compositionresulted in changes of surface charge density and thedegree of the counterion dissociation.
QELS measurements showed a bimodal particle sizedistribution for the system from the turbid region.Table 3 provides representative examples of how turbidsystems were analyzed by two-component analysis. Twodi�erent cross-sections corresponding to the constantconcentration of one surfactant with increasing concen-tration of the other are shown. At the equimolarconcentration the polydispersity, V, is high (V >100%) because of two separate populations: vesicles(d1 � 620 nm) and crystalline particles (d2 �8000 nm). On both cross-sections, polydispersities ofparticle populations increased up to the equimolar rangeand then decreased with the increase in concentration ofone of the surfactants. Mixtures with high excess ofeither cationic or anionic surfactant appeared to containvesicles only. The mean hydrodynamic diameter ofvesicles and the mean crystallite size changed in a similarway. Vesicles, characterized by relatively large diameters(ranging from 200 to 700 nm), coexisted with a smallerpopulation of crystallites (ranging from 4000 to9500 nm). NaDS-rich vesicles (overall negative charge)were somewhat smaller than CTAB-rich vesicles (overall
positive charge). The method cannot give the exact sizeof the largest particles, i.e. crystallites. At high excess ofeither CTAB or NaDS, the number of crystallites was solow (£1) that it was impossible to resolve them in thenumber distribution. The relative proportions (byweight) of the two species vary in relation to thesurfactant molar ratio. The fraction of vesicles increasedgradually as mixtures shifted from the equimolar range,while the fraction of crystallite decreased suggesting thatcrystallites are being progressively converted to vesicles.
The mean hydrodynamic diameters of vesicles forboth cross-sections are shown in Fig. 6. The apparent
Table 2 Maximum surface excess, Gmax, at the air/solution inter-face of single surfactants, CTAB and NaDS, and their equimolarmixture. Temperature is 303 K and the aging time is 1 day
System Gmax ´ 106/mol m)2
CTAB 2.48NaDS 2.10CTAB + NaDS 2.80
Fig. 2 Surface excess concen-tration, Gmax, at the air/solutioninterfaces vs c in mixtures withconstant c(NaDS) and increas-ing c(CTAB) (s), or constantc(CTAB) and increasingc(NaDS) (d). The temperatureis 303 K and the aging time is1 day
Fig. 3 Phase boundaries observed in NaDS and CTABmixtures. Thesolid line corresponds to the clear/turbid boundary; dotted linescorrespond to the change of the cmc of the surfactant in excess. Theequimolar line is denoted as dashed line. The temperature is 303 K andthe aging time is 1 day
157
Fig. 4 Microphotographs of acrystalline hex-adecyltrimethylammoniumdodecyl sulfate (CTADS)formed from an equimolarmixture [c(CTAB) �c(NaDS) � 0.025 mol dm)3],b vesicles from a mixture withc(CTAB) � 0.015 mol dm)3
and c(NaDS) �0.025 mol dm)3, and c vesiclesfrom a mixture c(CTAB) �0.025 mol dm)3 andc(NaDS) � 0.015 mol dm)3.The temperature is 303 K andthe aging time is 1 day. The barrepresents 100 nm
158
vesicular size changed with mixture composition. Themean vesicle size is highest at the equimolar ratio anddecreases on either side of the equimolar line. Micro-electrophoretic results revealed that vesicles are posi-tively and negatively charged, respectively. Similargeneral changes in the apparent sizes were also observedwith larger particles, i.e. crystallites (Fig. 7).
At a very high excess of one of the surfactants, thesystems became clear due to mixed micelle formation.The phase boundaries between monomers and mixedmicelles were obtained from speci®c conductivity mea-
surements by determining the shift of the cmc (CTAB)with NaDS addition or the shift of the cmc (NaDS) withCTAB addition, respectively. Mixed micelles wereformed only with a high excess of one of the surfactants.For CTAB/NaDS mixed micelles, the cmc decreased in alinear fashion with increasing concentration of a coun-terpart surfactant (Fig. 3). It can be seen that thedependence of the cmc (NaDS) as a function ofc(CTAB) is linear (slope 0.05) which di�ers from theslope of the cmc (CTAB) as a function of c(NaDS)(slope 0.18). The cmc values show a negative deviation
Fig. 5 Zeta potential (f) vs c inCTAB/NaDS mixtures with in-creasing CTAB concentrationand constant c(NaDS) �1 ´ 10)4 mol dm)3 (s), andwith increasing NaDS concen-tration and constantc(CTAB) � 1 ´ 10)4 moldm)3 (d). The temperature is303 K and the aging time is1 day
Table 3 Mean hydrodynamic vesicle diameter, d1, mean crystallitesize, d2, corresponding relative proportions % by weight of parti-cles for systems a with constant concentration of CTAB
[c(CTAB) = 1 ´ 10)4 mol dm)3] and varying NaDS and b withconstant NaDS [c(NaDS) = 1 ´ 10)4 mol dm)3], and varyingCTAB. V indicates the polydispersity of particle populations
a [CTAB]/mol dm)3 d1/nm % by weight d2/nm % by weight V/%
from ideality compared with values calculated from theideal mixing model, i.e. the formation of mixed micellesis enhanced. The nonideal behavior of surfactants inmixed micelles was evaluated by using the model ofRubingh [32]. It should be noted that the absolute valueof bmic was unusually low for CTAB/NaDS surfactantmixtures (about 5) and not constant as predicted by themodel. The value of bmic decreased with increasingconcentration of either CTAB or NaDS. Despite apossible large error in the calculation of bmic (theaccuracy of determination is diminished by high asym-metry in the mixture composition [36]), low and variablebmic values appear to be a consequence of a smallquantity of crystalline particles still remaining in themicellar region.
Mixed micelles formed in mixtures with a high CTABcontent show a very small increase in aBr values(Table 4) indicating almost no change in the surfacecharge density with the addition of NaDS. It can beeasily observed that the tendency of increasing a valuesas a function of the concentration of oppositely chargedsurfactants di�ers between bromide and sodium count-erions; the increase in the aNa value is greater than theincrease in the aBr value. This is attributed to eitherdi�erences in micellar size or di�erences in interactionsbetween headgroups and counterions [5]. The di�erencein ionization between NaDS and CTAB pure micellesmust somehow relate to the di�erence in the nature ofthe interacting species -O-SOÿ3 and Na+ on one side,and )N+(CH)3 and Br) on the other. The Br) and Na+
ions do not bind in the same way due to their di�erencein polarizability.
Discussion
Surfactant molecules can form various supramolecularstructures in aqueous solution, which are not covalentlybonded, but are stabilized by the weaker hydrophobicinteractions. It has been demonstrated that the molec-ular structure of a surfactant molecule, i.e. geometricalfactors, primarily determines the most favored structureof surfactant supramolecules [38]. The geometric con-siderations are based on the packing parameter, given byv/al, where v is the volume of the hydrophobic tail(s), a isthe e�ective area per headgroup, and l is the length ofthe hydrophobic tail(s). The packing parameter can beexpressed in terms of interfacial curvatures and viceversa. It has been demonstrated that aggregates of highcurvature are formed by surfactants with low packingparameters, whereas aggregates of lower curvature areformed by surfactants with high packing parameters.When the spontaneous curvature of the surfactantinterface is of the order of the surfactant molecule size,micellar aggregates are favored. For small curvaturesplanar bilayers or vesicles are more stable than micelles[39, 40].
It is assumed [41] that the e�ective headgroup area atthe air/solution interface is the same as on the surfactantaggregate/solution interface. The e�ective area of thepolar headgroup at the air/solution interface in theCTAB/NaDS equimolar mixture is reduced in compar-ison to that of a single surfactant system due to theformation of ionic pairs between cationic and anionicheadgroups. Therefore, a mixture of cationic andanionic surfactants can be considered as a double-tailedsurfactant that is easily able to form bilayers in solution.
Fig. 6 Mean vesicle hydrody-namic diameter, d1, vs c fortwo cross-sections with con-stant c(CTAB) � 1 ´ 10)4
mol dm)3 (d), or c(NaDS)� 1 ´ 10)4 mol dm)3 (s), re-spectively. The temperature is303 K and the aging time is1 day
160
Due to very close packing of the oppositely chargedheadgroups the e�ective hydrophobic volume will alsobe larger compared to average volumes of the singlesurfactants, i.e. the e�ective size of the headgroupdecreases but must accommodate roughly twice thehydrophobic volume. These two e�ects increase thee�ective packing parameter and promote the formationof a planar lamellar structure. As the surfactant molarratio moves away from the equimolar composition, theunpaired surfactants in the bilayer create a surfacecharge density, i.e. the electrostatic repulsion within the
headgroup region grows. These repulsions favor themicrostructure that best allows larger e�ective head-group areas, such as vesicles and mixed micelles. This isexactly the structural transition that is observed inCTAB/NaDS mixtures.
Recently, we have found that in cationic/anionicsurfactant mixtures with symmetric alkyl chains acrystalline catanionic surfactant precipitate is formedover a wide range of compositions, while the vesiclephase is formed in a relatively narrow range [3±6].Vesicles do not form in equimolar mixtures. On thecontrary, in mixtures with an asymmetric alkyl chain thevesicle phase is considerably enlarged and vesicles wereobserved even in equimolar mixtures. This means thatthe asymmetric alkyl chains cannot pack so e�cientlyinto crystalline lattices as symmetric alkyl chains. Whena lamellar structure is composed of surfactants withdi�erent chain lengths, the aggregate properties may betreated in terms of a certain mean packing parameterintermediate between those of individual components[38]. The size of a curved structure may thus be increasedor decreased by adding an appropriate amount ofanother component whose packing parameter is largeror smaller. The spacing between adjacent surfactantmolecules increases proportionally with the di�erence inthe chain length of the mixed surfactant. Although thesechanges are very small, they have a very large e�ectupon aggregate properties. A di�erent chain lengthresults in a looser packing of an aggregate.
Even small deviations from equimolar samples had adramatic in¯uence on the system due to the electrostaticbalance disturbance at the aggregate/solution interfaceand the packing of hydrophobic tails in the bilayer. Inthe nonequimolar samples the attractive forces were
Fig. 7 Mean crystallite size, d2,vs c for two cross-sections withconstant c(CTAB) � 1 ´ 10)4
mol dm)3 (d), or c(NaDS) �1 ´ 10)4 mol dm)3 (s), respec-tively. The temperature is303 K and the aging time is1 day
Table 4 a Apparent degree of bromide ion dissociation, aBr, frommixed micelles formed in mixtures with constant c(NaDS) andvarying c(CTAB) and b apparent degree of sodium ion dissocia-tion, aNa, from mixed micelle formed in mixtures with constantc(CTAB) and varying c(NaDS) calculated from conductivity (I)and potentiometric measurements (II). Temperature is 303 K
weaker and less packed supramolecular structures weremainly found. The fraction of the planar and curvedlamellar phase was altered by the total surfactantconcentration and by the mixing ratio of the twosurfactants. The maximum vesicle and crystallite sizeswere recorded at equimolar conditions. Vesicles de-creased in size with either increase or decrease of thesurfactant molar ratio.
Yuet and Blankschtein [18] showed that the freeenergy of vesicle formation is a sum of several energycontributions: the transfer free energy, the packing freeenergy, the interfacial free energy, the steric free energy,and the electrostatic free energy. By using the molecular-thermodynamic approach they have studied the role ofasymmetry between hydrophobic tails in the formationand stability of vesicles composed of cationic andanionic surfactants. They found that chain packing inthe vesicle bilayer has an important e�ect on the freeenergy of vesicle formation. A mixed surfactant vesiclecan be stabilized energetically in highly asymmetricsurfactant mixtures, but when the tail-length asymmetryis small, vesicles are stabilized entropically. Vesicleswhich are stabilized energetically have a lower freeenergy of vesiculation than planar bilayers, thus makingthem more energetically favorable. Surfactant tail-lengthasymmetry also a�ects the optimum composition of a
vesicle by altering the tail-transfer energy contribution.In highly asymmetric mixtures the optimum vesiclecomposition re¯ects a compromise between entropic andenergetic factors. With decreasing surfactant tail-lengthasymmetry, the energetic contribution to the composi-tion distribution is decreased via a reduction in tail-transfer energy [18, 19].
In conclusion, the main factors a�ecting the transi-tion from a planar to a curved bilayer in asymmetriccationic/anionic surfactant mixtures comprise electro-static interactions between the surfactant headgroupsand chain packing. The e�ective area per headgroupincreases as mixtures shifted from the equimolar rangedue to the change in the electrostatic interactions fromattractive to repulsive. The net e�ect is a decrease in thepacking parameter and the promotion of a curvedlamellar structure. When a curved lamellar structure iscomposed of surfactants with di�erent chain lengths, thespacing between the adjacent surfactant moleculesincreases proportionally to the di�erence in the chainlength of mixed surfactants.
Acknowledgements The ®nancial support of the Ministry ofScience, Technology and Informatics of the Republic of Croatia(Grant 0098602) is gratefully acknowledged.