Adsorption equilibria on activated carbon of phenol, p-cresol, and p-nitroaniline in aqueous solutions V. BÁLEŠ, D. BOBOK, and E. KOSSACZKÝ Department of Chemical Engineering, Slovak Technical University, CS-812 37 Bratislava Received 18 December 1981 Accepted for publication 2 November 1982 The equilibrium concentrations of phenol, p-cresol, and p-nitroaniline in aqueous solutions adsorbed on activated carbon GA-01 were experimentally determined and tested by the Langmuir isotherm. The reason for the deviations of experimental data from the Langmuir model is discussed. The adsorption equilibrium data may be correlated by the Langmuir model of two-component adsorption for the mixture of p-cresol and p-nitroaniline up to the concentra- tion of 150 mgdm" 3 . Экспериментальным путем определены равновесные концентрации фенола, /т-крезола и л-нитроанилина адсорбированных из водных рас- творов на активном угле GA-01 были испытаны изотермой Лэнгмюра. Обсуждаются причины расхождений экспериментальных данных с моде- лью Лэнгмюра. Что касается смеси п-крезола и л-нитроанилина до весо- вой концентрации 150 мг дм~ 3 возможно адсорбционные равновесные данные коррелировать с двухкомпонентной адсорбцией по модели Лэнг- мюра. The increasing number of synthetically produced organic substances on indus- trial scale brings about proportional increase in the number and quantity of these substances in waste water, which results in increasing of its toxicity and car- cinogenicity. One of the methods of removing organic substances occurring in small quantities in water is adsorption of these substances on activated carbon. In the last decade, a considerable growth in industrial application of adsorption in the process of waste-water purification [1, 2] is to be observed. The adsorption equilibria belong to the basic data necessary for calculation and design of adsorption equipment. This paper deals with the study of adsorption Chcm. zvesti 37 (3) 28У—2У6 (1УКЗ) 289
Transcript
Adsorption equilibria on activated carbon of phenol, p-cresol, and p-nitroaniline in aqueous solutions
V. BÁLEŠ, D. BOBOK, and E. KOSSACZKÝ
Department of Chemical Engineering, Slovak Technical University, CS-812 37 Bratislava
Received 18 December 1981
Accepted for publication 2 November 1982
The equilibrium concentrations of phenol, p-cresol, and p-nitroaniline in aqueous solutions adsorbed on activated carbon GA-01 were experimentally determined and tested by the Langmuir isotherm. The reason for the deviations of experimental data from the Langmuir model is discussed. The adsorption equilibrium data may be correlated by the Langmuir model of two-component adsorption for the mixture of p-cresol and p-nitroaniline up to the concentration of 150 mgdm"3.
Экспериментальным путем определены равновесные концентрации фенола, /т-крезола и л-нитроанилина адсорбированных из водных растворов на активном угле GA-01 были испытаны изотермой Лэнгмюра. Обсуждаются причины расхождений экспериментальных данных с моделью Лэнгмюра. Что касается смеси п-крезола и л-нитроанилина до весовой концентрации 150 мг дм~3 возможно адсорбционные равновесные данные коррелировать с двухкомпонентной адсорбцией по модели Лэнгмюра.
The increasing number of synthetically produced organic substances on industrial scale brings about proportional increase in the number and quantity of these substances in waste water, which results in increasing of its toxicity and carcinogenicity. One of the methods of removing organic substances occurring in small quantities in water is adsorption of these substances on activated carbon. In the last decade, a considerable growth in industrial application of adsorption in the process of waste-water purification [1, 2] is to be observed.
The adsorption equilibria belong to the basic data necessary for calculation and design of adsorption equipment. This paper deals with the study of adsorption
Chcm. zvesti 37 (3) 28У—2У6 (1УКЗ) 289
V BAI.K.Š. D ВОВОК. Г.. KOSSACZKY
equilibria of phenol, p-cresol, p-nitroaniline and their mixtures on activated
carbon G A - 0 1 . These substances frequently occur in waste waters.
Experimental
Chemicals
Phenol of anal, grade, redistilled, /7-cresol of anal, grade, redistilled, and anal, grade /j-nitroaniline have been used.
Phenol and /7-cresol are very hygroscopic substances. Therefore they were redistilled and used for immediate preparation of concentrated solutions from which the solutions for measurements were prepared. The solubility of these substances in water at 25 °C is according to literature 93 g dm"3 for phenol (PH) [3], 194 g dm"3 for p-cresol (PC) [4], and 0.8 g dm"3 for /?-nitroaniline (PNA) [4]. We remark, however, that we did not succeed in preparing an aqueous solution of PNA with mass concentration higher than 0.5 g dm - 3 at 25 °C.
Commercial activated carbon GA-01 was used as adsorbent. The granulated activated carbon was crushed, washed with hot water at 90—100 °C and dried at 120 °C. The physical properties of activated carbon GA-01 are given in paper [5].
The adsorption equilibria were established by contacting the sample with a known quantity of activated carbon: 0.1 — 1 g of carbon with 500 ml of a solution of the organic substance of known concentration. The content of a flask was stirred at 20 ± 0.2 °C. The establishment of equilibrium took 10 days. It is evident from Fig. 1 in which the adsorption data concerning the mixture PC.PNA = 2:1 (mass ratio) are represented for different time intervals. After 240 h, the concentration of components in the solution did not change. A slow rate of establishment of equilibria was also observed for phenol and o-chlorophenol by Peel [6|.
600 | 1 1 1 1 I
Fig. 1. Adsorption data for PC and PNA in mixture (mass ratio 2:1) after a) 24 h, b) 72 h, c) 240 h. Index 1 denotes PC, index 2 denotes PNA.
290 Chcm. /vesti .í7(3) 280—206 ( H>NJ)
ADSORPTION EQUILIBRIA
Method of analysis
After establishment of equilibrium, the concentration of phenol was determined refrac-tometrically. We used an immersion refractometer (Zeiss, Jena) which enabled us to determine the index of refraction with six valid figures. The index of refraction of pure phenol for the line of Na is 1.55093 [7] at 20 °C.
The concentrations of p-cresol, p-nitroaniline, and their mixtures in solutions were measured with a spectral photometer Specord UV VIS (Zeiss, Jena), the width of cell being 10.02 mm. The measurements were performed with adsorption maximum [3] of p-nitro-aniline at 380 nm and of p-cresol at 271 nm [3].
The adsorbed quantity of organic substance was calculated from material balance
(co-c)V M U)
The adsorption isotherms of phenol, p-cresol, and p-nitroaniline on activated carbon GA-01 found experimentally at 20 °C are represented in Fig. 2a and Fig. 2b. The
E
0 1000 2000 e/ímg dm"J)
Fig. 2a. Adsorption isotherm of phenol in aqueous solution on activated carbon GA-01 at 20 °C.
500
400
7o> 300
^ 200 о
-/ é
100 и
0
\У** • ̂
_ _ , '»° '
2^-г~~~
I I
-
" -
-
50 100 150 c/(mg dm"'
Fig. 2b. Adsorption isotherms of p-nitroaniline (•) and p-cresol (O) on activated carbon GA-01 at 20 °C.
Chem. zvesti .17(3) 289—296 (19K3) 291
V RALFS. ľ). BOBOK. \: KOSSAC/.KY
600
^ 400 o>
"o 200
.
.
~£ i
1
ř̂* 1
oa^-o
i
o
1
o o
_
-
50 100 c/(mg dm" 3 )
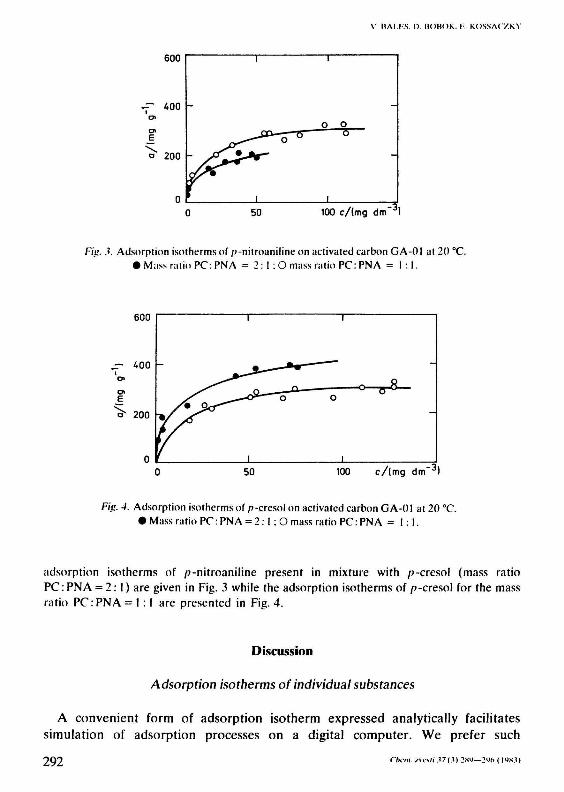
Fig. 3. Adsorption isotherms of />-nitroaniIine on activated carbon GA-01 at 20 °C. • Mass ratio PC: PNA = 2 : 1 : О mass ratio PC: PNA = 1 : 1 .
600
~ 400
o»
"o4 200
0
• » /
/*• 2<f^—
i
-oP Ö
1
1
о
1
_ Ä -o
-
-
50 100 c / (mg dm"3 )
Fig. 4. Adsorption isotherms of /j-cresol on activated carbon GA-01 at 20 °C. • Mass ratio PC: PNA = 2: I : О mass ratio PC: PNA = 1:1.
adsorption isotherms of /7-nitroaniline present in mixture with />-cresol (mass ratio PC:PNA = 2:1) are given in Fig. 3 while the adsorption isotherms of /7-cresol for the mass ratio PC:PNA = 1:1 are presented in Fig. 4.
Discussion
Adsorption isotherms of individual substances
A convenient form of adsorption isotherm expressed analytically facilitates simulation of adsorption processes on a digital computer. We prefer such
292 Chcm. svcsti 17(1) 2ХЧ—2Vh (|i>HJ)
ADSORPTION KQUIl.IßKIA
mathematical formulations of adsorption isotherms which do not much complicate mathematical solution of the system of differential equations describing the dynamics of adsorption.
Besides the simplest but most precise equilibrium relationships such as the Henry law, the Langmuir isotherm is very frequently used in calculations
а = "тТТы- (2)
The constants atu and b of the Langmuir isotherm cannot be always so evaluated that the equation is consistent with measured data with sufficient precision over the whole concentration range.
The constants of eqn (2) were calculated for solutions of pure substances after linearization of eqn (2) by the method of least squares. The calculated constants are given in Table 1 which also shows the values of correlation coefficient r and standard deviations.
Table 1
Substance
Phenol P-Cresol p-Nitroaniline
Constants in
я m
mgg '
676.2 500.1 529.1
the Í Langmuir isotherm
h dm1 mg '
0.00145 0.0773 0.0291
ô
0.256 0.696 0.539
0.9563 0.9465 0.9654
The values of standard deviation and of correlation coefficient show that the Langmuir adsorption isotherm is very well in conformity with the measured equilibrium data. The deviations from the Langmuir equation of adsorption isotherm (smaller value of correlation coefficients) may be analyzed by means of the course of the Graham function К depending on the degree of filling of activated carbon. The Graham function [8] is defined by the equation
K = (F=I)7 W where в = а/ат is the degree of filling of activated carbon. Eqn (3) may be derived from the idea that adsorption has the character of chemical reaction of a substance with the solid surface. If К changes with increasing value of 0 , it means, that the system deviates from ideality and from the Langmuir model of the mechanism of adsorption. In principle, the nonideality of system may be due to interaction between adsorbed molecules, mobility of adsorbate, and heterogeneity of adsor-
Chcm. zvesti Л 7 (3) 289—296 (19S3) 293
V. BALES, D. BOBOK. E. KOSSACZKY
Fig. 5. Graham function for the solution of phenol (O), p-nitroaniline (•) , and p-cresol (D).
bent surface. The course of the Graham function for smoothed data of PH, PNA, and PC is plotted in Fig. 5. It can be seen that the course of this function for PNA and PC is similar. As evident from Fig. 5, the heterogeneity of the surface of adsorbent and the mobility of the molecules of adsorbate manifest themselves up to the values of 0 equal to 0.7—0.8. Over the value of the degree of filling 0.85 the influence of interactions of adsorbate is more significant and manifests itself in a slight rise of the Graham function. The Graham function for phenol exhibits monotonie course and slowly increases with the degree of filling. That can be related to the increasing influence of the interactions of adsorbate molecules. However, there are not available data at a higher degree of filling for which this effect should be likely more conspicuous.
Adsorption isotherms of the binary mixture p-cresol—p-nitroaniline
Similarly as the adsorption isotherms of pure substances, the adsorption isotherms of the p-cresol—p-nitroaniline mixture with mass ratio 1:1 were correlated with the Langmuir adsorption isotherm for binary mixtures
tfi = flm,fe|Ci
1 + b\C\ + h2c2 (4)
dr> = ilmlbzCz
1 + b\C\ + b2c2 (5)
The adsorbed quantity expressed in gg"1 was transformed by calculation in mmolg"1 and the equilibrium concentration of components in the mixture was expressed in mmol dm"3. The data thus adjusted were used for calculating the
294 Chcm. zvesti 37(3) 289—296 (1983)
ADSORPTION EQUILIBRIA
values of the constants </,„,, atn2, />i, ft- by means of the simplex method o\' minimization of the chosen purpose function. The purpose function was chosen in the form
The calculated values are as follows (index 1 for PNA, index 2 for PC)
</,„, =4.98 mmol g \ /?, =3.53 dm 'mmo l '
«,„2 = 6.62 mmol g " ' , b2 = 2.69 dm' mmol '
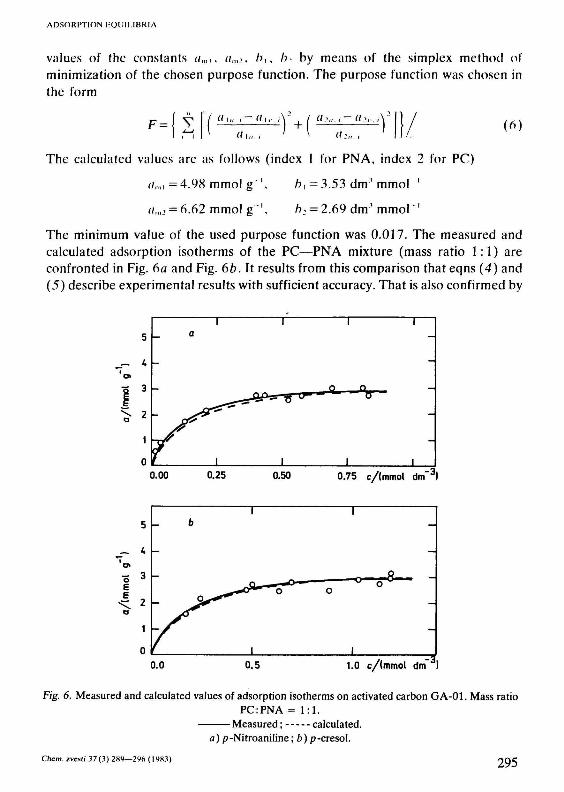
The minimum value of the used purpose function was 0.017. The measured and calculated adsorption isotherms of the PC—PNA mixture (mass ratio 1:1) are confronted in Fig. 6a and Fig. 6b. It results from this comparison that eqns (4) and (5) describe experimental results with sufficient accuracy. That is also confirmed by
o.oo 0.25 0.50 0.75 c/(mmol dm"J)
1.0 c/(mmol dm" )
Fig. 6. Measured and calculated values of adsorption isotherms on activated carbon GA-01. Mass ratio PCrPNA = 1 : 1 .
Measured; calculated. a) p-Nitroaniline; b) p-cresol.
Chem. zvesti 37(3) 289—296 (1983) 295
V. BÁLEŠ. D. BOBOK. E. KOSSACZKY
the values of standard deviations ô, = 0.051 and ô2 = 0.062 as well as the values of
It is obvious from Fig. 6a and Fig. 6b that the adsorption isotherms of PC and
PNA in mixture exhibit similar course. The adsorbed amounts of both substances
are almost equal. Therefore we cannot assume preferential adsorption of any
component of the mixture.
Symbols
a concentration of adsorbate on adsorbent m g g _ 1
am constant of the Langmuir isotherm mgg - 1
aiH measured concentrat ion of adsorba te on adsorbent mmol g"1
ait, calculated concentrat ion of adsorba te on adsorbent mmol g"1
b, bx, b2 constants in the Langmuir isotherm dm 3 mg"1
с concentrat ion of adsorptive in solution mg d m " 3
c„ initial concentrat ion of adsorptive mg d m - 3
К G r a h a m function d m 3 mg" 1
M weighed a m o u n t of adsorbent g N n u m b e r of data r correlat ion coefficient V volume of solution d m 3
ô s tandard deviation 0 degree of surface filling
References
1. Cheremisinoff, P. N. and Eilerbusch, F., Carbon Adsorption Handbook. Ann Arbor Science, 1978. 2. Suffet, H. I. and McGuire, J. M., Activated Carbon Adsorption of Organics from the Aqueous
Phase. Ann Arbor Science, 1980. 3. Dobbs, R. and Cohen, J. M., Carbon Adsorption Isotherms for Toxic Organic. Report EPA, 1980. 4. Perelman, V. L, Malá chemická příručka. (Small Chemical Manual.) Státní nakladatelství technické
literatury. (State Publishing House of Technical Literatuře.) Prague, 1954. 5. Aktívne uhlie. (Activated Carbon.) (Catalogue of SLZ, N. E.) Hnúšťa, 1979. 6. Peel, R. G. and Benedek, A., Environ. Sei. Technol. 14, 67 (1980). 7. Ridick, J. A. and Bunger, W. В., Organic Solvents. J. Wiley & Sons, New York, 1970. 8. Graham, D., Chem. Eng. Progr., Symp. Ser. 55, 17 (1959).


![Adsorption and equilibrium studies of phenol and para ...eeer.org/upload/eer-2019-238.pdf · in water bodies [5] Phenol and PNP pose serious harm to the organ-isms at very low concentrations.](https://static.documents.pub/doc/80x56/60797612a28a38406b4f4354/adsorption-and-equilibrium-studies-of-phenol-and-para-eeerorguploadeer-2019-238pdf.jpg)


