Surface Science 151 (1985) 221-250 North-Holland, Amsterdam 221 ADSOR~ION SPE~OSCOPY BY POLARITON-INDUCED DESORPTION (ASPID) Jeslis REYES Departamento de Flsica, Institute de Ciencias, Uniuersidad Autbnoma de Puebla, Apartado Postal J-48, Puebla, Puebla, M&co and Frank 0. GOODMAN * and Milton W. COLE Department of Physics, The Pennsylvania State University, University Park, Pennsylvania 16802, US‘l Received 16 June 1984; accepted for publication 5 September 1984 A new spectroscopic technique is proposed as a means of determining the energy and momentum of adsorbed atoms and molecules. The method, abbreviated to ASPID {adso~tion spectroscopy by pdariton-induced desorption), uses surface phonon polaritons (SPPs) to desorb atoms. Because one may create nearly-monoenergetic SPPs, the binding energy range is determined directly from the spectrum of final energies. A ~nematieal analysis may be used to analyze adatom momenta, and hence band structures. The angular distribution of the SPP-desorbed atoms may be used to monitor adsorbed-film temperature. We provide an estimate of the SPP desorption rate, and conclude that the proposed experiment is feasible. 1. In~~uction The field ion microscope is capable of determining the positions and identities of a variety of atoms adsorbed on a variety of surfaces [1,2]. In contrast, there does not exist a means of obtaining directly such complemen- tary information as energy and momentum of adsorbed atoms. in the present paper, we propose an expe~mental technique for det~nin~ such properties: if successful, the technique may be used to measure energies of adsorption on both perfect and imperfect surfaces, to probe the energy band-structure of adatoms f3,4], and to assess the thermal evolution of nonequilibrium films * Also Department of Chemistry at Penn. State. Permanent address: Department of Applied Mathematics and Department of Physics, University of Waterloo, Waterloo, Ontario, Canada N2L 3Gl. ~039-~~28/85/$03.30 0 Elsevier Science Publishers B.V. (North-Holland Physics Publishing Division)
Transcript
Surface Science 151 (1985) 221-250
North-Holland, Amsterdam 221
ADSOR~ION SPE~OSCOPY BY POLARITON-INDUCED DESORPTION (ASPID)
Jeslis REYES
Departamento de Flsica, Institute de Ciencias, Uniuersidad Autbnoma de Puebla, Apartado Postal
J-48, Puebla, Puebla, M&co
and
Frank 0. GOODMAN * and Milton W. COLE
Department of Physics, The Pennsylvania State University, University Park, Pennsylvania 16802,
US‘l
Received 16 June 1984; accepted for publication 5 September 1984
A new spectroscopic technique is proposed as a means of determining the energy and momentum of adsorbed atoms and molecules. The method, abbreviated to ASPID {adso~tion spectroscopy by pdariton-induced desorption), uses surface phonon polaritons (SPPs) to desorb atoms. Because one may create nearly-monoenergetic SPPs, the binding energy range is determined directly from the spectrum of final energies. A ~nematieal analysis may be used to analyze adatom momenta, and hence band structures. The angular distribution of the SPP-desorbed atoms may be used to monitor adsorbed-film temperature. We provide an estimate of the SPP desorption rate, and conclude that the proposed experiment is feasible.
1. In~~uction
The field ion microscope is capable of determining the positions and identities of a variety of atoms adsorbed on a variety of surfaces [1,2]. In contrast, there does not exist a means of obtaining directly such complemen- tary information as energy and momentum of adsorbed atoms. in the present paper, we propose an expe~mental technique for det~nin~ such properties: if successful, the technique may be used to measure energies of adsorption on both perfect and imperfect surfaces, to probe the energy band-structure of adatoms f3,4], and to assess the thermal evolution of nonequilibrium films
* Also Department of Chemistry at Penn. State. Permanent address: Department of Applied Mathematics and Department of Physics, University of Waterloo, Waterloo, Ontario, Canada N2L 3Gl.
[5-71. We note in advance that there is a qualitative distinction between the proposed technique and other techniques which either involve thermal averag- ing or require models for their interpretation (for example, desorption by photons, electrons [8], heat, and electric fields); these techniques leave much greater ambiguity in the interpretation of experimental data.
To facilitate discussion, we adopt the acronym ASPID, which stands for Adsorption Spectroscopy by Polariton-Induced Desorption. The basic idea behind ASPID is illustrated in fig. 1, and discussed briefly here, although a fuller discussion is given in section 2. A surface is illuminated by means of a laser so that many surface phonon polaritons (SPPs) are produced. These SPPs may couple (via their mechanical components) to adsorbed atoms, thereby
causing desorption of these atoms. Under appropriate experimental conditions, this effect may dominate the desorption process, and there should then be a direct relation between the measured desorption energy, E,, of an atom and its initial energy, E,, just before the desorption event: assuming a one-SPP process, we have
E, = Ei + AS2, (1.1)
where 0 is the SPP frequency and 2mh is the Planck constant. The formula (1.1) represents an energy spectroscopy of adatoms, allowing the initial energy to be determined from the measured E,.
Equally useful, perhaps, is a kind of momentum spectroscopy which is represented by the momentum analogue of (1.1):
K,=K,+G+Q, (1.2)
where K is the component, parallel to the surface, of the desorbing atom’s
n detector
‘SPPS
polor crystal
Fig. 1. The Otto geometry for exciting SPPs on an ionic or semiconductor crystal surface using the
technique for frustrated total internal reflection [9]; the resulting desorbed atoms are detected by a time-of-flight detector which may be rotated in the plane shown.
J. Reyes et al. / ASPID 223
wavevector k, that is k = (K, k,), G is a reciprocal lattice vector (RLV) of the (periodic) surface array, and Q is the SPP wavevector. In section 2 we estimate Q-’ to be of the order of 10 pm, and so Q may be safely neglected in (1.2), giving
Kf- K,+ G. 0.3)
The formulas (l.l)-(1.3) assume that no phonons other than the single (non-thermal) SPP participate in the desorption process, which may be a good approximation at low surface temperature T,. This statement brings us to the problem of the possible heating of the surface by decay of the SPPs into thermal phonons at the surface, and we try to address this problem in sections 5 and 6. In the event that (1.1) and (1.3) form an essentially correct desc~ption of the kinematics of ASPID, the maximum potential of the technique is realized, However, even if an assumption is violated, the technique may play a useful role; for example, a rough surface will lead to deviation from (1.2) for some desorption events. Then there will still persist a well-defined signature of the momentum-conse~ng fraction. In addition, energy conservation will still apply to the moments-nonconse~ng fraction.
The remainder of the paper is organized as follows: section 2 describes our conception of the proposed experiment; section 3 utilizes the kinematic condi- tions (1.1) and (1.3) which, in some cases, may provide particularly valuable information; section 4 presents a calculation of the SPP-induced desorption rate, and section 5 estimates a desorption rate due to thermal phonons; section 6 discusses the possible use of ASPID as a film thermometer; in section 7, some rough estimates of experimental quantities are made, and some necessary approximate inequalities are derived; our conclusions are drawn in section 8.
2. SPPs at a rn~i~-vacua interface
2. I. Properties of SPPs
We present here a brief summary of the essential properties of SPPs, referring readers to refs. [lo-121 for recent reviews; we shall also use some of the properties of bulk polaritons, which are reviewed in refs. [12] and 1131. SPPs are electromagnetically active surface vibrational modes; they are the analogue, for polar crystals, of surface plasmons on metals. The excitation is concentrated near the surface, decaying exponentially with distance from the surface into both the solid and the vacuum; it may propagate macroscopic distances along the surface if the surface is uniform and only weakly absorp- tive.
The SPPs are simultaneous solutions of the mechanical equations for the lattice dynamics of the ions and of Maxwell’s equations, which connect these
224 J. Reyes er al. / ASPID
displacements to the polarization field. Because of the coupling, the relevant frequency regime is of the order of the infinite-wavelength transverse optical mode frequency, wr. While the precise relationship is discussed below, we note here that the characteristic energy hf2 is of order lo-50 meV, which makes ASPID relevant to physisorbed, as opposed to chemisorbed, systems. Another quantity of importance is the SPP wavevector Q; its magnitude is of order @r/c, where c is the speed of light in vacuum, that is of order 10m5 A-‘. This is very small relative to the wavevector characterizing the adatom: at energy E, a 4He atom has a wavevector: k = 1.4( E/meV)‘12 A-‘.
In this limit of small Q, the two (&) ionic lattice vibrate against each other. If there is an electric field E, the relative displacement u (that is, the displacement of the negative ions minus that of the positive ions) is given by
(2.1)
where q is the charge on a proton, and f* is a reduced mass,
~=~“M,/(M,+M,)=M*/(1+17), (2.2)
where M,, and Mt, are the masses of the negative and positive ions, respectively, and where n is the corresponding mass ratio,
rl = M”/M P’ (2.3)
In section 4, we shall need the displacement U, of the negative ions; this is given from
@ = (1+ n)r+ (2.4)
and it follows from (2.1), (2.2) and (2.4) that
(2.5)
Where z is the direction normal to the surface, into the vacuum, with t = 0 defining the surface plane, and where r is position, that is r = (x, y, z), and t is time, the electric field E(r, t) in the vacuum (z > 0: the “inactive medium”) and in the crystal (t < 0: the “active medium”) may be written, for an SPP propagating in the x-direction, as follows [14]:
where E, is the amplitude of E, at the surface (z = 0); (2.6) serves to define the SPP “decay lengths”, L, and L. The (positive) quantities Q, L and L, are given from
L;=r2(9)L2= -+q/Q2= -[c(52)+l](c/S2)2, (2.7)
J. Reyes et al. / ASPID 225
where C(W) is the dielectric function of the crystal, which we assume to be real herein; if c(o) has a substantial imaginary part, the SPPs decay too quickly for them to be useful in ASPID. From (2.7) we deduce that SPPs may exist in a range of frequencies s2 such that
--oo <c(Q)< -1. (2.8)
The calculations of section 4 refer to an ionic crystal, in which case the simple harmonic oscillator model of the dielectric response gives
w;-w2 c(o)= 7
i 1 +-w 2 ((cc), (2.9)
where or is the longitudinal optical mode frequency and c( 00) is the infinite- frequency value of c( 0). It follows from (2.8) and (2.9) that the SPP frequency range is
w,cs2<ws, (2.10)
where os is such that t( ws) = - 1; that is, ws is given from either
[E(cc)+l]W;= [c(O)+l]oz,, (2.11a)
or
[e(m) + MO) Of= [c(O)+l]c(c+& (2.11b)
where c(O) is the zero-frequency value of t( 0).
2.2. Production of SPPs in a crystal
SPPs may be excited in several ways, the most convenient for our purposes being perhaps the method of Attenuated Total Reflection (ATR) in the Otto geometry [9], shown schematically in fig. 1. A laser beam, of suitable frequency 8, is incident, at angle a to the surface normal, onto a small region on the lower face of, and near the vertex of, a prism. The prism is made of a material with appropriate optical properties, for example transparency to the laser light and a suitable refractive index n; it is separated from the crystal by a distance 6, which is of the order of, but somewhat smaller than, the SPP vacuum decay length L,. Conditions are such that
nsina>l, (2.12)
and hence total internal reflection of the laser light at the prism-vacuum interface would normally occur. However, if conditions are right, the evanes- cent wave, due to the laser light, in the gap of width 8, is able to couple strongly to, and to excite, SPPs at the crystal surface (and the total internal reflection becomes frustrated). A necessary condition for this to occur is that the effective phase velocity, parallel to the surface, of the laser light be equal to
226 J. Rqves er al. / ASPID
the phase velocity of the SPPs. The effective phase velocity, parallel to the surface, of the laser light is (c/n)sin QL, and the phase velocity of the SPPs is Q/Q, giving
cQ/O=nsincu; (2.13)
it follows from (2.7) and (2.13) that we must have
f( 3) = [r(f2) + l] n2 sin%, (2.14)
which is consistent with (2.12) and which in fact determines (Y as a function of $2 (for given crystal and prism material).
2.3. Comments OR experimental design
The most complete information possible in this experiment is obtained by measuring the speeds and directions of the desorbing atoms. As discussed below, however, this is not necessary for all types of study. Thus, a determina- tion of the binding energy distribution does not require angular resolution, and the film thermometry application (section 6) does not need time-of-flight determination.
Naturally, ASPID may succeed only if the SPP-induced desorption rate is measurably large. For this, one needs sufficiently high laser intensity. SPP life-time, detector sensitivity, and number of adatoms. Some numerical esti- mates of the experimental requirements are provided in section 7, following calculations of desorption probability rates in sections 4 and 5.
If a speed analysis is desired, the experiment must be done in the pulsed mode. This necessitates, in turn, a means of replenishing the coverage. If the ambient pressure is low (in order to ensure free propagation of desorbing atoms), this will require an atomic source, which should coat the surface uniformly, unless the adatoms are quite mobile or they behave independently (so that any nonuniformity is inconsequential).
One of the most straightforward experiments to try is a deso~tion-threshold study. This would involve a variation of the SPP Frequency by varying the incident laser frequency and direction, which are coupled by (2.14); the
available range is about 20-40%, according to (2.10) and (2.11). Two types of process are probed by this frequency scan. The first is direct SPP desorption, the rate of which is calculated with a simple model in section 4; this process is readily distinguished from a two-step desorption sequence, involving excita- tions due to both an SPP and a thermal phonon. The second type of process is potentially vaiuabie as a probe of shallow bound states of the atom-surface interaction potential, which are otherwise difficult to observe (for example. in bound-state scattering resonances, because they couple only weakly to the periodic part of the potential).
To perform this threshold study, it is necessary to have the adsorption
J. Reyes et al. / ASPID 227
ground-state binding energy I,!$,] falling in the SPP range. While E, is not known for most physisorption systems, an empirical rule is presented in refs. [15] and [16]:
E. = - o.o7c3/43, (2.15)
where C, is the strength of the z-3 Van der Waals attraction. This coefficient is known for many systems, and is easily calculated for others [15-181. This will help the experimenter to choose an adsorption system such that the laser may be tuned through the desorption threshold.
3. ASPID kinetics
The kinematical description of the SPP desorption process is a simplified version of the conventional one-phonon theory of desorption [7]. The simplifi- cation arises from the facts that the SPP wavevector Q is negligible and that the SPP frequency assumes a unique value D given by the laser frequency. The conservation laws stated in section 1 thus yield a specific relation between the initial and final states of the desorbing atom. In the following, we consider the most comprehensive analysis possible, based on the one-SPP process and the conservation laws (1.1) and (1.3). Where 8 is the desorption polar angle (fig. I), and Ma is the mass of the desorbing atom, we have:
E, = ~2k~/2~~ = ~~‘~~/2~~~ cosec28, (3.1)
with the approximation (1.3) assumed here, the transition is vertical in the reduced-zone scheme. Fig. 2 shows this relationship, which is analogous to the case of optical absorption by electrons in solids.
A detector placed at polar angle fi (fig. 1) will detect only a specific ratio of lil: to E,, given from (3.1). This leads to a set of discrete final energies and corresponding flight times. Fig. 2 shows the type of transition which this detector may measure. We may illustrate the kinematical conditions with a specific example. Suppose that the surface array is square, with periodic length 1. Then the RLVs are given by
G = Gij = 2n(i, j)/l, (3.2)
where i and j are any integers. Now, any solution of the Schriidinger equation must satisfy the (2D) Bloch
condition, which implies that it can be written
J/cKn’(~)=~&@IPJ+ G), (3.3a) BG
where the cy# are constants, and where the ket I/3, K) is given by
IP,K)=A-“2~~(z)eiK’R, (3.3b)
228 J. Reyes et al. / ASPID
where the functions c#B~(z) form an orthogonal set, and where A is the surface area. The +a(~) may be chosen as the eigenfunctions of the surface-averaged potential V,(z). We denote a bound state of V,(z) by p = m = integer, and the energy eigenvalue of the ket 1 m, K) is
Ec!,=E,,,+h2K2/2Mg, (3.4)
where Em ( < 0) is the energy eigenvalue of the bound state m, and where the superscript (0) emphasizes the fact that we are discussing the unperturbed situation.
In the presence of a periodic potential, the eigenvalue problem may be solved by various techniques used commonly in electronic band structure calculations [3,4]. For the purpose of illustration, we consider here an example for which the nearly-free-particle model is applicable. This case of weak surface corrugation may be further simplified if there is a relatively large spacing between states of different m. Then, there is a band such that- only-a single term, /I = n, in the summation over j3 in (3.3a) is important. Let us
CONSTANT 9
FINAL STATE
Fig. 2. Schematic illustration of the vertical character of the SPP-stimulated desorption from bound states (full curve). The dashed curve denotes all possible final states after desorption. The parabolic scan curve (dash-dot) indicates all possible final states which may be detected at polar angle B [fig. 1 and eq. (3.1)]. The two crossings indicate allowed desorption “events”, and hence indicate experimentally-observable energies. The wiggly line indicates one such transition to an observable desorbed state.
J. Reyes et al. / ASPID 229
consider further a wavevector K near the Brillouin zone boundary at
KBz=;GIo= (m/&O). (3.5)
We define q from
K = q&,, (3.6)
and treat the case q < 1. Then, two terms dominate the RHS of (3.3a),
corresponding to G = 0 and C = - G,,, since K = IK - Glo 1. This problem is then solved by the conventional degenerate perturbation theory. The two unperturbed states In, K) and In, K - Glo) are coupled by the perturbation
(3.7) J-co
where G = -G,, and the characteristic energy E, is defined as the unper- turbed translational kinetic energy at K = KBz,
E, = t22K;J2Mg, (3-g)
which is of order 5 meV for a He atom; (3.7) defines a reduced matrix element, u.
Using these definitions along with a reduced (2D) energy c,(q), defined from
E n,K -En=dq)Em 0%
we obtain the following eigenvalues by including only the above two terms in the wavefunction:
fn( q) = q2 - 2q + 2 f [4(1 - q)2 f u2]1’2.
The familiar limiting behavior of this function includes e,(l) = 1 f u at the zone boundary: the gap is of width 2~. Also, if u = 0, the two unperturbed solutions, E, = q2 and (q - 2)2 are recovered. We emphasize that (3.10) is valid only near q = 1, and if the contributions (a) of states other than p = n, and (b) of RLVs other than G = 0 and G = - GtO, are negligible.
We now return to the desorption problem. The final energy E, of the desorbing atom is given by
E, = En,K + hi& (3.11)
and, using (3.9), this may be written
Ef/EB - EfO + 4q), (3.12)
where the reduced energy E, is defined from
En+Ai2=Ef,EB. (3.13)
The polar angle t9 of desorption is given from
(3.14)
230 J. Reyes et al. / ASPID
One interesting experimental possibility is to observe the atoms desorbing from states near the zone boundary at different angles, depending on the surface (via E,) and excitation frequency 9. Figs. 3 and 4 present the final
1.4. I I
“‘16 I I
17 I8 19 6 (deg)
Fig. 3. Desorption energies are shown as functions of detector polar angle 0 (fig. 1). Different sets
of curves denote different possible values of the reduced matrix element U, defined from (3.7). The
case .I?,.,, = 10, where E, is defined from (3.13), is shown.
8 (dog)
Fig. 4. The same as fig. 3, except that the case E, = 2 is shown.
J. Reyes et al. / ASPID 231
energy E, as a function of 8 for two different conditions, E, = 10 and 2, respectively.
We conclude from figs. 3 and 4 that band structure effects are readily observable. Our conclusion follows from the substantial difference in arrival times of atoms desorbed from the k states at the zone boundary. For example, the case IJ - 0.1 is relevant to He on graphite or Cu [3,4]. The desorbing speeds corresponding to fig. 4 would then differ by about 10% (near 300 m/s) for the band splitting observable near 6’ - 35”. The ASPID signals at a detector 20 cm from the surface would occur at roughly 0.6 and 0.7 ms for the two different initial states.
4. Theory of desorption rate due to SPPs
4. I. The model
The calculation presented here is an initial attempt to determine the desorption rate due to SPPs. Accordingly, we feel justified in making several simplifying assumptions. To be specific, we ignore diffraction processes, and, because Q is so small, tangential momentum of the desorbing gas atom is conserved; thus, our three-dimensional (3D) model reduces, essentially, to the corresponding one-dimensional (1D) model (in the z-direction, normal to the surface). We assume an alkali-halide surface, and, for simplicity, we ignore the direct role of one of the two types (positive and negative) of ion in the desorption process; to be specific in the wording which follows, we ignore the direct role of the positive ions.
Where a star denotes a dimensionful quantity, a self-consistent set of dimensionless variables is defined in terms of the following quantities:
length = a*-‘, (4.la)
time = 52*-i, (4.lb)
energy = A*S2*, (4.lc)
temperature = h*L?*/b*, (4Jd)
where a* is an inverse-length parameter of an empirical atom-solid interaction potential (4.19), 9* is the SPP frequency, and b* is the Boltzmann constant.
The energy in an SPP is partitioned into electromagnetic energy and mechanical energy, the latter of which is associated with deformation of the ionic lattice. There will be both electromagnetic and mechanical contributions to the desorption process, but our estimates indicate that the electromagnetic contribution (which actually hinders desorption) is negligible (appendix 1). Henceforth we consider only the mechanical contribution to desorption.
232 J. Reyes et al. / ASPID
Where z is the gas atom position and I, is the surface negative-ionic displacement, we represent the interaction potential T/by the following empiri- cal form:
qz-z,)= V,(z-zn)+V*(z), (4.2)
where V, is a repulsive part and V, is an attractive part; while V, depends on (z - z,.,), V’ depends on only z because of the essentially stationary nature of the attractive forces [19]:
In order to calculate the lowest-order (one-phonon) desorption rate, we expand V(z - z,) to only first order in z,:
V(z-z,)- V,(z)+&(z)-z&(z), (4.3)
where the prime indicates a differentiation. The first two terms on the RHS of (4.3), that is
v,(z) = I%(z) + V,(z), (4.4)
are chosen to form the “big potential”, VO(z), and the third term is chosen as the “small perturbation”,
s = -znVk(z), (4.5)
in a first-order (distorted-wave) Born approximation (FODWBA). We denote
eigenstates of V,(z) by lsg), where s and g refer to solid and gas, respectively, and we assume that
Isg) = Is) lg), (4.6)
so that the corresponding energy becomes a sum,
E,,=E,+ Eg. (4.7)
On the FODWBA, the transition probability rate may be written
i’fi=2~lME~26(Es,+Eg,-Es,-Egi), (4.8)
where S(l) is the Dirac delta function of S, f and i stand for final and initial states, respectively, and ME is the appropriate matrix element:
ME = (sgf ISlsgi). (4.9)
From (4.5), (4.6) and (4.9), and the fact that Q is small, we may write
ME = -(sf Iz,,lsi)(gf IVk(z)lgi). (4.10)
The first matrix element on the RHS of (4.10), that is the matrix element for the solid, may be written in terms of the amplitude, (Y,, of motion (in the z-direction) of the surface negative ion when the SPP modal occupation number, n, is equal to zero; the result is (see, for example, formulas (3.21a) and (3.21b) of ref. [12])
(4.11)
J. Reyes et ai. / ASPID 233
where S({, l’) is the Kronecker delta.function of ({, 2’). The first term on the RHS of (4.11) refers to a one-phonon annihilation process, and the second term to a one-phonon creation process; our conditions will always be such that creation processes are negligible, and we drop the second term in the following work. The states Igi) and /gf), initial and final (1D) gas atom eigenstates of the big potential V&z), may be denoted by the initial bound state /m) and the final (z-component of) momentum Ip,,) respectively; the respective energies, E,,, and Efe, may be written in terms of the corresponding z-components of “ momentum”, p,,, and ptZ, as follows:
Em/D = p;/d 2 < 0, (4.12)
E,,/D =pfJd= > 0, (4.13)
where D is the well-depth of To(z), and where the quantity d is defined by
d= (2A4sD)“2. (4.14)
We now multiply (4.8) by the density p(E,,) of final gas atom states, given
by
P ( En ) = ( G/27r ) M&G, 3 (4.15)
and integrate over Egf (that is, over E,,) to cancel the Dirac delta function, and obtain our required transition probability rate P; using the results (4.10) and (4.11), ignoring the creation term, we get
Ib= (2nia2,/Mg)(tP~rlAlm)2)EII~-E~+I~ (4.16)
where (p&+) is an A-matrix (which is real), defined by:
hl-44 = (P,*IV;,(~)lm)(M$2)tl,/p,)1’2. (4.17)
The curly brackets in (4.16), with their subscript Eti = Eti + 1, remind us that the total energy of the atom increases by unity (the dimensionless SPP energy); with our neglect of diffraction effects and our assumption that Q is essentially zero, the implication is that the z-component of the gas atom energy also increases by unity, and that prZ is given in terms of pn by
Pfl = (P,‘, + 2N,y2, (4.18)
where it is assumed that conditions are such that the RHS of (4.18) is real (remember that pi is negative).
4.2. The Morse and exponential-~ep~~i~n representation (MERR]
The MERR is chosen because it is not grossly unrealistic and because it allows analytical evaluation of the A-matrix (4.17). For V,(z) and V,(z) we
234 J. Reyes er al. / ASPID
choose the forms
V,(z) = D eC2’, (4.19a)
V,(z) = -20 e-‘, (4.19b)
and we note that (4.19) defines our inverse-length parameter a*; thus, Va(z), given by (4.4) is a Morse potential
V,(z) = D(eC2’ - 2 e-‘), (4.20)
and V;(z), which appears in (4.5), is an exponential repulsion,
Vk(z) = -20 eC2’. (4.21)
The forms of (4.20) and (4.21) lead to the name MERR. With this representation, p,f,, which appears in (4.12), is given by
pi= -(d-:-m)*, (4.22)
where d > : for there to be bound states, and m takes on the values 0, 1,. , , m mm, where m,,, is the integer closest to (d - 1). The square of the A-matrix element, defined by (4.17), is given by [20]
( Pr*(A(m)2 = z C2d - 2m - 1) sinh(27rp,,)
16 m! Q2d - m) [cosh(2rpfr) + cos(2d)]
(4.23)
4.3. The product nisi
It may be shown, using for example formulas (3.5), (3.13) and (3.18) of ref. [12], that the total energy E in bulk polaritons of frequency 52( = 1) is given by
E = ~Nj.~z&w~ = n + +, (4.24)
where N is the total number of negative ions (or of positive ions), ~1 is the reduced mass of an ionic cell, ~a,, is the relative amplitude of the (bulk) ionic motion, n is the polariton occupation number, and wx is a frequency defined from
W;=W;++&W;), (4.25)
where h is defined from
l=LP=w2,+h(w2,-w2,). (4.26)
It follows from (2.10), (2.11) and (4.26) that h obeys
o< [+c)+l]X<E(co). (4.27)
It follows from (2.4) that the amplitude ~4,~ of (bulk) negative-ionic motion is given in terms of u,e from
J. Reyes et al. / ASPID 235
(l+d~“tl=%b. (4.28)
We have made an estimate of the amplitude of surface ionic motion associated with SPPs: if the surface negative-ionic amplitude (in the z-direction) is
denoted by uns, then we get
N,u:, - Nu:,, (4.29)
where N, is the “effective number of SPP-excited negative ions”, given by
N, = AL/v, (4.30)
where A is the surface area, v is the negative-ionic volume and L is the crystal decay length of an SPP, defined from (2.6b).
Now, our LY,, defined just before (4.11) is to be identified with the value of u,, when the SPP occupation number, n, is zero; hence, it follows from (2.2) (4.24), (4.28) and (4.29) that
nio’, - !Y,/(l+ 17)““0Z,, (4.31)
where Si, defined by
Sk = n/‘Ns, (4.32)
is to be interpreted as the number of SPPs per effective excited negative ion. A final approximation may be made in (4.31) by recognizing that 0; (4.25) will always be close to Q2( = l), and hence
nisi - !Yi/(l + n)““’ (4.33)
It follows from (4.16) and (4.33) that
p = PSi 3 (4.34)
where /3 is defined by
p - (1 +&y { (Mlm)2} E,,=E,,11. (4.35)
4.4. Estimate of jsl for the He-Cd system
One criterion for the choice of system to use in an ASPID experiment is that the SPP energy A*&?* should be a little larger than the adatom ground-state binding energy IE,*l (but not too much larger, because the matrix element (4.23) decays exponentially with E,, for large E,,). Ideally, IE,*l should lie inside the allowed range of tt*s2*; that is, using (2.10), we should like to have
Fz*w*, < I E,*l < hews. (4.36)
Another criterion is that lE,*l should be much larger than b*T,*, where Tz is the effective surface temperature, in order that desorption due to thermal phonons (section 5) be negligible. We expect that surface heating due to SPP decay
236 J. Iieyes ei al. / ASPID
processes may be a problem, and are accordingly led to prefer a crystal with large heat capacity, that is, with small Debye temperature @*; a large thermal- phonon mean-free-path would also be an advantage here. It seems to us that a reasonable candidate for an ASPID experimental system may be He-CsI, for which [15-l&21] A*w*, = 8.2 meV and A*w: = 11.8 meV; we estimate that ]E$] - 5 meV and O* - 100 K, and so we think that (4.36) is not in fact satisfied.
We assume that we have m = 0, the ground state; because 27ipr, may easily be made larger than about unity, it follows from (4.23) that a good approxima- tion to the square of the matrix element needed is
Finally, with O* = 1.8 x 10¹³ s-l, from (4.34) and (4.39) we get
P* - 2.0 X 10-“‘3i S-‘. (4.40)
5. Desorption rate due to thermal phonons
5.1. Generaf Lpnsiderations
In competition with the SPP desorption process is the analogous process due to thermal phonons (TPs). This TP desorption may be reduced by keeping the ambient temperature low, but there remains the problem of surface heating by the SPP excitation process, although this may be reduced by an appropriate choice of crystal. The criteria for selecting a crystal with minimal thermal desorption are (a) small SPP decay rate (so that little thermal energy is created), (b) long TP mean-free-path (so that the heat is quickly transported out of the effective excitation-volume), and (c) high heat capacity (so that the temperature increases due to SPP thermalization is small).
We discuss these phenomena in terms of an effective surface temperature T,, although this quantity is ill-defined in our non-equilibrium situation. For the
J. Reyes et al. / ASPID 231
sake of presenting a solvable model, we continue to use the smooth-surface approximation of section 4. We expect that our conclusions would be altered quantitatively, but not qualitatively, if a more realistic model were adopted.
5.2. The model
We assume that some conversion of SPP energy into TPs occurs, and that one result of this conversion is that the surface is heated to some effective temperature T,, which characterizes the TP energy distribution. The desorption probability rate due to TPs is denoted in this section simply by P, as was the rate due to SPPs in section 4. We use the set of dimensionless variables defined by (4.1). On a FODWBA, with assumptions analogous to those made in section 4, and with a bulk Debye continuum model of the surface modal properties, it follows from formula (2.42) of ref. [22], and our definition (4.17) of the A-matrix, that P is given by
6
‘=M,M, ,, / ~o+e (E,, - Ec,)(~&W)~ dE,z
exp[b% - E&T,] - 1 * (5.1)
where 0 is the Debye temperature of our model, defined naturally by
0 = Omax = w&JCY, (5.2)
where Ajax is the maximum (dimensionful) modal frequency. In writing (5.1) we assume that desorbing atoms are initially in their ground state, of energy E,,, and that E, + 0 > 0 (for otherwise desorption via a one-phonon process is impossible).
We substitute for the A-matrix in (5.1) using (4.23), assuming that the error made in taking 2np,, as being always large is negligible, and get
377MJMn
‘- 8r(2d- 1) o J
~~+e(E,,-E,)(E,,-E,+d/M,)‘lr(4+d+ip,,)l*dE~,
exp[(Er, - E&T,] - 1
(5.3)
The relationship between E,, and prr, given by (4.13) and (4.14), must be remembered. If (E,, - E,)/T, is large, then it is natural to write (5.3) as follows:
. 3a MB ,+0/T,
‘--ii-M, r(2d-1) J o 0a(E-Eo)(E-E0+d/Mg)21r(:+d+ip,,)12
x e-E/Ts dE, (5.4)
where E is written in place of Er,, and where the upper limit of integration is set equal to cc, in the hope that the contribution to the integral from the interval (E,, + 0, 00) of E is negligible.
238 J. Reps et al. / ASPID
We seek an approximation to the gamma function in the integrand of (5.4), in order to get an anaiytical approxiation for li. This function is of the form f’(z) = f(x + iy), where x = d + 4 and y = pr_ = (2&&E)““, and our condi- tions are such that IzI z++ 1, allowing correct use of the asymptotic expansion
r231
2 In T(z) - (22 - 1) In z - 22 + ln(2~7). (5.5)
Our conditions are also such that y/x < 1, but not such that y/x =K 1; even so, we expand the In z factor in (5.5) in powers of y/x,
where T, is an effective temperature, defined from
1 2&(d+l) 1 --.--ZG 7”, (d+$ +r,
(5.9)
Because T, is small. the higher powers of E may be dropped in the integrand, and we get
I__?,$!$ (‘+df2” (_E,)(_E,+d/M,)2T.e”“‘T,; n el-+Zd r(2d - 1)
(5.10)
the reader should remember that E, < 0. For systems of our interest, the second term on the RHS of (5.9) which is expected to be larger than about 10, is somewhat larger than the first term, which is expected (see towards the end of section 4) to be about 4, and we could make the approximation
T,- q. (5.11)
With the parameters chosen for He-CsI in section 4.4, and with the approxi- mation (5.11), (5.10) becomes
_ii - 3.5 X lob3 ‘I_r eEOjT,. (5.12)
5.3. Comparison of some results for the two types of desorption
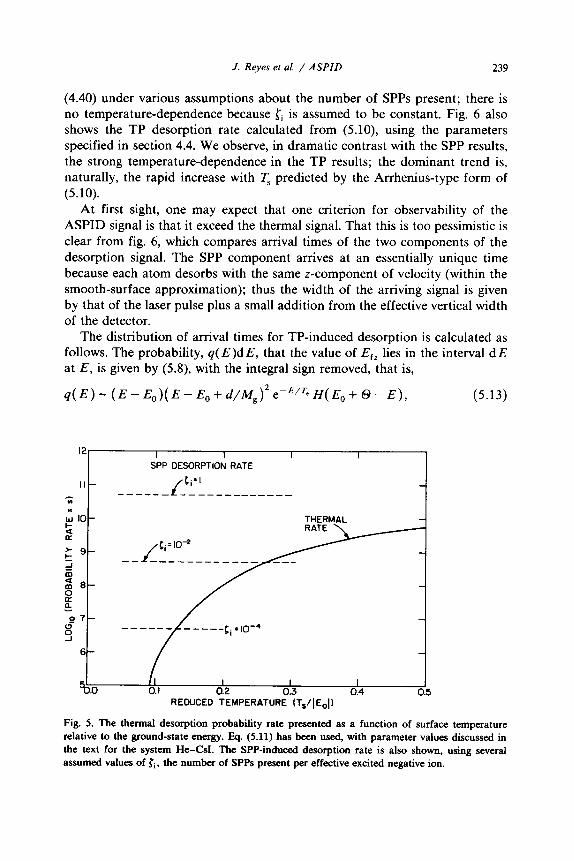
We compare the desorption rates and velocity distributions expected for the two types of desorption. Fig. 5 shows the SPP desorption rate calculated from
J. Reyes et al. / ASPID 239
(4.40) under various assumptions about the number of SPPs present; there is no temperature-dependence because Zi is assumed to be constant. Fig. 6 also shows the TP desorption rate calculated from (5.10) using the parameters specified in section 4.4. We observe, in dramatic contrast with the SPP results, the strong temperature-dependence in the TP results; the dominant trend is, naturally, the rapid increase with T, predicted by the Arrhenius-type form of (5.10).
At first sight, one may expect that one criterion for observability of the ASPID signal is that it exceed the thermal signal. That this is too pessimistic is clear from fig. 6, which compares arrival times of the two components of the desorption signal. The SPP component arrives at an essentially unique time because each atom desorbs with the same z-component of velocity (within the smooth-surface approximation); thus the width of the arriving signal is given by that of the laser pulse plus a small addition from the effective vertical width of the detector.
The distribution of arrival times for TP-induced desorption is calculated as follows. The probability, q(E)dE, that the value of E,, lies in the interval dE at E, is given by (5.8), with the integral sign removed, that is,
q(E)-(E-Eo)(E-E,,+d/A4g)2e-E’~H(E,,+O-E), (5.13)
SbP DESORPTIO; RATE I I
______LY=1___________ c
%D I I I 0.1 0.2 0.3 0.4 0.5
REDUCED TEMPERATURE (T,/IE,I)
Fig. 5. The thermaI desorption probability rate presented as a function of surface temperature relative to the ground-state energy. Eq. (5.11) has been used, with parameter values discussed in the text for the system He-CsI. The SPP-induced desorption rate is also shown, using several assumed values of ci, the number of SPPs present per effective excited negative ion.
240 J. Reyes et al. / ASPID
where multiplicative constants are dropped; the presence of the Heaviside step function reminds us that, in actual fact, E < E, + 0, as in the earlier equation (5.3). The distribution J(t), of arrival times, f, defined so that J(t)dt is the probability that an arrival time lies in the interval dt at t, is given by
J(r)=q(E)dE/df-q[E(r)]/t3, (5.14)
where multiplicative constants are again dropped. The resulting distribution appears in fig. 6, and its broad shape, characteristic of TP-induced processes, is
in sharp contrast with the much narrower SPP-induced distribution. The observed peak position may be interpreted roughly by a simple argu-
ment. We write a rough approximation to (5.13) as follows:
q(E) - E” e-E/Te, (5.15)
where n is an “effective exponent”, lying between 0 and 3. From (5.14) and
(5.15), we get
J(~) _ ~“+3/2 e-w~, (5.16)
so that the maximum in J(t) occurs at a time, t,, corresponding to E,, = E,,
with E,,, given by
Em- (n+;)T’. (5.17)
With the approximation (5.11) the relation (5.17) predicts t, in the interval (0.9, 0.5) ms with n in the interval (0, 3), in fair agreement with the actual value
TIME OF FLIGHT (ms)
Fig. 6. The distribution of arrival times is shown for a detector 20 cm from the desorbing surface. The delta function labelled SPP is of negligible width because of the kinematical restrictions arising from the conservation equations. The thermal phonon contribution is based on an assumed surface temperature of 8.6 K, a binding energy of 5 meV, and a surface Debye temperature of 100 K. The Debye cut-off is barely evident near a time-of-flight of about 0.5 ms.
J. Reyes et al. / ASPID 241
0 (deg)
0 20 30 40 50 60 70 80 90 I I I I I I I
0.0 cos 9
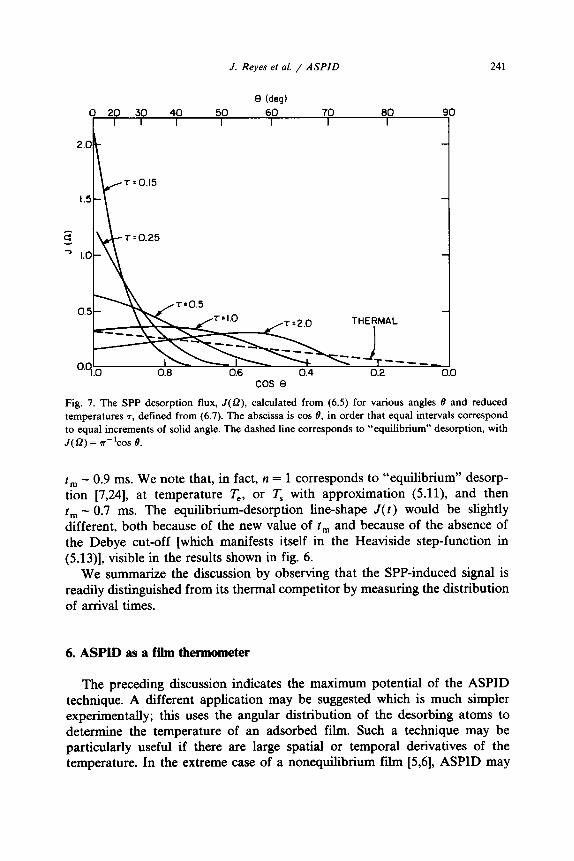
Fig. 7. The SPP desorption flux, J(Q), calculated from (6.5) for various angles 8 and reduced temperatures 7, defined from (6.7). The abscissa is cos 0, in order that equal intervals correspond to equal increments of solid angle. The dashed line corresponds to “equilibrium” desorption, with J(f2) = n-‘COS 8.
*In - 0.9 ms. We note that, in fact, n = 1 corresponds to “equilibrium” desorp- tion [7,24], at temperature T,, or T, with approximation (5.11), and then
*En - 0.7 ms. The equilibrium-desorption line-shape J(t) would be slightly different, both because of the new value of t, and because of the absence of the Debye cut-off [which manifests itself in the Heaviside step-function in (5.13)], visible in the results shown in fig. 6.
We summarize the discussion by observing that the SPP-induced signal is readily distinguished from its thermal competitor by measuring the distribution of arrival times.
6. ASPID as a film thermometer
The preceding discussion indicates the maximum potential of the ASPID technique. A different application may be suggested which is much simpler experimentally; this uses the angular distribution of the desorbing atoms to determine the temperature of an adsorbed film. Such a technique may be particularly useful if there are large spatial or temporal derivatives of the temperature. In the extreme case of a nonequilibrium fihn [5,6], ASPID may
242 J. Reyes et al. / ASPID
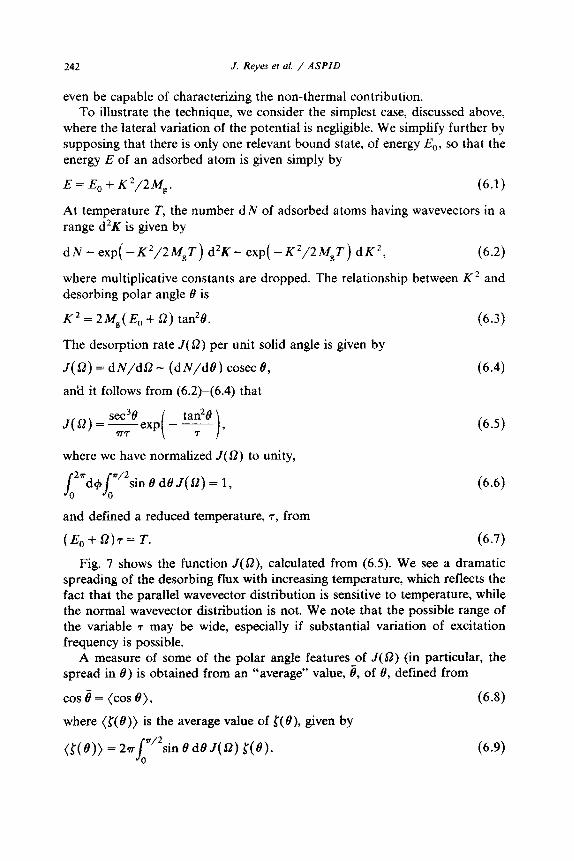
even be capable of characterizing the non-thermal contribution. To illustrate the technique, we consider the simplest case, discussed above,
where the lateral variation of the potential is negligible. We simplify further by supposing that there is only one relevant bound state, of energy E,, so that the energy E of an adsorbed atom is given simply by
E = E, + K2/2Ms. (6.1)
At temperature r, the number dN of adsorbed atoms having wavevectors in a range d2K is given by
dN-exp(-K2/2M,T)d2K-exp(-K2/2M,T)dK2, (6.2)
where multiplicative constants are dropped. The relationship between K2 and desorbing polar angle B is
Kz=2~~(E~+~) tan=@. (6.3)
The desorption rate J(f2) per unit solid angle is given by
J(Q) = dN/dSt - (dN/d@) cosec 8, (6.4)
and it follows from (6.2)-(6.4) that
(6.5)
where we have normalized J(0) to unity,
J(Q) = 1, (6.6)
and defined a reduced temperature, r, from
(E,,+i+=T. (6.7)
Fig. 7 shows the function J(O), calculated from (6.5). We see a dramatic spreading of the desorbing flux with increasing temperature, which reflects the fact that the parallel wavevector dist~bution is sensitive to temperature, while the normal wavevector distribution is not. We note that the possible range of the variable 7 may be wide, especially if substantial variation of excitation frequency is possible.
A measure of some of the polar angle features of J(G) (in particular, the spread in 0) is obtained from an “average” value, 8, of 8, defined from
cos e= (cos 8), (6-g)
where (S(B)) is the average value of S(O), given by
(s(e)> = 2711 n’2sin @dBJ(Q) S(O). (6.9) 0
J. Reyes et al. / ASPID
I I 1 I
I I I I I 0.4 0.6 1.2 1.6
REDUCED TEMPERATURE I-
2
2.t
243
3
Fig. 8. The “average” value, 8, of B, defined from (6.8), is plotted as a function of reduced temperature 7, defined from (6.7). The angle # is a measure of the spread in t?, and, for most 7 shown, this spread is smaller than the “equilibrium” value, 8, = arcos(2/3) = 48”.
It follows from (6.5) and (6.9) that
(cos &> = (m/r)“’ eljT erfc( r-i’*), (6.10)
where erfc(l) denotes the complement of the error function of I. We have plotted t? in fig. 8, where it is compared with the value of 8, = 48” for “equilibrium” desorption [7,24] (( cos 8) = 2/3). The spread in 8 is seen to vary quite rapidly with 7, being narrower than the thermal distribution if T -C - 1.8. It is evident that the angular ~st~bution is a sensitive function of r; this is especially true at low T where (6.10) may be simplified to yield, using (6.8), e- . 71i2 Indeed in this regime the calculation is most reliable because there is conformity to ;he assumption of negligible excitation of perpendicular vibration in the initial adatom state.
7. Qualitative consideration of observability of ASPID
7.1. General considerations
We derive some approximate qualitative criteria for the working of ASPID. When we substitute values for our parameters, we realize that some of them may be uncertain to perhaps some orders of magnitude. However, qualitative conditions such as we derive here will in fact apply to a real experiment, and
244 J. Reyes et al. / ASPID
we hope that our efforts will serve at least as some sort of a guide. In addition to those already defined, there are several other parameters
which we need to use, and these are listed in table 1; the values which we eventually use for these parameters appear (in dimensionful form) in column 3 of that table. The “equilibrium heat”, Q, is the maximum effective equilibrium heat (generated by SPP decay) in the active volume, AL, of the crystal at any time. The efficiency, e, is the ratio of the “equilibrium heat” to the total energy of all SPPs generated in one laser pulse. The assumed value for Jl’corresponds to a pressure of lo- lo Torr at temperature 1 K, according to the perfect-gas law
N* cm3 = 10 19 p*/Torr T*/K (7.1)
We differentiate between the desorption rates due to SPPs and TPs by using the notation jspp and ijTp.
7.2. Desorption due to SPPs alone
Using (4.34), we may write the desorbing flux as follows:
d N/d A d t = &,,, f/S2 = /Is; f/di" , (7.2)
assuming that monolayer coverage (f = 1) implies one adsorbed atom per negative surface ion. With cosine-like desorption, we get
dN _PPif case_ PLf dAdtd0 972 v 2aL2
(7.3)
for the desorbing flux per unit solid angle.
Table 1
Additional parameters needed in section 7
Symbol Description Dimensionful
value used
Q c
Effective volume of detector
SPP life-time
Laser pulse time
Effective area of excited surface
Effective solid angle of detector
Ambient fractional surface coverage Negative-ionic length (u = .Z3)
Number density of atoms in detector
Critical value of a(7.11)
The minimum number of extra atoms detectable
by the detector is assumed to be 9( VT)“*
“Equilibrium heat” generated by SPP decay
Efficiency of conversion of SPP energy
into “equilibrium heat” [see (7.6)]
0.1 cm3
1 Ps 1 ns 1 mm*
(1 mm/20 cm)* 1o-2 4.6 A
109cmw3
1
10
f. Reyes et al. / ASPID 245
The experimentalist, we hope, detects a rate ti of desorbing atoms entering the detector, where
Ej= dN PSifaw
dA dt dfiaW _-
212Z2 ’ (7.4)
and so the total number detected per laser pulse is
IVZ- ps, fow~/2?T6p2; (7.5)
all of these atoms arrive at the detector at essentially the same time (fig. 6). The ambient number of atoms in the detetor is JVZ’, and we assume that the minimum number of extra atoms detectable is g(N!I’)‘j2, where (assuming that the experiment is done in the pulsed mode) 9is expected to be about 10. Thus, a criterion for detection of the atoms desorbed by SPPs, in the absence of TPs, is
7.3. The expected surface temperature
With Si as the number of SPPs per effective excited negative ion (4.32), the total number of SPPs generated per laser pulse is (AL/u)li%“/{, and the “equilibrium heat”, Q, generated is just 4 times this:
Q - cAL{,%“/vl. (7.7)
With a bulk Debye model, the low-temperature heat capacity C(T) of the active crystal volume is:
C(T) - (24r4,‘5)( AL/v)( T/O)3. (7.8)
If heat Q is added to this volume, the expected final surface temperature, T,, is given from
Q -fC(T) dT, (7.9)
where the initial temperature is assumed to be effectively zero, and it follows from (7.7)-(7.9) that
r, - (5~&@~~/6?r~<)“~. (7.10)
It is this value of T, which is relevant to the calculations in section 5.
7.4. SPP versus TP processes
The question of the existence of a relation between i),,, and i),,, in order that SPP processes be not swamped by TP processes, is complicated. For
246 J. Reyes et al. / RSPID
simplicity, we assume that such a relation is given approximately by
g>ler (7.11)
where 9 is defined by
9 = &PP/&, 9 (7.12)
where psrp and i?Tp are calculated from (4.34) and (5.10) or (5.12), respectively, and where Se, is some critical value of .L??. It must be borne in mind that, whereas the atoms described by TP-induced processes have a relatively large spread in E,,, those desorbed by SPP-induced processes have essentially no such spread. Thus, a far greater fraction of SPP-desorbed atoms will enter the detector than of TP-desorbed atoms.
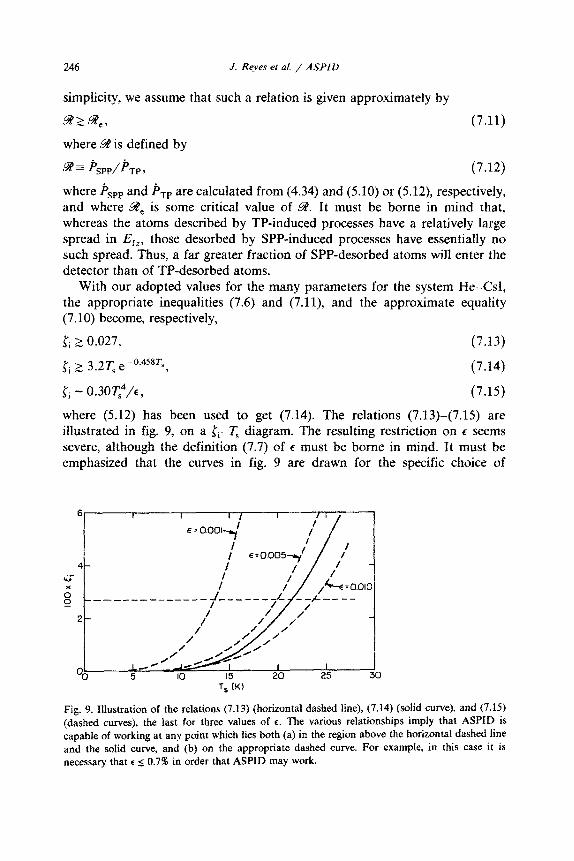
With our adopted values for the many parameters for the system He-CM, the appropriate inequalities (7.6) and (7.11), and the approximate equality (7.10) become, respectively,
pi > 0.027, (7.13)
Ii 2 3.2T, e-“.4s*f,, (7.14)
pi - 0.30~4/C) (7.15)
where (5.12) has been used to get (7.14). The relations (7.13)-(7.15) are illustrated in fig 9, on a li-TS diagram. The resulting restriction on E seems severe, although the defi~tion (7.7) of e must be borne in mind. It must be emphasized that the curves in fig. 9 are drawn for the specific choice of
T, (K)
Fig. 9. Illustration of the relations (7.13) (horizontal dashed line), (7.14) (solid curve), and (7.15) (dashed curves), the last for three values of c. The various relations~ps imply that ASPID is capable of working at any point which Iies both (a) in the region above the horizontal dashed line
and the solid curve, and (b) on the appropriate dashed curve. For example, in this case it is
necessary that c I: 0.7% in order that ASPID may work.
J. Reyes et al. / ASPID 247
parameters made in section 4.4 and table 1, and that other (perhaps more realistic) choices may drastically alter the geometry of the figure. For example, changing f from lo-’ to lo-‘, and changing F from 10 to 2, would decrease the height of the horizontal dashed line by a factor of 50; as another example, increasing Z by a factor would increase the maximum allowed value of e by the same factor.
8. Conclusions
We have proposed a new type of surface spectroscopy, ASPID, which has the potential for determining interesting and useful information about atomic binding to surfaces and atomic motion on surfaces. As with some other spectroscopies, it has simplicity of interpretation owing to the discrete nature of the properties of interest. Thus the SPP component in fig. 6 is readily distinguished from the thermal background; the gap associated with adatom band structure should be experimentally apparent, according to figs. 3 and 4.
Our optimism presumes experimental feasibility. The estimates of sections 4, 5 and 7 suggest that the technique is viable. The crucial considerations involve SPP life-times and TP mean-free-paths, which depend strongly on substrate perfection, surface order, and temperature. The criteria are sensitive also to the SPP coupling to the adatom. The calculations of section 4 use about the simplest realistic model which one may consider, and a more thorough analysis is required to extend the model in order to treat various systems of
interest. We intend to study especially the dependencies on mass, binding energy,
and lateral variation of the atom-surface potential energy. We are also inter- ested in the possible extension of the technique to the case of other optically active modes at surfaces. The S, mode may be a particularly suitable candidate because of its high localization at the surface and primarily transverse char- acter [25,26]. Naturally, we welcome communications from interested experi- mentalists, who may suggest sensible improvements in the design proposed herein, and, more importantly, may be willing to initiate such an investigation.
Acknowledgements
The authors acknowledge the benefit of useful discussions with Drs. D.R. Frankl, P.H. Cutler, J.W. Gadzuk, R. Fuchs, D.L. Mills, G. Benedek, and I. Romero. This work was supported by NSF Grant No. DMR-8113262, by CONACyT and DGICSA-SEP (Mexico), and by the Natural Sciences and Engineering Research Council of Canada, under Grant No. A6282.
248 J. Reyes et al. / ASPID
Appendix. Estimate of the importance of the electromagnetic energy in desorp- tion
We estimate the ratio, &?, of (i) a typical electromagnetic normal force, Fe,, and (ii) a typical mechanical normal force, Fm,, on a desorbing atom. Where E,,(r) is the electric field (vector) amplitude, a typical electromagnetic force is given by
L - :~(aG/az)Z=O, (A.11
where OL is an atomic polarizability. From (4.3) and (4.4), we may estimate a typical mechanical force by
F mz - u,$-; (0) 9 (A.2)
where we have used VA(O) = 0 and replaced z, by u,_, our surface negative-ionic amplitude in the normal direction.
For an SPP propagating in the x-direction, the electric field E(r, t) in the vacuum is given [14] by (2.6a). Now, C(W) is given from 1141
-C(o)= [l -(o/cQ)‘] -l, (A.31
and it follows from (2.7) and (A.3) that
&, = [l - (fi/cQ)‘] -1’2; (A.4)
in fact, the quantity ti/cQ will always be sufficiently small in order that
Q&-l (A.51 is a good approximation. If follows from (2.6a), (A.l), and (A.5) that a typical electromagnetic normal force amplitude is given by
F, - aQEi, (A.@ although in fact the electromagnetic force is negative, and thus actually hinders desorption. The electric field E is related [12] to the negative-ionic displace- ment U, by (2.5). We set 52 - w, in (2.5) and use the relation (2.11a) to obtain
With (A.5), it follows from (2.6a) that E, is also approximately the ampli- tude of E, at the surface, and we may now relate E, to u,, using (A.7):
It follows from (A.6) and (A.8) that
Fez-y[ ‘@~~:(;a,]i~~&
64.8)
(A.91
J. Reyes et al. / ASPID 249
With the representation (4.19a) of V,(z), it follows from (A.2) that a typical mechanical normal force amplitude is given by
F m2 - 4&D. (A.101
From (A.9) and (A.lO), we have a result for 5%
(A.1 1)
With parameters chosen to represent He-CsI (section 4.4), that is [21] cy* I: 0.2 fi”, f%f; = 127U, w: = 1.8 x lOI SK’, D’ = 7.4 meV, r(0) = 6.6, t-(00) = 2.6, we
get
B - 1 .9Qun*. (A1.12)
Now, Q* will be of order 10e5 A-’ (section 2.1), so the (direct) electromag- netic forces may be safely neglected.
References
HI
121
131
141
151
[61
[71
181
[91
UOI
[2Ll
[221
E.W. Miiller and T.T. Tsong, Progr. Surface Sci. 4 (1973) 1.
T.T. Tsong, Progr. Surface Sci. 10 (1980) 165.
W.E. Carlos and M.W. Cole, Phys. Rev. B21 (1980) 3713,
J.R. Manson and G. Armand, Surface Sci. 126 (1983) 681.
D. Goodstein, in: Many-Body Phenomenon at Surfaces, Eds. D. Lang&h and H. Suhl
(Academic Press, Orlando, 1984) p. 277.
M. Sinvani, D.L. Goodstein, M.W. Cole and P. Taborek, Phys. Rev. 828 (1984) 3064.
J. Reyes, I. Romero and F.O. Goodman, J. Chem. Phys. 79 (1983) 5906.
NH. Talk, M.M. Traum, J.C. Tully and T.E. Mordey, Eds., Desorption Induced by
Electronic Transitions, DIET I (Springer, Berlin, 1983).
A. Otto, 2. Physik 216 (1968) 398.
V.M. Agranovich and D.L. Mills, Eds., Surface Polaritons (North-Holland. Amsterdam,
1982).
A.D. Broadman. Ed., Surface Electromagnetic Modes (Wiley, New York, 1982).
D.L. Mills and E. Burstein, Rept. Progr. Phys. 37 (1974) 817.
E. Burstein and F. de Martini, Eds., Polaritons (Proc. 1st Taormina Conf. on the Structure of
Matter (Pergamon, Oxford, 1974).
K. Khewer and R. Fuchs, Advan. Chem. Phys. 27 (1974) 355.
S. Chung and M.W. Cole, Surface Sci. 145 (1984) 269.
S. Chung, M.W. Cole and F.O. Goodman, unpublished.
L.W. Bruch, Surface Sci. 125 (1983) 194.
S. Rauber, J.R. Klein, M.W. Cole and L.W. Bruch, Surface Sci. 123 (1982) 173.
F.O. Goodman, J. Chem. Phys. 55 (1971) 5742.
The first calculation of this result appears, essentially, in: C. Strachan, Proc. Roy. Sot, (London) A150 (1935) 456.
N.W. Ashcroft and N.D. Mermin, Solid State Physics (Holt, Reinhart and Winston, 1976) table 27.2, p. 553.
F.O. Goodman, Surface Sci. 24 (1971) 667.
250 J. Reyes er al. / ASPID
[23] M. Abramowitz and L.A. Stegun, Eds., Handbook of Mathematical Functions, Natl. Bur. Std.