Adult, Nonmaternal Inpatient Stays Related to Sepsis: National Trends by Expected Primary Payer, 2012-2018 November 10, 2020 Recommended Citation: Adult, Nonmaternal Inpatient Stays Related to Sepsis: National Trends by Expected Primary Payer, 2012-2018. Healthcare Cost and Utilization Project. ONLINE. November 10, 2020. Agency for Healthcare Research and Quality. Available: www.hcup- us.ahrq.gov/reports/ataglance/findingsataglance.jsp.
Transcript
Adult, Nonmaternal Inpatient Stays Related to Sepsis: National Trends by Expected Primary Payer, 2012-2018
November 10, 2020
Recommended Citation: Adult, Nonmaternal Inpatient Stays Related to Sepsis: National Trends by Expected Primary Payer, 2012-2018. Healthcare Cost and Utilization Project. ONLINE. November 10, 2020. Agency for Healthcare Research and Quality. Available: www.hcup-us.ahrq.gov/reports/ataglance/findingsataglance.jsp.
Any Diagnosis of Sepsis ............................................................................................................................. 3
Appendix A. Healthcare Cost and Utilization Project (HCUP) National Inpatient Sample (NIS) ................... 8
Appendix B. Clinical Coding Definitions ........................................................................................................ 9
B.1 ICD-9-CM Coding Used to Identify Inpatient Stays Related to Sepsis for Quarter 1 of 2012 through Quarter 3 of 2015...................................................................................................................................... 9
B.2 ICD-10-CM Coding Used to Identify Inpatient Stays Related to Sepsis for Quarter 4 of 2015 through Quarter 4 of 2018.................................................................................................................................... 10
B.3 ICD-10-CM Coding for Maternal and Neonatal Sepsis Not Used for This Study............................... 11
Appendix C. Data Tables ............................................................................................................................. 12
Any Diagnosis of Sepsis ........................................................................................................................... 12
(HCUP 11/10/2020) 1 Inpatient Trends for Sepsis by Payer, 2012-2018
OVERVIEW
Sepsis is a serious blood infection that may lead to organ failure, tissue damage, and even death. Most often caused by bacteria or bacterial toxins in the blood stream, more than 1.7 million cases of septicemia are reported in the United States each year.1 Hospitalizations associated with sepsis have risen markedly over the past decade. A study conducted by the Agency for Healthcare Research and Quality (AHRQ) found that between 2000 and 2009, the number of hospitalizations in the United States with a principal diagnosis of sepsis increased by 148 percent, and hospitalizations with a secondary diagnosis of sepsis increased by 66 percent. By 2009, nearly one out of every 23 hospitalized patients had sepsis. 2 A similar analysis explored hospital admissions for sepsis among Medicare fee-for-service beneficiaries and found that utilization steadily increased between 2012 and 2018 with some seasonal variation.3 This descriptive analysis shows national trends from 2012 to 2018 in adult, nonmaternal inpatient stays related to sepsis for different expected primary payers.
METHODS
National estimates of inpatient stays related to sepsis were derived from the Healthcare Cost and Utilization project (HCUP) National Inpatient Sample (NIS). The analysis was limited to discharges for patients aged 18 years and older, excluding maternal stays identified by the major diagnostic category (MDC) of 14. Sepsis could be listed as a principal or secondary diagnosis and included septic shock, serve sepsis without shock, nonsevere sepsis that is organism specific, and non-severe sepsis, unspecified. This analysis is focused on nonmaternal adults and, therefore, does not include diagnoses related to maternal and neonatal sepsis. The identification of sepsis changed diagnosis coding systems during the study period. In October 2015, the United States transitioned to a modified version of the World Health Organization International Classification of Diseases, Tenth Revision (ICD-10-CM), replacing the ICD-9-CM (Ninth Revision) diagnosis coding system with the ICD-10-CM diagnosis coding system for inpatient and outpatient medical encounters. Discharge quarter was defined as follows: Q1 includes January-March, Q2 includes April-June, Q3 includes July-September, and Q4 includes October-December. Trends are presented by the expected primary payer (i.e., the expected primary source of payment for the hospital bill). Background on the NIS is provided in Appendix A. The coding criteria for sepsis is provided in Appendix B.
1 What is Sepsis? Centers for Disease Control and Prevention. https://www.cdc.gov/sepsis/what-is-sepsis.html. Accessed November 5, 2020. 2 Elixhauser A, Friedman B, Stranges E. Septicemia in U.S. Hospitals, 2009. HCUP Statistical Brief #122. October 2011. Rockville, MD: Agency for Healthcare Research and Quality. http://www.hcup-us.ahrq.gov/reports/statbriefs/sb122.pdf. Accessed November 5, 2020. 3 Buchman TG, Simpson SQ, Sciarretta KL, et al. Sepsis Among Medicare Beneficiaries: 1. The Burdens of Sepsis, 2012-2018. Crit Care Med. 2020;48(3):276-288. doi:10.1097/CCM.0000000000004224
(HCUP 11/10/2020) 2 Inpatient Trends for Sepsis by Payer, 2012-2018
RESULTS
The following graphs show national trends in adult, nonmaternal inpatient stays related to sepsis. There are five sets of graphs showing trends by expected primary payer and discharge quarter from 2012–2018. Each set focuses on a type of sepsis: any sepsis, septic shock, serve sepsis without shock, nonsevere sepsis that is organism specific, and non-severe sepsis, unspecified. The first graph in the set shows trends in the number of adult, nonmaternal inpatient stays. Information on Medicare discharges is reported overall and by two age groups (ages 18-64 years and ages 65 years and older). The second graph in the set shows trends in the percentage of total adult, nonmaternal inpatient stays for the payer that are related to sepsis. The underlying data tables for each figure are provided in Appendix C.
(HCUP 11/10/2020) 3 Inpatient Trends for Sepsis by Payer, 2012-2018
Any Diagnosis of Sepsis
Figure 1a: Number of Adult, Nonmaternal Inpatient Stays with Any Diagnosis of Sepsis, By Expected Primary Payer and Discharge Quarter, 2012-2018
Figure 1b: Percent of Adult, Nonmaternal Inpatient Stays with Any Diagnosis of Sepsis, By Expected Primary Payer and Discharge Quarter, 2012-2018
Source: Agency for Healthcare Research and Quality (AHRQ), Healthcare Cost and Utilization Project (HCUP), National Inpatient Sample (NIS), ICD-9-CM Diagnoses from 2012 Q1-2015 Q3 and ICD-10-CM Diagnoses from 2015 Q4-2018 Q4
Medicare Medicaid Private insurance Self-pay/no charge Other
(HCUP 11/10/2020) 4 Inpatient Trends for Sepsis by Payer, 2012-2018
Septic Shock
Figure 2a: Number of Adult, Nonmaternal Inpatient Stays with a Diagnosis of Septic Shock, By Expected Primary Payer and Discharge Quarter, 2012-2018
Figure 2b: Percent of Adult, Nonmaternal Inpatient Stays with a Diagnosis of Septic Shock, By Expected Primary Payer and Discharge Quarter, 2012-2018
Source: Agency for Healthcare Research and Quality (AHRQ), Healthcare Cost and Utilization Project (HCUP), National Inpatient Sample (NIS), ICD-9-CM Diagnoses from 2012 Q1-2015 Q3 and ICD-10-CM Diagnoses from 2015 Q4-2018 Q4
Medicare Medicaid Private insurance Self-pay/no charge Other
(HCUP 11/10/2020) 5 Inpatient Trends for Sepsis by Payer, 2012-2018
Severe Sepsis without Shock
Figure 3a: Number of Adult, Nonmaternal Inpatient Stays with a Diagnosis of Severe Sepsis without Shock, By Expected Primary Payer and Discharge Quarter, 2012-2018
Figure 3b: Percent of Adult, Nonmaternal Inpatient Stays with a Diagnosis of Severe Sepsis without Shock, By Expected Primary Payer and Discharge Quarter, 2012-2018
Source: Agency for Healthcare Research and Quality (AHRQ), Healthcare Cost and Utilization Project (HCUP), National Inpatient Sample (NIS), ICD-9-CM Diagnoses from 2012 Q1-2015 Q3 and ICD-10-CM Diagnoses from 2015 Q4-2018 Q4
Medicare Medicaid Private insurance Self-pay/no charge Other
(HCUP 11/10/2020) 6 Inpatient Trends for Sepsis by Payer, 2012-2018
Nonsevere Sepsis, Organism Specific
Figure 4a: Number of Adult, Nonmaternal Inpatient Stays with a Diagnosis of Nonsevere Sepsis, Organism Specific, By Expected Primary Payer and Discharge Quarter, 2012-2018
Figure 4b: Percent of Adult, Nonmaternal Inpatient Stays with a Diagnosis of Nonsevere Sepsis, Organism Specific, By Expected Primary Payer and Discharge Quarter, 2012-2018
Source: Agency for Healthcare Research and Quality (AHRQ), Healthcare Cost and Utilization Project (HCUP), National Inpatient Sample (NIS), ICD-9-CM Diagnoses from 2012 Q1-2015 Q3 and ICD-10-CM Diagnoses from 2015 Q4-2018 Q4
Medicare Medicaid Private insurance Self-pay/no charge Other
(HCUP 11/10/2020) 7 Inpatient Trends for Sepsis by Payer, 2012-2018
Nonsevere Sepsis, Unspecified
Figure 5a: Number of Adult, Nonmaternal Inpatient Stays with a Diagnosis of Nonsevere Sepsis, Unspecified, By Expected Primary Payer and Discharge Quarter, 2012-2018
Figure 5b: Percent of Adult, Nonmaternal Inpatient Stays with a Diagnosis of Nonsevere Sepsis, Unspecified, By Expected Primary Payer and Discharge Quarter, 2012-2018
Source: Agency for Healthcare Research and Quality (AHRQ), Healthcare Cost and Utilization Project (HCUP), National Inpatient Sample (NIS), ICD-9-CM Diagnoses from 2012 Q1-2015 Q3 and ICD-10-CM Diagnoses from 2015 Q4-2018 Q4
Medicare Medicaid Private insurance Self-pay/no charge Other
(HCUP 11/10/2020) 8 Inpatient Trends for Sepsis by Payer, 2012-2018
APPENDIX A. HEALTHCARE COST AND UTILIZATION PROJECT (HCUP) NATIONAL INPATIENT SAMPLE (NIS)
The Healthcare Cost and Utilization Project is a family of health care databases and related software tools and products developed through a Federal-State-Industry partnership and sponsored by the Agency for Healthcare Research and Quality (AHRQ). HCUP databases bring together the data collection efforts of State data organizations, hospital associations, and private data organizations (HCUP Partners) and the Federal government to create a national information resource of encounter-level health care data. HCUP includes the largest collection of longitudinal hospital care data in the United States, with all-payer, encounter-level information beginning in 1988. These databases enable research on a broad range of health policy issues, including cost and quality of health services, medical practice patterns, access to health care programs, and outcomes of treatments at the national, State, and local market levels.
Beginning in 2012, the HCUP National Inpatient Sample (NIS) approximates a 20-percent stratified sample of all discharges from U.S. community hospitals, excluding rehabilitation and long-term acute care hospitals. The 2018 NIS sampling frame includes data from the HCUP State Inpatient Databases (SID) from 47 States plus the District of Columbia, covering more than 97 percent of the U.S. population and including almost 96 percent of discharges from U.S. community hospitals. The NIS contains information on all hospital stays, regardless of the expected payer for the hospital stay. For Medicare, the NIS includes inpatient stays for both Medicare fee-for-service and managed care patients. Clinical and resource use information typically available from discharge abstracts is included on NIS records. The vast size of the NIS allows the study of topics at the national and regional levels for specific subgroups of patients. In addition, NIS data are standardized across years to facilitate ease of use. Over time, the sampling frame for the NIS has changed; thus, the number of States contributing to the NIS varies from year to year. The NIS is intended for reporting national estimates only; no State-level estimates can be produced.
More information is available on the HCUP User Support website (www.hcup-us.ahrq.gov).
(HCUP 11/10/2020) 9 Inpatient Trends for Sepsis by Payer, 2012-2018
APPENDIX B. CLINICAL CODING DEFINITIONS
For both ICD-9-CM and ICD-10-CM, a discharge record was assigned into one of the sepsis categories based on the following hierarchy:
1. If any diagnosis of septic shock, then the discharged is classified as Septic Shock2. If not in #1 and any diagnosis of severe sepsis without shock, then the discharged is classified as
Severe Sepsis without Shock3. If not in #1 or #2 and any diagnosis of nonsevere sepsis that is organism specific, then the
discharged is classified as Nonsevere Sepsis, Organism Specific4. If not in #1, #2, or #3 and any diagnosis of nonsevere sepsis, unspecified, then the discharged is
classified as Nonsevere Sepsis, Unspecified.If a discharge record was identified as having any one of the four types of sepsis, then it was also included in the category of Any Sepsis. Table B.1 and B.2 list the diagnosis codes used to identify each type of sepsis by the two coding systems. Table B.3 lists the maternal and neonatal diagnosis codes for sepsis that were not used for this study.
B.1 ICD-9-CM Coding Used to Identify Inpatient Stays Related to Sepsis for Quarter 1 of 2012 throughQuarter 3 of 2015
Diagnosis ICD-9-CM Code Code Description Septic Shock 78552 Septic shock Severe Sepsis without Shock 99592 Severe sepsis
Nonsevere Sepsis, Organism Specific
0380 Streptococcal septicemia 0381x Staphylococcal septicemia 0382 Pneumococcal septicemia 0393 Septicemia due to anaerobes 0384x Septicemia due to other gram-negative organisms 0388 Other specified septicemias
Nonsevere Sepsis, Unspecified
0389 Unspecified septicemia 99591 Sepsis
(HCUP 11/10/2020) 10 Inpatient Trends for Sepsis by Payer, 2012-2018
B.2 ICD-10-CM Coding Used to Identify Inpatient Stays Related to Sepsis for Quarter 4 of 2015 throughQuarter 4 of 2018
Diagnosis ICD-10-CM Code Code Description
Septic Shock R6521 Severe sepsis with septic shock
Severe Sepsis without Shock
R6520 Severe sepsis without septic shock
Nonsevere Sepsis, Organism Specific
A021 Salmonella sepsis
A227 Anthrax sepsis
A267 Erysipelothrix sepsis
A327 Listerial sepsis
A400 Sepsis due to streptococcus, group A
A401 Sepsis due to streptococcus, group B
A403 Sepsis due to Streptococcus pneumoniae
A408 Other streptococcal sepsis
A409 Streptococcal sepsis, unspecified
A4101 Sepsis due to Methicillin susceptible Staphylococcus aureus
A4102 Sepsis due to Methicillin resistant Staphylococcus aureus
A411 Sepsis due to other specified staphylococcus
A412 Sepsis due to unspecified staphylococcus
A413 Sepsis due to Hemophilus influenzae
A414 Sepsis due to anaerobes
A4150 Gram-negative sepsis, unspecified
A4151 Sepsis due to Escherichia coli [E. coli]
A4152 Sepsis due to Pseudomonas
A4153 Sepsis due to Serratia
A4159 Other Gram-negative sepsis
A4181 Sepsis due to Enterococcus
A4189 Other specified sepsis
A427 Actinomycotic sepsis
A5486 Gonococcal sepsis
B377 Candidal sepsis
Nonsevere Sepsis, Unspecified
A419 Sepsis, unspecified organism
(HCUP 11/10/2020) 11 Inpatient Trends for Sepsis by Payer, 2012-2018
B.3 ICD-10-CM Coding for Maternal and Neonatal Sepsis Not Used for This Study
ICD-10-CM Code Code Description O0337 Sepsis following incomplete spontaneous abortion O0387 Sepsis following complete or unspecified spontaneous abortion O0487 Sepsis following (induced) termination of pregnancy O0737 Sepsis following failed attempted termination of pregnancy O0882 Sepsis following ectopic and molar pregnancy O85 Puerperal sepsis O8604 Sepsis following an obstetrical procedure P360 Sepsis of newborn due to streptococcus, group B P3610 Sepsis of newborn due to unspecified streptococci P3619 Sepsis of newborn due to other streptococci P362 Sepsis of newborn due to Staphylococcus aureus P3630 Sepsis of newborn due to unspecified staphylococci P3639 Sepsis of newborn due to other staphylococci P364 Sepsis of newborn due to Escherichia coli P365 Sepsis of newborn due to anaerobes P368 Other bacterial sepsis of newborn P369 Bacterial sepsis of newborn, unspecified
(HCUP 11/10/2020) 12 Inpatient Trends for Sepsis by Payer, 2012-2018
APPENDIX C. DATA TABLES
Any Diagnosis of Sepsis
Table 1a-1: Number of Adult, Nonmaternal Inpatient Stays with Any Diagnosis of Sepsis, By Payer and Discharge Quarter, 2012-2014
Source: Agency for Healthcare Research and Quality (AHRQ), Healthcare Cost and Utilization Project (HCUP), National Inpatient Sample (NIS), ICD-9-CM Diagnoses
Table 1a-2: Number of Adult, Nonmaternal Inpatient Stays with Any Diagnosis of Sepsis, By Payer and Discharge Quarter, 2015-2017
Source: Agency for Healthcare Research and Quality (AHRQ), Healthcare Cost and Utilization Project (HCUP), National Inpatient Sample (NIS), ICD-9-CM Diagnoses from 2015 Q1-2015 Q3 and ICD-10-CM Diagnoses from 2015 Q4-2017 Q4
Table 1a-3: Number of Adult, Nonmaternal Inpatient Stays with Any Diagnosis of Sepsis, By Payer and Discharge Quarter, 2018
Source: Agency for Healthcare Research and Quality (AHRQ), Healthcare Cost and Utilization Project (HCUP), National Inpatient Sample (NIS), ICD-10-CM Diagnoses
(HCUP 11/10/2020) 13 Inpatient Trends for Sepsis by Payer, 2012-2018
Table 1b-1: Percent of Adult, Nonmaternal Inpatient Stays with Any Diagnosis of Sepsis, By Payer and Discharge Quarter, 2012-2014
Source: Agency for Healthcare Research and Quality (AHRQ), Healthcare Cost and Utilization Project (HCUP), National Inpatient Sample (NIS), ICD-9-CM Diagnoses from 2015 Q1-2015 Q3 and ICD-10-CM Diagnoses from 2015 Q4-2017 Q4
Table 1b-3: Percent of Adult, Nonmaternal Inpatient Stays with Any Diagnosis of Sepsis, By Payer and Discharge Quarter, 2018
Missing/Invalid 7.9 8.5 8.3 9.1 Source: Agency for Healthcare Research and Quality (AHRQ), Healthcare Cost and Utilization Project (HCUP), National Inpatient Sample (NIS), ICD-10-CM Diagnoses
(HCUP 11/10/2020) 14 Inpatient Trends for Sepsis by Payer, 2012-2018
Septic Shock
Table 2a-1: Number of Adult, Nonmaternal Inpatient Stays with a Diagnosis of Septic Shock, By Payer and Discharge Quarter, 2012-2014
Source: Agency for Healthcare Research and Quality (AHRQ), Healthcare Cost and Utilization Project (HCUP), National Inpatient Sample (NIS), ICD-9-CM Diagnoses
Table 2a-2: Number of Adult, Nonmaternal Inpatient Stays with a Diagnosis of Septic Shock, By Payer and Discharge Quarter, 2015-2017
Source: Agency for Healthcare Research and Quality (AHRQ), Healthcare Cost and Utilization Project (HCUP), National Inpatient Sample (NIS), ICD-9-CM Diagnoses from 2015 Q1-2015 Q3 and ICD-10-CM Diagnoses from 2015 Q4-2017 Q4
Table 2a-3: Number of Adult, Nonmaternal Inpatient Stays with a Diagnosis of Septic Shock, By Payer and Discharge Quarter, 2018
Missing/Invalid 130 100 195 170 Source: Agency for Healthcare Research and Quality (AHRQ), Healthcare Cost and Utilization Project (HCUP), National Inpatient Sample (NIS), ICD-10-CM Diagnoses
(HCUP 11/10/2020) 15 Inpatient Trends for Sepsis by Payer, 2012-2018
Table 2b-1: Percent of Adult, Nonmaternal Inpatient Stays with a Diagnosis of Septic Shock, By Payer and Discharge Quarter, 2012-2014
Source: Agency for Healthcare Research and Quality (AHRQ), Healthcare Cost and Utilization Project (HCUP), National Inpatient Sample (NIS), ICD-9-CM Diagnoses from 2015 Q1-2015 Q3 and ICD-10-CM Diagnoses from 2015 Q4-2017 Q4
Table 2b-3: Percent of Adult, Nonmaternal Inpatient Stays with a Diagnosis of Septic Shock, By Payer and Discharge Quarter, 2018
Source: Agency for Healthcare Research and Quality (AHRQ), Healthcare Cost and Utilization Project (HCUP), National Inpatient Sample (NIS), ICD-10-CM Diagnoses
(HCUP 11/10/2020) 16 Inpatient Trends for Sepsis by Payer, 2012-2018
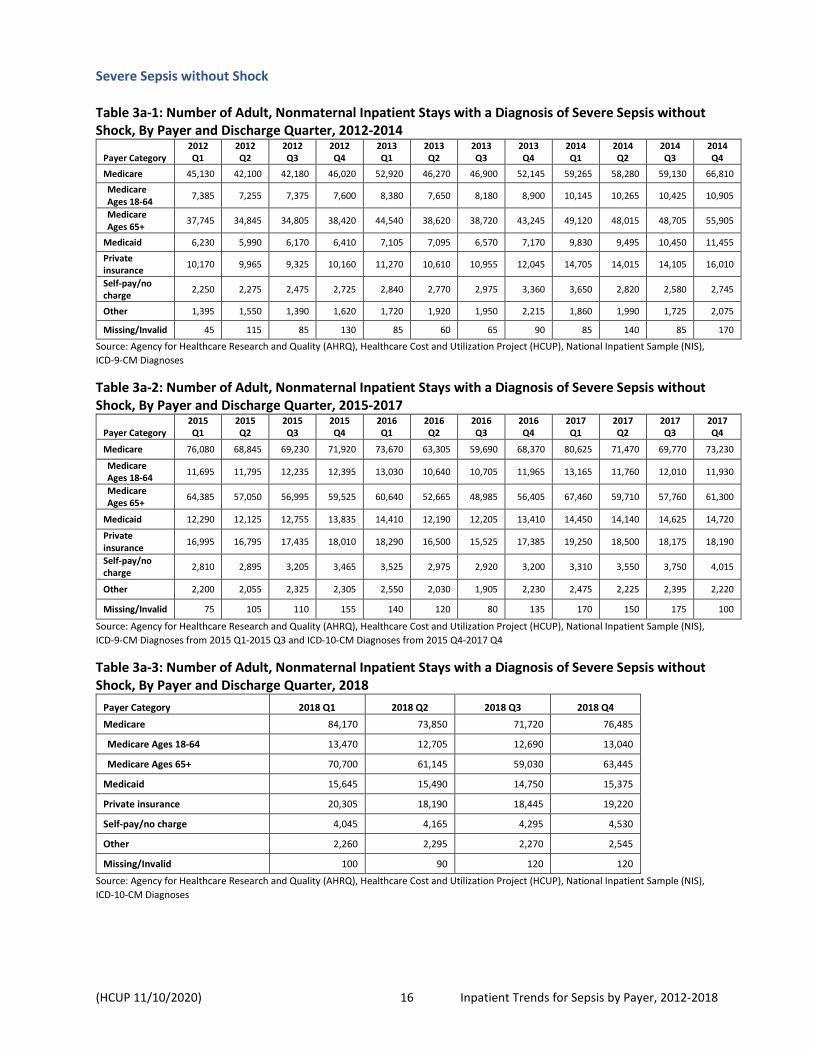
Severe Sepsis without Shock
Table 3a-1: Number of Adult, Nonmaternal Inpatient Stays with a Diagnosis of Severe Sepsis without Shock, By Payer and Discharge Quarter, 2012-2014
Source: Agency for Healthcare Research and Quality (AHRQ), Healthcare Cost and Utilization Project (HCUP), National Inpatient Sample (NIS), ICD-9-CM Diagnoses
Table 3a-2: Number of Adult, Nonmaternal Inpatient Stays with a Diagnosis of Severe Sepsis without Shock, By Payer and Discharge Quarter, 2015-2017
Source: Agency for Healthcare Research and Quality (AHRQ), Healthcare Cost and Utilization Project (HCUP), National Inpatient Sample (NIS), ICD-9-CM Diagnoses from 2015 Q1-2015 Q3 and ICD-10-CM Diagnoses from 2015 Q4-2017 Q4
Table 3a-3: Number of Adult, Nonmaternal Inpatient Stays with a Diagnosis of Severe Sepsis without Shock, By Payer and Discharge Quarter, 2018
Source: Agency for Healthcare Research and Quality (AHRQ), Healthcare Cost and Utilization Project (HCUP), National Inpatient Sample (NIS), ICD-10-CM Diagnoses
(HCUP 11/10/2020) 17 Inpatient Trends for Sepsis by Payer, 2012-2018
Table 3b-1: Percent of Adult, Nonmaternal Inpatient Stays with a Diagnosis of Severe Sepsis without Shock, By Payer and Discharge Quarter, 2012-2014
Source: Agency for Healthcare Research and Quality (AHRQ), Healthcare Cost and Utilization Project (HCUP), National Inpatient Sample (NIS), ICD-9-CM Diagnoses from 2015 Q1-2015 Q3 and ICD-10-CM Diagnoses from 2015 Q4-2017 Q4
Table 3b-3: Percent of Adult, Nonmaternal Inpatient Stays with a Diagnosis of Severe Sepsis without Shock, By Payer and Discharge Quarter, 2018
Missing/Invalid 1.1 1.2 1.2 1.4 Source: Agency for Healthcare Research and Quality (AHRQ), Healthcare Cost and Utilization Project (HCUP), National Inpatient Sample (NIS), ICD-10-CM Diagnoses
(HCUP 11/10/2020) 18 Inpatient Trends for Sepsis by Payer, 2012-2018
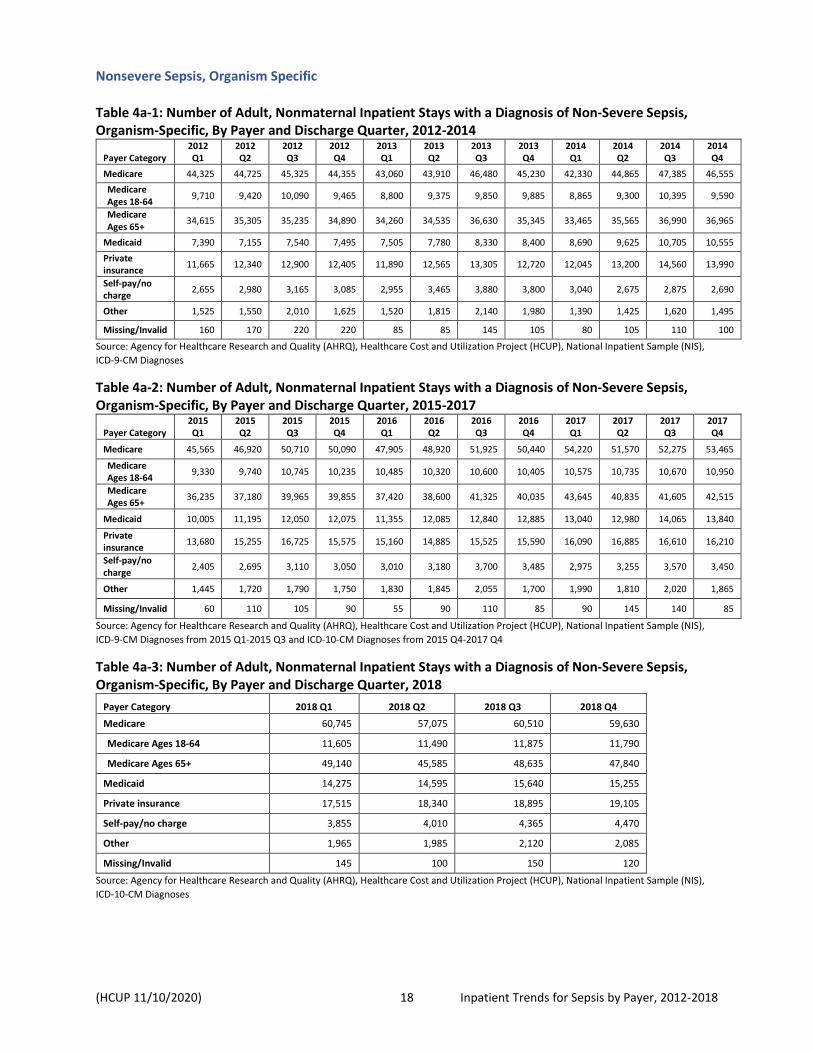
Nonsevere Sepsis, Organism Specific
Table 4a-1: Number of Adult, Nonmaternal Inpatient Stays with a Diagnosis of Non-Severe Sepsis, Organism-Specific, By Payer and Discharge Quarter, 2012-2014
Source: Agency for Healthcare Research and Quality (AHRQ), Healthcare Cost and Utilization Project (HCUP), National Inpatient Sample (NIS), ICD-9-CM Diagnoses
Table 4a-2: Number of Adult, Nonmaternal Inpatient Stays with a Diagnosis of Non-Severe Sepsis, Organism-Specific, By Payer and Discharge Quarter, 2015-2017
Source: Agency for Healthcare Research and Quality (AHRQ), Healthcare Cost and Utilization Project (HCUP), National Inpatient Sample (NIS), ICD-9-CM Diagnoses from 2015 Q1-2015 Q3 and ICD-10-CM Diagnoses from 2015 Q4-2017 Q4
Table 4a-3: Number of Adult, Nonmaternal Inpatient Stays with a Diagnosis of Non-Severe Sepsis, Organism-Specific, By Payer and Discharge Quarter, 2018
Source: Agency for Healthcare Research and Quality (AHRQ), Healthcare Cost and Utilization Project (HCUP), National Inpatient Sample (NIS), ICD-10-CM Diagnoses
(HCUP 11/10/2020) 19 Inpatient Trends for Sepsis by Payer, 2012-2018
Table 4b-1: Percent of Adult, Nonmaternal Inpatient Stays with a Diagnosis of Non-Severe Sepsis, Organism-Specific, By Payer and Discharge Quarter, 2012-2014
Missing/Invalid 1.2 0.8 1.4 1.3 0.9 0.8 1.2 1.0 0.7 0.8 1.0 0.6 Source: Agency for Healthcare Research and Quality (AHRQ), Healthcare Cost and Utilization Project (HCUP), National Inpatient Sample (NIS), ICD-9-CM Diagnoses
Table 4b-2: Percent of Adult, Nonmaternal Inpatient Stays with a Diagnosis of Non-Severe Sepsis, Organism-Specific, By Payer and Discharge Quarter, 2015-2017
Source: Agency for Healthcare Research and Quality (AHRQ), Healthcare Cost and Utilization Project (HCUP), National Inpatient Sample (NIS), ICD-9-CM Diagnoses from 2015 Q1-2015 Q3 and ICD-10-CM Diagnoses from 2015 Q4-2017 Q4
Table 4b-3: Percent of Adult, Nonmaternal Inpatient Stays with a Diagnosis of Non-Severe Sepsis, Organism-Specific, By Payer and Discharge Quarter, 2018
Source: Agency for Healthcare Research and Quality (AHRQ), Healthcare Cost and Utilization Project (HCUP), National Inpatient Sample (NIS), ICD-10-CM Diagnoses
(HCUP 11/10/2020) 20 Inpatient Trends for Sepsis by Payer, 2012-2018
Nonsevere Sepsis, Unspecified
Table 5a-1: Number of Adult, Nonmaternal Inpatient Stays with a Diagnosis of Non-Severe Sepsis, Unspecified, By Payer and Discharge Quarter, 2012-2014
Source: Agency for Healthcare Research and Quality (AHRQ), Healthcare Cost and Utilization Project (HCUP), National Inpatient Sample (NIS), ICD-9-CM Diagnoses
Table 5a-2: Number of Adult, Nonmaternal Inpatient Stays with a Diagnosis of Non-Severe Sepsis, Unspecified, By Payer and Discharge Quarter, 2015-2017
Source: Agency for Healthcare Research and Quality (AHRQ), Healthcare Cost and Utilization Project (HCUP), National Inpatient Sample (NIS), ICD-9-CM Diagnoses from 2015 Q1-2015 Q3 and ICD-10-CM Diagnoses from 2015 Q4-2017 Q4
Table 5a-3: Number of Adult, Nonmaternal Inpatient Stays with a Diagnosis of Non-Severe Sepsis, Unspecified, By Payer and Discharge Quarter, 2018
Missing/Invalid 340 355 360 395 Source: Agency for Healthcare Research and Quality (AHRQ), Healthcare Cost and Utilization Project (HCUP), National Inpatient Sample (NIS), ICD-10-CM Diagnoses
(HCUP 11/10/2020) 21 Inpatient Trends for Sepsis by Payer, 2012-2018
Table 5b-1: Percent of Adult, Nonmaternal Inpatient Stays with a Diagnosis of Non-Severe Sepsis, Unspecified, By Payer and Discharge Quarter, 2012-2014
Missing/Invalid 1.9 2.6 3.1 2.5 2.6 2.3 2.9 2.7 3.3 3.2 3.6 2.2 Source: Agency for Healthcare Research and Quality (AHRQ), Healthcare Cost and Utilization Project (HCUP), National Inpatient Sample (NIS), ICD-9-CM Diagnoses
Table 5b-2: Percent of Adult, Nonmaternal Inpatient Stays with a Diagnosis of Non-Severe Sepsis, Unspecified, By Payer and Discharge Quarter, 2015-2017
Source: Agency for Healthcare Research and Quality (AHRQ), Healthcare Cost and Utilization Project (HCUP), National Inpatient Sample (NIS), ICD-9-CM Diagnoses from 2015 Q1-2015 Q3 and ICD-10-CM Diagnoses from 2015 Q4-2017 Q4
Table 5b-3: Percent of Adult, Nonmaternal Inpatient Stays with a Diagnosis of Non-Severe Sepsis, Unspecified, By Payer and Discharge Quarter, 2018
Source: Agency for Healthcare Research and Quality (AHRQ), Healthcare Cost and Utilization Project (HCUP), National Inpatient Sample (NIS), ICD-10-CM Diagnoses


![HAI Peer Learning Network Peer Sharing Event...Number of hospital stays for septicemia more than doubled from 2000-2009 [2] ... Williams SN, Defrances CJ, Golosinskiy A. Inpatient](https://static.documents.pub/doc/80x56/5f471801388fac715074e2f1/hai-peer-learning-network-peer-sharing-event-number-of-hospital-stays-for-septicemia.jpg)
