VICTORIAN INJURY SURVEILLANCE SYSTEM HAZARD 15 page 1 Hazard (Edition No. 15) July 1993 Victorian Injury Surveillance System Monash University Accident Research Centre ISSN - 1320 - 0593 V.I.S.S. Virginia Routley Julie Valuri Introduction There were 4,170 cases of sports injury to persons aged 15 years and over who presented to the emergency departments of the Western Hospital (2 years) and the Latrobe Regional Hospital, Preston & Northcote Community Hospital and Royal Melbourne Hospital (1 year)*. These injuries represented 11% of all adult injury cases but were relatively minor compared with most other injuries (admission rate 9% compared with a non-sports injury rate of 19%). As a major context of injury sport was fourth to leisure or recreation excluding sport (29%), work (18%) and transport (15%). In this report sports injury refers to exercise activities which are pre- dominantly competitive. It therefore generally excludes bicycling and recreational activities such as trampolining, skateboarding and roller- blading. Sports injuries also present to general practitioners, sports medicine personnel, physiotherapists, speciality hospitals and chiropractors and therefore emergency department presentations are presumably only the tip of the iceberg. Dr Gary Egger estimated in his report to the Better Health Commission that sports injuries cost the community $1 billion per year and that approximately half of these could be prevented. (Egger 1990). VISS Data: Detailed Analysis Eighty-two percent of victims of sports injury were male, the majority of females having been injured while playing netball or basketball. Two thirds of adult injury cases were in the 15 to 24 year age group. Organized competition or practice accounted for 92% of injury cases where the context was specified, the remainder were backyard or schoolground games. The age distribution is shown in Figure 1 and it is interesting to note that the proportions for injured players were greater than participants for those aged under 30 years - it appears that the older a sports participant the less likely they are to be injured! Younger players are more likely to play high speed team games eg football, basketball, badminton and netball. Older players more commonly play lawn bowls, golf, tennis and snooker (ABS 1990). Obviously social factors such as an aging population, gender participation rates**and changes in the current This issue of Hazard examines adult sports injury and rollerblading, thus building on previous Hazard reports of children’s sports injury and a range of recreational injuries. VISS now has 130,000 cases on its database, including more than 50,000 adult injury cases thus significantly increasing the potential to identify the nature and sources of adult injury. Adult Sports Injury * Western Hospital 1/1/91 to 31/12/92, Latrobe Regional Hospital 1/7/91 to 30/6/92, Royal Melbourne Hospital and Preston and Northcote Community Hospital 1/3/92 to 28/2/93. ** A study in New Zealand noted women as having a lower risk than men for the same sport. (ACC, Corporate Affairs, New Zealand, 1990).
Transcript
VICTORIAN INJURY SURVEILLANCE SYSTEM HAZARD 15 page 1
Hazard(Edition No. 15)July 1993
Victorian InjurySurveillance System
Monash UniversityAccident Research Centre
ISSN - 1320 - 0593
V.I.S.S.
Virginia RoutleyJulie Valuri
IntroductionThere were 4,170 cases of sports injuryto persons aged 15 years and over whopresented to the emergency departmentsof the Western Hospital (2 years) andthe Latrobe Regional Hospital, Preston& Northcote Community Hospital andRoyal Melbourne Hospital (1 year)*.These injuries represented 11% of alladult injury cases but were relativelyminor compared with most other injuries(admission rate 9% compared with anon-sports injury rate of 19%). As amajor context of injury sport was fourthto leisure or recreation excluding sport(29%), work (18%) and transport (15%).
In this report sports injury refers toexercise activities which are pre-dominantly competitive. It thereforegenerally excludes bicycling andrecreational activities such astrampolining, skateboarding and roller-blading.
Sports injuries also present to generalpractitioners, sports medicinepersonnel, physiotherapists, specialityhospitals and chiropractors andtherefore emergency departmentpresentations are presumably only thetip of the iceberg. Dr Gary Eggerestimated in his report to the BetterHealth Commission that sports injuriescost the community $1 billion per yearand that approximately half of thesecould be prevented. (Egger 1990).
VISS Data: Detailed AnalysisEighty-two percent of victims of sportsinjury were male, the majority offemales having been injured whileplaying netball or basketball. Two thirdsof adult injury cases were in the 15 to 24year age group.
Organized competition or practiceaccounted for 92% of injury cases wherethe context was specified, the remainderwere backyard or schoolground games.
The age distribution is shown in Figure1 and it is interesting to note that theproportions for injured players weregreater than participants for those agedunder 30 years - it appears that the oldera sports participant the less likely theyare to be injured! Younger players aremore likely to play high speed teamgames eg football, basketball, badmintonand netball. Older players morecommonly play lawn bowls, golf, tennisand snooker (ABS 1990). Obviouslysocial factors such as an agingpopulation, gender participationrates**and changes in the current
This issue of Hazard examines adult sports injury and rollerblading, thus building on previous Hazard reports of children’ssports injury and a range of recreational injuries.
VISS now has 130,000 cases on its database, including more than 50,000 adult injury cases thus significantly increasing thepotential to identify the nature and sources of adult injury.
Adult Sports Injury
* Western Hospital 1/1/91 to 31/12/92, Latrobe Regional Hospital 1/7/91 to 30/6/92, Royal MelbourneHospital and Preston and Northcote Community Hospital 1/3/92 to 28/2/93.
** A study in New Zealand noted women as having a lower risk than men for the same sport.(ACC, Corporate Affairs, New Zealand, 1990).
VICTORIAN INJURY SURVEILLANCE SYSTEM HAZARD 15 page 2
emphasis on health and fitness willinteract with any counter-measures inreducing future injury.
Over half (54% of injury cases) occurredat the weekend, particularly Saturdayafternoon (26%). The seasonal distrib-ution by calendar month is shown in Figure2. The winter peak reflects the footballand soccer seasons. May is the beginningof this season when players are not soused to the game and the grounds are morelikely to be wet and slippery.
The frequencies of presentations andadmissions of injured players fromvarious sporting activities are listed in
Table 1. The number of injured playerspresenting for each sport is a functionof the relative sport’s risk, the sex ratio,the total number of playing hours andthe number of participants. Relativerisks calculated are reasonablyconsistent with those cited by otherstudies. (ASMF Sports Survey,ACT1989/90; Egger 1990; ACC,Corporate Affairs, N.Z 1990).
It appears that the rate of football, soccerand, to a lesser extent, rugby present-ations are high because they are contactsports and are played almost exclusivelyby males. Considering their high
participation rates, tennis and squash,have relatively few injured playerspresenting at VISS emergency depart-ments. Both however, especially squash,are leading causes of sports eye injurypresenting to the Royal Victorian Eyeand Ear Hospital.
Sports with the highest injuryfrequencies and/or apparent levels ofrisk are considered in more detail below.
Causes of Injury‘Over-exertion/ over-reaching’ led to theinjury occurring in at least 58% of cases,the ‘player in a dangerous position’ in14% and ‘falls on the same level’ in11% of cases. See Table 2 for details ofthe breakdown events for a number ofkey sports.
Victims were most commonly directlyinjured by being hit by either a person oran object, usually a ball (37% ); by hittingagainst another player, the ground or anobject(29%) or by strain or over-exertion (26%). See Table 3 for directcauses of injury by sport.
InjuriesSprains and strains, especially to theankle and knee accounted for 30% ofinjuries and fractures, especially to thefingers accounted for 25%. Body partsinjured were most frequently the ankles,fingers and knees (39% of injuries).Ankle sprains/ strains were the mostcommon single injury, representing 14%of all injuries. See Tables 4 and 5 forcomparative statistics.
Comparison with ChildrenChildren’s sports injuries, althoughpredominantly to boys, were somewhatmore evenly distributed among the sexesthan adult injuries. (Eighty-two percentof adult sports injuries were to men and75% of children’s injuries were to boys).
Football represented a higher proportionof sports injury cases for adults thanchildren (36% adult v 31% children) asdid netball (9% adult v 6% children).Gymnastics, physical education andtrack and field were under-representedfor adults compared with children. Theseare usually school activities which formpart of classroom instruction (8% ofinjury cases to adults aged 15 years or
Age Distribution Figure 1Adult Sports Injuries and Participation Rates
Seasonal Distribution Figure 2Adult Sports Injuries
VICTORIAN INJURY SURVEILLANCE SYSTEM HAZARD 15 page 3
greater occurred in school comparedwith 42% for children).
Injuries were more frequently to the lowerlimbs for adults (41 % injuries) and theupper limbs for children (50% injuries).Inflammation, swelling, oedema and pain;sprains/ strains and dislocations were morefrequent for adults; bruising and fracturesfor children.
The high proportion of lower limbinjuries for adults could be attributed toankle sprains/ strains (14% adult v 7%children’s injuries) and knee sprains/strains (6% adults v 3% children’sinjuries). However, finger (18% childrenv 11% adults) and forearm injuries (10%children v 4% adults) did not occur sofrequently for adults.
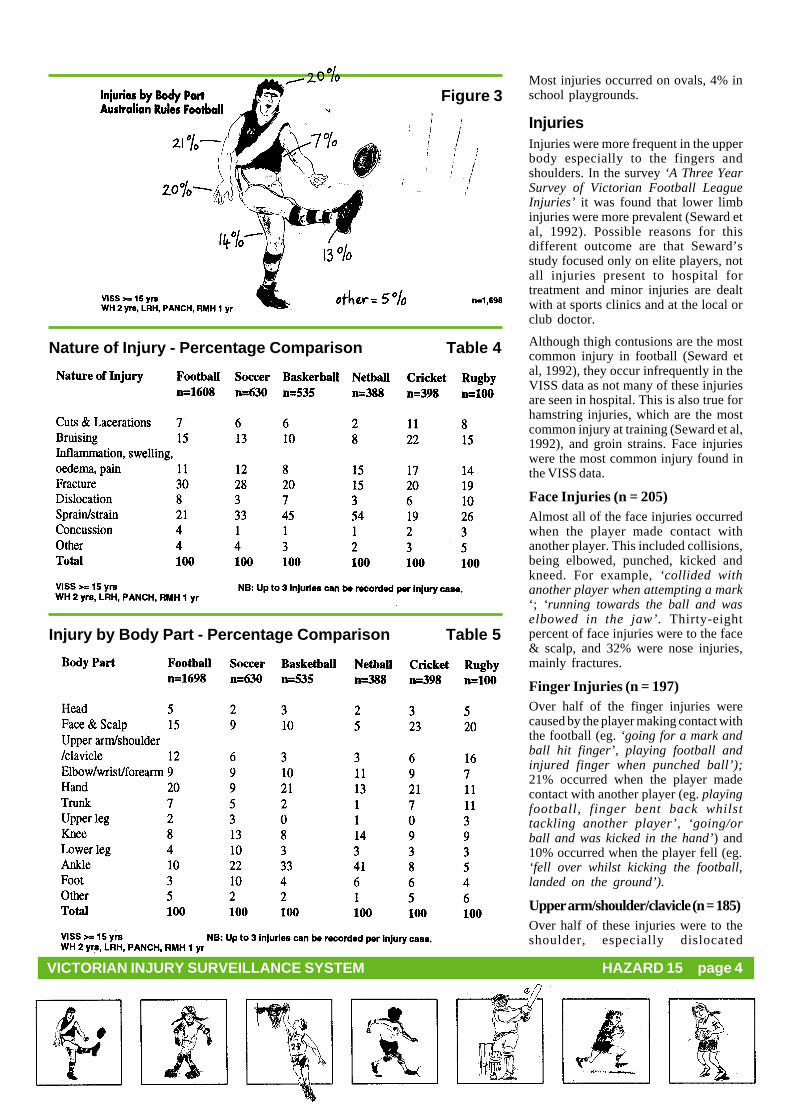
Australian Rules Football(N=1517)Football had the highest presentation ofinjuries with 36% of all sports injuries.The majority of players injured weremale (98% ). Most injuries occurred inthe 15 to 24 year group (20% ofinjuries). Eleven percent of cases wereadmitted to hospital.
Football injuries peaked in May with 22%of all injuries occurring in this month.
Over-exertion/ over-reaching led to theinjury occurring in 59% of cases, fallsin 11 % and collisions in 10%.
Forty-seven percent of injuries weredirectly caused by an object or personhitting the victim. The victim hitting anobject, surface or person directly caused25% (n=383) and of these, 6 casesinvolved the player either kicking orrunning into the goal post. Strain/over-exertion accounted for 17% of injuriesand collisions 9%.
Frequency of Sports Table 1
Events Leading to Injury - Percentage Comparison Table 2
Direct Causes of Injury - Percentage Comparison Table 3* ABS Sports Participation Survey, Victoria,
1989** The rates in column 7 are only a very rough
estimate since the ABS figures relate to all ofVictoria and the VISS statistics to theemergency departments of VISS hospitalsonly. The forumla used for column 7 is VISSpresentations /ABS participants calculatedrelative to an index of 1 for tennis (the lowestrisk sport).
*** Sports included in ‘other’ are predominantly:boxing, lacrosse, physical education(schools), track and field, golf, badminton,horseriding, weightlifting and gymastics andbowling (10 pin and lawn).
VICTORIAN INJURY SURVEILLANCE SYSTEM HAZARD 15 page 4
Most injuries occurred on ovals, 4% inschool playgrounds.
InjuriesInjuries were more frequent in the upperbody especially to the fingers andshoulders. In the survey ‘A Three YearSurvey of Victorian Football LeagueInjuries’ it was found that lower limbinjuries were more prevalent (Seward etal, 1992). Possible reasons for thisdifferent outcome are that Seward’sstudy focused only on elite players, notall injuries present to hospital fortreatment and minor injuries are dealtwith at sports clinics and at the local orclub doctor.
Although thigh contusions are the mostcommon injury in football (Seward etal, 1992), they occur infrequently in theVISS data as not many of these injuriesare seen in hospital. This is also true forhamstring injuries, which are the mostcommon injury at training (Seward et al,1992), and groin strains. Face injurieswere the most common injury found inthe VISS data.
Face Injuries (n = 205)Almost all of the face injuries occurredwhen the player made contact withanother player. This included collisions,being elbowed, punched, kicked andkneed. For example, ‘collided withanother player when attempting a mark‘; ‘running towards the ball and waselbowed in the jaw’. Thirty-eightpercent of face injuries were to the face& scalp, and 32% were nose injuries,mainly fractures.
Finger Injuries (n = 197)Over half of the finger injuries werecaused by the player making contact withthe football (eg. ‘going for a mark andball hit finger’, playing football andinjured finger when punched ball’);21% occurred when the player madecontact with another player (eg. playingfootball, finger bent back whilsttackling another player’, ‘going/orball and was kicked in the hand’) and10% occurred when the player fell (eg.‘fell over whilst kicking the football,landed on the ground’).
Upper arm/shoulder/clavicle (n = 185)Over half of these injuries were to theshoulder, especially dislocated
Figure 3
Nature of Injury - Percentage Comparison Table 4
Injury by Body Part - Percentage Comparison Table 5
VICTORIAN INJURY SURVEILLANCE SYSTEM HAZARD 15 page 5
shoulders, and 27% to the clavicle,especially fractures. Most of theseinjuries were caused when the playermade contact with another player. Thisincludes collisions, being kicked, hitsor knocks, and tackles. Falls were also amajor cause of injury with playerstripping, slipping on the ground or fallingwhen going for the ball.
Ankle injuries (n = 166)Sixty-three percent of ankle injurieswere sprains/strains. Most of theseinjuries occurred when a player went fora mark and landed awkwardly or fell. Forexample, ‘went for a mark and landedawkwardly on ankle’ or ‘fell over andtwisted ankle’. Some of the falls couldbe attributed to the player slipping ortripping, being involved in a tackle,colliding with another player or jumpingup for the ball.
Head Injuries (n = 84)Although head injuries were only 6% offootball presentations, a third of theseinjuries were admitted to hospital,highlighting the severe nature of suchinjuries. Most of the head injuries wereconcussion and a third of these wereadmitted. The majority of head injurieswere caused when a player was struckby, or collided with, another player. Forexample, ‘playing football, was hit onside of head by opponent’s fist and fellto the ground’; ‘collided with anotherplayer, clash of heads ‘.
Prevention1. Seward recommends that ankles
should be strapped for trainingand during games to preventinjuries. Players with a pasthistory of serious ankle injuriesshould be re-strapped at half timeor wear lace-up ankle braces.(Seward, 1992). Thiscountermeasure has not beenevaluated.
2. Mouthguards should be worn attraining and at matches to preventdental injuries.
3. The remarkable protectionprovided by modified rules forjunior football should beexamined for elements whichcould be incorporated into theadult game.
4. Rule changes should be imple–mented to prevent significantlyinjured players remaining on, orreturning to, the playing field.
5. Effective padding of the goal andpoint posts.
6. Removal of extraneous objectsfrom the playing area.
7. Further research is required todetermine the effectiveness ofhelmets, gloves, bicycle shortsand high or low cut boots asprotective devices in Australianrules football.
Soccer (N = 602)The majority of soccer injuries occurredto males (96%). Forty-two percent ofinjuries presented were in the 15 to 19year age group and 29% in the 20 to 24group. Of those presenting to hospital,8% were admitted for further treatmentand most of these were for lower leginjuries.
Indoor soccer accounted for 14% of allsoccer injuries. Almost all of the injuredfemales were playing indoor soccer.Players were 3 times as likely to getankle sprains in indoor rather thanoutdoor soccer. Consequently there aremore lower limb injuries in indoorcompared to playing outdoors. Outdoorsoccer injuries peaked in March, Mayand August (during winter months)whereas indoor soccer injuries peakedin September and October.
Over-exerting/over-reaching led to 56%of injuries occurring, falls 20% andcollisions 11 %. Most injuries weredirectly caused when the player hitagainst an object person (35%), an objector person hitting the player caused 30%of injuries, strain/ over-exertion 27%and collisions 7%.
Soccer Injuries Figure 5by Body Part
InjuriesMost injuries occurred in the lowerextremities of the body, mainly ankleand knee sprains /strains, and fracturesto the tibia /fibula. The injuries oftenoccurred when there was player contact,eg being kicked or collisions.
Ankle injuries (n = 142)The majority of ankle injuries weresprains /strains. Almost a third were fromplaying indoor soccer. Most of the ankleinjuries occurred when the player waskicked in the ankle by another player,when the player fell or when the playerlanded awkwardly after jumping orrunning. Four injured players stated thatthey were wearing ankle protection.
Knee injuries (n = 84)Most knee injuries occurred when theplayer made contact with another player,ie. during a tackle, collision or by beingkicked/struck. Sprains /strains accountedfor two-thirds of the injuries and almostall of these occured during an outdoorsoccer match. No knee injuries requiredadmission to hospital.
Figure 4
VICTORIAN INJURY SURVEILLANCE SYSTEM HAZARD 15 page 6
Lower leg injuries (n =61)Lower leg injuries had the highestnumber of admissions for soccerinjuries, 44% of all soccer admissions.Over half of these injuries were fracturesto the tibia/fibula.
Most of the injuries occurred when aplayer was kicked, eg. ‘running to catchball, kicked in shin by another player’.Players were also kicked during a tackle,eg. playing indoor soccer, received akick during a rough tackle byopponent’.
Prevention1. Shin guards may offer some
protection when worn at trainingand during games to reduce lowerleg injuries. The effectiveness ofthese should be evaluated.
2. Education of coaches and trainers.According to Egger this is belowthe level of other football codes.(Egger, 1990).
3. Investigation of the effectivenessof strapping to reduce anklesprain/strains.
Basketball (n=511)Almost half of these injuries were to the15-19 year age group, ie the playerswere relatively young. Basketball injurycases were 70% men reflecting that thissport is more evenly balanced betweenthe sexes than other sports. Injuries weremore evenly spread throughout the yearthan other sports.
Sixty-three percent of cases occurredon a non-school basketball court and15% at school. Eighty-eight percentwere involved in organised competitionor practice.
The events leading to injury were morelikely to be over-exertion/over-reaching(64%) and falls (24%), especially thoseon the same level and trips, than forother sports.
InjuriesInjuries were predominantly to the ankle(33%) and were almost entirely sprains/strains. In fact, ankle sprains /strainsrepresented 28% of all injury cases.Sprains/strains, dislocations andfractures to the fingers, accounted for18% of injuries. Arm and wrist fracturesrepresented the most severe injuries.
Ankle sprains/strains (n = 143)These occurred more often to theyounger players and therefore frequentlyoccurred in schools (27% ankle sprains/strains in schools v 15% other injuriesin schools). They were usually a resultof over-exertion (73%) or tripping (11%). Typical scenarios were ‘landed ofoot awkwardly after jumping for ball’and ‘tripped over another person’s footand fell over’.
Elbow/wrist/forearm InjuriesThese 59 injury cases were almost allcaused by falls, particularly on the samelevel. Typical scenarios were ‘fellbackwards, landing on extendedwrists’ and ‘knocked over by anotherplayer, landed on arm.’
Finger InjuriesThere were 79 finger injuries, almostall caused by the ball being caughtincorrectly. Typical scenarios were ‘ballforced fingers on the left hand to bendawkwardly’ and ‘rebound ball hit endof finger’.
Basketball injuries Figure 6by Body Part
Prevention1. Wearing of highcut shoes to
reduce ankle injury.2. Investigation of the effectiveness
of bracing and taping ankles toreduce injury, especially for thosewho have been previously injured.
3. An optimum warm-up period ofbetween 5 and 9 minutes and nolonger than 30 minutes.
4. Investigation of the correction oflanding techniques to reduce ankleinjuries.(ASMF, 1993)
Netball (0=371)One third of injured players were in the20-24 year age group and almost allinjuries occurred in organised competi–tion or practice.
Eighty-five percent of netball injurieswere to women. Men’s injuries wereconcentrated in the 20-24 age group(48% of male injuries) and mostoccurred at indoor cricket centres wheremixed teams are a fairly recent pheno-menon. Men tend to have higher injuryrates than women for netball, as for mostsports (ACC 1990), with the conse-quence that as netball increases inpopularity amongst men, injuries can beexpected to rise.
Indoor court injuries were more likelyto be sprains/ strains to the ankle orknee and less likely to be inflammationof the knee.
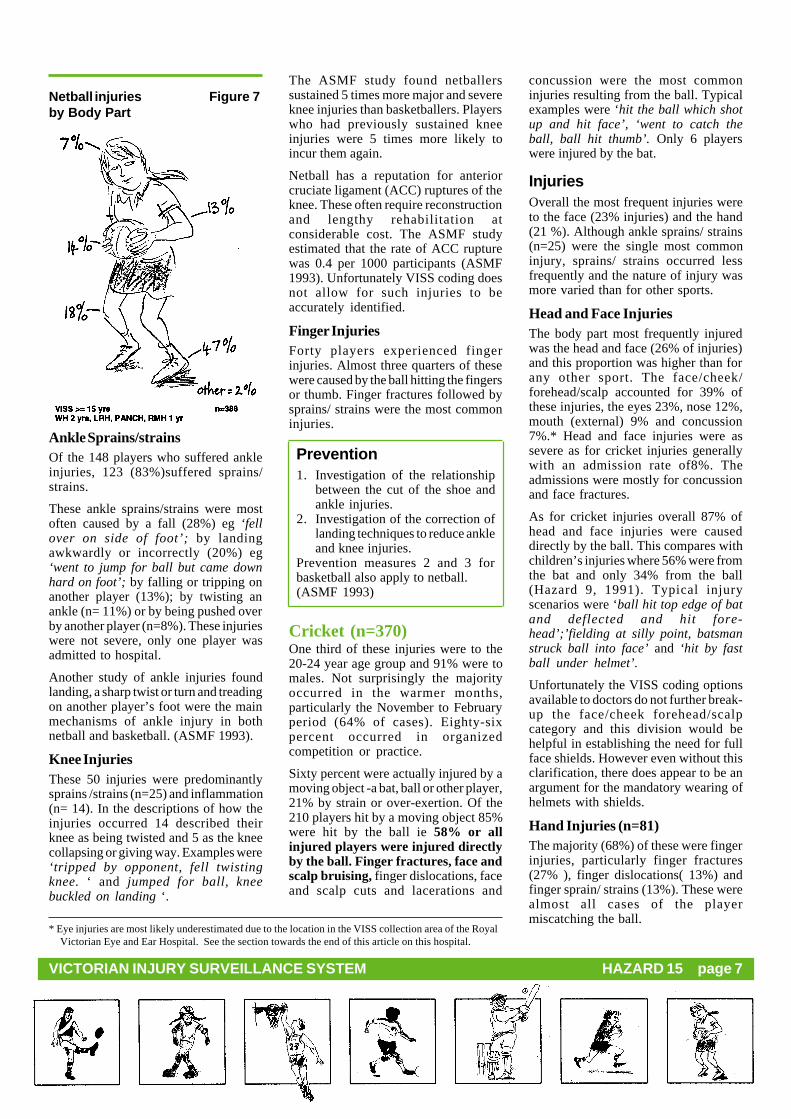
InjuriesInjuries were predominantly to the ankle(40%) and knee (14%), particularlysprains/ strains and inflammation/swelling /oedema/ pain. Hand injuriesrepresented 13% of injuries, especiallyfinger fractures and sprains /strains. Themore severe injuries, although small innumber (admission rate was 5%) wereto the ankle. The predominance of theseinjuries is supported by other studiesalthough the relative proportions differ:(20% knee, 40% ankle) (Eggers 1990),(ankle 30%, hand 21 %, knee 18% )(ASMF 1989/90).
VICTORIAN INJURY SURVEILLANCE SYSTEM HAZARD 15 page 7
Netball injuries Figure 7by Body Part
Ankle Sprains/strainsOf the 148 players who suffered ankleinjuries, 123 (83%)suffered sprains/strains.
These ankle sprains/strains were mostoften caused by a fall (28%) eg ‘fellover on side of foot’; by landingawkwardly or incorrectly (20%) eg‘went to jump for ball but came downhard on foot’; by falling or tripping onanother player (13%); by twisting anankle (n= 11%) or by being pushed overby another player (n=8%). These injurieswere not severe, only one player wasadmitted to hospital.
Another study of ankle injuries foundlanding, a sharp twist or turn and treadingon another player’s foot were the mainmechanisms of ankle injury in bothnetball and basketball. (ASMF 1993).
Knee InjuriesThese 50 injuries were predominantlysprains /strains (n=25) and inflammation(n= 14). In the descriptions of how theinjuries occurred 14 described theirknee as being twisted and 5 as the kneecollapsing or giving way. Examples were‘tripped by opponent, fell twistingknee. ‘ and jumped for ball, kneebuckled on landing ‘.
The ASMF study found netballerssustained 5 times more major and severeknee injuries than basketballers. Playerswho had previously sustained kneeinjuries were 5 times more likely toincur them again.
Netball has a reputation for anteriorcruciate ligament (ACC) ruptures of theknee. These often require reconstructionand lengthy rehabilitation atconsiderable cost. The ASMF studyestimated that the rate of ACC rupturewas 0.4 per 1000 participants (ASMF1993). Unfortunately VISS coding doesnot allow for such injuries to beaccurately identified.
Finger InjuriesForty players experienced fingerinjuries. Almost three quarters of thesewere caused by the ball hitting the fingersor thumb. Finger fractures followed bysprains/ strains were the most commoninjuries.
Prevention1. Investigation of the relationship
between the cut of the shoe andankle injuries.
2. Investigation of the correction oflanding techniques to reduce ankleand knee injuries.
Prevention measures 2 and 3 forbasketball also apply to netball.(ASMF 1993)
Cricket (n=370)One third of these injuries were to the20-24 year age group and 91% were tomales. Not surprisingly the majorityoccurred in the warmer months,particularly the November to Februaryperiod (64% of cases). Eighty-sixpercent occurred in organizedcompetition or practice.
Sixty percent were actually injured by amoving object -a bat, ball or other player,21% by strain or over-exertion. Of the210 players hit by a moving object 85%were hit by the ball ie 58% or allinjured players were injured directlyby the ball. Finger fractures, face andscalp bruising, finger dislocations, faceand scalp cuts and lacerations and
concussion were the most commoninjuries resulting from the ball. Typicalexamples were ‘hit the ball which shotup and hit face’, ‘went to catch theball, ball hit thumb’. Only 6 playerswere injured by the bat.
InjuriesOverall the most frequent injuries wereto the face (23% injuries) and the hand(21 %). Although ankle sprains/ strains(n=25) were the single most commoninjury, sprains/ strains occurred lessfrequently and the nature of injury wasmore varied than for other sports.
Head and Face InjuriesThe body part most frequently injuredwas the head and face (26% of injuries)and this proportion was higher than forany other sport. The face/cheek/forehead/scalp accounted for 39% ofthese injuries, the eyes 23%, nose 12%,mouth (external) 9% and concussion7%.* Head and face injuries were assevere as for cricket injuries generallywith an admission rate of8%. Theadmissions were mostly for concussionand face fractures.
As for cricket injuries overall 87% ofhead and face injuries were causeddirectly by the ball. This compares withchildren’s injuries where 56% were fromthe bat and only 34% from the ball(Hazard 9, 1991). Typical injuryscenarios were ‘ball hit top edge of batand deflected and hit fore-head’;’fielding at silly point, batsmanstruck ball into face’ and ‘hit by fastball under helmet’.
Unfortunately the VISS coding optionsavailable to doctors do not further break-up the face/cheek forehead/scalpcategory and this division would behelpful in establishing the need for fullface shields. However even without thisclarification, there does appear to be anargument for the mandatory wearing ofhelmets with shields.
Hand Injuries (n=81)The majority (68%) of these were fingerinjuries, particularly finger fractures(27% ), finger dislocations( 13%) andfinger sprain/ strains (13%). These werealmost all cases of the playermiscatching the ball.
* Eye injuries are most likely underestimated due to the location in the VISS collection area of the RoyalVictorian Eye and Ear Hospital. See the section towards the end of this article on this hospital.
VICTORIAN INJURY SURVEILLANCE SYSTEM HAZARD 15 page 8
Cricket Injuries Figure 8by Body Part
Indoor Cricket (n=93)One quarter of all cricket-relatedinjuries arose from indoor cricket.Women represented a larger proportionof indoor than outdoor cricket victims(14% indoor v 7% outdoor). Thisreflects the mixed nature of indoorgames. Indoor cricket players were twiceas likely to be injured by strain or over-exertion and were more likely to beinjured by a fall on the same level (13%v 7%). Outdoor players were more likelyto slip (5% outdoor v 1% indoor) and tobe hit by the ball (52% outdoor v 38%indoor).
Indoor cricket injuries were moreserious (12% indoor v 5% outdooradmission rate). The difference in theseverity can probably be attributed tothe harder surfaces of indoor flooringcompared with grass. Grass, especiallywhen wet, no doubt contributed to thehigher slip rate for outdoor cricket.
Safety EquipmentEleven percent noted having worn asafety device. The types worn were acombination of batting gloves, pads,boxes and helmets.
Figure 9
Prevention1. Compulsory wearing of helmets
with face shields for batsmen andfielders close to the wicket.
2. Since injuries from the ballrepresent such a large proportionof injuries, investigation of newdevelopments such as the lowimpact cricket ball should beencouraged, particularly foroutdoor cricket.
3. Gloves and other protective gearshould be worn for informalgames as well as competition.
4. Adequate fitness preparation.Cricket is seen as a sport whichdoes not require a lot of effortand is therefore often played byunfit players. The sudden twistsand turns required make unfitplayers prone to injury. (Egger,1990)
Rugby (Union & League)(N = 95)Thirty-five percent of presentationswere from people aged between 20 and24, 25% were in the 15 to 19 year agegroup, 20% in the 25 to 29 and 12% inthe 30 to 34. Eight percent of presenta-tions were admitted.
Over half of the injuries were caused byplayers over -exerting or over-reaching,falls caused 13% and collisions 11 %.
Being hit by a person or object accountedfor 48% of injuries. The player hittingan object/person caused 25% of injuries,strain/ over-exertion 15% and collisionbetween players 9%.
InjuriesThe majority of the rugby injuries weresprains /strains, mainly to the knee, andfractures, especially the fingers. Mostinjuries (20%), were to the face(including eyes, nose, scalp, etc) wherebeing hit or kicked was the main causeof the injury. Involvement in tackles andcollisions with other players were theother causes of face injuries.
Upperarm /shoulder /clavicle injuriesaccounted for 16% of rugby injuries.Most of these injuries were to theshoulder, mainly dislocations. Most ofthe rugby injuries occurred during atackle.
Rugby Injuries Figure 10by Body Part
Prevention1. Wearing of shoulder pads and
mouth guards should be madecompulsory.
Other SportsThe most frequent injuries for the sportswhich presented with lesser frequencieswere:
VICTORIAN INJURY SURVEILLANCE SYSTEM HAZARD 15 page 9
from over-exerting during playand falling.
Hockey - Cuts & lacerations to the faceand scalp mainly from being hitby the hockey ball or stick.
Martial Arts - Nose fractures,dislocations to the shoulder andknee. Most of these injuriesoccurred when the victim waskicked or punched by an opponentwhilst sparring. These usuallyoccurred during karate but therewere some tae kwon do, kick-boxing and ju-jitsu injury cases.
Volleyball - Ankle sprain/strains. Theseinjuries occurred mostly when aplayer, landed awkwardly afterjumping up to hit the ball, or theyfell during play.
Baseball/Softball - Ankle sprains/strains.Most of these sprains/strainsoccurred while the player wasrunning towards a base.
Squash -Ankle sprain/strains, face andscalp cuts and lacerations, eyeinjuries. Most ankle injuriesoccurred while the player wasrunning for the ball. Being hit bythe racquet caused most of theface and scalp injuries and theball caused most of the eyeinjuries.
Royal Victorian Eye andEar HospitalEye injuries represented 2% (n=81) ofall sport-related injuries on the VISSdatabase. This is likely to be a grossunderestimate of the actual situationsince the RVEEH is located close to thecollection area for VISS and many ofthe eye injury cases are likely to betaken to that hospital.
In an analysis of a RVEEH 2 year dataset (Nov 1989 to October 1991) therewere 700 cases of sport-related eyetrauma (5% of all RVEEH eye trauma)including 154 admissions. Sportrelated injuries were more severethan non-sport eye injuries (22% sportrelated v 6% other admissions). Themajority of these admissions were forhyphaemas (81%) and 19% of eyes werelegally blind at the time of initialpresentation. None of the sports
participants had worn appropriate eyeprotection at the ti~ of injury. (Fong)
The frequency of eye injury by sportpresenting at RVEEH showed that squash(17% of injuries) presented most often,followed by Australian Rules football(16%), netball /basketball (12%), tennis(8%), indoor and outdoor cricket (each7%) and badminton (3%). Tennis,badminton and particularly squash wereover-represented for eye injuries inrelation to VISS presentations (VISS 2%tennis, 1% squash, 0.2% badminton).(Fong)
Prevention1. Eye guards with lenses should be
worn for squash and badminton(squash has 3.5 times the numberof players compared withbadminton) and helmets with faceshields for cricket. Protective eyewear is mandatory in the UnitedStates and Canada for ice hockey,squash and racquet ball and hasresulted in dramatic reductions ineye injuries (Fong). Protectiveeye wear is currently beingencouraged in junior squashdevelopment programs and anAustralian Standard exists as ofSeptember 1992 for racquetsports (AS 4066).
2. Further research is required todetermine whether rule changesor improved enforcement ofexisting rules would reduce eyeand other facial injuries infootball.
Figure 11
Dental InjuriesThe Dental Hospital is located in theVISS collection area and a largeproportion of dental injury cases wouldattend here in preference to a VISShospital.
In 1989, the National Health and MedicalResearch Council stated that dentalinjuries were the most common type offacial injury that occurred during contactsports, and the majority of injuries couldhave been prevented if a professionallyfitted mouthguard had been worn.(National Health and Medical ResearchCouncil, November 1989)
Figure 12
Properly fitted mouthguards provideprotection by:
1. Decreasing the risk of injury to thefront teeth by 90%.
2. Preventing cuts to lips and cheeksfrom the sharp edges of the teeth.
3. Decreasing the risk of serious injuryto back teeth when the mouth isforcibly shut by a blow.
4. Reducing the risk of jaw fracture,especially in the area of the jaw joint.
5. Acting as a “shock absorber”, reducingthe risk of concussion. The plasticmouthguard absorbs and disperses theenergy of a blow.
PreventionThe best type of mouthguard is one that isprofessionally fitted and made from animpression of the player’s mouth. Suchmouthguards are more comfortable towear, fit better and do not make speakingand breathing difficult. (Dental HealthServices).
Mouthguards should not only be wornduring a game, but also when trainingbecause injuries will also occur duringtraining. Studies have shown that a highpercentage of football players in Victoriawear mouthguards while playing, but veryfew (less than 15%) do so when training.(Dental Health Services).
VICTORIAN INJURY SURVEILLANCE SYSTEM HAZARD 15 page 10
Broader ContextIt is not possible within the ICD 9(International Classification ofDiseases) system used by Victorianpublic hospitals to determine statewidehospital admissions resulting fromsports injury. Only two major categoriesof general sports injury can be identified.These are “fall on same level fromcollision, pushing or shoving, by or withother person in sport” and “”strikingagainst or struck accidentally by objectsor persons in sport”. Together, thesecategories contribute a yearly averageof 1845 cases of adult hospitaladmissions in Victoria (Langlois, 1992).However, this information is neithersports specific nor comprehensive.
Extrapolating from the VISS data, where9% of adult injury hospital admissions(excluding adverse effects of treatment)result from sports injury, it is estimatedfrom statewide admissions reported byLanglois (1992) that 3178 adults areadmitted to Victorian public hospitalseach year as the result of sports injury.Based on the same data sources, it isestimated that31, 729 adults present tohospital emergency departments and arenot admitted statewide each year inVictoria.
Fortunately death from sporting injuryis a rare event. There was one sport -related death, from soccer, on theCoroner’s database 1989/ 90. This brainstem death was a result of a mid-aircollision and fall onto the head andshoulders. (State Coroner’s Office,1991).
General PreventionThe Accident Compensation Commission(NZ) has calculated men to have a higherinjury rate than women for every sport.Perhaps men can learn from women thesecrets of this lower propensity forinjury!
• Warm-up, pre-season training.• Teaching of skills.• Send-off rules for unduly violent or
dangerous play.• Protective gear eg helmets, eye
protection, padding of helmets, postsand surrounds. Shock absorbentplaying surfaces. Modify rules egnetball, Australian Rules football.
• Appropriate first aid.• Not playing if injured.• Improved data collection method-
Australian Bureau of Statistics. October1989. Sports Participation Victoria.
Australian Sports Medicine Federation.1989 Sports Injury Survey. PilotProject in the ACT. 1988/89.
Australian Sports Medicine Federation.1993 Ankle and Knee Injuries in Eliteand Recreational Netball andBasketballers Funded by: VictorianHealth Promotion Foundation.
Coleman,P, Nicholl,J, Williams,B.November , 1991. A National Study ofthe Epidemiology of Exercise-RelatedInjury and Illness. Part 11 Medical CareResearch Unit. A Report to the SportsCouncil.
Egger,G. October 1990. Sports Injuriesin Australia Causes, Costs andPrevention. A Report to the NationalBetter Health Program Centre for HealthPromotion and Research. Sydney.
Seward, Ho and Patrick,J, (1992), AThree Year Survey of Victorian FootballLeague Injuries, The Australian Journalof Science and Medicine in Sport,24(2):51-54, Abstract.
State Coroner’s Office. Victoria. 1991.Unnatural Deaths 1989/90.
VICTORIAN INJURY SURVEILLANCE SYSTEM HAZARD 15 page 11
RollerbladingInjuriesDr Doug Heller
Injuries associated with the use ofrollerblades or in-line roller skatesappear to be the latest “fad epidemic”,following hard on the heels of the rise inskateboarding and rollerskating injurieswitnessed in recent years.
In-line skates have been used as an aid toprepare for skiing and this illustratesthat they are fast! They are alsoincreasingly popular as a leisure “toy”:50,000 pairs were sold in Melbournelast Christmas and they are available forhire at skating rinks and at specialistshops. Rollerbladers can be seen inaction in a wide variety of settings, fromdesignated bowls and ramps to thefootpath and highway.
A number of councils have moved torestrict places where rollerblades maybe used, for example the use of anexisting local law, 1/ 89 Control of ToyVehicles, to prohibit their use in certainparts of Malvern. Councils areconcerned, not only by the risk to therollerblader, but particularly by that topedestrians who may be involved in anycollision.
VISS DataIn 1989 VISS hospitals recorded nocases of rollerblading injury but in 1992there were 113.1 Due to the expansivenature of the VISS collection, the trendfor under 15 year olds only includingthe projected figure for 1993 is shownin Figure 1.
The age and sex distribution for 1992(all ages) is shown in Figure 2. Most(59%) of these cases occurred in 10-14year olds, representing 1.4% of allinjuries in that age group. Interestinglytwo were in the 35-39 group althoughthere were no cases over forty.
Dr Heller is a paediatrician from England working in Victoria for a year; he holds appointments as a consultant paediatrician at theWestern Hospital, Sunshine and as Lecturer in Paediatrics at the Royal Childrens Hospital.1 VISS collection 1989 RCH, WH, PANCH (Children), 1992 - RCH (children) WH, LRH, PANCH, (all ages), RMH (adults)
Trend in Rollerblading Injuries - Children Figure 1
Age and Sex Distribution Figure 2Rollerblading Injuries
VICTORIAN INJURY SURVEILLANCE SYSTEM HAZARD 15 page 12
InjuriesThe pattern of injuries appears to besimilar to that seen with skateboardswith the upper limbs being mostvulnerable. Fifty-eight percent of allinjuries were fractures, most commonlyof the forearm and wrist (43% of allinjuries). There were only 5 fracturesinvolving the lower limbs and there wasone skull fracture. Other injuriesincluded cuts and lacerations (5%),bruising (9%) and sprains (15%). Sixteenpercent of injury cases were admitted tohospital, a figure comparable to that forskate board injuries and most of thesewere fractures. See Figure 3 for bodyparts injured.
LocationForty-nine percent of injuries wereincurred in areas used by transport,nearly half of these on footpaths, theremainder occurred on public or privateroads and driveways or parking areas.Relatively few injuries occurred in“safe” areas such as playgrounds, parksand skating rinks. In the home twoinjuries were sustained in the familyroom and one in the kitchen!
It shas been suggested that rollerbladesmight be used as a substitute for a bicycle
as a means of transport and forrecreational use. Of the 113 injuries, 2were reported as being incurred whilstbeing used for transport rather thanrecreation.
There were no cases of a pedestrianbeing injured by a rollerblader althoughone injury occurred when tworollerbladers collided.
The event that led to injury most oftenwas losing control of the rollerblades(63%) and a fall with outstretched armsonto a hard surface. One rollerbladerwas run over by a truck, fortunatelysustaining only an ankle strain/sprainand this was the only case involvinganother vehicle. Generally the surfacewas concrete of varying evenness.
Telephone Follow upSurveyA telephone survey of 24 of the youngpeople involved in rollerblading injurieswho had presented to the EmergencyDepartment of the Royal Children’sHospital revealed some interesting
findings. (Table 1.) There are two maingroups at risk:
1) Those who have just started torollerblade and who simply lose controland fall, often at relatively low speeds.They do not wear wrist protectors.
2) Those who are experienced andconfident who are trying out a new stunt,often on a ramp at considerable speed. Asignificant proportion of this latter grouphas worn safety equipment in the pastbut taken it off at the time of the injury.
Twenty-four percent of those recordedas having an injury in 1992 were wearingsafety equipment of some sort, butinterestingly, only 14% of those whoseinjuries were serious enough to warranthospital admission did so. Many (25%)of those questioned had borrowed theirskates and had learnt by trial and error,usually in the home, on the driveway oron a footpath. A few (8%) had gone to arink for their first rollerbladingexperience but none had used anaccredited coach. Of those who were
Rollerblading Figure 3Injuries by Body Part
VICTORIAN INJURY SURVEILLANCE SYSTEM HAZARD 15 page 13
still using rollerblades (and only onehad stopped as a direct result of theiraccident, although quite a number hadsimply lost interest) 47% did so in thestreet although a few were now limitingtheir activities to skating rinks/bowls.
Although there is now evidence thatrollerblading is leading to a significantnumber of injuries it is not possible toquantify the risk as we do not know howmany people are using blades and howoften; 113 people were recorded asattending VISS hospitals in 1992 with arollerblading injury, compared with 115skateboarding and 206 rollerskatinginjuries but this does not mean thatrollerskating is twice as dangerous asrollerblading or skateboarding.
We can, however, conclude that thecommonest injury presenting to hospitalis a fracture of the lower arm (43%),that people who have had an injurygenerally do not wear protective gear(76%), that they learn by trial and errorwithout the supervision of trainedinstructors and that they rollerblade inwhat are sometimes unsuitablelocalities.
Rollerblading ExperienceWhat could the beginner do in order toreduce their chance of injury beyondsimply borrowing a friend’s blades andgoing out onto the street to learn by trialand error? It is possible to hirerollerblades at a number of skating rinksin Melbourne but the protective gear hasto be bought, something which thebeginner may find financiallyunattractive. It is then often a questionof going out
into a mixed session on the rinks withrollerbladers and skaters of differingabilities and having a go!
Alternatively, there are a number ofshops that hire both rollerblades andsafety equipment and which offer tuition.However, there are only two shops inMelbourne which have coachesaccredited by the Roller SportsAssociation. The drawback here may becost as hiring the equipment and payingfor lessons can be relatively expensive.One of the benefits is that there issomeone experienced to rollerbladealongside with the novice who can catchthem if they begin to fall. Perhaps a
compromise is to have a friend who isexperienced and responsible accompanythe beginner during their first fewsessions.
Whichever method is used it is importantto consider the quality of rollerbladeused as
some have wheels and bearings whichcan make learning harder and which stoprolling when they hit quite minorirregularities in the surface, leading to afall. The boot also needs to be properlyfitted so as to provide firm support forthe ankle.
RecommendationsRollerblading is an exhilarating pastimeand a good way of developingcoordination. It is important not todiscourage an activity which can be asource of healthy activity for a broadage-group, however, as this pastimebecomes more popular safetyconsiderations are likely to become ofgreater concern. To date there has beenlittle in the way of published researchbut it is possible to make somepreliminary recommendations based onthe available evidence and drawing onthe literature with respect toskateboarding, ice and rollerskating withwhich it shares some features.
1) It seems likely that, likeskateboarding, rollerblading isparticularly dangerous near traffic andintimidating to pedestrians so selectionof suitable areas to rollerblade in isimportant. These could include skatingrinks and bowls, parks, playgrounds andpossibly bicycle tracks.
2) Young children should not userollerblades. Considerable skill isneeded and children under five areunlikely to have the necessary strengthand coordination and thus will be atparticular risk of injury.
3) The use of safety equipmentneeds to be encouraged and its effectmonitored, possibly with a view tomandatory use. Helmets and wristprotectors would seem to be a sensibleminimum amount of safety equipment,with knee and elbow guards desirable.
4) Those injured are commonly firsttime users and some kind of initialtraining in a protected environment, for
example in a separate beginners area ifat a skating rink, may be of benefit.
5) Public outlets that hire rollerblades should also have available suitablesafety equipment for hire and use of thisshould ideally be made a condition ofhire for all age groups.
6) Outlets that sell rollerbladesshould be in a position to give suitableadvice on fitting, offer initial tuition andrecommend the use of safety equipment.
ReferencesCass D.T., Ross F. SkateboardingInjuries. Med J. Aust. 1990;153(3): 140-144.
Prendergast R.A. Skateboard Injuries inChildren and Adolescents. J. Adolesc.Health Care. 1990;11(5):408-412.
Sedlin,J.D., Zitner, T., McGinnis,G.Roller Skating Accidents and Injuries.J.Trauma. 1984;24(2): 136-139.
VICTORIAN INJURY SURVEILLANCE SYSTEM HAZARD 15 page 14
- Index -Subject ...............................................................................................Edition .......................Pages
- Cyclist head injury study ............................................................................... 2 ...................................... 2- Cyclist head injury study updates..........................................................7,8,10 ..............................8,13,9
Data base use, interpretation & example of form ................................................................. 2 .................................. 2-5Deaths from injury (Victoria) ............................................................................................. 11 ................................ 1-11Dogs - Dog related injuries ....................................................................................... 3 .................................. 5-6
- Dog bite injuries .......................................................................................... 12 .................................... 12Domestic architectural glass ................................................................................................. 7 ................................ 9-10Drowning/near drowning, including updates ..................................................................2,5,7 ............................ 3,1-4,7Exercise bicycles, update .................................................................................................5,9 ........................... 6,13-14Home injuries .................................................................................................. 14 ................................ 1-16Horse related injuries .................................................................................................... 7 .................................. 1-6Infants - injuries in the first year of life ................................................................................ 8 ................................ 7-12Intentional injuries .................................................................................................. 13 ................................ 6-11Latrobe Valley- The first three months ................................................................................ 9 ................................ 9-13
- Drug safety and poisons control .................................................................... 4 .................................. 1-9- Dishwasher detergent, update .................................................................. 10,6 ............................. 9-10,9
School injuries .................................................................................................. 10 .................................. 1-8Skateboard injuries .................................................................................................... 2 .................................. 1-2Sports - Sports related injuries .................................................................................... 8 .................................. 1-6
- The 5 most common sports .......................................................................... 9 .................................. 1-8- Adult sports injury ....................................................................................... 15 ................................ 1-10
Trampolines .................................................................................................. 13 .................................. 1-5VISS: early overview .................................................................................................... 1 .................................. 1-5VISS: how it works .................................................................................................... 1 .................................. 6-8
* Special edition
VICTORIAN INJURY SURVEILLANCE SYSTEM HAZARD 15 page 15
VISS StaffDirector: Dr Joan Ozanne-SmithCo-ordinators: Virginia Routley
General AcknowledgementsParticipating HospitalsRoyal Children's Hospital Western Hospital
Preston and Northcote Latrobe Regional HospitalCommunity Hospital (Traralgon and Moe)
Royal Melbourne Hospital
The contributions to the collection of VISS data by the directors and staff of theEmergency Departments of these hospitals, other participating clinicians, MedicalRecords Departments, and ward staff are all gratefully acknowledged. The surveillancesystem could not exist without their help an co-operation.
Coronial ServicesAccess to coronial data and links with the development of the Coronial's Servicesstatistical databse are valued by VISS.
National Injury Surveillance UnitThe advice and technical back-up provided by NISU is of fundamental importanceto VISS.
How to AccessVISS Data:VISS collects and tabulates informationon injury problems in order to lead tothe development of prevention strategiesand their implementation. VISS analysesare publicly available for teaching,research and prevention purposes.Requests for information should bedirected to the VISS Co-ordinator or theDirector by contacting them at the VISSoffice.
VISS is located at:Building 70Accident Research CentreMonash UniversityWellington RoadClayton, Victoria, 3800
HAZARD VOLUME 1Bound Editionof Hazards 1-10These are available from VISS. Ahandling and postage fee of $10applies.
VICTORIAN INJURY SURVEILLANCE SYSTEM HAZARD 15 page 16
This .pdf version re-created by Glenda Cairns.
VISS is a project of the Monash University Accident Research Centre.
Hazard was produced by the Victorian Injury Surveillance System (VISS) with the artistic and graphicsassistance of Janet Green, Monash University - Caulfield and Ann James - Books Illustrated
Project Funded byVictorian Health Promotion Foundation