+ All Categories
Home > Documents > Advanced analysis of aquatic plankton using ˜ow cytometry · Advanced analysis of aquatic plankton...

Advanced analysis of aquatic plankton using ˜ow cytometry · Advanced analysis of aquatic plankton...

Date post: 25-May-2019
Category:
Upload: dangthuy
View: 222 times
Download: 0 times
Share this document with a friend
2
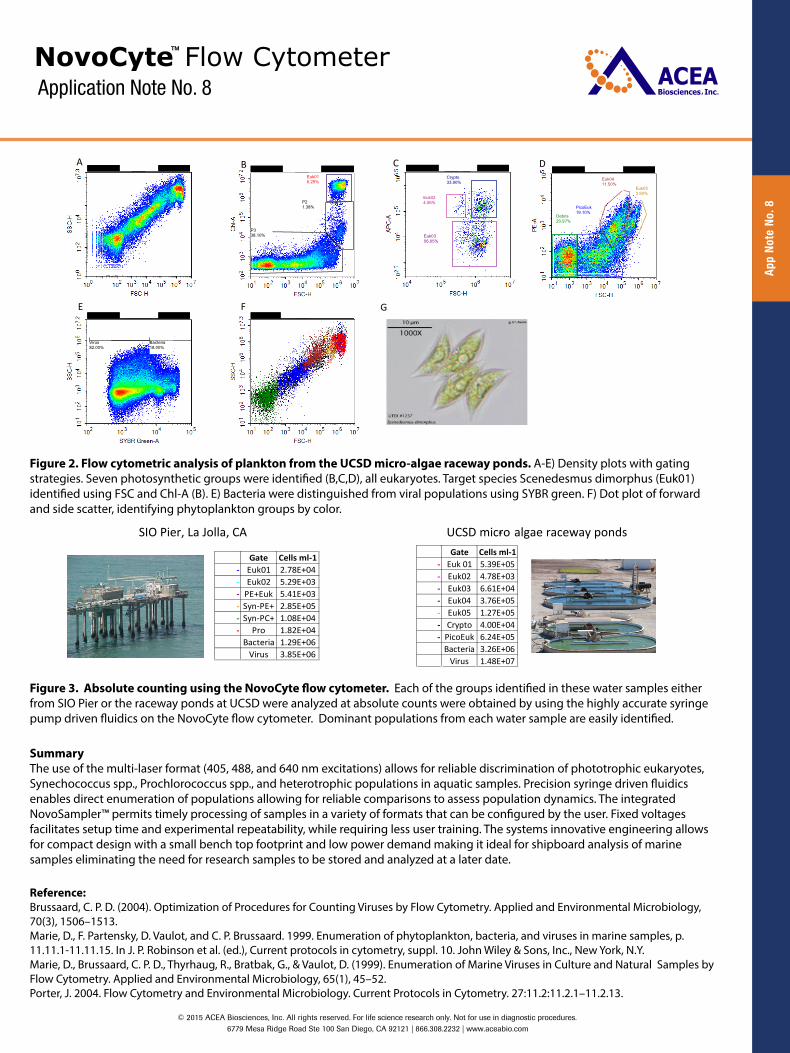
Pro 42.75% Application Note No. 8 App Note No. 8 © 2015 ACEA Biosciences, Inc. All rights reserved. For life science research only. Not for use in diagnostic procedures. 6779 Mesa Ridge Road Ste 100 San Diego, CA 92121 | 866.308.2232 | www.aceabio.com Advanced analysis of aquatic plankton using flow cytometry Matthew Haynes, Brian Seegers, and Alan Saluk Flow Cytometry Core Facility, The Scripps Research Institute, La Jolla, CA Flow cytometry has routinely been used to study phytoplankton by taking advantage of innate fluorescence molecules that distinguish different species and their physiological conditions. Recent advances in cytometer design and functionality have modernized certain aspects of marine biology applications creating a more accurate, data-rich, and timely assessment of microscopic marine organisms. We will examine the distribution and abundance of the phytoplankton, bacterial, and viral fractions of seawater determined using the two elements of the ACEA Biosciences Novocyte™ benchtop flow cytometer; volumetric sample delivery via precise syringe injection and extended fluorescence profiling with three excitation lasers. Sample Collection Samples were analyzed from a range of environments, including near shore marine samples (Scripps Institution of Oceanog- raphy Pier, La Jolla, CA), and University of California San Diego micro-algae raceway ponds. Field samples were collected in sterile tubes and fixed with 0.02 μm filtered glutaraldehyde (0.5% final concentration, incubated at 4°C for 20 minutes), flash frozen in liquid nitrogen, and stored at -80°C. Samples were thawed in small batches in a 20°C water bath. Unstained samples were analyzed immediately for photosynthetic plankton groups. Heterotrophic bacterial and viral populations are stained using the nucleic acid stain SYBR® Green I (1:10,000 final concentration, incubate at room temp for 15 minutes). Sample Analysis Photosynthetic pico(<2um) and nano(2-20um) plankton groups (eukaryotic and prokaryotic) were assessed using natural pigment fluorescence and scatter. Signal detection is triggered on chlorophyll fluorescence, using 0.2um filtered seawater to set threshold. Heterotrophic bacterial and viral populations were distinguished using the nucleic acid stain SYBR Green I. Signal detection is triggered on nucleic acid fluorescence, again using 0.2um filtered seawater to set threshold Eukaryotes (Euk01-05 and PE+Euk) High chlorophyll , large cells, some classes phycoerytherin positive Cryptophytes (Crypto) High chlorophyll , large cells, allophycocyanin positive Pico Eukaryotes (PicoEuk) Low chlorophyll, smaller cells, no phycoerytherin Synechococcus PE+ (Syn-PE+) Low chlorophyll, small cells, phycoerytherin positive Synechococcus APC+ (Syn-PC+) Low chlorophyll, small cells, allophycocyanin positive Prochlorococcus (Pro) Low chlorophyll, small cells, divinyl chlorophyll-a positive Figure 1. Flow cytometric analysis of plankton from the Scripps Institute of Oceanogra- phy pier. A-G) Density plots with gating strategies. Six photosynthetic groups were identified, three eukaryotic (C) and 3 cyanobacteria (E,F,G). Synechococcus PE+ dominate group (B,G). D) Bacteria were distinguished from viral populations using SYBR green. H) Dot plot of forward and side scatter, identifying phytoplank- ton groups by color. Virus 74.90% Bacteria 25.10% Syn-PE+ 97.96% R4 77.04% Syn-PC+ 19.54% Euk02 4.59% PE+Euk 5.82% Euk01 25.84% P1 23.38% R2 12.12% P3 63.66% A B C D F E G H Pigment Channel Excitaon Emission Chlorophyll BL4 488 675/30 Phycoerythrin BL2 488 585/40 Phycocyanin RL1 640 675/30 Divinyl Chlorophyll a VL5 405 675/30 SYBR Green BL1 488 530/30 Light Scaer FSC/SSC 488 488/10
Transcript

SIO-Pier / R2 / R4

Pro42.75%

Application Note No. 8

App

Not

e N

o. 8

© 2015 ACEA Biosciences, Inc. All rights reserved. For life science research only. Not for use in diagnostic procedures. 6779 Mesa Ridge Road Ste 100 San Diego, CA 92121 | 866.308.2232 | www.aceabio.com

Advanced analysis of aquatic plankton using �ow cytometryMatthew Haynes, Brian Seegers, and Alan SalukFlow Cytometry Core Facility, The Scripps Research Institute, La Jolla, CA

Flow cytometry has routinely been used to study phytoplankton by taking advantage of innate �uorescence molecules that distinguish di�erent species and their physiological conditions. Recent advances in cytometer design and functionality have modernized certain aspects of marine biology applications creating a more accurate, data-rich, and timely assessment of microscopic marine organisms. We will examine the distribution and abundance of the phytoplankton, bacterial, and viral fractions of seawater determined using the two elements of the ACEA Biosciences Novocyte™ benchtop �ow cytometer; volumetric sample delivery via precise syringe injection and extended �uorescence pro�ling with three excitation lasers.

Sample CollectionSamples were analyzed from a range of environments, including near shore marine samples (Scripps Institution of Oceanog-raphy Pier, La Jolla, CA), and University of California San Diego micro-algae raceway ponds. Field samples were collected in sterile tubes and �xed with 0.02 μm �ltered glutaraldehyde (0.5% �nal concentration, incubated at 4°C for 20 minutes), �ash frozen in liquid nitrogen, and stored at -80°C. Samples were thawed in small batches in a 20°C water bath. Unstained samples were analyzed immediately for photosynthetic plankton groups. Heterotrophic bacterial and viral populations are stained using the nucleic acid stain SYBR® Green I (1:10,000 �nal concentration, incubate at room temp for 15 minutes).

Sample AnalysisPhotosynthetic pico(<2um) and nano(2-20um) plankton groups (eukaryotic and prokaryotic) were assessed using natural pigment �uorescence and scatter. Signal detection is triggered on chlorophyll �uorescence, using 0.2um �ltered seawater to set threshold. Heterotrophic bacterial and viral populations were distinguished using the nucleic acid stain SYBR Green I. Signal detection is triggered on nucleic acid �uorescence, again using 0.2um �ltered seawater to set threshold

Eukaryotes (Euk01-05 and PE+Euk)High chlorophyll , large cells, some classes phycoerytherin positiveCryptophytes (Crypto)High chlorophyll , large cells, allophycocyanin positivePico Eukaryotes (PicoEuk)Low chlorophyll, smaller cells, no phycoerytherinSynechococcus PE+ (Syn-PE+)Low chlorophyll, small cells, phycoerytherin positiveSynechococcus APC+ (Syn-PC+)Low chlorophyll, small cells, allophycocyanin positiveProchlorococcus (Pro)Low chlorophyll, small cells, divinyl chlorophyll-a positive

Figure 1. Flow cytometric analysis of plankton from the Scripps Institute of Oceanogra-phy pier. A-G) Density plots with gating strategies. Six photosynthetic groups were identi�ed, three eukaryotic (C) and 3 cyanobacteria (E,F,G). Synechococcus PE+ dominate group (B,G). D) Bacteria were distinguished from viral populations using SYBR green. H) Dot plot of forward and side scatter, identifying phytoplank-ton groups by color.

SIO-Pier / R6

Virus74.90%

Bacteria25.10%

SIO-Pier / P3

Syn-PE+97.96%

SIO-Pier / R2

R477.04%

Syn-PC+19.54%

SIO-Pier / P1

Euk024.59%

PE+Euk5.82%

Euk0125.84%

SIO-Pier

SIO-Pier SIO-Pier

P123.38%

R212.12%

P363.66%

A B C D

FE G H

Pigment Channel Excitation Emission

Chlorophyll BL4 488 675/30

Phycoerythrin BL2 488 585/40

Phycocyanin RL1 640 675/30

Divinyl Chlorophyll a VL5 405 675/30

SYBR Green BL1 488 530/30

Light Scatter FSC/SSC 488 488/10

Application Note No. 8

App

Not

e N

o. 8

© 2015 ACEA Biosciences, Inc. All rights reserved. For life science research only. Not for use in diagnostic procedures. 6779 Mesa Ridge Road Ste 100 San Diego, CA 92121 | 866.308.2232 | www.aceabio.com

Pond / P3

Debris20.97%

PicoEuk19.10%

Euk0411.50%

Euk053.90%

Pond / P2

Crypto33.90%

Euk0356.05%

Euk024.06%

Pond

Euk016.29%

P21.38%

P338.10%

Pond

PondPond / R6

Virus82.00%

Bacteria18.00%

A B C D

E F G

Figure 2. Flow cytometric analysis of plankton from the UCSD micro-algae raceway ponds. A-E) Density plots with gating strategies. Seven photosynthetic groups were identi�ed (B,C,D), all eukaryotes. Target species Scenedesmus dimorphus (Euk01) identi�ed using FSC and Chl-A (B). E) Bacteria were distinguished from viral populations using SYBR green. F) Dot plot of forward and side scatter, identifying phytoplankton groups by color.

Gate Cells ml-1- Euk 01 5.39E+05- Euk02 4.78E+03- Euk03 6.61E+04- Euk04 3.76E+05- Euk05 1.27E+05- Crypto 4.00E+04- PicoEuk 6.24E+05

Bacteria 3.26E+06Virus 1.48E+07

UCSD micro- algae raceway ponds

Gate Cells ml-1- Euk01 2.78E+04- Euk02 5.29E+03- PE+Euk 5.41E+03- Syn-PE+ 2.85E+05- Syn-PC+ 1.08E+04- Pro 1.82E+04

Bacteria 1.29E+06Virus 3.85E+06

SIO Pier, La Jolla, CA

Figure 3. Absolute counting using the NovoCyte �ow cytometer. Each of the groups identi�ed in these water samples either from SIO Pier or the raceway ponds at UCSD were analyzed at absolute counts were obtained by using the highly accurate syringe pump driven �uidics on the NovoCyte �ow cytometer. Dominant populations from each water sample are easily identi�ed.

SummaryThe use of the multi-laser format (405, 488, and 640 nm excitations) allows for reliable discrimination of phototrophic eukaryotes, Synechococcus spp., Prochlorococcus spp., and heterotrophic populations in aquatic samples. Precision syringe driven �uidics enables direct enumeration of populations allowing for reliable comparisons to assess population dynamics. The integrated NovoSampler™ permits timely processing of samples in a variety of formats that can be con�gured by the user. Fixed voltages facilitates setup time and experimental repeatability, while requiring less user training. The systems innovative engineering allows for compact design with a small bench top footprint and low power demand making it ideal for shipboard analysis of marine samples eliminating the need for research samples to be stored and analyzed at a later date.

Reference:Brussaard, C. P. D. (2004). Optimization of Procedures for Counting Viruses by Flow Cytometry. Applied and Environmental Microbiology, 70(3), 1506–1513. Marie, D., F. Partensky, D. Vaulot, and C. P. Brussaard. 1999. Enumeration of phytoplankton, bacteria, and viruses in marine samples, p. 11.11.1-11.11.15. In J. P. Robinson et al. (ed.), Current protocols in cytometry, suppl. 10. John Wiley & Sons, Inc., New York, N.Y.Marie, D., Brussaard, C. P. D., Thyrhaug, R., Bratbak, G., & Vaulot, D. (1999). Enumeration of Marine Viruses in Culture and Natural Samples by Flow Cytometry. Applied and Environmental Microbiology, 65(1), 45–52.Porter, J. 2004. Flow Cytometry and Environmental Microbiology. Current Protocols in Cytometry. 27:11.2:11.2.1–11.2.13.


Recommended