35

Guy Peri • 20 September, 2011
P&G
Harnessing the Power of Real-Time Information Helping P&G make better, faster decisions.

Age
nda
The Challenge
1
2
4
3 Going Digital
About P&G/GBS
Business Intelligence at P&G

P&G at a Glance
• Countries of Operations 80
• Countries Where Our Brands Are Sold 180
• Consumers Served by Our Brands 4.4 B
• FY 2011 Net Sales $82.6 B

P&G Corporate Video

• Among the world’s best-known household names
• Represent 90% of P&G sales, more than 90% of profits
• Includes 24 billion-dollar brands
50 Leadership Brands

Touching and Improving More
Consumers’ Lives in More Parts of the World…More
Completely
P&
G’s
Pu
rpose
-Inspir
ed
Gro
wth
Str
ate
gy

GBS is one of the 4 Pillars of P&G.
global business services
market development organizations
corporate functions
global business
units

P&G Corporate Video

Savings AND Quality Service
Scale AND Agility
Innovation AND Operational Excellence
Delivering the AND

Age
nda
The Challenge
1
2
4
3 Going Digital
About P&G/GBS
Business Intelligence at P&G

2003 2010 Index
Net Sales Billions $43.33 $82.6 190
Net Earning Billions $5.19 $11.8 227
Billion Dollar Brands 13 24 184
The Challenge… the Environment is Changing

Historic trend analysis and
forecasting
Standardized reporting
Data visualization
Analytics applied within
business processes
Simulations and scenario
development
Clustering and
segmentation
Regression analysis, discrete
choice modeling and
mathematical optimization
What Matters is Changing

Historic trend analysis
and forecasting
Standardized reporting
Data visualization
Simulations and
scenario development
Analytics applied within
business processes
Regression analysis,
discrete choice modeling
and mathematical
optimization
Clustering and
segmentation
Historic trend analysis and
forecasting
Standardized reporting
Data visualization
Analytics applied within
business processes
Simulations and scenario
development
Clustering and
segmentation
Regression analysis, discrete
choice modeling and
mathematical optimization
What Matters is Changing

Digitize
Visualize
Simulate
The
Beginning
of the
Journey

Digitize - Video Collaboration
Easy Collaboration – $4 return for each $1 spent

De
cis
ion
Co
ck
pit
s
Visualize - Decision Cockpits example
Raw
Da
ta
Faster – Better
business decisions

Speed to Market – Millions saved Sim
ula
te -
Virtu
aliz
atio
n
Age
nda
The Challenge
1
2
4
3 Going Digital
About P&G/GBS
Business Intelligence at P&G

Going Digital Focus Areas
Digital
Value Chain Digital Organization
Digital Business
Intelligence
Digital Business
Capabilities

Standardize systems,
processes + information
Automate to eliminate non- value added
touches
Accelerate decision
making via real time
information
Going Digital - Our Approach
To create an environment that is
Real-Time.

Size of the Prize
15-65% Cut in Process
Cycle Time
20% Increase in Productivity
700% Increase
in Real-Time Data

Amplifies P&G’s Core Strengths
• Improve our Consumer Understanding by allowing us to forge
deeper, more meaningful one-on-one relationships.
• Strengthen our Brand Building strategies.
• Accelerate our Innovation abilities, transforming the way we do
business.
• Speed the time it takes for us to Go-to-Market, simplifying and
streamlining processes from molecule to shelf
• Digitizing and simplifying processes that allow us to Scale across
categories, brands and markets, faster, better and more efficiently.

Digital - Touch and Improve Lives
• Consumers by being with them every step of their lives offering the right product at the right price.
• Employees by providing the digital tools and education to help them work at their best
• Customers by providing improved inventory ability, best in class analytics and the products their shoppers want.
• Partners by working more seamlessly together.
• Shareholders

How to Win – Business Processes
Retail
Execution
Market Strategy
Planning
Business Planning
Initiative Management Portfolio & Master Planning Brand Building Go to Market
Human Capital Management
Operational
Execution
Talent
Management
Organization
Management
Culture
Management
Communication
Management
Holistic Brand
Communication
Brand
Management
Strategic Business
Planning
Annual Business
Planning
Steering the
Business
Strategic
Revenue
Management
Operational
Planning
SIMPL & E2E IM
Initiative Design
& Qualification
Initiative Launch
& Leverage
Portfolio
Management
Master Planning
GBU Master Data
Management MDO Master Data
Management
• 26 –Business
Processes
• 15 –Business
Processes
• 6–Business
Processes
• 31–Business
Processes
• 15–Business
Processes
Workspace Design
& Management
Collaboration

Age
nda
The Challenge
1
2
4
3 Going Digital
About P&G/GBS
Business Intelligence at P&G

Harness the power of real time business intelligence to win with more consumers, in more parts of the world, more completely.
Digital Business Intelligence uses real-time data to help P&G make
better, faster decisions, using a forward-looking approach to manage
by exceptions, and anticipate needs in the future.

Business Intelligence Strategies
2 Prolific BI Delivery
3 Real-time
Information
1 Sufficiency/ Operations

Business Sufficiency 1 • Creates a strategic analytic model to bring together previously silo’d data
• Allow analysts/business leaders to make unexpected / business relevant
connections, forward looking projections, and manage by critical business exceptions
• Highly visual/immersive environment (Business Sphere) and scalable cockpits.
Leadership Focus is on How to drive our business.
• Top 50 Sufficiency
• GBU Sufficiency
• Channel Sufficiency
• Supply Chain Sufficiency
• MDO Sufficiency
• Customer Sufficiency
• Organization Sufficiency

Raw Materials/Mfg Transport Distribution Retailers Shoppers
1st FMOT
Consumer Use
2nd FMOT
Prolific BI Delivery 2
Personal Computer
BI User
Business Sphere
Decision Cockpit
Mobile Tools
Continuous BI
One Truth,
Real Time
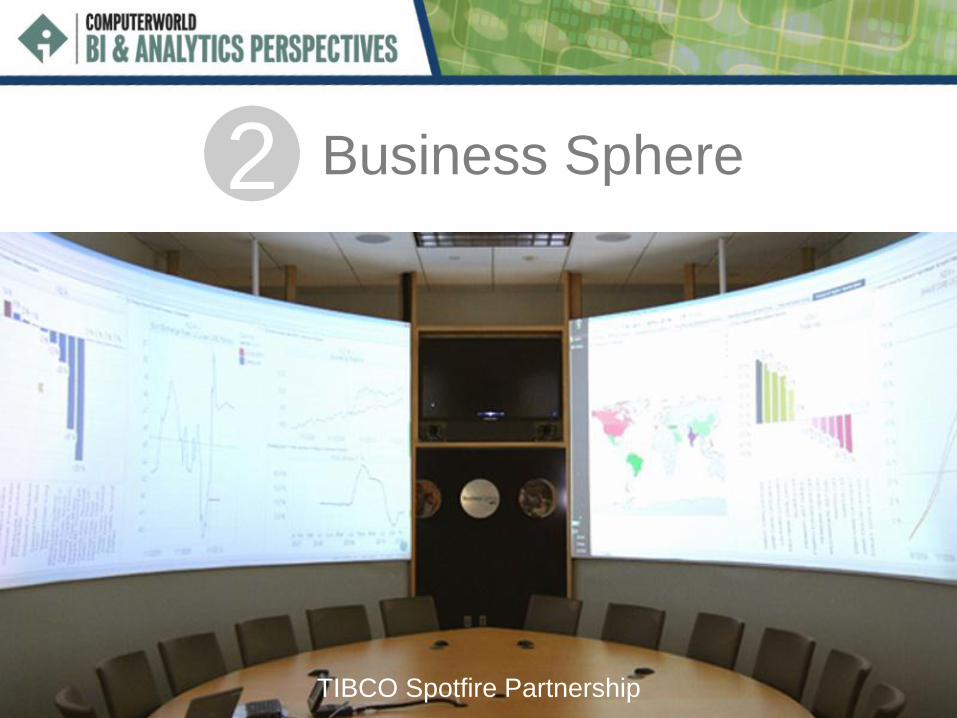
TIBCO Spotfire Partnership
Business Sphere 2

Over next 3-5 years: moving from
5% of IT community to 20%.
Focus on providing business
insight through unexpected
connections.
Business Analysts
BI
Operational
Activities
Initiative
Mgmt
Analytics /
Insights
BI
Operational
Activities scaled
with Partners
Initiative
Mgmt
Analytics /
Insights
Last 5 Years Next 5 Years
4x increase in analytic capability
Focus on Providing Insights to Drive Real Time Business 3
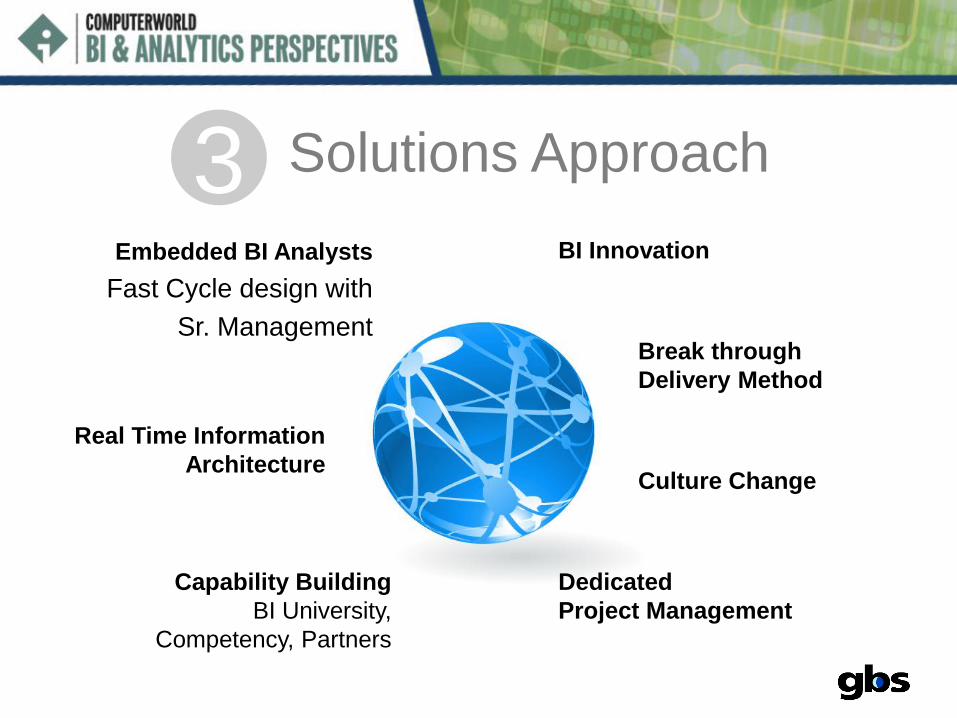
BI Innovation
Solutions Approach 3 Embedded BI Analysts
Fast Cycle design with
Sr. Management
Dedicated
Project Management
Capability Building
BI University,
Competency, Partners
Break through
Delivery Method
Real Time Information
Architecture Culture Change
What to Remember The importance of…
• We have a unique opportunity to digitize and simplify our
organization.
• We need to move beyond traditional IT (data and systems) to
analysis and insights.
• As IT professionals we have an opportunity to make it happen.

Transforming the way business is done.


![UNITED STATES DISTRICT COURT SOUTHERN …The Procter & Gamble Distributing LLC, and The Procter & Gamble Manufacturing Company’s (collectively, “Defendants” or “Procter & Gamble[’s]”)](https://static.documents.pub/doc/80x56/5fa3555a4efecd68cb5aef2b/united-states-district-court-southern-the-procter-gamble-distributing-llc.jpg)


