Figure S1. (a) Differential scanning calorimetry (DSC) analysis of FeCl3∙6H2O-L-cysteine at the molar
ratio of 2:1; (b) The glass-transition temperatures (Tg) of FeCl3∙6H2O with L-cysteine as function of
composition.
Figure S2. FTIR spectroscopy of trimetallic-based DES (orange) and L-cysteine (black).
Figure S3. SEM images of FeCoNi-NS at low (a) and high (b) magnification.
Figure S4. (a) HRTEM image and the corresponding lattice fringes of FeCoNi-NS; (b) EDS analysis of the
element distribution of FeCoNi-NS.
Figure S5. SEM images of Fe-NS (a), Ni-NS (b), Co-NS (c), FeCo-NS (d) , NiCo-NS (e), and FeNi-NS (f).
Figure S6. XRD pattern of the prepared FeCoNi-NS, and XRD data were fitted by Rietveld analysis.
Figure S7. The full XPS survey spectra of FeCoNi-NS.
Figure S8. Nitrogen adsorption and desorption isotherms and the inserted corresponding pore size
distribution of FeCoNi-NS.
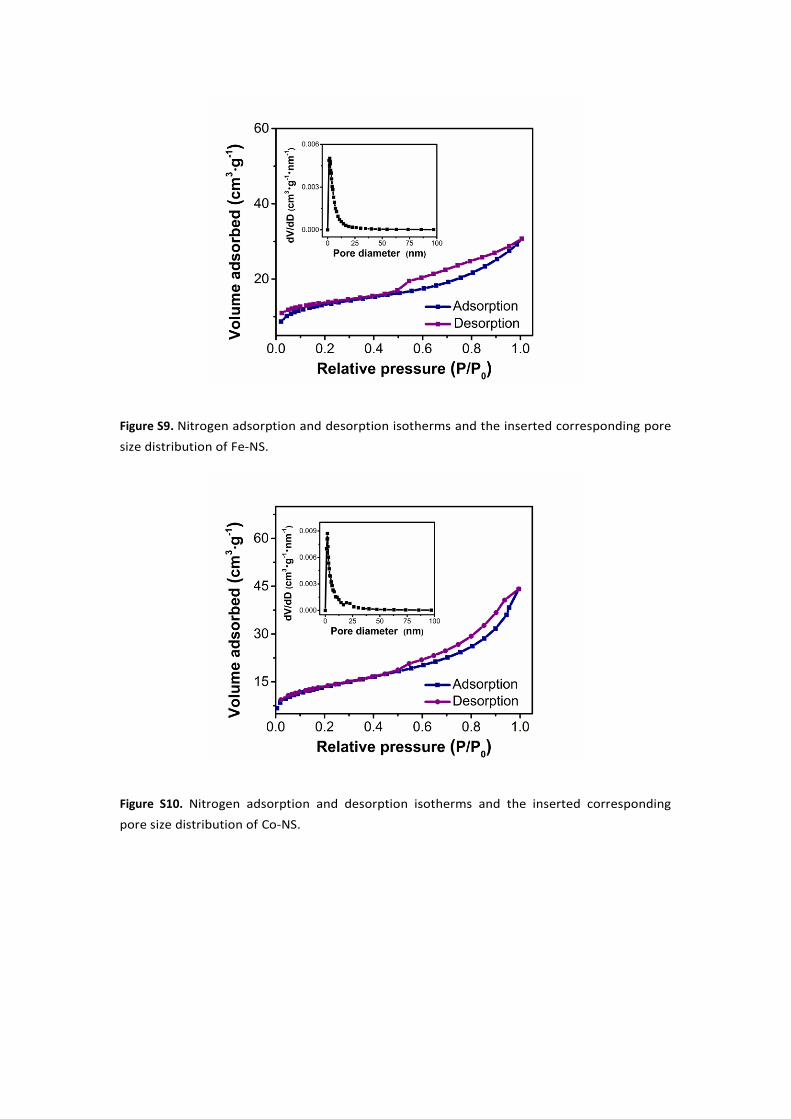
Figure S9. Nitrogen adsorption and desorption isotherms and the inserted corresponding pore size
distribution of Fe-NS.
Figure S10. Nitrogen adsorption and desorption isotherms and the inserted corresponding pore size
distribution of Co-NS.
Figure S11. Nitrogen adsorption and desorption isotherms and the inserted corresponding pore size
distribution of Ni-NS.
Figure S12. Nitrogen adsorption and desorption isotherms and the inserted corresponding pore size
distribution of FeCo-NS.
Figure S13. Nitrogen adsorption and desorption isotherms and the inserted corresponding pore size
distribution of NiCo-NS.
Figure S14. Nitrogen adsorption and desorption isotherms and the inserted corresponding pore size
distribution of FeNi-NS.
Figure S15. Cyclic voltammograms of FeCoNi-NS (a), Fe-NS (b), Co-NS (c), and Ni-NS (d) modified GC
electrode ranging from 0.1-0.2V (vs. Ag/AgCl) at a class of scan rates of 1, 10, 30, 50, 70, and 100
mV∙dec-1; (e) Linear fitting of the oxidation current density of the catalysts at 0.15 V vs. Ag/AgCl versus
scan rates; (f) Electrochemical double-layer capacitance (Cdl) values of Fe-NS (I), Co-NS (II), and
Ni-NS (III), and FeCoNi-NS (IV) derived from e.
Figure S16. OER performance of the RuO2 measured in 1 M KOH. (a) LSV curves (b) Tafel slopes of
RuO2 modified GC electrode.
Figure S17. OER performance of the synthesized bi-metal NSs measured in 1 M KOH. LSV curves (a)
and Tafel polts (b) of FeCo-NS (black), NiCo-NS (red), and FeNi-NS (blue) modified GC electrode using
Ag/AgCl (3 M KCl) and Pt wire as the reference and counter electrode, respectively.
Figure S18. SEM (a) and TEM (b) images of FeCoNi-NS after CA test.
Table S1. Related HBDs and HBAs, different ratio of HBDs and HBAs of the as-prepared samples.
Table S2. The main diffraction peaks and the corresponding plane of FeCoNi-NS.
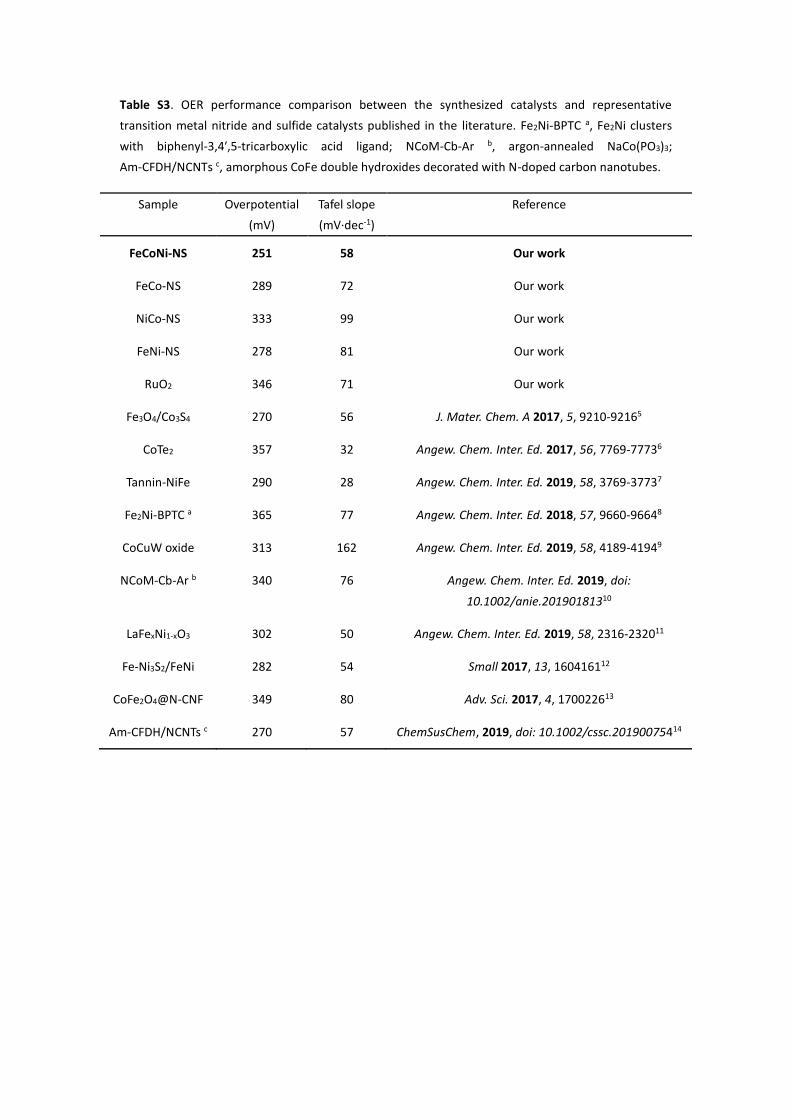
Table S3. OER performance comparison between the synthesized catalysts and representative
transition metal nitride and sulfide catalysts published in the literature.
3. References
1. Experimental Procedures
1.1 Chemicals and Materials
Ferric trichloride hexahydrate (FeCl3·6H2O, ≥ 99%), cobalt trichloride hexahydrate (CoCl2·6H2O, ≥ 99%), nickel trichloride hexahydrate (NiCl2·6H2O, ≥ 99%), potassium bromide (KBr, ≥ 99%), potassium hydroxide (KOH, ≥85%) were purchased from Sinopharm Chemical Reagent Co., Ltd. L-cyeteine (99%) was provided by Macklin Biochemical Technology Co., Ltd. All chemicals were used directly without further purification.
1.2 Synthesis Procedures
Formation of task-specific DESs: Trimetallic-based DES was synthesized by mixing of 3 hydrated metal salts consisting FeCl3∙6H2O, CoCl2∙6H2O, and NiCl2∙6H2O with L-cysteine at molar ratio of 2:1 simultaneously; 3 bimetallic-based DESs were synthesized by mixing any 2 hydrated metal salts from FeCl3∙6H2O, CoCl2∙6H2O, and NiCl2∙6H2O with L-cysteine at molar ratio of 2:1, respectively. 3 monometallic-based DESs were synthesized by simply mixing hydrated metal salts including FeCl3∙6H2O, CoCl2∙6H2O, and NiCl2∙6H2O and L-cysteine at molar ratio of 2:1, respectively.
Synthesis of FeCoNi-based NSs: In a typical synthesis process, NSs were synthesized through one-step DES annealing process at 350 oC for twelve hours under N2 atmosphere without any posttreatment. FeCoNi-NS was synthesized through the annealing of trimetallic-based DES. FeCo-NS, FeNi-NS, and NiCo-NS were obtained by the annealing of the related bimetallic-based DESs (FeCl3∙6H2O-CoCl2∙6H2O-L-cystenie, FeCl3∙6H2O-NiCl2∙6H2O-L-cystenie, and NiCl2∙6H2O-CoCl2∙6H2O-L-cystenie, respectively). Fe-NS, Co-NS, and Ni-NS were formed through the annealing of the corresponding monometallic-based DESs including FeCl3∙6H2O-L-cystenie, CoCl2∙6H2O-L-cystenie, and NiCl2∙6H2O-L-cystenie, respectively (Table S1).
1.3 Characterization
Differential scanning calorimetry (DSC) was performed using a Q2000 DSC (TA Instruments-Waters LLC, USA) system at a heating rate of 10 oC·min-1. The task-specific DESs were run in an aluminium pan in a sealed furnace from -80 °C (keep for 5 min) before heating up to 20 °C. The IR spectra were performed on the FTIR spectrometer (Prestige 21, Shimadzu, Japan, DTGS detector) in the range of 1000 to 4000 cm-1. The concentration of Fe/Co/Ni in FeCoNi-NS was measured using a JY Ultima2 inductively coupled plasma-optical emission spectrometer (ICP-OES). Before measurement, the FeCoNi-NS was diluted with 0.1 M HNO3. Each reported datum was the average value of three independent measurements.
The surface morphology and elemental composition of samples were analyzed by a field emission scanning electron microscopy (FESEM) (Hitachi SU8010, Hitachi High-technologies Corporation, Japan) equipped with an Oxford-Horiba Inca XMax50 energy dispersive X-ray spectroscopy (EDS) at an accelerating voltage of 5 keV and 15 keV, respectively. For SEM experiments, the samples were prepared by dispersing the products in ethanol and dropping the suspension on a silicon wafer. The detailed structural features were identified under transmission electron microscopy (TEM, Tecnal G2 F20, FEI) equipped with EDS mapping. And in the high-resolution TEM (HRTEM) images, obvious crystal stripes were obtained. For TEM and HRTEM experiments, the samples were prepared by dispersing the products in ethanol and dropping the suspension on a Cu microgrid.
X-ray powder diffraction (XRD) experiments of the FeCoNi-NS were performed with Y-2000 X-ray diffractometer (λ = 1.5406 Å) using Cu K radiation at a scanning rate of 0.5 o·s-1. And the measuring data were fitted by the program TOPAS 3.0 using Rietveld analysis. The X-ray photoelectron spectroscopy (XPS) experiments were carried out on an XPS, ESCA Lab250
X-ray photoelectron spectrometer (Thermo Fisher Scientific, USA) with Al Kα source. All XPS data were aligned using C 1s line at 284.6 eV fitted according to the Gaussian fitting method.
N2 adsorption-desorption isotherms were obtained at 77 K on Belsorp-Mini II (BEL Japan Inc., Japan) after the sample was degassed in vacuum at 573 K for 4 h.
1.4 Modification of electrode
The FeCoNi-NS modified glassy carbon (GC) electrodes were prepared by dispersing 1mg FeCoNi-NS in 0.5 mL water and 0.5 mL ethanol with 10 μL Nafion solutions (5%) to form homogeneous inks. Then, as prepared inks (5 μL) was drop coating on GC electrode (3 mm) with a 0.07069 cm2 area. This yielded a FeCoNi-NS powder loading weight of about 0.07 mg·cm-2. The bare GC electrode was polished with 10 µm Al2O3 powder, subsequently rinsed by water and sonicated in distilled water and ethyl alcohol. The Fe-NS, Co-NS, Ni-NS, FeCo-NS, NiCo-NS, and FeNi-NS modified GC electrodes were obtained in the same procedure.
1.5 Electrochemical measurements
The electrocatalytic activity of samples for OER was studied in 1 M KOH solution (pH = 13.7) and recorded on a CHI 660E electrochemical station at ambient temperature. All tests were performed in a three-electrode electrochemical cell with an Ag/AgCl electrode (3 M KCl) and a Pt wire as the reference electrode and counter electrode, respectively. For comparison, Fe-NS, Co-NS, Ni-NS, FeCo-NS, NiCo-NS, and FeNi-NS modified GC electrodes were used as the working electrodes to investigate their electrocatalytic activities toward OER. To enhance mass transport and remove generated gas bubbles on surface of the electrode, the electrolyte was stirred at a constant rate of 300 rpm. The potential was calibrated against the reversible hydrogen electrode (RHE) using E(RHE) = E(Ag/AgCl) + 0.198 V + 0.059 * 13.7. The related polarization curves shown in the article were calibrated after iR correction.
The linear sweep voltammogram (LSV) curves of FeCoNi-based NSs were performed with a scan rate of 5 mV·s-1 for OER in 1 M KOH. The overpotential is defined as the potential at the current density of 10 mA·cm-2 for OER. Electrochemical impedance spectroscopy (EIS) was performed in potentiostatic mode from 0.1 kHz to 1000 kHz. Cyclic voltammograms (CV) curves were conducted from 0.1 to 0.2 V (vs. Ag/AgCl, 3M KCl) at different scan rates. The FE was obtained during the chronoamperometry (CA) test. The experimental evolved O2 gas amount was measured by gas chromatography analysis (Ar carrier, molecule sieve 5A column, TCD detector). Supposing that four electrons are needed to produce one O2 molecular, the FE could be obtained as follows: η = 4F*n/(i*t), where F is the Faraday constant (96485 s∙A∙mol-1), n is the total amount of O2, i is the current passed during the process, and t is the time.
2. Results and Discussion
Herein, we first develop a facile methodology based on the task-specific deep eutectic solvent annealing method for the synthesis of a series of FeCoNi-based NSs. The task-specific DESs were prepared by simply mixing of hydrated metal salts (FeCl3∙6H2O, CoCl2∙6H2O, and NiCl2∙6H2O) and L-cysteine. As FeCl3∙6H2O-L-cysteine system for example, the glass-transition temperatures (Tg) of them at different molar ratio were studied by DSC experiment and the results were shown in Fig. S1. It is apparent that a eutectic was formed at a composition of 67% FeCl3∙6H2O which was in accordance with the eutectic reported for hydrated metal salt-urea system. While, the Tg of CoCl2∙6H2O-L-cysteine and NiCl2∙6H2O-L-cysteine was -51.1 oC, and -49.4 oC, respectively. So, the Tg of prepared DESs was lower than that of either of the constituents, which confirmed the formation of DESs1.
Figure S1. (a) Differential scanning calorimetry (DSC) analysis of FeCl3∙6H2O-L-cysteine at the molar
ratio of 2:1; (b) The glass-transition temperatures (Tg) of FeCl3∙6H2O with L-cysteine as function of
composition.
The interaction between hydrated metal salts and L-cysteine were examined by IR analysis. As depicted in Fig. S2, the stretching characteristic absorption peaks of C=O were showed red shifts in the formed DESs, which further verified the intermolecular interaction between hydrated metal salts and the selected L-cysteine2. And the stretching characteristic absorption peaks including –SH and –NH of L-cysteine were disappearing, which further proving the complex interaction between the metal ion and L-cysteine.
Figure S2. FTIR spectroscopy of trimetallic-based DES (orange) and L-cysteine (black).
Figure S3. SEM image of FeCoNi-NS at low (a) and high (b) magnification.
Figure S4. (a) HRTEM image and the corresponding lattice fringes of FeCoNi-NS; (b) EDS analysis of the
element distribution of FeCoNi-NS.
40 nm200 nm
a b
0.129 nm(203)
0.175 nm(1-2-2)
0.166 nm(032)
0.139 nm(202)
1 nm
N
S
Si
Fe Co Ni
a b
Figure S5. SEM images of Fe-NS (a), Ni-NS (b), Co-NS (c), FeCo-NS (d) , NiCo-NS (e), and FeNi-NS (f).
100 nm 100 nm
100 nm 100 nm
100 nm 100 nm
a b
c d
e f
Figure S6. XRD pattern of the prepared FeCoNi-NS, and XRD data were fitted by Rietveld
analysis.
Figure S7. The full XPS survey spectra of FeCoNi-NS.
It could be conjectured that the unique morphology might lead to a high surface area and hierarchical structures owing to the hybrid of 1D and 2D nanostructures. As reported, the specific surface and pore size distribution of the materials markedly influence their electrocatalytic performance3, 4. So it is essential to perform the BET experiments. N2 adsorption-desorption isotherms and pore size distributions of FeCoNi-NS were shown in Figure S8. The specific surface area of FeCoNi-NS was about 142 m2∙g-1, which was higher than other prepared NSs (Table 1). This suggested that the introduction of Fe and Ni significantly enhanced the specific area of the FeCoNi-NS. The hierarchical porous structure of FeCoNi-NS was confirmed by the distribution of pore size (inset in Figure S8). The introduction of secondary and ternary metal ion was beneficial for the designable synthesis of hierarchically electrocatalyst, which were further favourable for the release of oxygen. The N2 absorption-desorption isotherms of Fe-NS, Co-NS, Ni-NS, FeCo-NS, NiCo-NS, and FeNi-NS were depicted in Figure S9-S14. It was noticed that the BET area, the mean pore size and the distribution of the hierarchical porous sulfides were associated with the precursor of metal ion.
Figure S8. Nitrogen adsorption and desorption isotherms and the inserted corresponding pore
size distribution of FeCoNi-NS.
Figure S9. Nitrogen adsorption and desorption isotherms and the inserted corresponding pore
size distribution of Fe-NS.
Figure S10. Nitrogen adsorption and desorption isotherms and the inserted corresponding
pore size distribution of Co-NS.
Figure S11. Nitrogen adsorption and desorption isotherms and the inserted corresponding
pore size distribution of Ni-NS.
Figure S12. Nitrogen adsorption and desorption isotherms and the inserted corresponding
pore size distribution of FeCo-NS.
Figure S13. Nitrogen adsorption and desorption isotherms and the inserted corresponding
pore size distribution of NiCo-NS.
Figure S14. Nitrogen adsorption and desorption isotherms and the inserted corresponding
pore size distribution of FeNi-NS.
The electrochemically active surface area (EASA) was a parameter related to the practical active sites for catalysis. The value of electrochemical double-layer capacitance (Cdl) was positively related the value of EASA, namely Cdl = Cs*EASA (for GC in 1 M KOH, Cs = 0.04 mF∙cm-2). And the Cdl could be calculated from the CV curves in the potential of 0.1-0.2 V vs. Ag/AgCl (3 M KCl) electrode at different scans (ranging from 1 to 100 mV∙s-1) (Figure S15). As expected, the Cdl of FeCoNi-NS was remarkably high compared with other NSs (Table 1). That is to say, the FeCoNi-NS was predicated to provide more active sites to be exposed to the electrolyte, which was compatible with the BET results (Fig. 2d).
Figure S15. Cyclic voltammograms of FeCoNi-NS (a), Fe-NS (b), Co-NS (c), and Ni-NS (d)
modified GC electrode ranging from 0.1-0.2V (vs. Ag/AgCl) at a class of scan rates of 1, 10, 30,
50, 70, and 100 mV∙dec-1; (e) Linear fitting of the oxidation currents of the catalysts at 0.15 V
vs. Ag/AgCl (3 M KCl) versus scan rates; (f) Electrochemical double-layer capacitance (Cdl)
values of Fe-NS (I), Co-NS (II), and Ni-NS (III), and FeCoNi-NS (IV) derived from e.
Figure S16. OER performance of the RuO2 measured in 1 M KOH. (a) LSV curves (b) Tafel slopes
of RuO2 modified GC electrode.
Figure S17. OER performance of the synthesized bi-metal NSs measured in 1 M KOH. LSV
curves (a) and Tafel polts (b) of FeCo-NS (black), NiCo-NS (red), and FeNi-NS (blue) modified GC
electrode using Ag/AgCl (3 M KCl) and Pt wire as the reference and counter electrode,
respectively.
Figure S18. SEM (a) and TEM (b) images of FeCoNi-NS after CA test.
a b
a b
100 nm
100 nm
100 nm 50 nm
a b
Table S1. Related HBDs and HBAs, different ratio of HBDs and HBAs of the as-prepared samples.
Sample HBAs HBDs
FeCl3∙6H2O CoCl2∙6H2O NiCl2∙6H2O L-cystenie
Fe-NS 10 mmol 5 mmol
Co-NS 10 mmol 5 mmol
Ni-NS 10 mmol 5 mmol
FeCo-NS 10 mmol 10 mmol 10 mmol
NiCo-NS 10 mmol 10 mmol 10 mmol
FeNi-NS 10 mmol 10 mmol 10 mmol
FeCoNi-NS 10 mmol 10 mmol 10 mmol 15 mmol
Table S2. The main diffraction peaks and the corresponding plane of FeCoNi-NS.
2θ (hkl)
29.7 (100)
31.1 (020)
44.3 (004)
47.4 (030)
49.9 (122)
51.9 (1-2-2)
54.7 (13-1)
55.3 (032)
73.0 (203)
54.7 (13-1)
55.3 (032)
73.0 (203)
Table S3. OER performance comparison between the synthesized catalysts and representative
transition metal nitride and sulfide catalysts published in the literature. Fe2Ni-BPTC a, Fe2Ni clusters
with biphenyl-3,4′,5-tricarboxylic acid ligand; NCoM-Cb-Ar b, argon-annealed NaCo(PO3)3;
Am-CFDH/NCNTs c 270 57 ChemSusChem, 2019, doi: 10.1002/cssc.20190075414
3. References
1. J. Jiang, C. Yan, X. Zhao, H. Luo, Z. Xue, T. Mu, Green Chem. 2017, 19, 3023-3031. 2. F. Liu, Z. Xue, X. Zhao, H. Mou, J. He, T. Mu, Chem. Commun. 2018, 54, 6140-6143. 3. T. Zhao, S. Gadipelli, G. He, M. J. Ward, D. Do, P. Zhang and Z. Guo, ChemSusChem 2018, 11,
1295-1304 4. J. Guo, S. Gadipelli, Y. Yang, Z. Li, Y. Lu, D. J. L. Brett and Z. Guo, J. Mater. Chem. A 2019, 7,
3544-3551. 5. J. Du, T. Zhang, J. Xing, C. Xu, J. Mater. Chem. A 2017, 5, 9210-9216. 6 Q. Gao, C.-Q. Huang, Y.-M. Ju, M.-R. Gao, J.-W. Liu, D. An, C.-H. Cui, Y.-R. Zheng, W.-X. Li, S.-H. Yu,
Angew. Chem. Inter. Ed. 2017, 56, 7769-7773. 7. Y. Shi, Y. Yu, Y. Liang, Y. Du, B. Zhang, Angew. Chem. Inter. Ed. 2019, 58, 3769-3773. 8. X.-L. Wang, L.-Z. Dong, M. Qiao, Y.-J. Tang, J. Liu, Y. Li, S.-L. Li, J.-X. Su, Y.-Q. Lan, Angew. Chem.
Inter. Ed. 2018, 57, 9660-9664. 9. Z. Cai, L. Li, Y. Zhang, Z. Yang, J. Yang, Y. Guo, L. Guo, Angew. Chem. Inter. Ed. 2019, 58,
4189-4194. 10. R. Gond, D. K. Singh, M. Eswaramoorthy, P. Barpanda, Angew. Chem. Inter. Ed. 2019, doi:
10.1002/anie.201901813. 11. H. Wang, J. Wang, Y. Pi, Q. Shao, Y. Tan, X. Huang, Angew. Chem. Inter. Ed. 2019, 58, 2316-2320. 12. C.-Z. Yuan, Z.-T. Sun, Y.-F. Jiang, Z.-K. Yang, N. Jiang, Z.-W. Zhao, U. Y. Qazi, W.-H. Zhang, A.-W. Xu,
Small 2017, 13, 1604161. 13. T. Li, Y. Lv, J. Su, Y. Wang, Q. Yang, Y. Zhang, J. Zhou, L. Xu, D. Sun, Y. Tang, Adv. Sci. 2017, 4,
1700226. 14. Y. Liu, Y. Hu, P. Ma, F. Li, F. Yuan, S. Wang, Y. Luo, J. Ma, ChemSusChem, 2019, doi: