Advanced Fossil Power Systems Comparison Study Final Report Prepared for: National Energy Technology Laboratory P.O. Box 880, 3610 Collins Ferry Road Morgantown, WV 26507-0880 and P.O. Box 10940, 626 Cochrans Mill Road Pittsburgh, PA 15236-0940 Prepared by: Edward L. Parsons National Energy Technology Laboratory P. O. Box 880, 3610 Collins Ferry Road Morgantown, WV 26507-0880 Walter W. Shelton Jennifer L. Lyons EG&G Technical Services, Inc. 3604 Collins Ferry Road Suite 200 Morgantown, West Virginia 26505 December, 2002
Transcript
Advanced Fossil Power Systems Comparison Study
Final Report
Prepared for: National Energy Technology Laboratory P.O. Box 880, 3610 Collins Ferry Road Morgantown, WV 26507-0880 and P.O. Box 10940, 626 Cochrans Mill Road Pittsburgh, PA 15236-0940 Prepared by: Edward L. Parsons National Energy Technology Laboratory P. O. Box 880, 3610 Collins Ferry Road Morgantown, WV 26507-0880 Walter W. Shelton Jennifer L. Lyons EG&G Technical Services, Inc. 3604 Collins Ferry Road Suite 200 Morgantown, West Virginia 26505
December, 2002
i
DISCLAIMER
This report was prepared as an account of work sponsored by an agency of the United States Government. Neither the United States Government nor any agency thereof, nor any of their employees, makes any warranty, express or implied, or assumes any legal liability or respon-sibility for the accuracy, completeness, or usefulness of any information, apparatus, product, or process disclosed, or represents that its use would not infringe privately owned rights. Reference herein to any specific commercial product, process, or service by trade name, trademark, manufacturer, or otherwise does not necessarily constitute or imply its endorsement, recommendation, or favoring by the United States Government or any agency thereof. The views and opinions of authors expressed herein do not necessarily state or reflect those of the United States Government or any agency thereof.
ii
TABLE OF CONTENTS
Section Title Page SUMMARY 1 I REFERENCE PLANTS 4 I-1 PULVERIZED COAL (PC) BOILER 4 I-1.1 PC Power Plant - Base Case – Description 4 I-1.2 PC Power Plant - Amine CO2 Capture – Description 6 I-1.3 PC Power Plant – Cryogenic ASU – Description 7 I-1.4 PC Power Plant Results 8 I-2 NATURAL GAS COMBINED CYCLE (NGCC) 9 I-2.1 NGCC – No CO2 Capture 10 I-2.2 NGCC – CO2 Capture 12 I-3 INTEGRATED GASIFCATION COMBINED CYCLE (IGCC) 15 I-3.1 IGCC Destec (E-Gas™) Cases – No CO2 Capture 17 I-3.2 IGCC Destec (E-Gas™) Cases – CO2 Capture 20 I-3.3 IGCC Shell Cases 22 I-4 SUMMARY – REFERENCE PLANTS 26 II ADVANCED POWER CYCLES 27 II-1 Hydraulic Air Compression Cycle (HAC) 27 – Closed Loop Water System
II-1.1 Hydraulic Air Compression Cycle (HAC) – Natural Gas 29 II-1.2 Hydraulic Air Compression Cycle (HAC) – Coal 32
- without CO2 Capture
iii
TABLE OF CONTENTS (continued) Section Title Page II-1.3 Hydraulic Air Compression Cycle (HAC) – Coal 35
- with CO2 Capture II-1.4 Hydraulic Air Compression Cycle (HAC) – Summary 38 II-1.5 Hydraulic Air Compression Cycle (HAC) 40 - Open Loop Water System II-2 CLEAN ENERGY SYSTEMS (CES) 42
– ROCKET ENGINE STEAM CYCLE II-2.1 Clean Energy Systems (CES) - Natural Gas System 44 II-2.2 Clean Energy Systems (CES) - Coal Syngas System 46 II-2.3 Clean Energy Systems (CES) - Summary 48 II-3 HYDROGEN TURBINE CYCLES 48 II-3.1 Hydrogen Turbine Cycles – Natural Gas Case 49 II-3.2 Hydrogen Turbine Cycles – Coal Case 51 II-3.3 Hydrogen Turbine Cycles – Summary 53 II-4 HYBRID - TURBINE / FUEL CELL CYCLES 54 II-4.1 Hybrid - Turbine/Fuel Cell Cycles – Natural Gas Case 55 II-4.2 Hybrid - Turbine/Fuel Cell Cycles – Coal Cases 57 II-4.2.1 Hybrid - Turbine/Fuel Cell Cycles – Coal Cases 57
- Case 1 (No CO2 Capture) II-4.2.2 Hybrid - Turbine/Fuel Cell Cycles – Coal Cases 59 - Case 2 (CO2 Capture) II-4.2.3 Hybrid - Turbine/Fuel Cell Cycles – Coal Cases 62 - Case 3 (No CO2 Capture) II-4.3 Hybrid - Turbine/Fuel Cell Cycles – Summary 64
iv
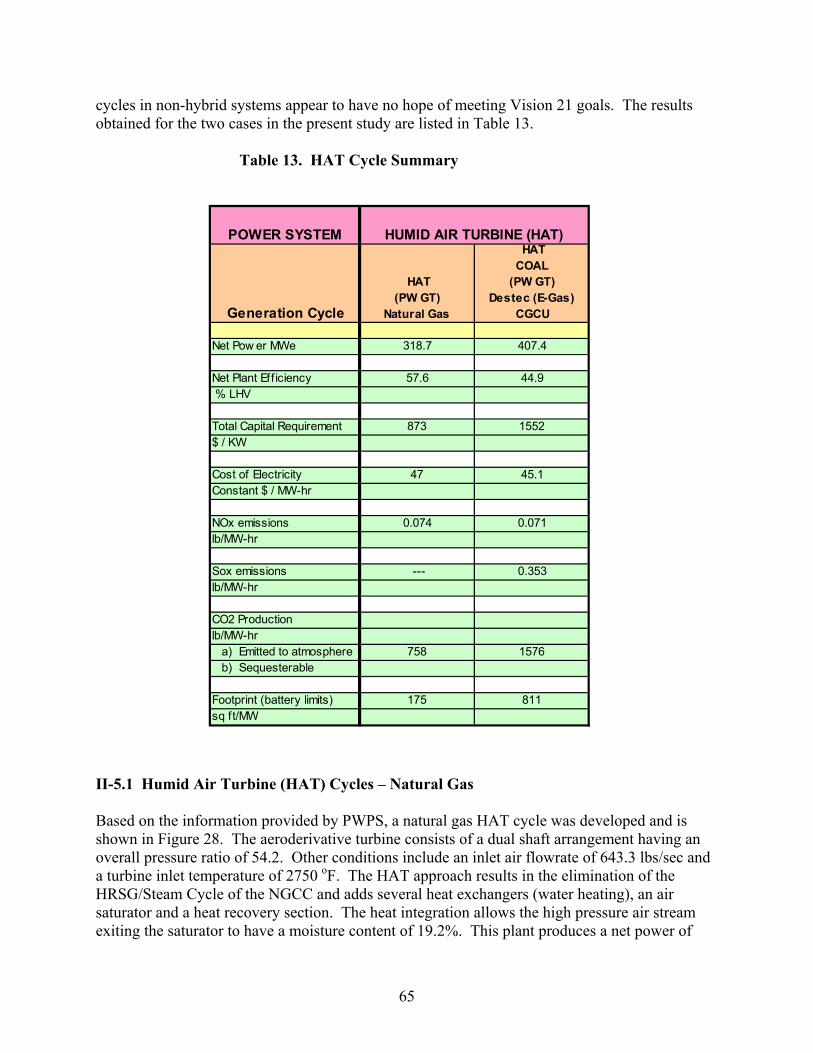
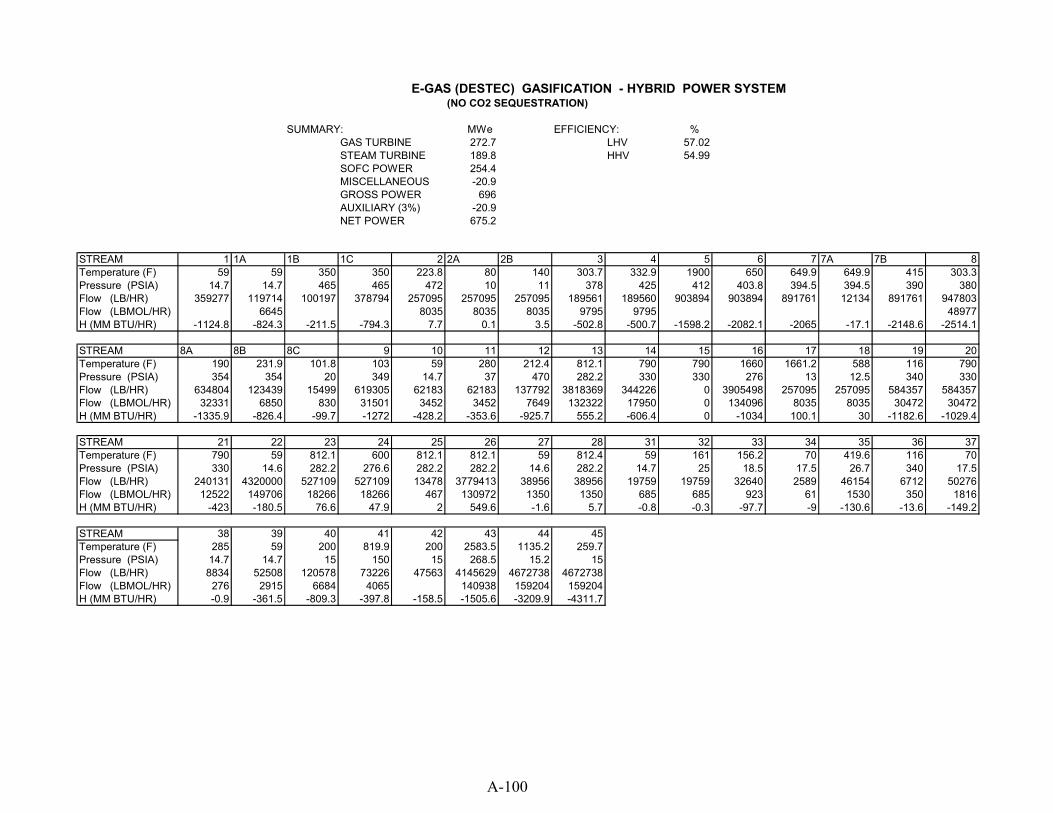
TABLE OF CONTENTS (continued) Section Title Page II-5 HUMID AIR TURBINE (HAT) CYCLES 64 II-5.1 Humid Air Turbine (HAT) Cycles – Natural Gas 65 II-5.2 Humid Air Turbine (HAT) Cycles – Coal Syngas 67 II-5.3 Humid Air Turbine (HAT) Cycles – Summary 69 REFERENCES 70 APPENDIX A – SIMULATION RESULTS - Process Flow diagrams - Material & Energy Balances APPENDIX B – COST OF ELECTRICITY RESULTS - COE Spreadsheets APPENDIX C – FUEL COMPOSITION APPENDIX D – VISION 21 GOALS
v
Tables Title Page Table 1. Natural Gas Cycles 2 Table 2. Coal Cycles 3 Table 3. Pulverized Coal (PC) 8 Table 4. Natural Gas Combined Results 10 Table 5. Reference IGCC Case Results 16 Table 6. Hydraulic Air Compression Cycles 28 Table 7. Summary of HAC Cases - with/without CO2 Sequestration 39 Table 8. Summary of HAC Cases - modified for open loop water system 41 Table 9. CES – Rocket Engine Systems 43 Table 10. Hydrogen Turbine Power Cycles 49 Table 11. Hybrid Turbine/Fuel Cell 54 Table 12. SUMMARY - SIMULATION FOR COAL SYNGAS 57 HYBRID POWER SYSTEMS Table 13. HAT Cycle Summary 65 Table 14. Comparison with P&W hybrid system and NETL IGHAT Cycle 69
vi
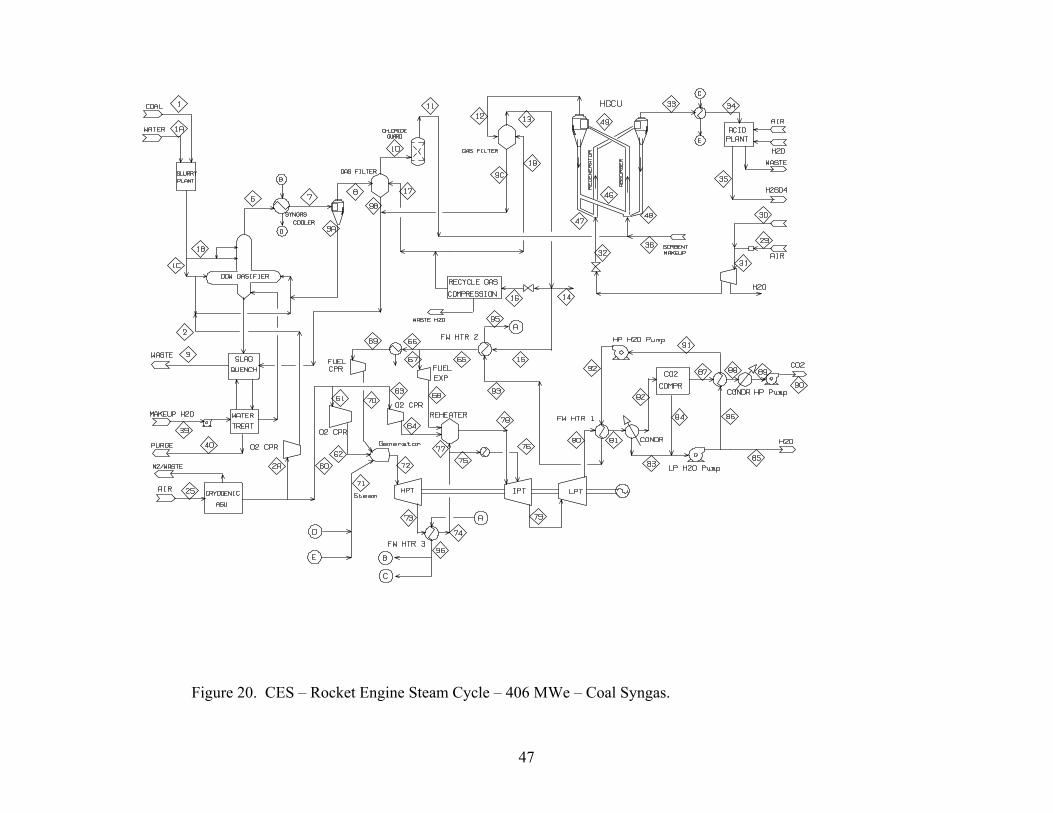
Figures Title Page Figure 1. Pulverized Coal Boiler Power Plant 5 Figure 2. PC-Fired Boiler with Amine Scrubbing for CO2 Sequestration 6 Figure 3. PC Fired Boiler with Flue Gas Recycle for CO2 Sequestration; O2 7 from Cryogenic ASU Figure 4. NGCC Power Plant 11 Figure 5. NGCC – with CO2 Capture 13 Figure 6. Amine Plant 14 Figure 7. Case 1. IGCC DESTEC / CGCU – No CO2 Capture 18 Figure 8. Case 2. IGCC DESTEC / HGCU – No CO2 Capture 19 Figure 9. Case 4. IGCC SHELL / CGCU – No CO2 Capture 23 Figure 10. Case 5. SHELL / CO2 Capture / Advanced Power Module 25 Figure 11. Hydraulic Air Compression Power Block – closed loop water cycle 27 Figure 12. Case1 - Natural Gas HAC – without CO2 Capture 30 Figure 13. Case 2 - Natural Gas HAC – with CO2 Capture 31 Figure 14. Case 3 - Coal Syngas HAC – without CO2 Capture 33 Figure 15. Case 3 - Steam Cycle 34 Figure 16. Case 4 - Coal Syngas HAC – with CO2 Capture 36 Figure 17. Case 4 - Steam Cycle 37 Figure 18. CES Process (provided by CES – version NNN21) 42 Figure 19. CES – Rocket Engine Steam Cycle – 400 MWe – Natural Gas 45 Figure 20. CES – Rocket Engine Steam Cycle – 406 MWe – Coal Syngas 47
vii
Figures (continued)
Title Page
Figure 21. Hydrogen Turbine Cycle – Natural Gas 50 Figure 22. Hydrogen Turbine Cycle – Coal 52 Figure 23. High Efficiency Fossil Power Plant Cycle (HEFPP) 55 Figure 24. Case 1 . Hybrid GT/SOFC – Coal Syngas – No CO2 capture 58 Figure 25. Case 2 . Hybrid GT/SOFC – Coal Syngas – CO2 capture 60 Figure 26. Case 2 . Hybrid GT/SOFC – Coal Syngas – CO2 capture 61
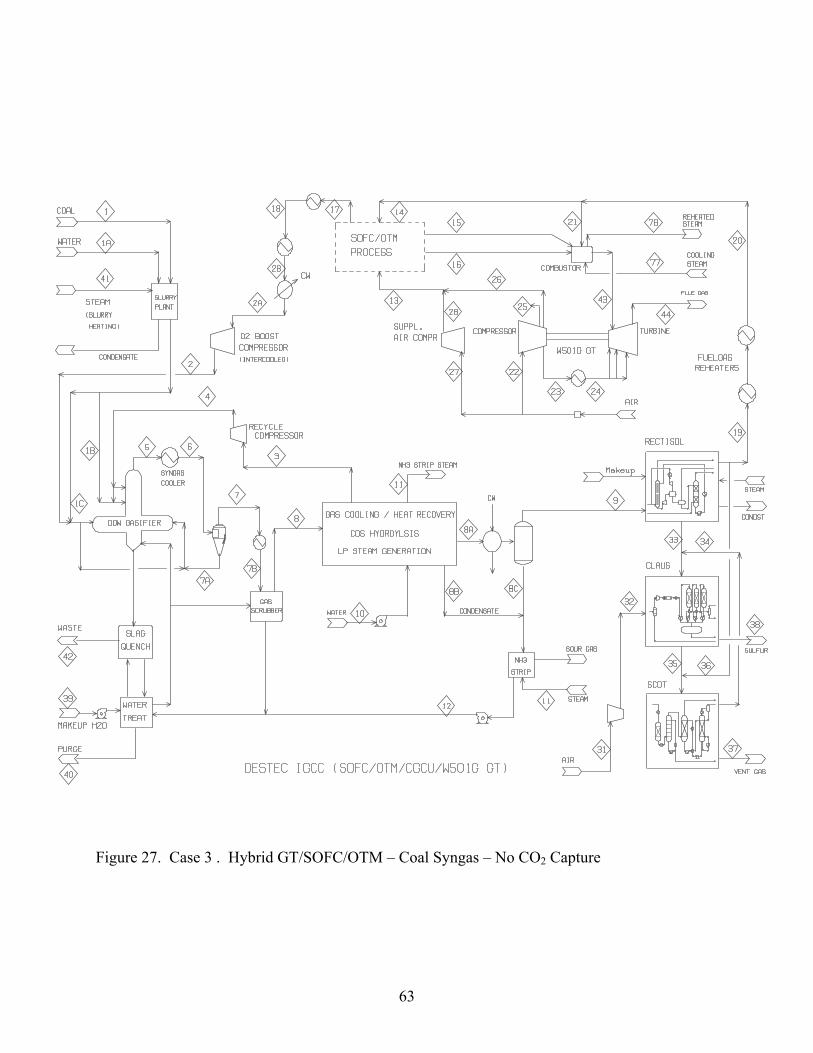
Figure 27. Case 3 . Hybrid GT/SOFC/OTM – Coal Syngas – No CO2 capture 63 Figure 28. HAT Cycle – Natural Gas - PW Aeroderivative Turbine 66 Figure 29. IGHAT – Destec/ CGCU 68
1
Advanced Fossil Power Systems Comparison Study
SUMMARY Aspen Plus® (version 10.2) simulation models and the Cost of Electricity (COE) have been developed for advanced fossil power generation systems both with and without carbon dioxide (CO2) capture. The intent was to compare the cycles based on using common assumptions and analytic standards with respect to realizable performance, cost, emissions and footprint. Additionally, commercially available (or near term) reference plants were included for comparison. The advanced fossil power systems considered were: (both natural gas and coal fueled)
• Hydraulic Air Compression Cycle (HAC) • Rocket Engine Gas Generator Cycle • Hydrogen Turbine (air) Cycle • Hybrid Cycle (Turbine / Solid-Oxide Fuel Cell) • Humid Air Turbine Cycle (HAT) [(CO2) capture – not considered]
Reference Plants developed based on previous NETL/EG&G studies included:
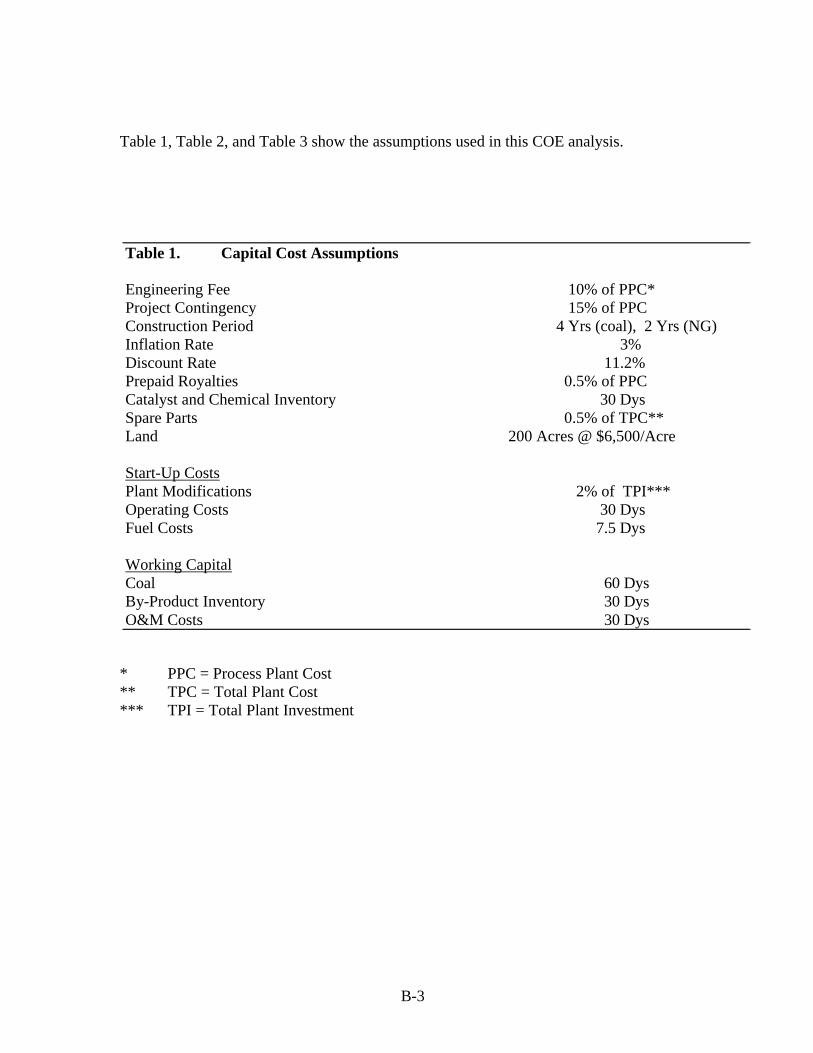
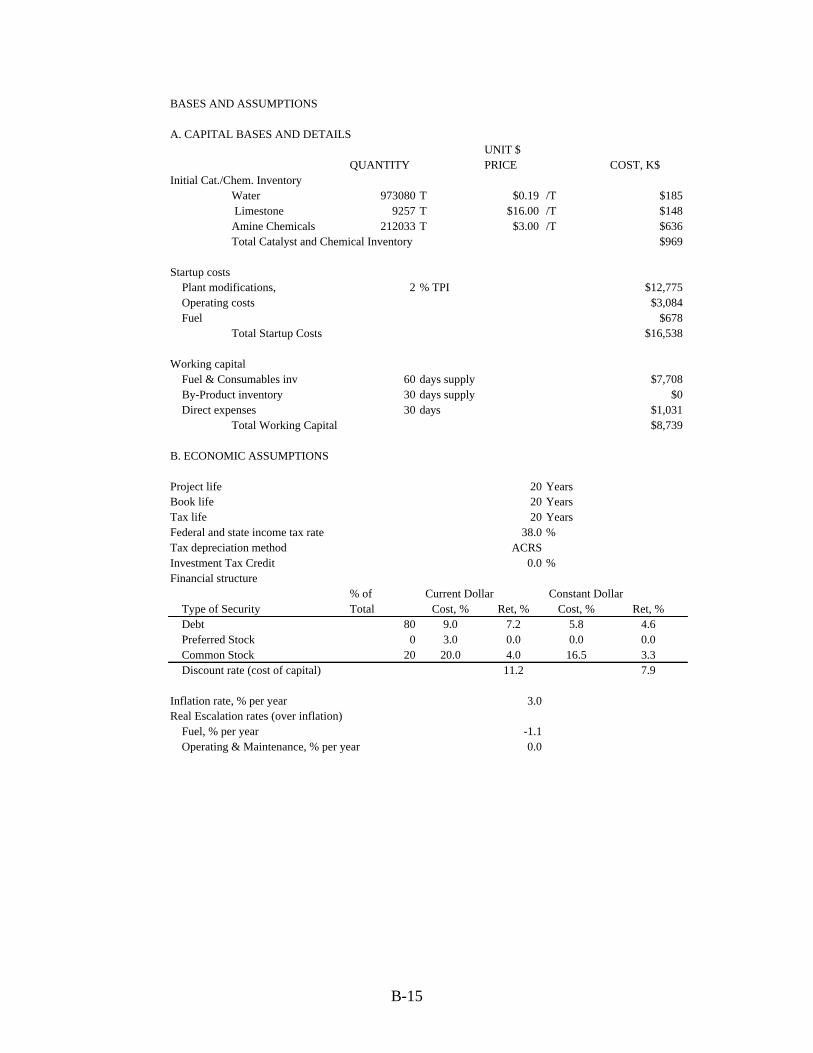
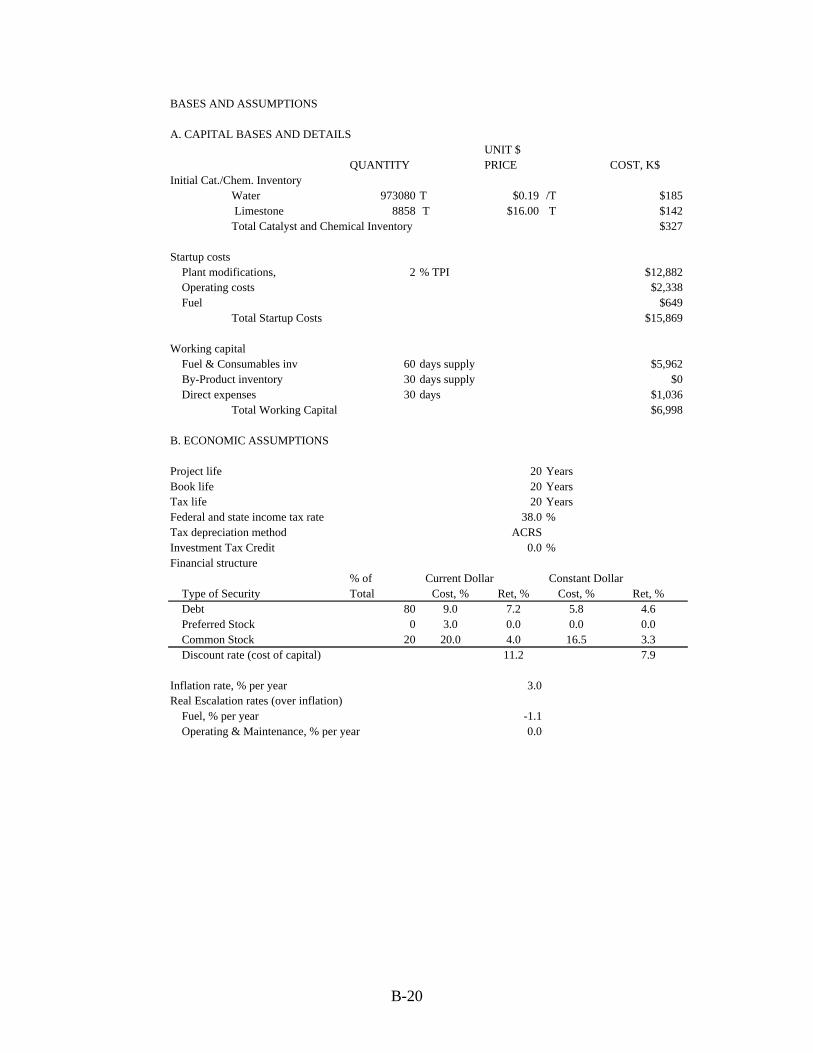
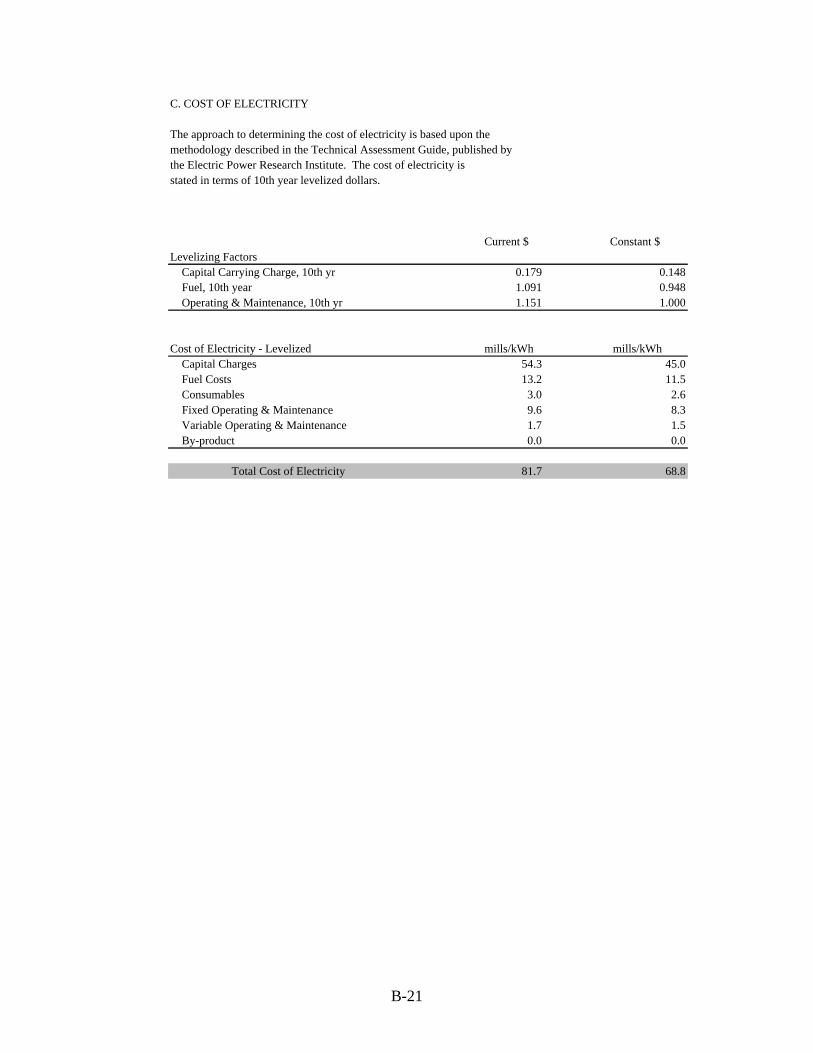
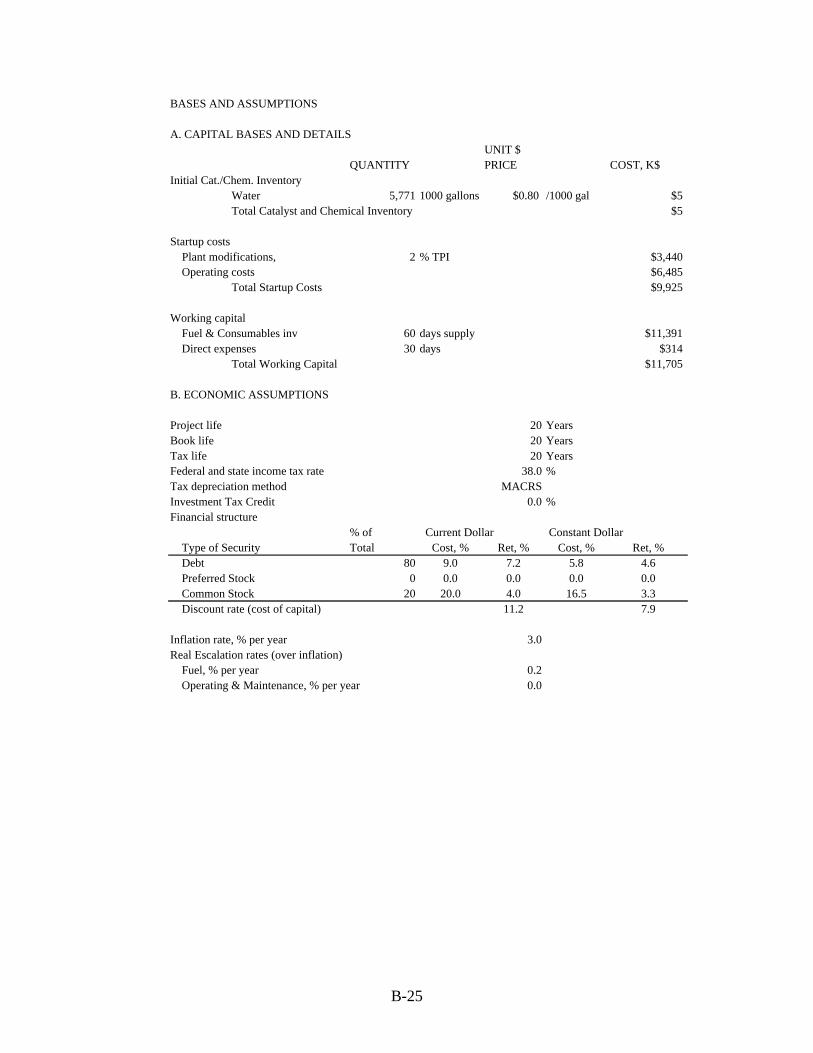
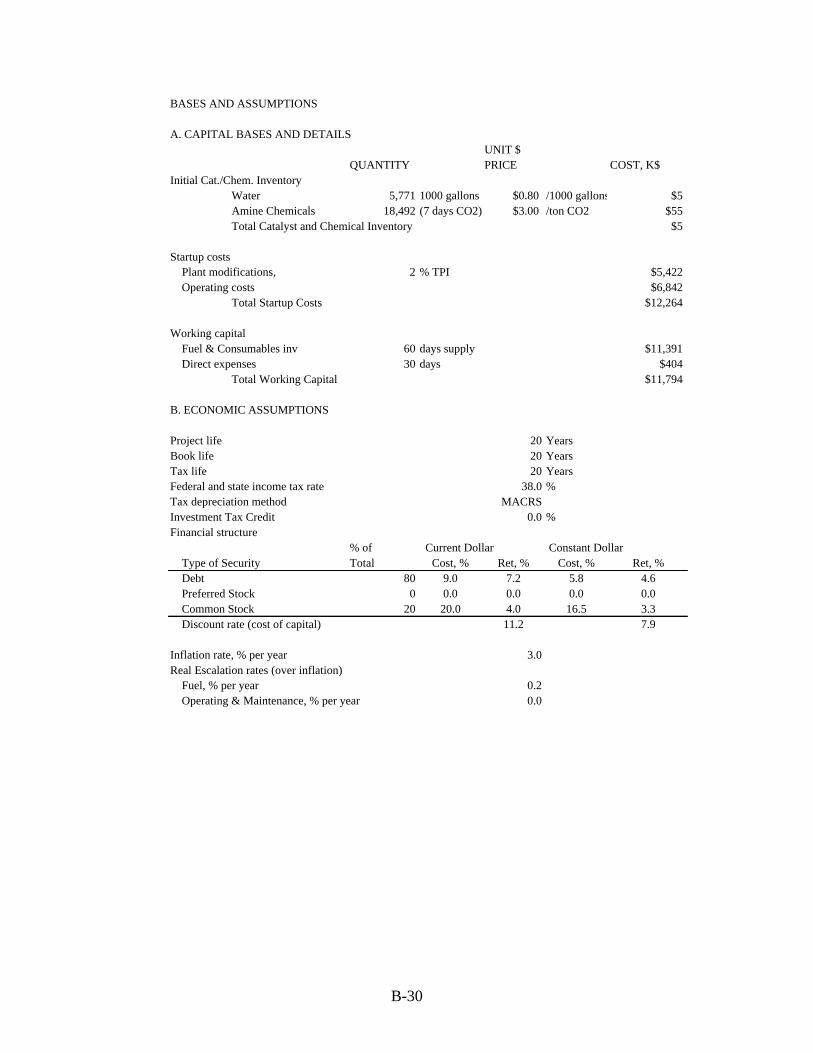
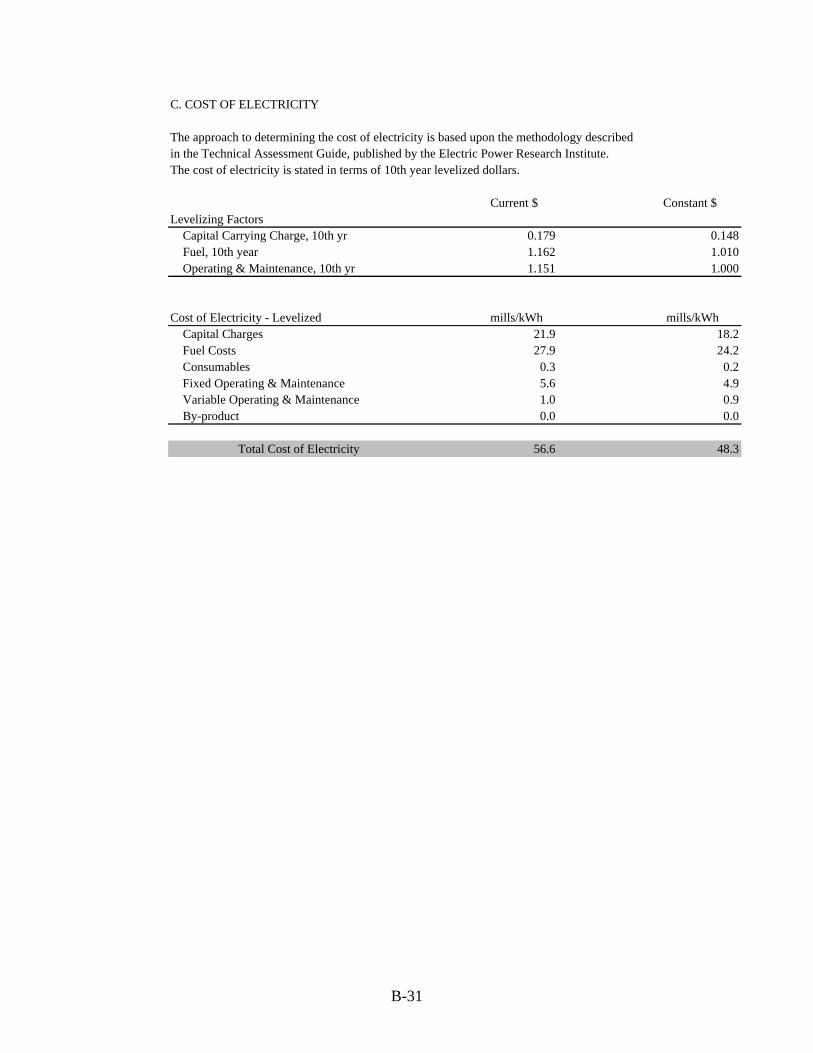
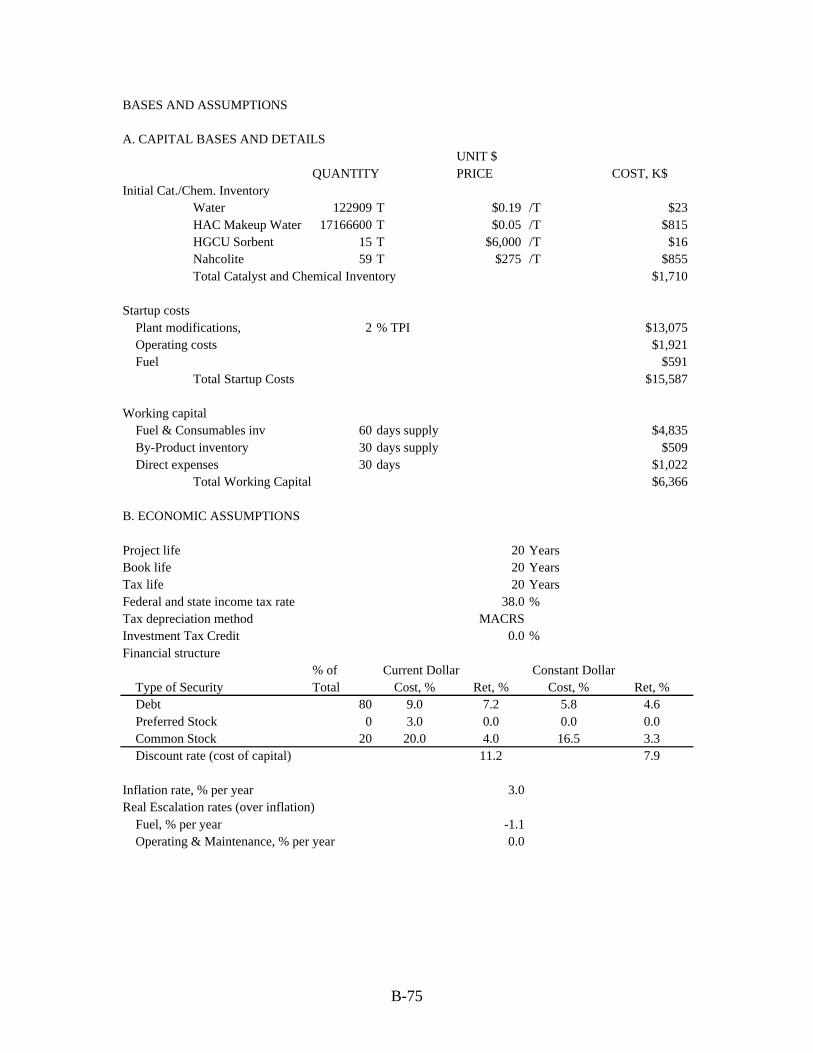
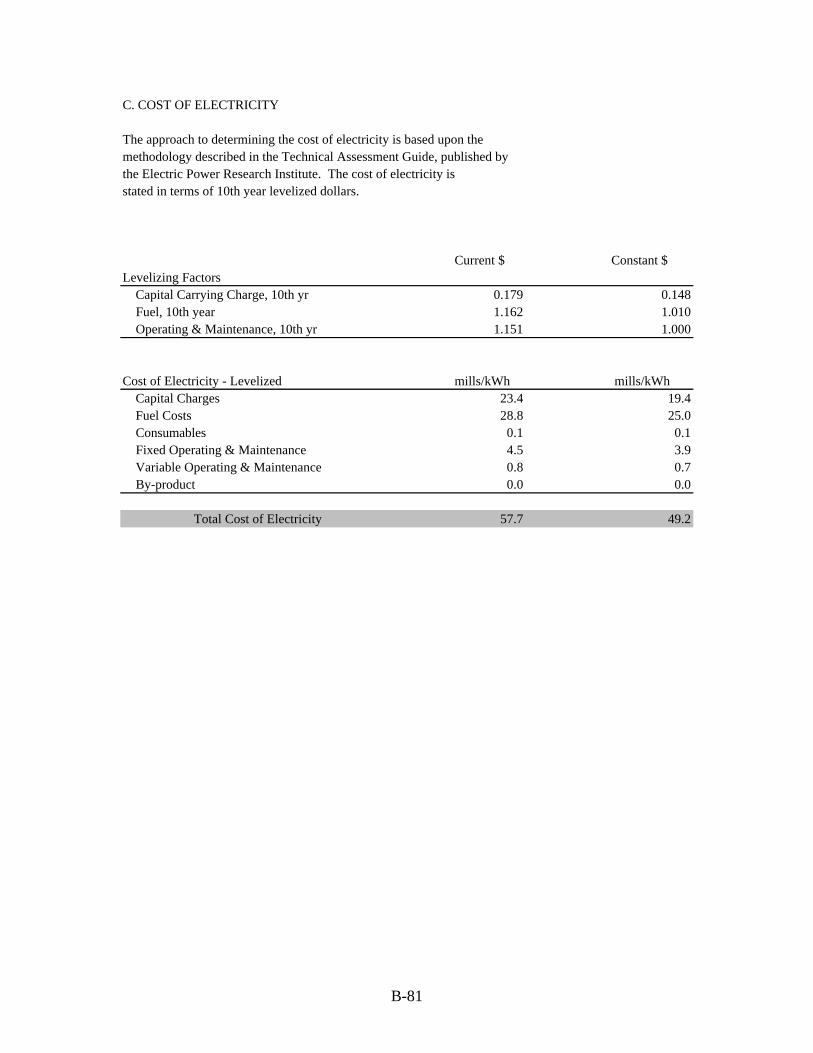
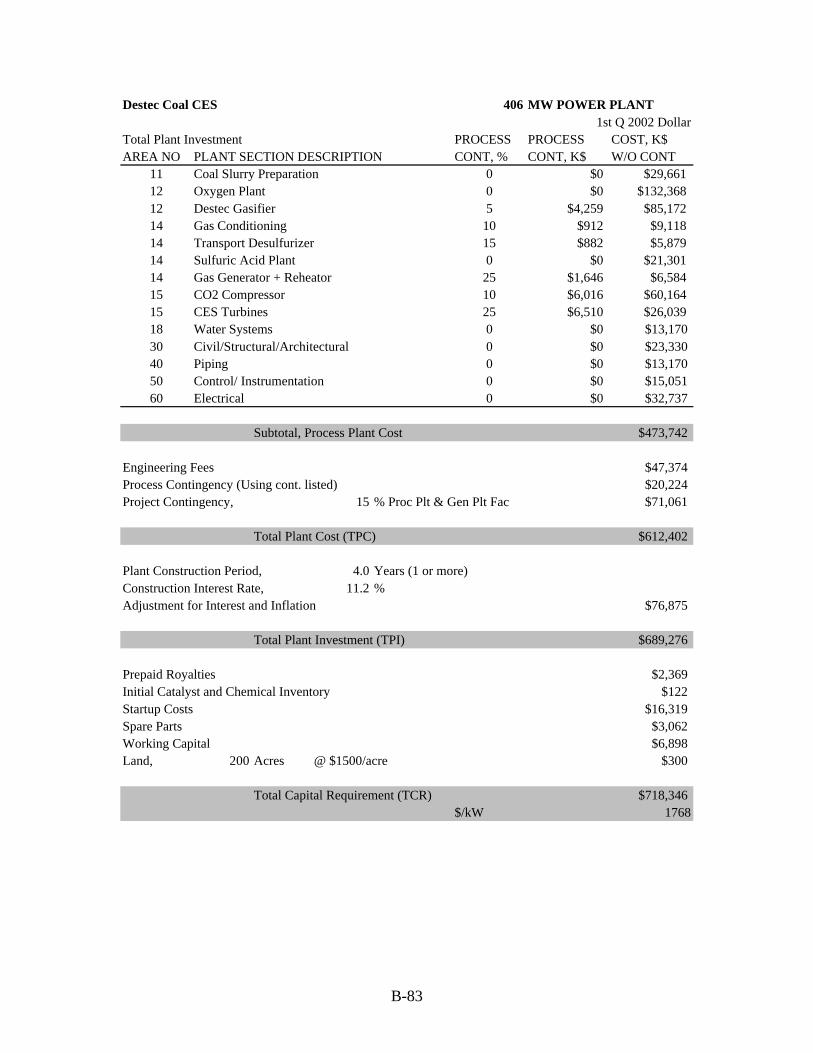
Capital cost estimates were developed for the above cases using data from the EG&G Cost Estimating Notebook (version 1.11) and several contractor reports. The format follows the guidelines set by EPRI TAG methods. Individual equipment sections were based on capacity factored techniques. The costs are reported in first quarter 2002 dollars. The total capital requirement includes equipment, labor, engineering fees, contingencies, interest during construction, startup costs, working capital and land. Other assumptions are provided in summary tables in Appendix B which contains the COE spreadsheets developed for all cases. Results are compared in Table 1 (Natural Gas Cycles) and in Table 2 (Coal Cycles). These results demonstrate the following key observations:
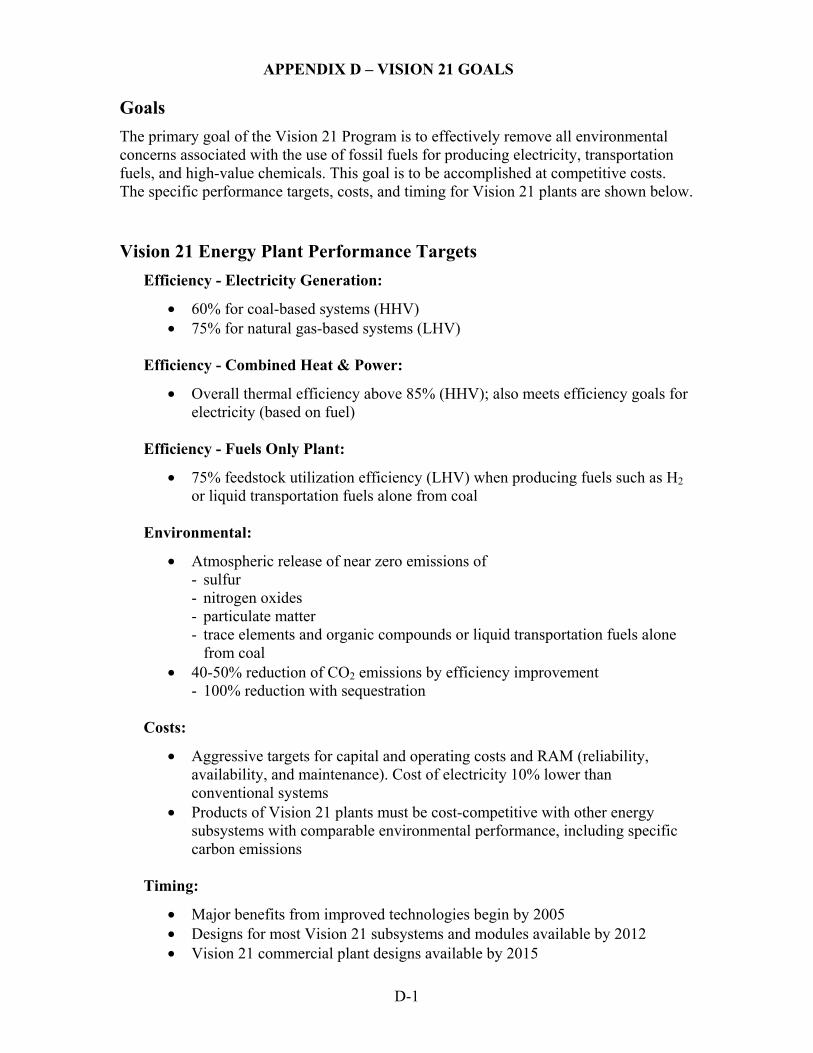
• For all systems, (CO2) capture entails major cost & efficiency penalties. • Only Hybrids perform at or near the Vision 21 efficiency goals summarized in
Appendix D. • Rocket Engine cycles have lower efficiency and higher cost than other options
requiring far less development. • HAC cycles based on a closed-loop water system are unattractive. An open-loop
water system (dam site) may be attractive as a niche market. • Hydrogen Turbine (air) and HAT cycles are also unattractive.
2
TABLE 1 - Natural Gas Cycles
POWER SYSTEMROCKET
ENGINE (CES)HYDROGEN
TURBINE (HT) Hybrid CycleHUMID AIR
TURBINE (HAT)
Power Generation CycleNGCC
"G" Gas Turbine
NGCC "G" Gas Turbine (CO2 Capture)
HAC NATURAL GAS
HAC NATUTAL GAS
(CO2 CAPTURE)
CES (gas generator) (CO2 CAPTURE)
HT (H2 FROM SMR) (CO2 CAPTURE)
Hybrid Turbine (Siemens/West.) -SOFC / Turbine
HAT (PW GT)
Natural Gas
Net Power MWe 379.1 326.9 323.5 300.2 398.4 413.1 19 318.7
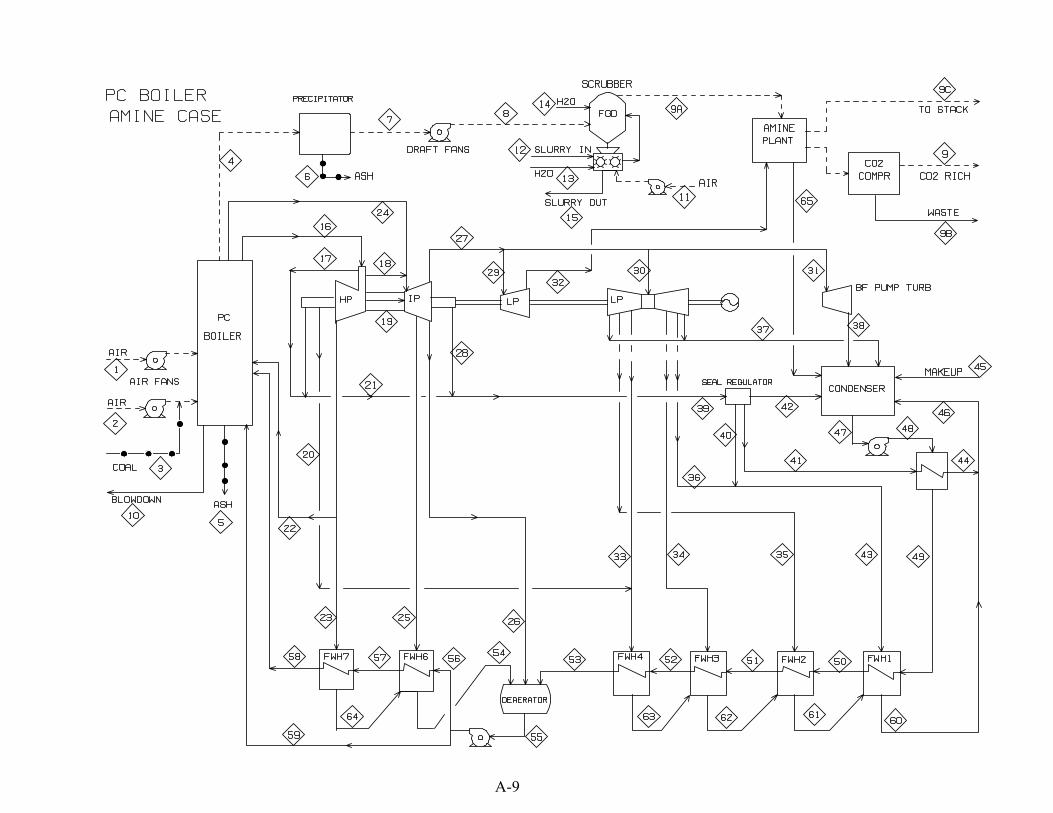
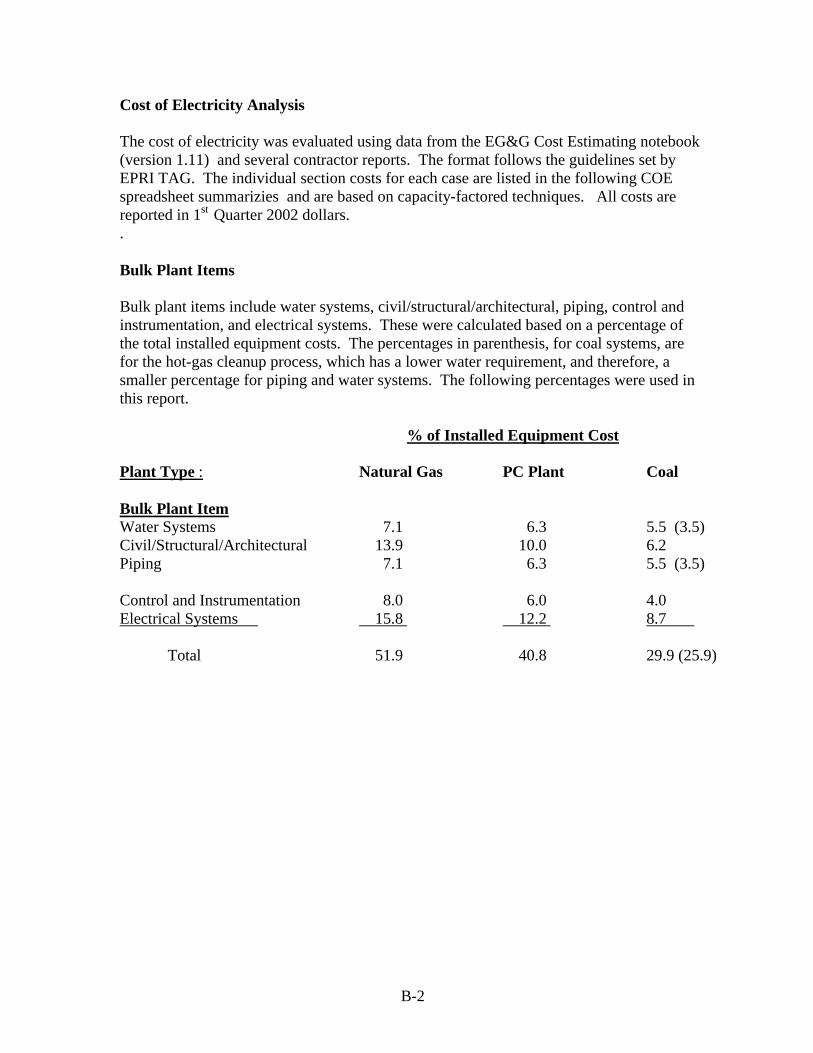
I. REFERENCE PLANTS I-1 PULVERIZED COAL (PC) BOILER PC Boiler power plants without CO2 capture represent a large number of the existing coal-fired power plants used for generating electrical power in the United States and North America. Three cases were developed based on previous Aspen Plus® simulations [1] for use as reference plants to contrast performance and cost with proposed advanced fossil power systems. The first case (Base Case) represents a modern power plant that employs both particulate and sulfur recovery. The remaining two cases are variations that add the possibility of CO2 capture. The Base Case is an air-blown 400 MWe power plant without CO2 capture that is used to establish baseline power plant performance and to assess the cost of electricity (COE). In the second case, an amine absorption process is added to capture CO2 from the flue gas. The third case replaces the air used in the PC base case with a mixture of oxygen and recycled flue gas as the oxidant stream sent to the PC Boiler. This results in a flue gas stream containing primarily CO2 and water vapor. Water is separated by condensation from the flue gas portion that is not recycled to obtain a concentrated CO2 stream for sequestration. In both cases that capture CO2 , the CO2 - rich stream was compressed to 1500 psia and leaves as a high pressure gas stream. (Further compression to approximately 2100 psia would be required to obtain a liquid stream. This would lower the process efficiency and raise the COE somewhat compared to the values listed in this report). For the two cases with CO2 capture, the boiler capacity was chosen the same as the base case to maintain the steam generation at the same amount. Any power or steam required for the CO2 capture or the cryogenic oxygen plant was imported internally from the power plant. As a result, the net power production was reduced. It should be stressed that PC Boiler plants with CO2 capture as described in these two cases are technically possible but are not currently existing commercial units due to both efficiency and cost penalties. I-1.1 PC Power Plant - Base Case – Description The Base Case consists of a power plant based on a pulverized coal (PC) boiler and steam turbine. The system described in a report by Buchanan et al. [2] was used as a design basis. This case was evaluated for benchmarking the performance of the other cases. A single reheat steam power cycle (2400psig/1000 oF /1000 oF) was used to generate 400 MWe of power. The steam generator was a natural circulation, wall-fired, subcritical unit arranged with a water-cooled dry-bottom furnace, superheater, reheater, economizer and air heater. The burners were low-NOx type. The flue gas was desulfurized by scrubbing with lime slurry. A simplified flow diagram is shown in Figure 1. In this process, air is preheated in an air heater by exchanging heat with the flue gas. Coal and hot air are fed to the boiler from the bottom. High pressure steam is generated in the radiant section. Flue gas from the radiant section enters the convective section at 2200 oF. In the convective section, thermal energy from the flue gas is transferred to high-pressure steam,
5
intermediate pressure steam and feed water. Flue gas leaves the convective section at 600 oF and passes through the air heater to preheat air. A precipitator is used to remove particulates and the flue gas is then sent to a SO2 scrubber with the aid of an induced draft fan. Lime slurry is employed to scrub SO2 from the flue gas. The cleaned flue gas leaves through the stacks. The high-pressure steam is superheated in the convective section. Superheated steam at 2415 psia and 1000 oF is expanded in the high-pressure turbine to an intermediate pressure of 604 psia. This IP steam is reheated in the convective section to 1000 oF and is then expanded in the IP steam turbine. Finally, the exhaust from the IP steam turbine is expanded in the LP (low pressure) turbine to 1 psia and enters the condenser. The condensate water is sent to a series of low-pressure feed heaters. The heated water is sent to the deaerator to remove dissolved gases. Deaerated water is passed through the high-pressure water heaters and is then fed to the economizer portion of the boiler’s convective section. Water is further heated to close to its saturation temperature in the economizer and then sent to radiant section for boiling.
Precipitator
InducedDraft Fan SO2
Scrubber
Stacks
InducedDraft Fan
Main Air
Coal
HPSteam
Turbine
IPSteamTurbine
LPSteamTurbine
Condenser
AshPCBoiler
HP FeedWaterHeater
LP FeedWaterHeater
Deaerator
ForcedDraft Fan
Slurry OutAsh
ConvectiveSection
RadiantSection
Lime Slurry
Air Heater
Figure 1. Pulverized Coal Boiler Power Plant
6
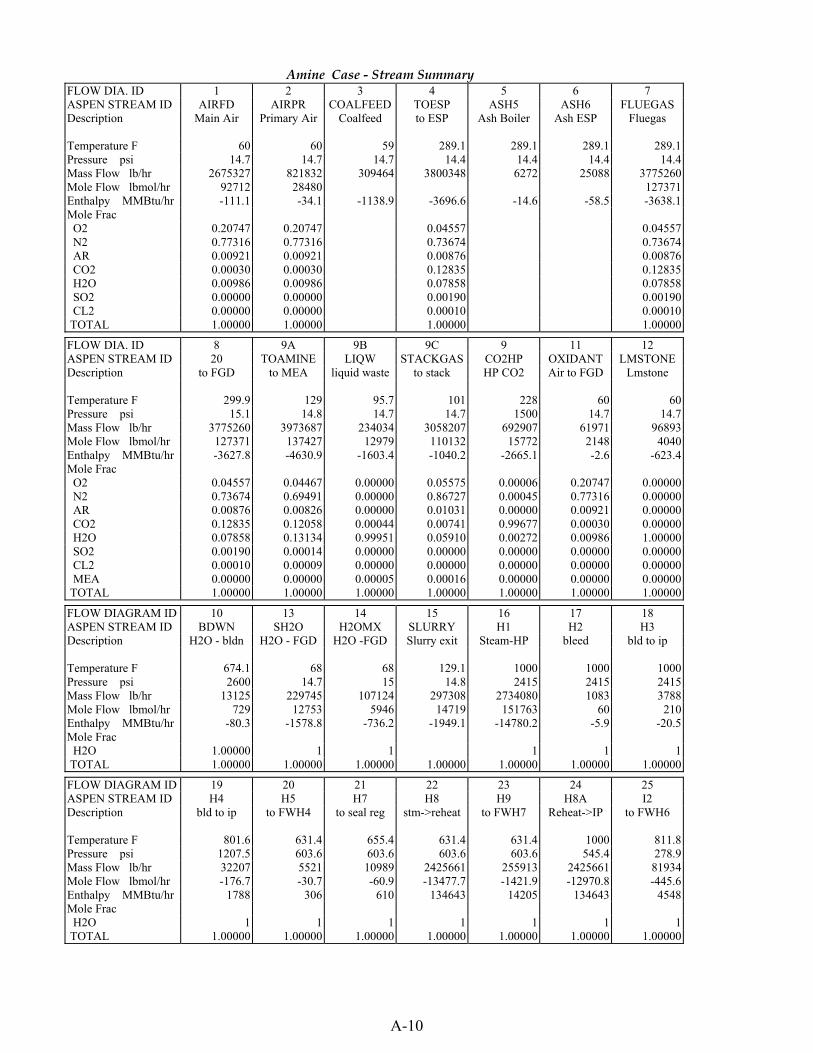
I-1.2 PC Power Plant - Amine CO2 Capture – Description In this case, the boiler operation is identical to the base case; i.e. air is used as the oxidant. The flue gas after sulfur removal is sent to an amine plant for CO2 separation. In the amine plant, a MEA based solution is used to absorb CO2 from the flue gas. The CO2-depleted gas from the absorber is vented to the atmosphere. The CO2-rich solvent is heated by lean solvent and then sent to a stripper for regeneration. Low-pressure steam (35 psia) is extracted from the LP turbine section and sent to the stripper reboiler of the amine plant. A concentrated CO2 stream is recovered from the stripper and the lean solvent is recycled to the absorber. The CO2 stream is compressed to1500 psia in a multistage intercooled compression section and leaves as a high pressure gas. The condensed water from the stripper reboiler is sent back to the steam cycle. Extraction of steam reduces significantly the gross power output from the steam turbines. Additionally, the amine plant consumes power for the flue gas blower and for the amine solvent recirculation pumps and a large power consumption is due to the required CO2 compressor. A simplified flow diagram is shown in Figure 2.
Precipitator
InducedDraft Fan
SO2Scrubber
InducedDraft Fan
Main Air
Coal
HPSteam
Turbine
IPSteamTurbine
LPSteamTurbine
Condenser
AshPCBoiler
HP FeedWaterHeater
LP FeedWaterHeater
Deaerator
ForcedDraft Fan
SlurryOutAsh
ConvectiveSection
RadiantSection
Lime Slurry
CompressedCO2-richStream
Amine PlantVent
Condensate Steam
Air Heater
Figure 2. PC-Fired Boiler with Amine Scrubbing for CO2 Sequestration
7
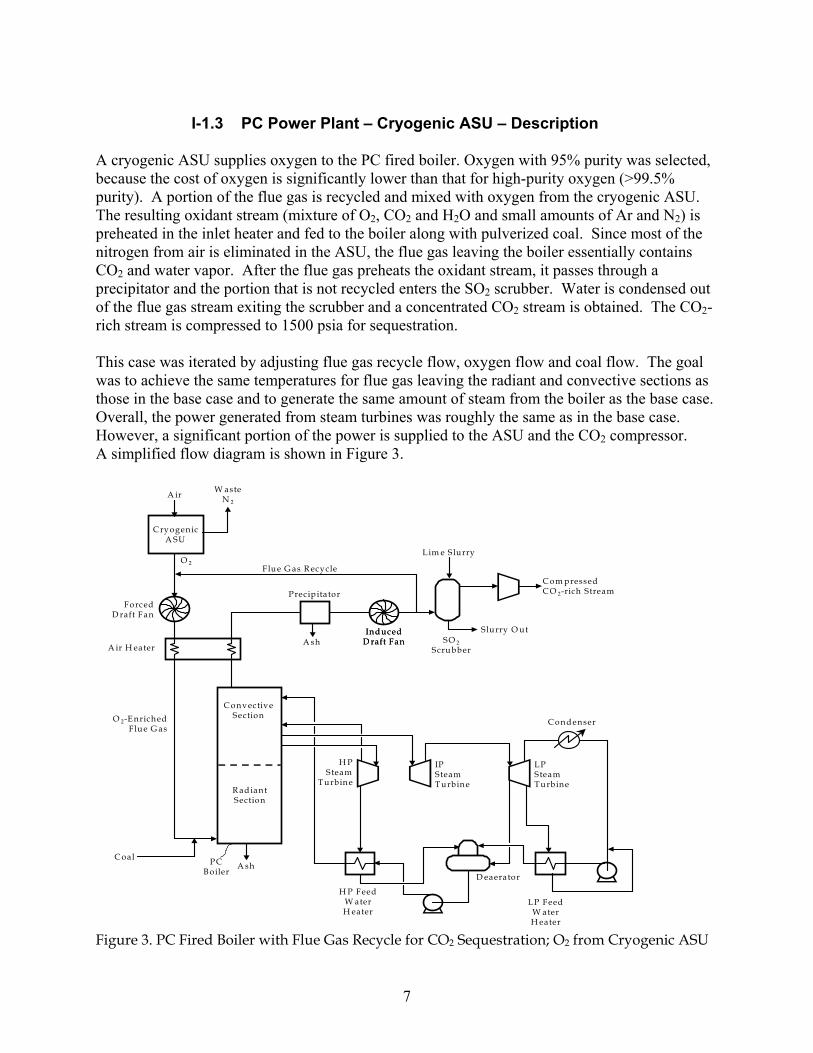
I-1.3 PC Power Plant – Cryogenic ASU – Description A cryogenic ASU supplies oxygen to the PC fired boiler. Oxygen with 95% purity was selected, because the cost of oxygen is significantly lower than that for high-purity oxygen (>99.5% purity). A portion of the flue gas is recycled and mixed with oxygen from the cryogenic ASU. The resulting oxidant stream (mixture of O2, CO2 and H2O and small amounts of Ar and N2) is preheated in the inlet heater and fed to the boiler along with pulverized coal. Since most of the nitrogen from air is eliminated in the ASU, the flue gas leaving the boiler essentially contains CO2 and water vapor. After the flue gas preheats the oxidant stream, it passes through a precipitator and the portion that is not recycled enters the SO2 scrubber. Water is condensed out of the flue gas stream exiting the scrubber and a concentrated CO2 stream is obtained. The CO2-rich stream is compressed to 1500 psia for sequestration. This case was iterated by adjusting flue gas recycle flow, oxygen flow and coal flow. The goal was to achieve the same temperatures for flue gas leaving the radiant and convective sections as those in the base case and to generate the same amount of steam from the boiler as the base case. Overall, the power generated from steam turbines was roughly the same as in the base case. However, a significant portion of the power is supplied to the ASU and the CO2 compressor. A simplified flow diagram is shown in Figure 3.
Precip itator
In d ucedD raft Fan SO 2
Scrubber
In d ucedD raft Fan
A ir
C oal
H PSteam
Turbin e
IPSteamTurbin e
L PSteamTurbin e
C on d en ser
A shPCB oiler
H P FeedW aterH eater
LP FeedW aterH eater
D eaerator
ForcedD raft Fan
Slurry O utA sh
C on vectiveSection
R ad ian tSection
L im e S lurry
O 2-E nrich edFlue G as
C ryogen icA SU
W asteN 2
O 2
C om p ressedC O 2-rich Stream
Flue G as R ecycle
A ir H eater
Figure 3. PC Fired Boiler with Flue Gas Recycle for CO2 Sequestration; O2 from Cryogenic ASU
8
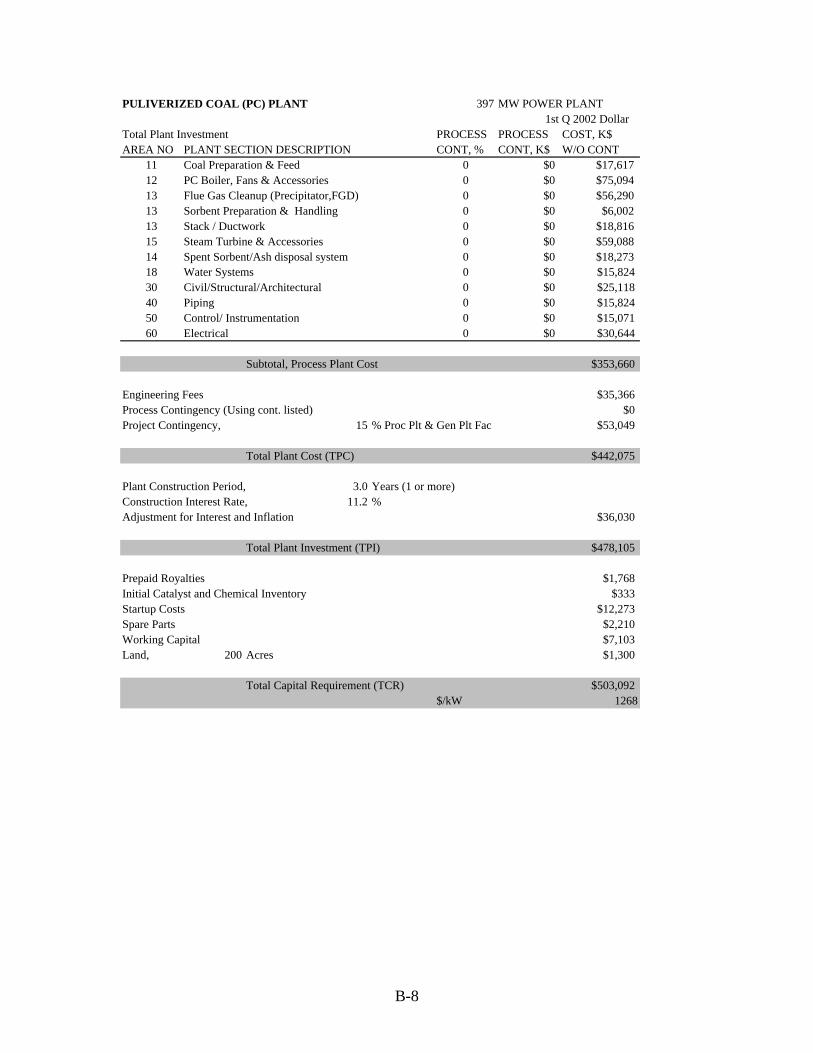
I-1.4 PC Power Plant Results Detailed flow diagrams with stream summaries are provided in Appendix A based on the Aspen Plus® simulation results. Emissions for NOx and SOx were based on the BACT (best available control technology) and CO2 was based on simulation results. Capital cost estimates were developed based on Buchanan et al. [2] and vendor estimates for the amine plant and the oxygen plant [3]. Spreadsheets showing capital costs and the COE analysis are provided in Appendix B. The results shown below for these cases illustrate significant cost and efficiency penalties for CO2 capture.
Table 3. Pulverized Coal (PC)
POWER SYSTEM
Generation Cycle
Coal PC Steam Cycle (no
CO2 Capture)
Coal PC Steam Cycle
(amine CO2 Capture
Coal PC Steam Cycle (O2 Boiler/ CO2
CAPTURE)
Net Power MWe 396.8 283 298.4
Net Plant Efficiency 38.86 27.72 30.5 % LHV
Total Capital Requirement 1268 2373 2259$ / KW
Cost of Electricity 42.3 76.6 68.8Constant $ / MW-hr
NOx emissions 4.09 5.74 0.205lb/MW-hr
Sox emissions 3.12 4.16 2.98lb/MW-hr
CO2 Productionlb/MW-hr a) Emitted to atmosphere 1837 129 * b) Sequesterable 2448 2332
CO2 concentration (mole%) 99.70% 86.60%(in sequestered gas)
Footprint (battery limits) 636 1009 1591sq ft/MW
PULVERIZED COAL (PC)
9
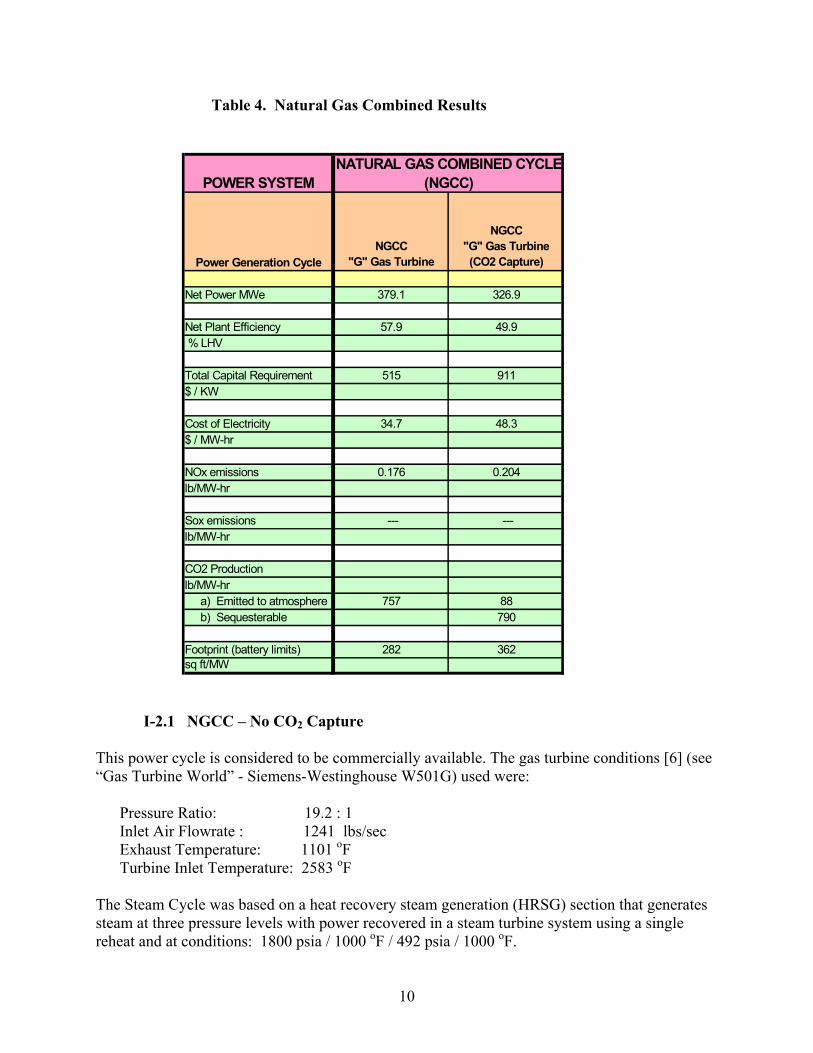
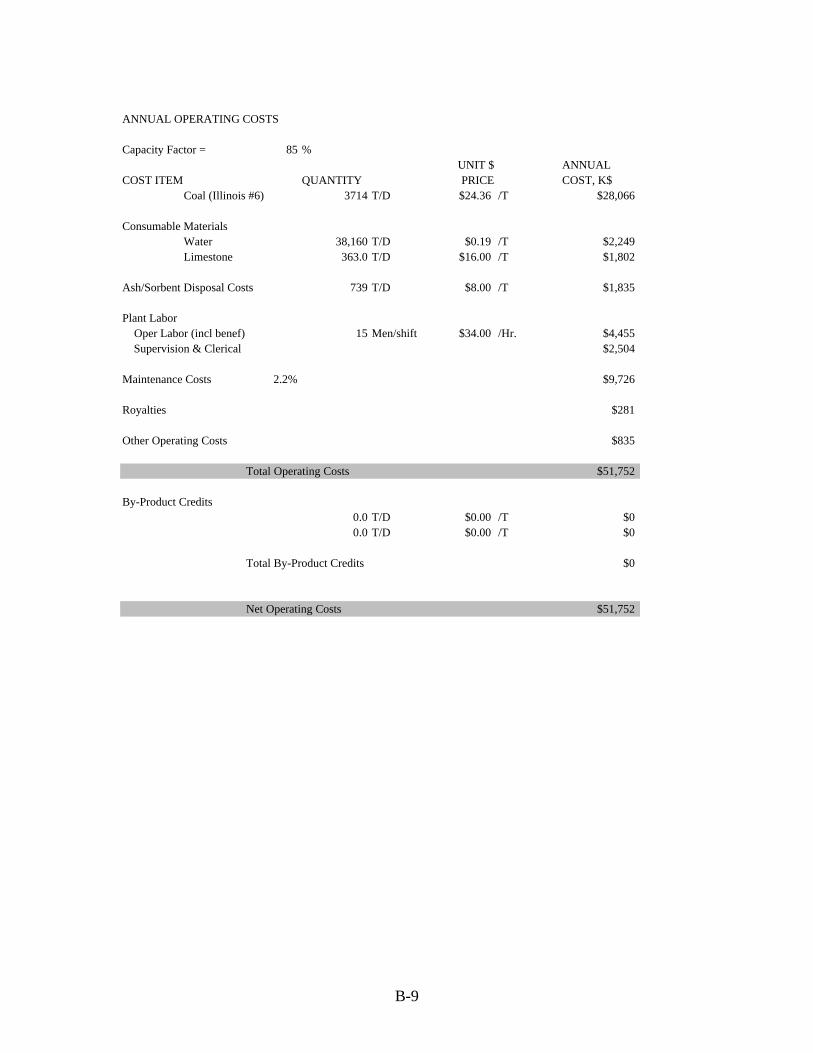
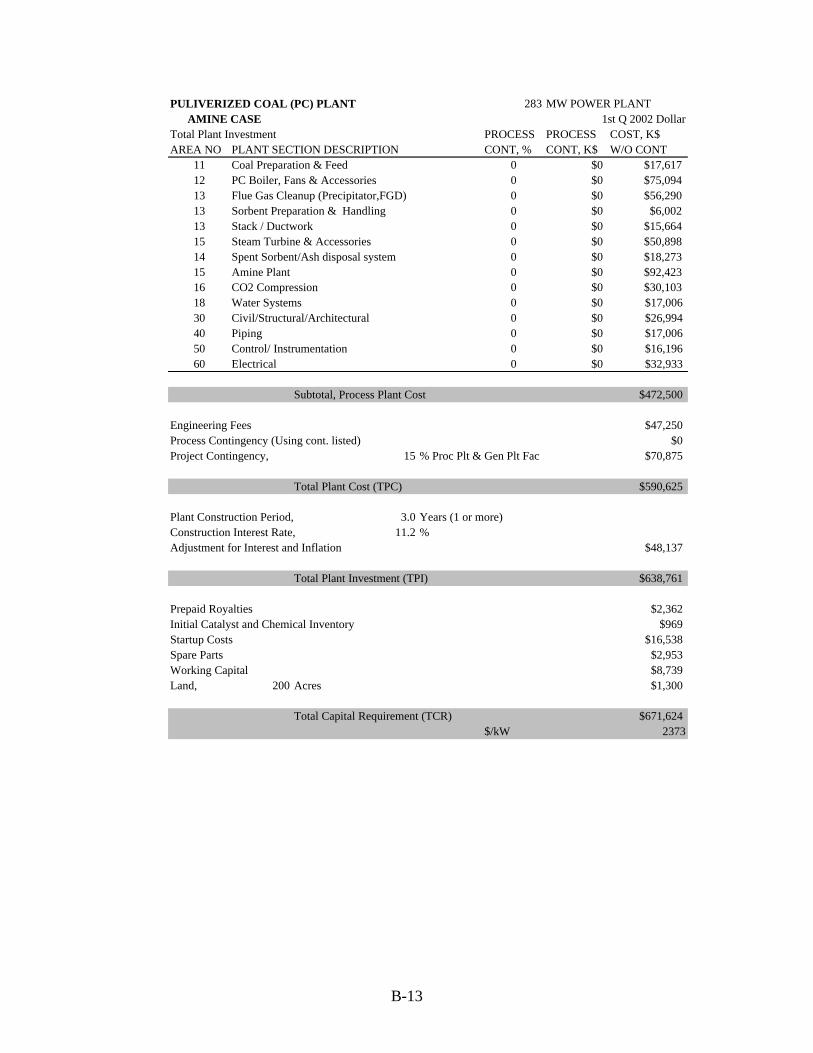
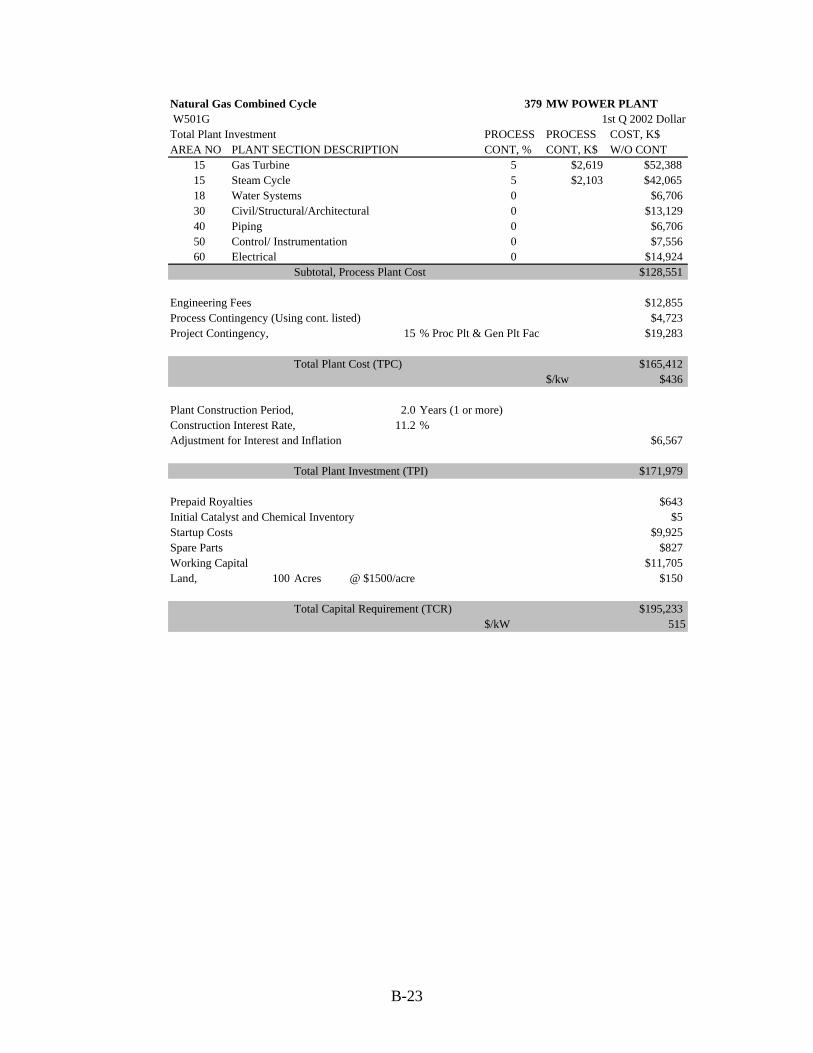
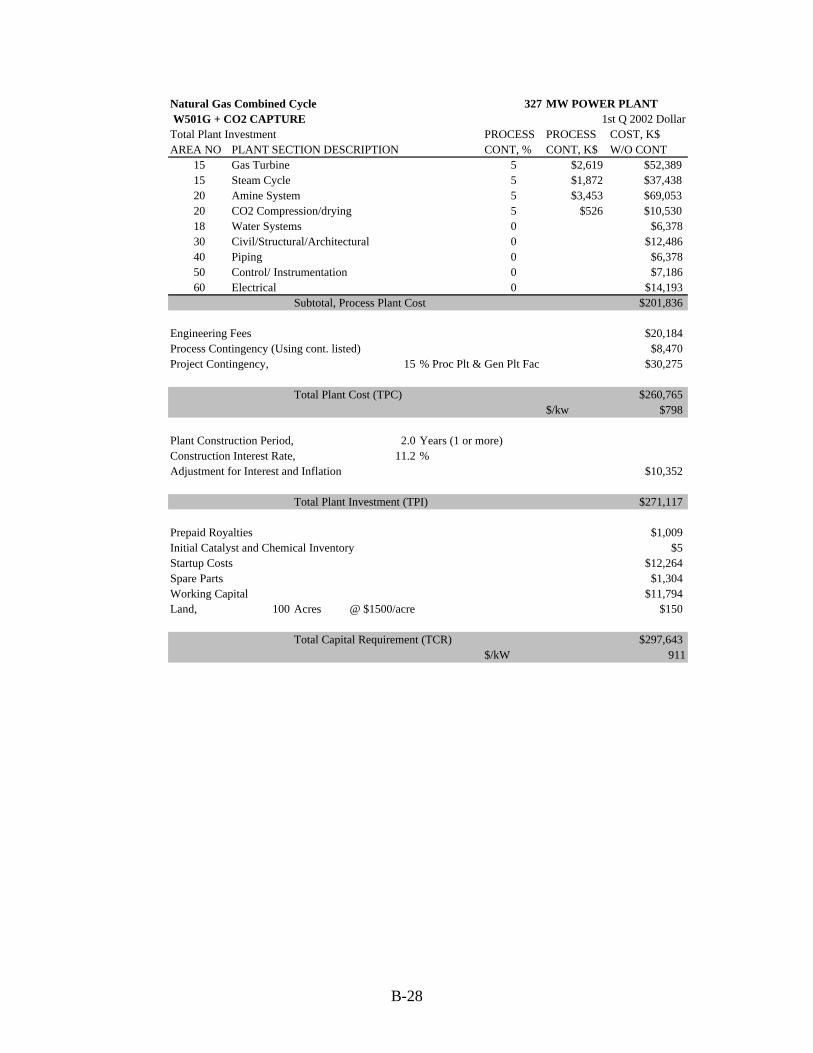
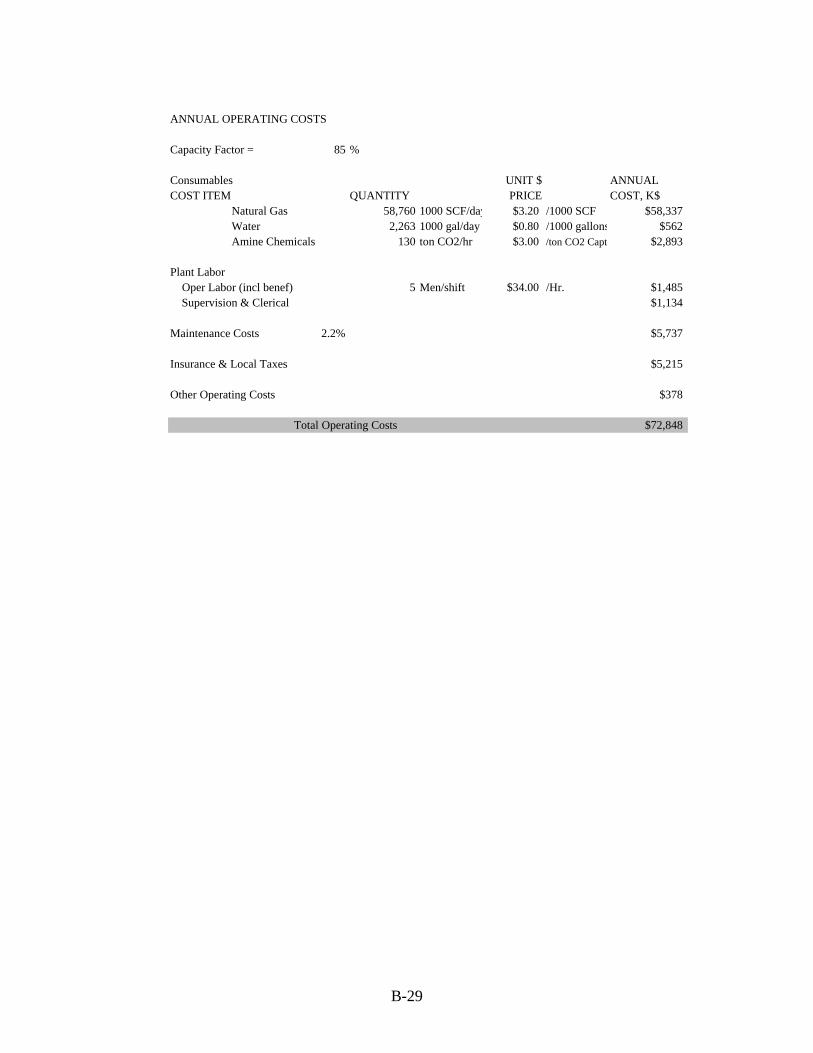
The Base Case power plant generates 396.8 MW and its efficiency is 38.9% (LHV) or 37.5% (HHV). The CO2 capture decreases the efficiency by a dramatic 8 – 11 percentage points and and nearly doubles the base case’s total capital requirement of $1268/KW. The cost and performance of the amine plant are based on commercially available oxygen-tolerant amine technology designed to capture 95% of the CO2. The energy consumption for the amine case was assumed to be 3.7 MMBtu / ton CO2 recovered. (NETL is currently funding research aimed at reducing this by up to 50% , [4]). Steam consumption for regenerating the amine solution resulted in a significant penalty on power production. The power output from the steam turbine decreased to 325 MW. The consumption of power by the amine plant and the CO2 compressor reduced the net power output from the power plant to 283 MW. Thus, 114 MW power was consumed for the CO2 capture system. Overall efficiency of the system was 27.7% (LHV). Based on vendor information, the amine plant and CO2 compression added $122 MM in capital cost to the base case. This increased the COE from 42.3 to 76.6 ($/MW-hr, Constant $ basis). In the last case, PC oxygen/recycle flue gas boiler, it was assumed that the concentrated CO2 stream can be sequestered without further processing. Thus, the entire CO2-rich flue gas stream (not recycled) was compressed to 1500 psia for sequestration and there were no CO2 emissions in this case. The cryogenic ASU produced 7570 tpd oxygen (on pure basis) of 95% purity (by vol.) and consumed 64 MW power. The compression of the CO2-rich stream consumed another 34 MW. Use of oxygen increased the boiler efficiency as evidenced by reduced coal consumption. However, the net power output for the cryogenic case decreased to 298 MW and the efficiency decreased to 29.5%. Additional capital cost of $145 MM included the cost of the cryogenic ASU, the cost of redesigning the normal PC boiler for oxygen firing and the capital cost of the CO2 compressor. The COE with CO2 capture was $68.8/ MW-hr. . I-2 NATURAL GAS COMBINED CYCLE (NGCC) Aspen Plus® simulations were developed for two natural gas power combined cycle power plants using a gas turbine model that is based on the Siemens-Westinghouse W501G gas turbine and a three pressure level steam cycle. The two cases differ depending on whether CO2 capture is included. The first case (no CO2 capture) produces 379.1 MWe at a process efficiency of 57.9% (LHV) and is considered as a commercially available plant. The second case includes CO2 capture based on recovering CO2 from the flue gas stream that exits the heat recovery steam generator (HRSG). The CO2 capture envisioned is based on a commercial amine process (Dow Chemical) [5] operating at a design of 90% CO2 capture coupled with compression to sequester the CO2 as a high pressure liquid. The power is reduced both due to compression and the steam required for regenerating the amine solvent. Dow Chemical has advised us that the system is both more difficult when compared with recovery from a PC power plant and more expensive due to the higher oxygen content in the exhaust. At the present time, they were unaware of any existing plant using this approach due to the high efficiency penalty expected. The Aspen Plus® results indicated a reduction in power to 326.9 MWe and a reduction in efficiency to 49.9% (LHV). Results are summarized in the following table.
10
Table 4. Natural Gas Combined Results
I-2.1 NGCC – No CO2 Capture This power cycle is considered to be commercially available. The gas turbine conditions [6] (see “Gas Turbine World” - Siemens-Westinghouse W501G) used were:
Pressure Ratio: 19.2 : 1 Inlet Air Flowrate : 1241 lbs/sec Exhaust Temperature: 1101 oF Turbine Inlet Temperature: 2583 oF
The Steam Cycle was based on a heat recovery steam generation (HRSG) section that generates steam at three pressure levels with power recovered in a steam turbine system using a single reheat and at conditions: 1800 psia / 1000 oF / 492 psia / 1000 oF.
POWER SYSTEM
Power Generation CycleNGCC
"G" Gas Turbine
NGCC "G" Gas Turbine (CO2 Capture)
Net Power MWe 379.1 326.9
Net Plant Efficiency 57.9 49.9 % LHV
Total Capital Requirement 515 911$ / KW
Cost of Electricity 34.7 48.3$ / MW-hr
NOx emissions 0.176 0.204lb/MW-hr
Sox emissions --- ---lb/MW-hr
CO2 Productionlb/MW-hr a) Emitted to atmosphere 757 88 b) Sequesterable 790
Footprint (battery limits) 282 362sq ft/MW
NATURAL GAS COMBINED CYCLE (NGCC)
11
Emissions were based on simulation results for CO2 and an assumed NOx level of 9 ppmv. (the table results would be slightly higher if adjusted for 15% oxygen level in the exhaust – which is often given in reports). The capital cost estimate was based on information published in NETL reports , DOE/HQ contractor studies and from the Gas Turbine World (2001) annual summary [6]. The cost of electricity analysis was based on the EPRI Tag method. The Footprint (battery limits) was a crude estimate based on available information in published studies (such as the footprint of the W501G gas turbine). The actual plant site would be approximately 100 acres. In Figure 4, the process is shown with key process streams to illustrate this power plant cycle. Appendix A contains detailed information for the process streams shown.
Figure 4. NGCC Power Plant
12
I-2.2 NGCC – CO2 Capture
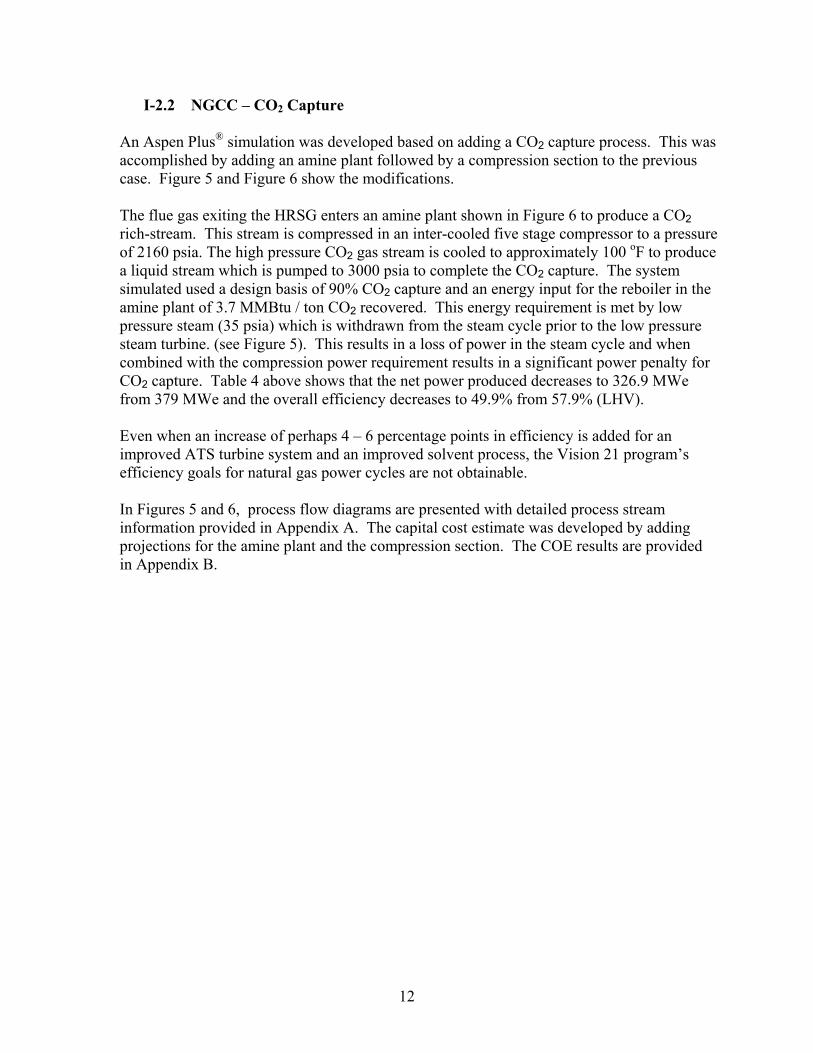
An Aspen Plus® simulation was developed based on adding a CO2 capture process. This was accomplished by adding an amine plant followed by a compression section to the previous case. Figure 5 and Figure 6 show the modifications. The flue gas exiting the HRSG enters an amine plant shown in Figure 6 to produce a CO2 rich-stream. This stream is compressed in an inter-cooled five stage compressor to a pressure of 2160 psia. The high pressure CO2 gas stream is cooled to approximately 100 oF to produce a liquid stream which is pumped to 3000 psia to complete the CO2 capture. The system simulated used a design basis of 90% CO2 capture and an energy input for the reboiler in the amine plant of 3.7 MMBtu / ton CO2 recovered. This energy requirement is met by low pressure steam (35 psia) which is withdrawn from the steam cycle prior to the low pressure steam turbine. (see Figure 5). This results in a loss of power in the steam cycle and when combined with the compression power requirement results in a significant power penalty for CO2 capture. Table 4 above shows that the net power produced decreases to 326.9 MWe from 379 MWe and the overall efficiency decreases to 49.9% from 57.9% (LHV). Even when an increase of perhaps 4 – 6 percentage points in efficiency is added for an improved ATS turbine system and an improved solvent process, the Vision 21 program’s efficiency goals for natural gas power cycles are not obtainable. In Figures 5 and 6, process flow diagrams are presented with detailed process stream information provided in Appendix A. The capital cost estimate was developed by adding projections for the amine plant and the compression section. The COE results are provided in Appendix B.
13
Figure 5. NGCC – with CO2 Capture
Steam 40
NGCC (WITH CO2 CAPTURE) - W501G GAS TURBINE - 3 PRESSURE LEVEL STEAM CYCLE
AMINE PLANT
INTERCOOLED 5 -STAGECO2 COMPRESSOR
LIQUID CO2
WATER WASTE
Condensate
41
42
4344
45
14
AMINE PLANT
Figure 6. Amine Plant
R ichM E A
R ichM E A
L e a nM E A 1
Q P M E AL e a n
L e a nM E A I
R ichM E A 3
R ichM E A 2
S tripC O 2
C O 2S e q s tr
L ea nM E A 2
L ea nM E A 3
L ea nM E A 4
L e a n C o o le r
L e a nM E A 5
M k u p H 2O
M k u p M E A
L ea nM E A 6
L e a nM E A 7
L e a nM E A 8
R
L ea nM E A r
V e n tS tripC O 2c
S trip p erA bso rb er
f lu e 4flu e 3flu e 2
B lo w e r
q b lo w e r q c lflu e3
W a te r
flu e1flu e g a s
q c lflu e
L ea n -R ich H XQ re b o ile r
Q P M E AR ich
R ich M E A P u m p
L e a n M E A P u m p
Q C O O L
Q C O N D
15
I-3. INTEGRATED GASIFCATION COMBINED CYCLE (IGCC)
NETL/DOE has been sponsoring the research and development of IGCC as the cleanest coal-based power system available today for several decades and in a recent report (July 2002) [7] a snapshot is provided from industry’s viewpoint on the outlook and needs for future research and development of both IGCC and Gasification Technologies. As part of providing a comparison with the proposed advanced coal power systems presented later in this report, a group of IGCC systems studies has been assembled based on previous NETL studies completed in FY2000. In Table 5, results are summarized for several reference IGCC cases that are viewed as near-term commercially available and for a case proposed on the inclusion of a hydrogen powered fuel cell. (These systems studies are available with additional systems based on different gasifiers on the NETL website [8].) Key assumptions include:
• Oxygen- blown Gasification (Destec [E-Gas™] or Shell) using Illinois No. 6 bituminous coal.
• Gas Cleanup for particulate matter, chloride and sulfur based on either Cold Gas Cleanup or Hot Gas Cleanup.
• Gas Turbine based on Siemens Westinghouse W501G heavy duty gas turbine with dry low-NOx combustor. (9 ppmv NOx, nominal 272 MWe – modified for syngas).
• Steam Cycle is a three pressure level process. • Air Separation based on cryogenic process integrated with the gas turbine. • Single-Train IGCC Power Plants. • For the two cases that include CO2 sequestration, the CO2 is captured and compressed to
provide a liquid product stream. • For the case that produces high purity hydrogen, conversion to power via a fuel cell
occurs at 65% of the heating value of the hydrogen produced. • Cost of Electricity (COE) based on estimates updated to First Quarter 2002 ,
These cases demonstrate overall efficiencies (LHV basis) ranging from 40- 49%. The lower efficiencies cases include a CO2 Sequestration penalty of 6 – 7 percentage points.
16
Table 5. Reference IGCC Case Results (** Footprint does not include fuel cell)
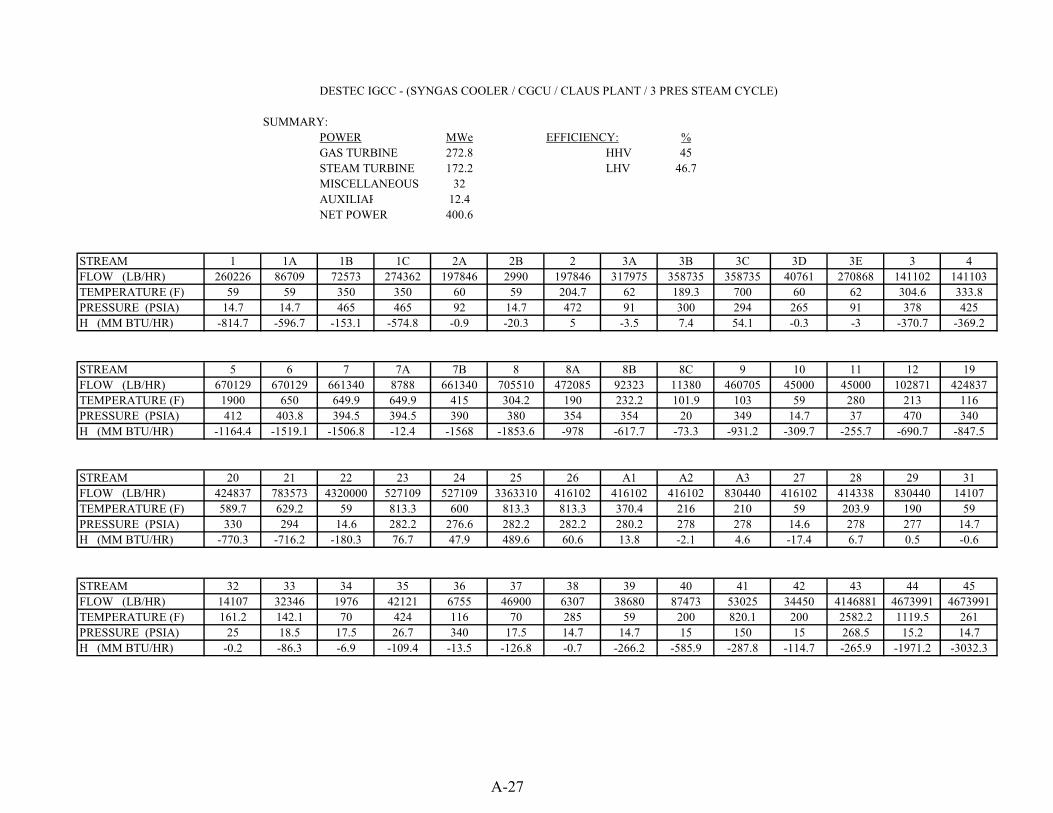
Two reference cases were developed in FY2000 for the NETL/Gasification Technologies team and are documented on the website. They can accessed via the following URL. http://www.netl.doe.gov/coalpower/gasification/system/destx3x_.pdf As part of the DOE Clean Coal Technology demonstration projects, the Destec IGCC process was commercially demonstrated as the Wabash River Coal Gasification Repowering Project [9]. The DOE is currently sponsoring additional optimization studies [10] (Nexant, Global Energy) based on the results of this demonstration. This analysis and scope can accessed via the following URL. http://www.netl.doe.gov/coalpower/gasification/projects/systems/docs/40342R01.PDF For the present report the simulation codes developed earlier were updated to use version 10.2 of Aspen Plus® and the COE estimate was updated to first quarter 2002.
The cases have the following common process sections:
• Coal Slurry Prep - based on Illinois #6 coal, 66.6% solids. • Destec Gasification - two stage, entrained flow, oxygen-blown, slagging gasifier. • Air Separation Unit (ASU) - high pressure process integrated with the gas turbine. • “G” gas turbine -W501G modified for coal derived fuel gas. • Three pressure level subcritical reheat Steam Cycle
- (1800 psia / 1050 οF / 342 psia / 1050 οF / 35 psia). The approach used for gas cleanup accounts for the major differences between the two cases. For sulfur removal, Case 1 uses cold gas cleanup (CGCU) and Case 2 uses transport desulfurization hot gas cleanup (HGCU). The syngas gas cooler section following the gasifier (and integrated with the gasifier and other heat exchangers) is used for generating high-pressure superheated steam. This section is followed by a cyclone that captures particulates for recycle to the gasifier. The cooled raw fuel gas leaves the filter at a temperature of 650 oF for Case 1 and 1004 oF for Case 2. In Case 1, the raw fuel gas is further cooled (304 oF) and scrubbed and then sent to a gas cooling / heat recovery section before entering the CGCU section. In Case 2, the raw fuel gas enters a chloride guard bed prior to the HGCU section. Sulfur is recovered as elemental sulfur using the Claus process for Case 1 and as sulfuric acid using an acid plant for Case 2. Process flow diagrams for these cases are shown in Figures 7 and 8. Additional flow diagrams (steam cycles) and material and energy balances summaries are provided in Appendix A and COE summaries are given in Appendix B. In Table 6 (above) the overall results obtained for power generation, process efficiency, and COE are compared for both cases.
Figure 7. Case 1. IGCC DESTEC / CGCU – No CO2 Capture
GAS COOLING / HEAT RECOVERY COS HYDROLYSIS LP STEAM GENERATION
19
Figure 8. Case 2. IGCC DESTEC / HGCU – No CO2 Capture
20
I-3.2 IGCC Destec (E-Gas™) Cases – CO2 Capture
This case was developed based on modifying Case 1 to include CO2 capture and involves the following changes in the power plant design:
• Shift Reaction Section using a catalytic process to accomplish the following reactions: CO + H2O ↔ CO2 + H2 (water-gas shift) COS + H2O ↔ CO2 + H2S (COS Hydrolysis)
• Selexol process for both H2S and CO2 removal. This replaces the MDEA section in
Case 1. • CO2 compression in a multistage (5-stages) intercooled compressor to 2100 psia, cooling
to 100 οF (liquid) and pumped to 3000 psia for storage.
• Gas Turbine – the gas turbine is fueled with the hydrogen rich fuel.
Shift Reaction Section The catalyst chosen (named SSK , “Sulfur Tolerant Shift Catalyst”) and process conditions were designed based on information provided to NETL (Patrick Le - 1997) by Haldor Topsoe, Inc. [11]. The catalyst can be used for both the water-gas shift and the COS hydrolysis reactions and was initially developed at EXXON Research & Engineering Laboratories and extended for industrial use by Haldor-Topsoe. The main features of the SSK catalyst are: - unique property of being highly active for the reaction of carbon monoxide with steam in the
presence of hydrogen sulfide. - maintains its activity over a wide range of operating conditions including temperatures to
890 οF. - No specific catalyst poisons are known for SSK. Insensitive to even relatively large amounts
of chlorine. The simulation model represents this section using a two-bed shift unit with intercoolers / aftercoolers for heat recovery that was integrated into the steam cycle. The required shift steam was bled from the steam cycle at conditions of 632 οF and 390 psia and mixed with the raw syngas and sent to the first catalytic bed. The first bed converts 70% of the CO and nearly all the COS. The exiting stream is cooled to 460 οF before entering the final stage. The overall conversion obtained for CO was 95%. After cooling, the stream is sent to the Selexol process section. Selexol Process Section This section is used to selectively remove H2S in a product stream that is sent to a Claus unit for sulfur recovery and to recover CO2 in a product stream that is sent to a compression unit for sequestration. The Selexol process is an absorber-stripper system that uses a designer physical solvent (Dow Chemical, formerly Union Carbide) containing a mixture of glycols. In the
21
Aspen Plus® simulation, the overall recoveries were represented and the detailed chemistry not modeled. The shifted cooled syngas is considered to enter an absorber that preferentially removes the H2S by using a lean Selexol solvent that is loaded with CO2 . The rich solvent leaves the absorber and is sent to a stripper for regeneration. Low pressure steam used for the stripper reboiler is supplied from the steam cycle. The sweet syngas stream exits the first absorber and is sent to a second absorber that uses an unloaded solvent to remove CO2 and additional H2S. The CO2 rich solvent stream leaves the second absorber and is recovered by flashing CO2 vapor off the liquid at a reduced pressure. (Alternately, a second stripper could be used.) The cleaned syngas in the current simulation aimed at power production is reheated and sent to the gas turbine combustor. Alternately, if hydrogen is the desired product, the hydrogen rich syngas stream would be sent to a pressure swing absorption process for further purification with a residual fuel stream available for use in power generation. (see Case 5 that uses Shell gasification for this approach). (It should be noted that the use of a double absorber system will result in improved H2S removal which may approach the goals set for hot gas cleanup units {Case 2}. The sulfur emissions levels reported in Table 5 assumed that the SCOT waste stream was not recycled to the gasifier. Recycling would perhaps reduce the values shown by one-half. {HGCU levels}.) CO2 Compression Section The CO2 from the Selexol section is considered to be recovered in two streams from flashes at pressures of 40 psia (90%) and 15 psia (10%). The lower pressure stream is compressed to 45 psia and combined with the larger stream and sent to a multistage (5 stages) intercooled compressor to approximately 2100 psia. The supercritical stream is cooled to approximately 100 οF (liquid) and pumped to 3000 psia for storage. This section requires 19.9 MWe of power. Gas Turbine Section The gas turbine is fueled with the hydrogen rich syngas stream. To maintain approximately the same turbine power output and turbine inlet temperature as in Case 1 and Case 2, the coal flowrate (27% increase) to the gasifier and the nitrogen recycle from the ASU were adjusted. This case results in an overall decrease in process efficiency (LHV) of 6.6 percentage points when compared with Case 1 (no CO2 capture) which is attributable to the additional compression power requirements and the reduction in steam cycle output due to the steam requirements of the shift reaction section. The COE also shows a corresponding increase to 54.4 from 40.9 $/MW-hr. Flow diagrams and M&E balance summaries are provided in Appendix A and the COE estimate is provided in Appendix B.
22
I-3.3 IGCC Shell Cases
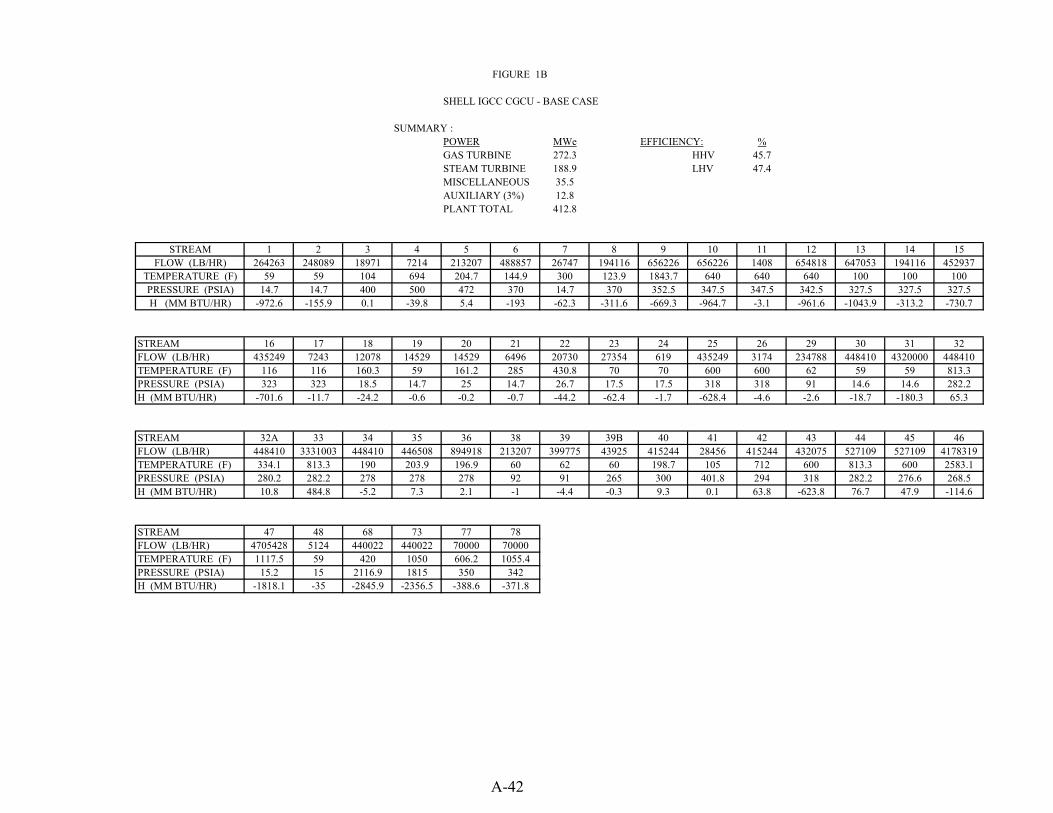
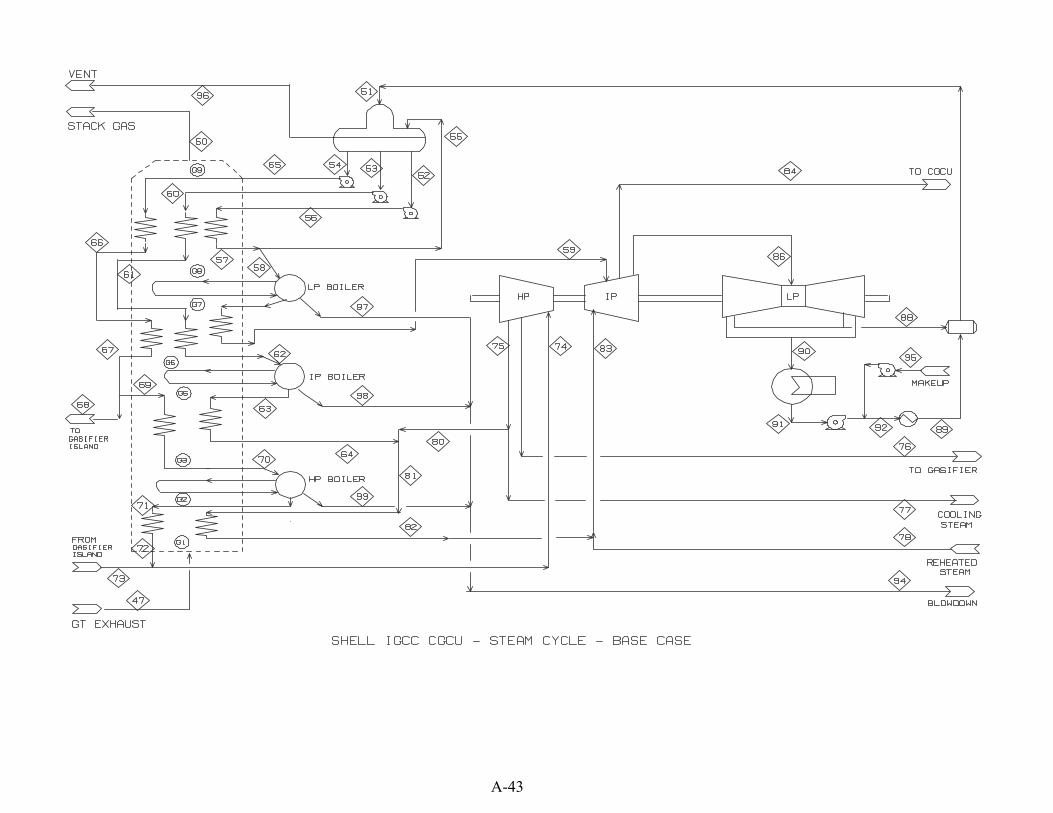
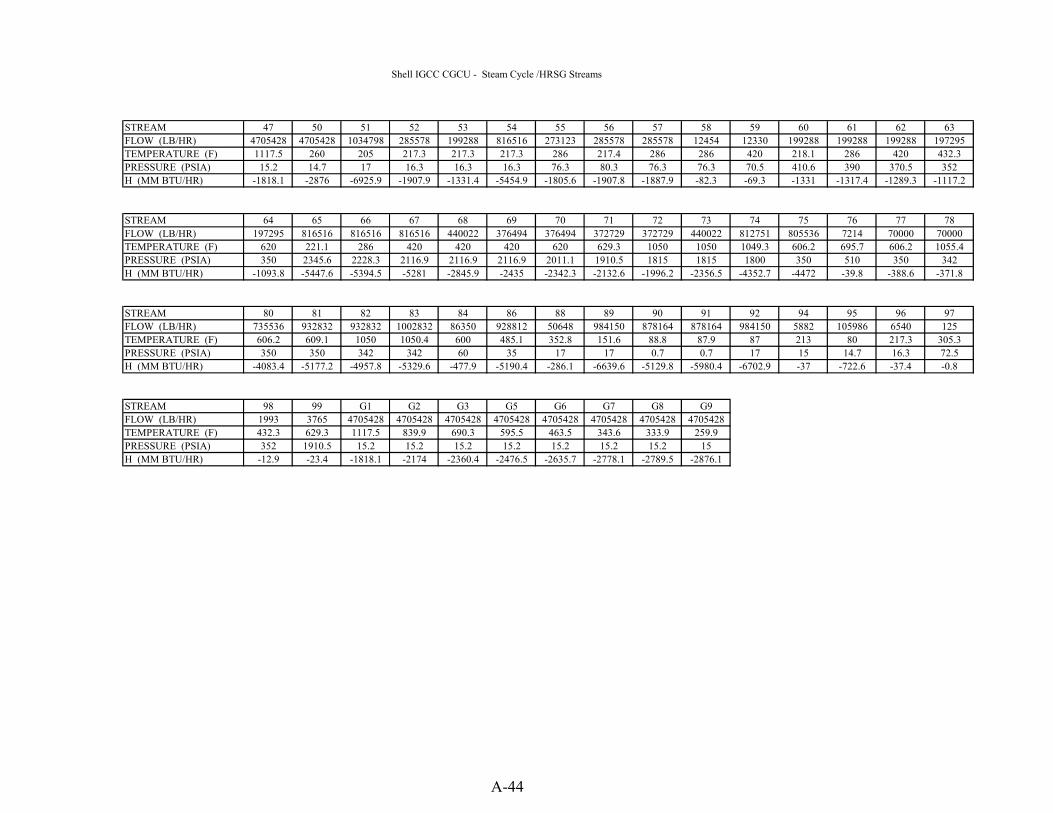
Two reference cases are included based on the Shell Gasification process. Case 4 was developed in FY2000 (EG&G) [12] and Case 5 in FY2001 (ANL, J. Molburg, R. Doctor, N. Brockmeier) [13] for the NETL/Gasification Technologies team. The documentation can be accessed via the following URLs. Case 4: http://www.netl.doe.gov/coalpower/gasification/system/shell3x_.pdf Case 5: http://www.netl.doe.gov/coalpower/gasification/pubs/pdf/igcc-co2.pdf Case 4 corresponds to an IGCC system that is analogous to Case 1 differing primarily in the use of a Shell gasifier replacing the Destec gasifier. Case 5 was developed using Case 4 as a starting point and making modifications to enable CO2 capture making this case similar to Case 3 that used the Destec gasifier. Additionally, Case 5 has the objective of producing a hydrogen product stream of high purity as either a chemical product or as fuel for an advanced power module such as a fuel cell. Case 4 (Shell IGCC) consists of the following major sections: • Coal Prep - coal grinding and fluid-bed dryer to approximately 5% moisture. • Shell Gasification - entrained flow, oxygen-blown, slagging gasifier. • Air Separation Unit (ASU) - high pressure process integrated with the gas turbine. • Cold Gas Cleanup – MDEA, Claus, SCOT – sulfur removal and recovery. • “G” gas turbine -W501G modified for coal derived fuel gas. • Three pressure level subcritical reheat Steam Cycle - (1800 psia/1050 oF/342 psia/1050 oF / 35 psia). The raw fuel gas cooler section following the gasifier (and integrated with the gasifier and other heat exchangers) is used for generating high pressure superheated steam. This section is followed by a ceramic filter that captures particulates for recycle to the gasifier. The cooled raw fuel gas leaves the filter at a temperature of 640 oF. The raw fuel gas is further cooled, enters a COS hydrolyzer, and is scrubbed (removes remaining particulates, ammonia and chlorides) before entering the CGCU section. Sulfur is recovered as elemental sulfur using the Claus process for Case 1. The cleaned fuel gas is reheated and sent to the gas turbine for power generation. The turbine exhaust enters a HRSG that generates steam at three pressure levels for use in the steam cycle. The overall process efficiency is 47.4 % (LHV). A process flow diagram for this case is shown in Figures 9. Additional flow diagrams (steam cycles) and material and energy balances summaries are provided in Appendix A and a COE summary is in Appendix B. In Table 6 (above) the overall results obtained for power generation, process efficiency, and COE are listed.
Figure 9. Case 4. IGCC SHELL / CGCU – No CO2 Capture
24
For Case 5, ANL made the following modifications to Case 4:
• Shift Reaction Section - The shift reaction is used to convert CO in the gasifier product stream to CO2 and hydrogen using two beds of sulfur-tolerant shift catalyst. The first bed was used to convert 76% of the CO and 98% of the remaining CO in the second bed. Steam requirements are higher than for Case 3 (Destec) since the gasifier in this case uses a dry coal feed as opposed to the slurry coal feed. Again part of the steam energy requirement is met by recovering heat between the catalyst bed sections and after the second bed.
• Glycol Recovery Sections for both H2 and CO2 - This is similar to the approach used in Case
3 and replaces the MDEA section used for the H2S recovery in Case 4.
• Pressure Swing Absorption Section – Since the objective was to produce a highly purified H2 stream, this process is required. In Case 3, this approach wasn’t used since the hydrogen was used in a gas turbine. The residual stream from the PSA process has sufficient heating value remaining to be used as fuel in a midsize gas turbine.
• Replacing “G” gas turbine / HRSG / Steam Cycle – The residual fuel from the PSA was
reheated and used in a gas turbine that produces 62 MWe . The HRSG/Steam Cycle from Case 4 were discarded and replaced to reflect the modified process design. The steam cycle produces 91.5 MWe.
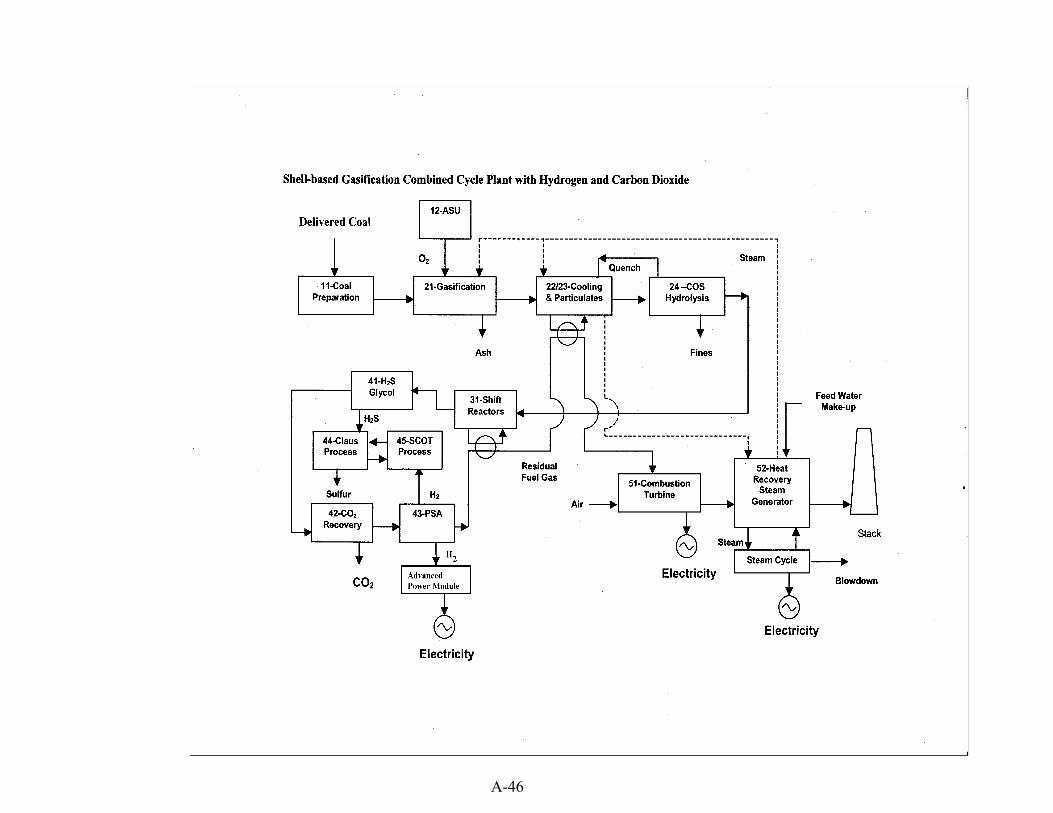
In Figure 10, (Figure 1 from the above website reference), a block diagram showing the major process sections is shown. For comparisons with other IGCC reference cases, the hydrogen produced was assumed in the present report to be converted to power based on assuming an advanced process (e.g., fuel cell) having a cost of $400/MWe. Based on ANL projections, (see Table 2 of the ANL report), conversion at an efficiency of 65% would add 275 MWe to the process for a net power production of 351.1 MWe . The calculated overall process efficiency is 40.1% and the COE is 62.9 $/MW-hr. This indicates substantial penalties in efficiency and cost to sequester the CO2.
25
Figure 10. Case 5. SHELL / CO2 Capture / Advanced Power Module
26
I-4. Summary – Reference Plants The reference plants included in the previous sections were provided to have points for comparison for the advanced fossil power systems considered in the remainder of this report. The systems were projected for a nominal plant size of 400 MWe (for cases having no carbon dioxide capture) and with a consistent cost of electricity analysis based on the EPRI TAG method (see Appendix B). Additionally, cases were included to illustrate the significant penalty that occurs with the addition of carbon dioxide sequestration that may be required for Vision 21 power plants. The PC power plant (no CO2 capture) represents a primary system presently employed for coal based power plants in this country. It is expected that these plants will be subjected to further requirements for improved emissions than the results shown in Table 2. The efficiency determined of 39% (LHV) can be improved to about 43-47 % based on using a super-critical steam cycle, higher steam temperatures and double reheat cycles. All these involve additional costs. The two remaining PC cases included CO2 capture either using flue gas cleanup or a proposed system based on using oxygen. Both cases illustrate an energy penalty of 8 – 10 percentage points and approximately double the COE results from the base system. Two NGCC systems were included based on using a gas turbine model of the Siemens- Westinghouse W501 G gas turbine. The inclusion of CO2 capture reduces the process efficiency from 58% (LHV) to 50% and increases the COE from 33.1 ($/MW-hr, constant $) to 46.4. Projections provided by both Siemens-Westinghouse and General Electric to the DOE anticipated commercial NGCC systems (no CO2 capture) with efficiency above 60% (LHV). NETL/DOE is currently sponsoring research [4] aimed at improving the flue gas CO2 capture to reduce the energy penalty. The IGCC cases included were for systems aimed at providing electrical power and not a mix of both power and chemicals. The penalty (for the cases considered) associated with CO2 capture is 6.5 – 7.3 percentage points. Since the CO2 capture involves treating the generated fuel gas rather than the flue gas of a NGCC process, the capture is easier and more feasible both form a technical and economic viewpoint. However, this is balanced by the inherent difference in the carbon/hydrogen content of coal versus natural gas. The arguments made for IGCC systems are usually made based on the potential offered for feedstock diversity (and product diversity) and the energy security based on using our (USA) most abundant resource, coal. The economic comparison with the NGCC is dependent on the price assumed for natural gas. (A value of $3.2/MM BTU was used for natural gas cases.). Using the near-term commercial systems for IGCC, the expected efficiency is significantly lower than the 60% (HHV) goal of Vision 21 plants based on coal.
27
II. ADVANCED POWER CYCLES II-1 Hydraulic Air Compression Cycle (HAC)
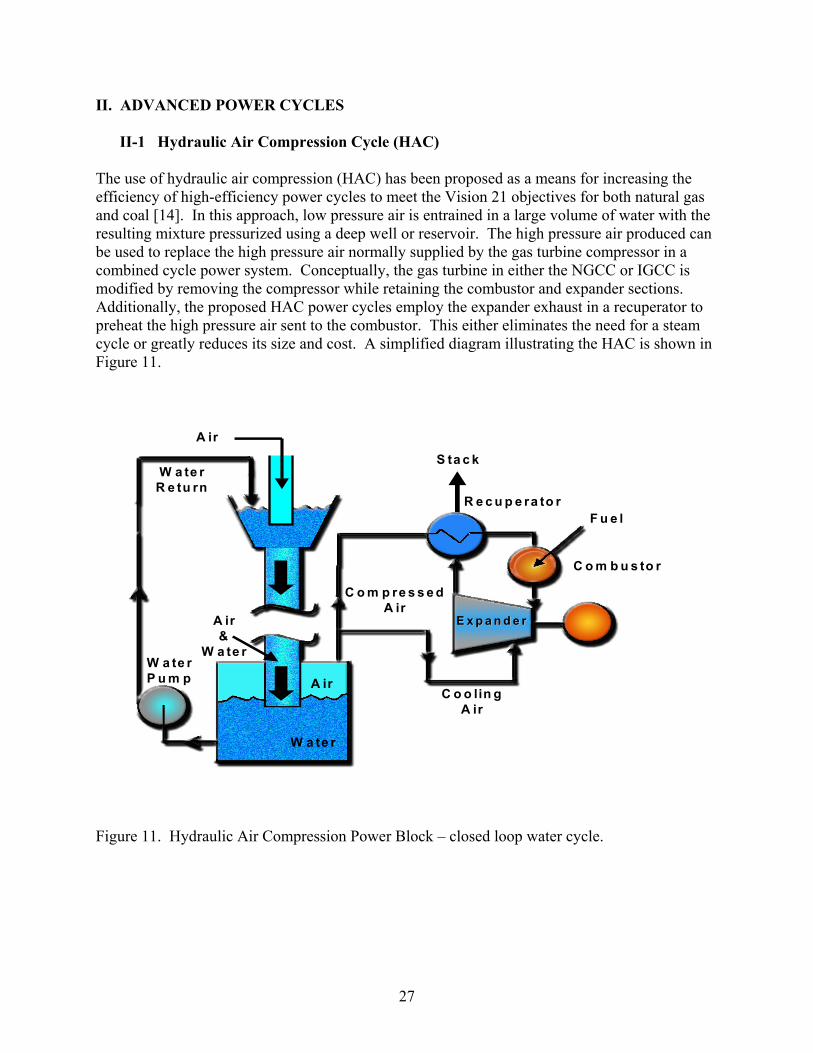
The use of hydraulic air compression (HAC) has been proposed as a means for increasing the efficiency of high-efficiency power cycles to meet the Vision 21 objectives for both natural gas and coal [14]. In this approach, low pressure air is entrained in a large volume of water with the resulting mixture pressurized using a deep well or reservoir. The high pressure air produced can be used to replace the high pressure air normally supplied by the gas turbine compressor in a combined cycle power system. Conceptually, the gas turbine in either the NGCC or IGCC is modified by removing the compressor while retaining the combustor and expander sections. Additionally, the proposed HAC power cycles employ the expander exhaust in a recuperator to preheat the high pressure air sent to the combustor. This either eliminates the need for a steam cycle or greatly reduces its size and cost. A simplified diagram illustrating the HAC is shown in Figure 11.
Figure 11. Hydraulic Air Compression Power Block – closed loop water cycle.
C o m p re s s e dA ir
F u e l
C o m b u s to r
C o o lin gA ir
R e c u p e ra to r
A ir
W a te rP u m p
W a te rR e tu rn
S ta c k
A ir
W a te r
A ir&
W a te r
E x p a n d e rE x p a n d e r
28
The following simulation cases were developed to provide high pressure air to the combustor using the Hydraulic Air Compression:
• Case 1 - Natural Gas Cycle without CO2 capture. This case modifies the NGCC reference plant case.
• Case 2 - Natural Gas Cycle with CO2 capture. This case extends Case 1 by adding an amine plant / compression sections to recovery the CO2.
• Case 3 - Coal Cycle without CO2 capture. This case modifies the Destec IGCC (CGCU) reference plant case.
• Case 4 - Coal Cycle with CO2 capture. This case modifies a Destec IGCC (High Pressure Gasifier/Gas Shift Reaction/HGCU) process plant. This is a case developed for this report.
The results obtained from these simulations are provided in Table 7.
Table 6. Hydraulic Air Compression Cycles
POWER SYSTEM HYDRAULIC AIR COMPRESSION (HAC)
Generation Cycle HAC
NATURAL GAS
HAC NATURAL GAS
(CO2 CAPTURE)
HAC Destec (E-Gas)
CGCU
HAC Destec HP (E-Gas)
HGCU (CO2 CAPTURE)
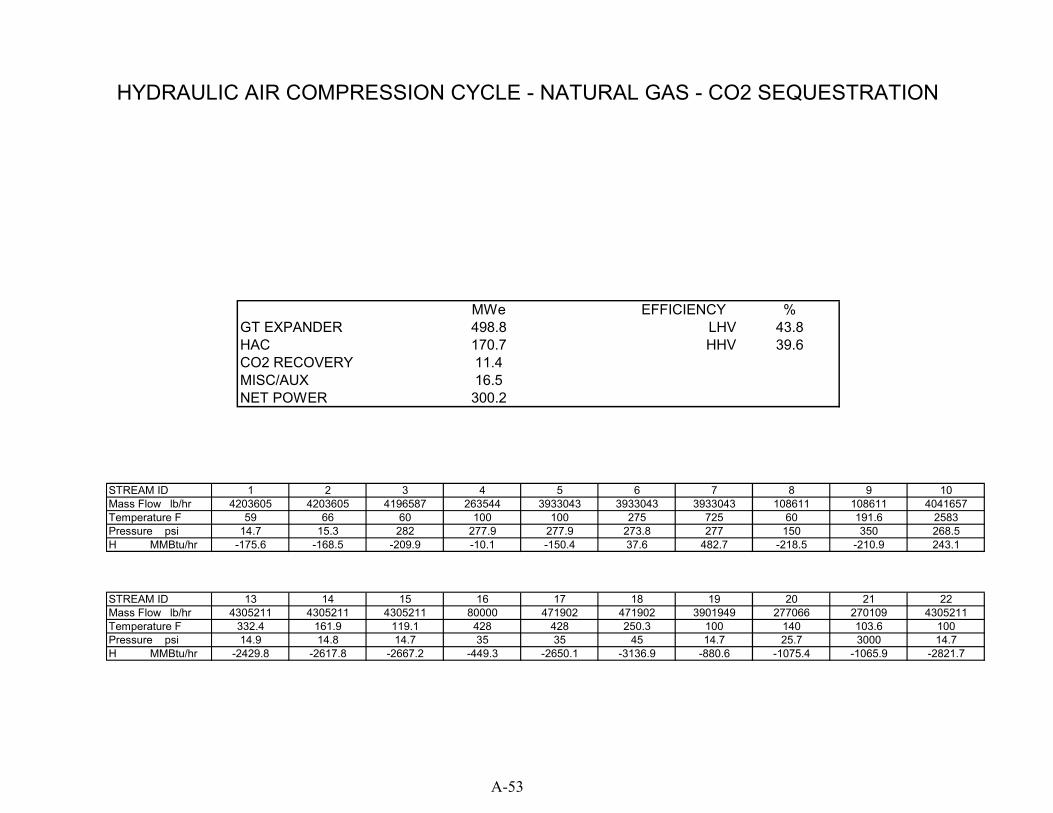
Case 1 2 3 4 Net Power MWe 323.5 300.2 325.9 312.4
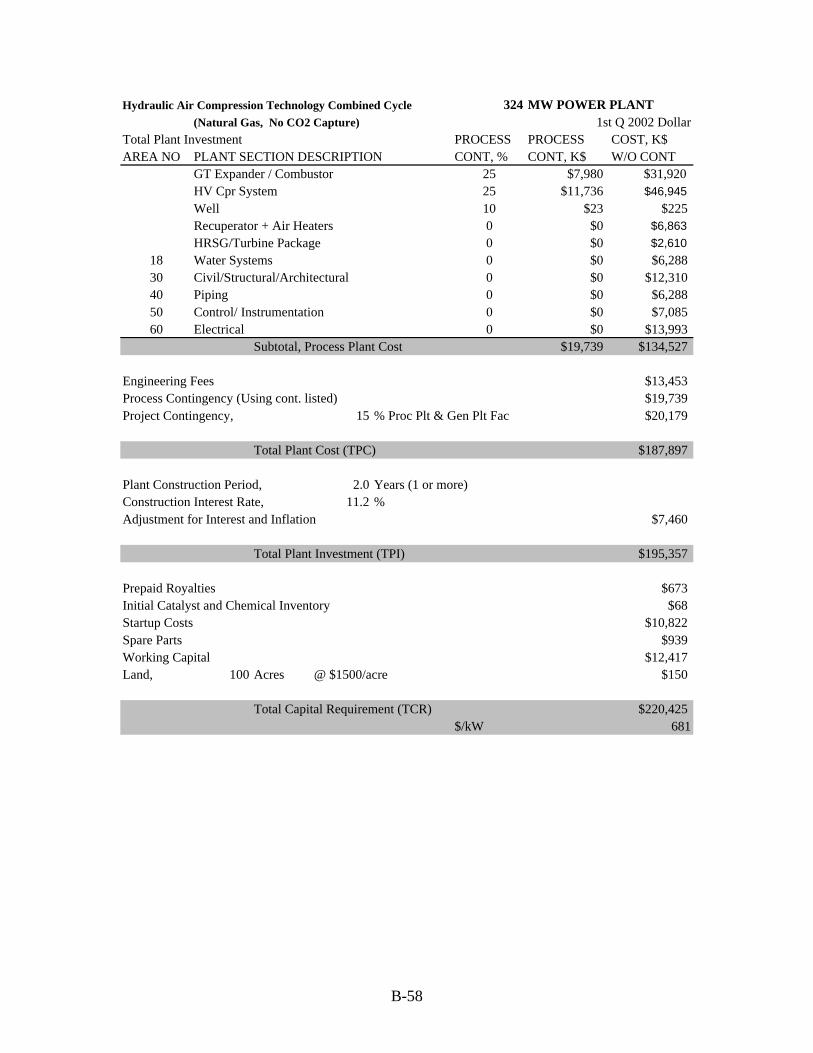
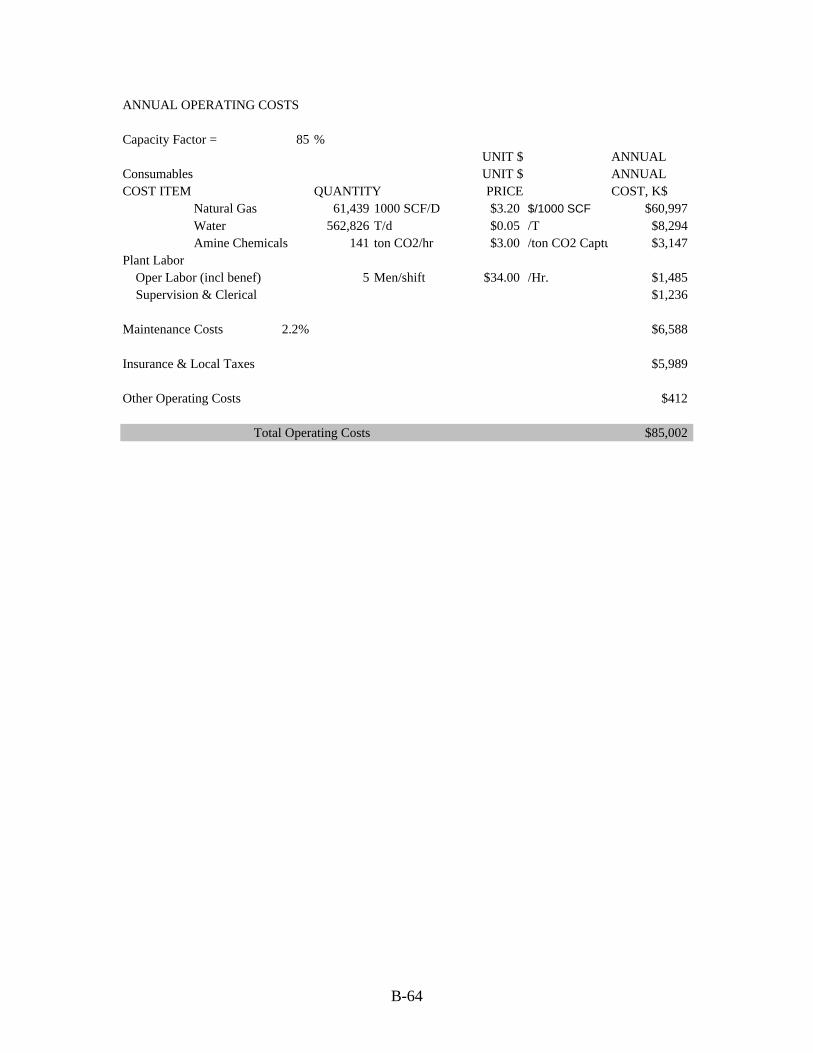
Net Plant Efficiency 53.2 43.8 43.8 35.2 % LHV Total Capital Requirement 681 1140 1436 2189 $ / KW Cost of Electricity 44.2 61.0 47.0 65.5 $ / MW-hr NOx emissions 0.194 0.210 0.193 0.204 lb/MW-hr Sox emissions --- --- 0.337 0.048 lb/MW-hr CO2 Production lb/MW-hr a) Emitted to atmosphere 824 100 1561 142 b) Sequesterable 899 1870 Footprint (battery limits) 179 230 1293 1583 sq ft/MW
29
II-1.1 Hydraulic Air Compression Cycle (HAC) – Natural Gas
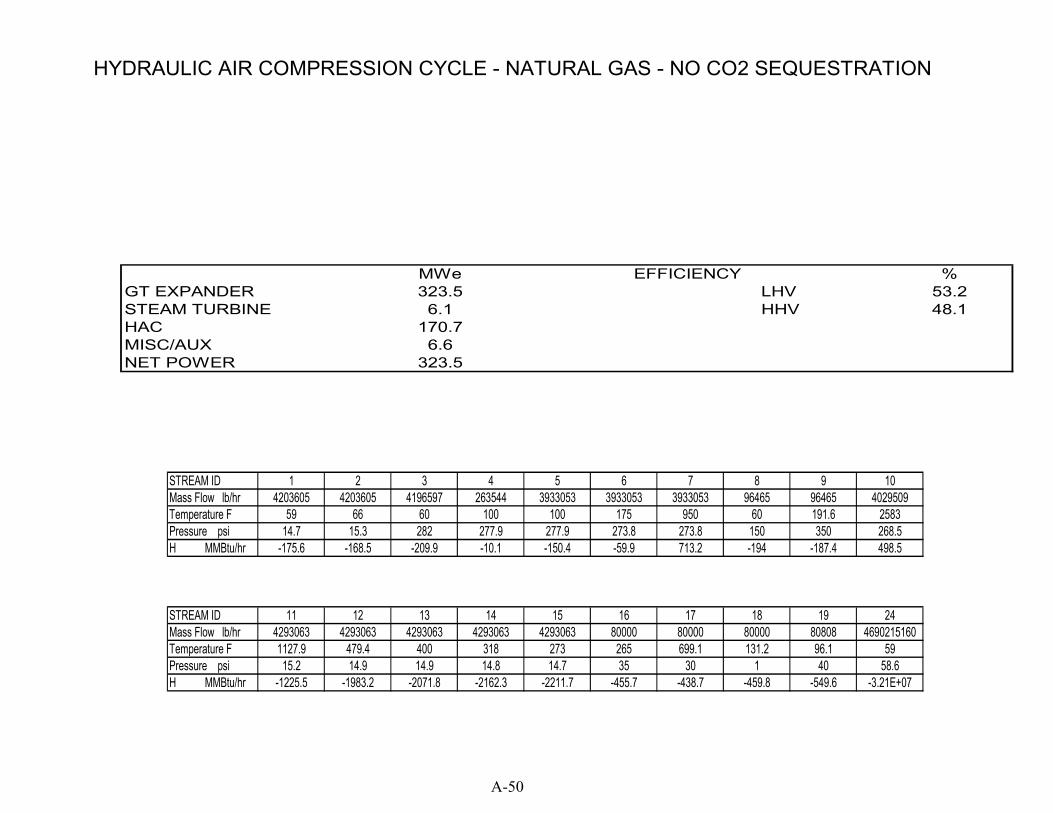
Aspen Plus® simulations were developed to estimate the approximate performance and cost estimate for cases with and without CO2 capture. These cases essentially modify the reference NGCC cases by replacing the air compressor with air obtained from the HAC approach. The combustor and turbine sections were assumed to be the same as the W501 G gas turbine. The HAC process assumed that the air normally required for the W501 G air compressor was blown into an air/water induction system. The water usage into the closed loop system was set using the estimation method provided in a NETL sponsored study [14 ]. The resulting water/air mass ratio obtained was 1115. [15]. This large water usage leads to a requirement for a number of large pumps for recirculation. The high pressure air produced and delivered to the combustor was preheated in a recuperator using the exhaust stream from the gas turbine expander. For the case without CO2 capture, the air is preheated to 950 oF and the cooled exhaust stream enters a small heat recovery section to generate low pressure (35 psia) steam used for combustor duct cooling. After being heated in the combustor duct, the steam is sent to a small steam turbine. For the case with CO2 capture, the air was only preheated to 725 oF and a larger HRSG used since a large amount of steam is required for the stripper reboiler in the amine based CO2 recovery process (see Figure 6 – amine plant). Emissions of CO2 were based on simulation results and NOx was estimated as 9 ppmv as projected for “G” turbine combustor performance. The cost estimates were based on modifying the NGCC reference plant cases. Reductions were subtracted from the total capital for the elimination of the air compressor, HRSG and steam turbines. Additions for the following: hydraulic air compression blowers and pumps (40 MWe), recuperators (large area heat exchangers), reservoir well (650 ft depth, 20 ft diameter), and for miscellaneous HAC equipment ($50 / KW). The footprint estimates were assumed to be equal approximately to those of the NGCC reference plants with an additional 1 acre for the HAC related equipment. Again the total plant sites were assumed to cover 100 acres. The overall process efficiencies (LHV) obtained were 53.2 % (no CO2 recovery) and 43.8 % (with CO2 recovery). The total capital requirements and COE estimates made with conservative assumptions are provided in Table 7. The results for both efficiency and COE are higher than comparable reference cases given in Table 1. The lower efficiency is related to the large power requirements of the recirculation water pumps and the requirement to add a recuperator to preheat the high pressure air. The inclusion of the recuperator using the turbine exhaust essentially eliminated the power produced by the steam turbines in the reference cases. These closed loop HAC systems will be unable to obtain the goals of the Vision 21 power plants. The two cases are shown in Figure 12 and Figure 13. Appendix A contains material and energy flow rate summaries and Appendix B includes the COE spreadsheet summaries.
30
Figure 12. Case 1 - Natural Gas HAC – without CO2 Capture
CASE 1
HYDRAULIC AIR COMPRESSION CYCLE - NATURAL GAS - NO CO2 SEQUESTRATION
31
Figure 13. Case 2 – Natural Gas HAC – with CO2 Capture
CASE 2
HYDRAULIC AIR COMPRESSION CYCLE - NATURAL GAS - CO2 SEQUESTRATION
32
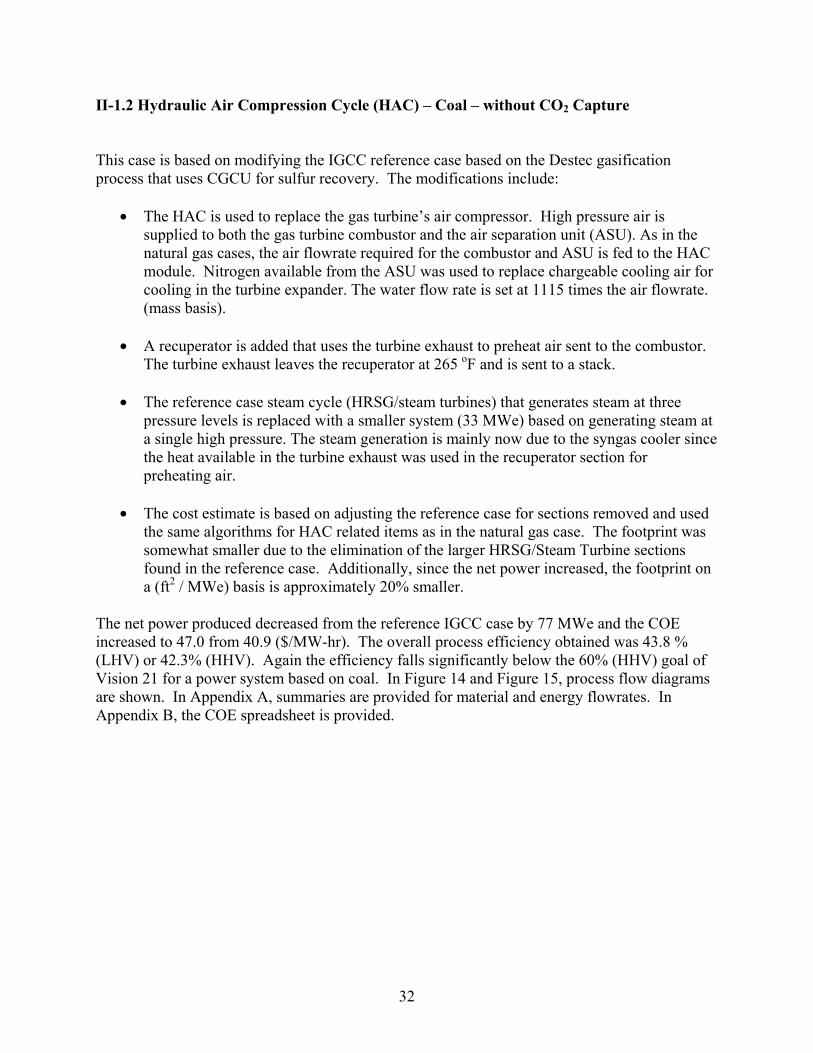
II-1.2 Hydraulic Air Compression Cycle (HAC) – Coal – without CO2 Capture This case is based on modifying the IGCC reference case based on the Destec gasification process that uses CGCU for sulfur recovery. The modifications include:
• The HAC is used to replace the gas turbine’s air compressor. High pressure air is supplied to both the gas turbine combustor and the air separation unit (ASU). As in the natural gas cases, the air flowrate required for the combustor and ASU is fed to the HAC module. Nitrogen available from the ASU was used to replace chargeable cooling air for cooling in the turbine expander. The water flow rate is set at 1115 times the air flowrate. (mass basis).
• A recuperator is added that uses the turbine exhaust to preheat air sent to the combustor.
The turbine exhaust leaves the recuperator at 265 oF and is sent to a stack.
• The reference case steam cycle (HRSG/steam turbines) that generates steam at three pressure levels is replaced with a smaller system (33 MWe) based on generating steam at a single high pressure. The steam generation is mainly now due to the syngas cooler since the heat available in the turbine exhaust was used in the recuperator section for preheating air.
• The cost estimate is based on adjusting the reference case for sections removed and used
the same algorithms for HAC related items as in the natural gas case. The footprint was somewhat smaller due to the elimination of the larger HRSG/Steam Turbine sections found in the reference case. Additionally, since the net power increased, the footprint on a (ft2 / MWe) basis is approximately 20% smaller.
The net power produced decreased from the reference IGCC case by 77 MWe and the COE increased to 47.0 from 40.9 ($/MW-hr). The overall process efficiency obtained was 43.8 % (LHV) or 42.3% (HHV). Again the efficiency falls significantly below the 60% (HHV) goal of Vision 21 for a power system based on coal. In Figure 14 and Figure 15, process flow diagrams are shown. In Appendix A, summaries are provided for material and energy flowrates. In Appendix B, the COE spreadsheet is provided.
33
Case 3 HYDRAULIC AIR COMPRESSION CYCLE - COAL SYNGAS - NO CO2 SEQUESTRATION Figure 14. Case 3 - Coal Syngas HAC – without CO2 Capture
N2 CPR3A
CASE 3 : HYDRAULIC AIR COMPRESSION CYCLE - COAL SYNGAS - NO CO2 SEQUESTRATION
34
Case 3
HYDRAULIC AIR COMPRESSION CYCLE - COAL SYNGAS - NO CO2 SEQUESTRATION STEAM CYCLE Figure 15. Case 3 - Steam Cycle
35
II-1. 3 Hydraulic Air Compression Cycle (HAC) – Coal – with CO2 Capture The reference Destec IGCC cases showed an advantaged of 2.7 percentage points in overall process efficiency when using HGCU in place of CGCU for sulfur removal and lower SOx emission levels. (see Table 6). This was the primary reason for using the Destec IGCC reference case based on HGCU as the starting point for developing the present HAC case since a significant energy penalty is expected for sequestrating the CO2. An additional reason was that having a cleaned coal syngas at high temperature would allow the use of a Hydrogen Separation Device (HSD) currently being developed with DOE funding at ORNL [16]. The HSD is a membrane catalytic reactor being designed to both shift the coal syngas and separate out a high purity hydrogen stream. The modifications made to the reference case include the following:
• Gasifier pressure was increased to enable the downstream HSD device to have an inlet pressure of approximately 1000 psia. This also increases the power requirements for the oxygen boost compressor that supplies the gasifier. The cost analysis considers that two gasifier trains will be required based on information provided by Destec (now Global) to the DOE in previous contractor studies [17].
• A model for the HSD was added following the HGCU section. Steam at 1000 psia was
added for accomplishing the shifting of the coal syngas stream. The HSD produces two streams, a high pressure CO2 rich-stream and a low pressure high purity H2 rich-stream.
• The CO2-rich stream (with residual fuel gas) is sent to a power turbine and proceeds to
an oxygen fired combustor to burn any residual fuel before entering a HRSG for steam generation. This stream is further cooled before entering a multi-stage compression section that raises the pressure to 2100 psia. Subsequent cooling to 100 oF produces a liquefied product stream.
• The hydrogen-rich stream is sent to a separate HRSG for steam generation before
entering a compression section. The hydrogen is now available for use as a fuel in the HAC module.
• The HAC module is based on Case 3 (see above).
• The steam cycle developed recovers energy from the gasifier syngas cooler, the acid
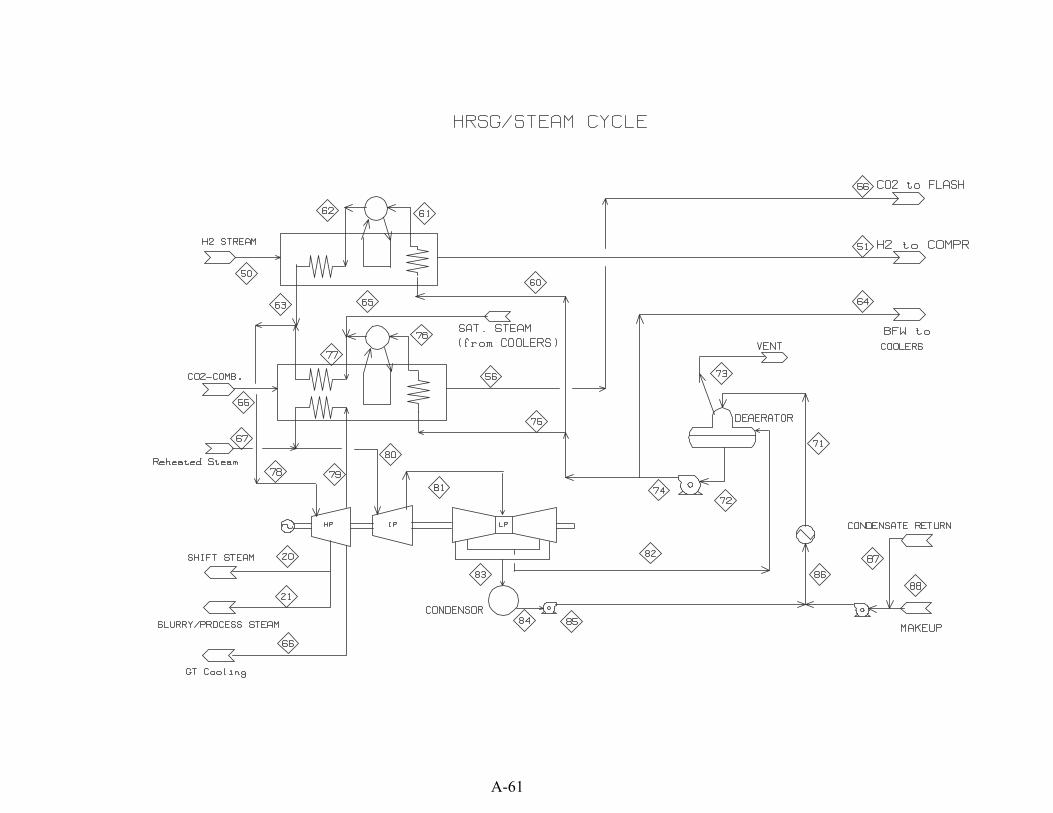
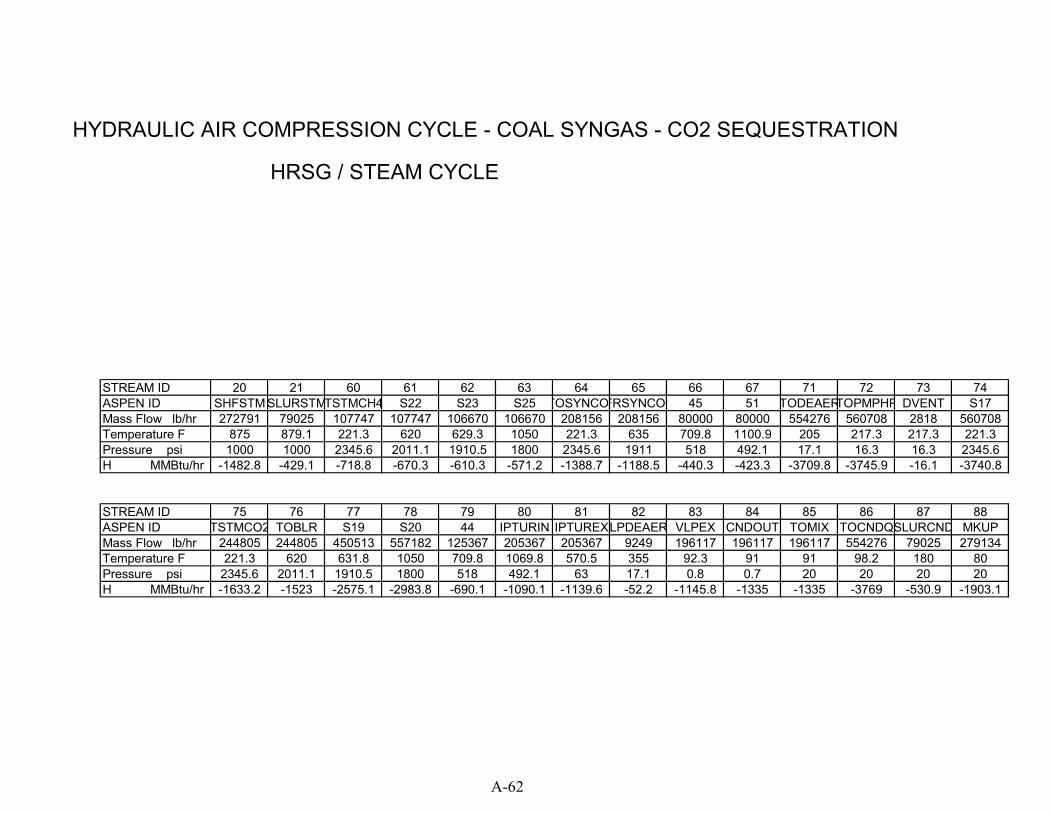
plant section, and the two HRSG sections that follow the HSD device. The inclusion of the HAC system again results in a power plant having a significant loss in net power due. This case produced 312 MWe at an overall efficiency of 35.2 % (LHV). Compared to Case 3, the CO2 recovery resulted in an energy penalty of 8.6 percentage points and an increase in the COE estimate to 65.5 from 47.0 ($/MW-hr). Process flow diagrams are shown in Figure 16 and Figure 17. Appendix A lists summaries for the material and energy flowrates and Appendix B lists the COE spreadsheet results.
36
Case 4
HYDRAULIC AIR COMPRESSION CYCLE - COAL SYNGAS - CO2 SEQUESTRATION Figure 16. Case 4 - Coal Syngas HAC – with CO2 Capture
37
Case 4
HYDRAULIC AIR COMPRESSION CYCLE - COAL SYNGAS - CO2 SEQUESTRATION Figure 17. Case 4 - Steam Cycle
38
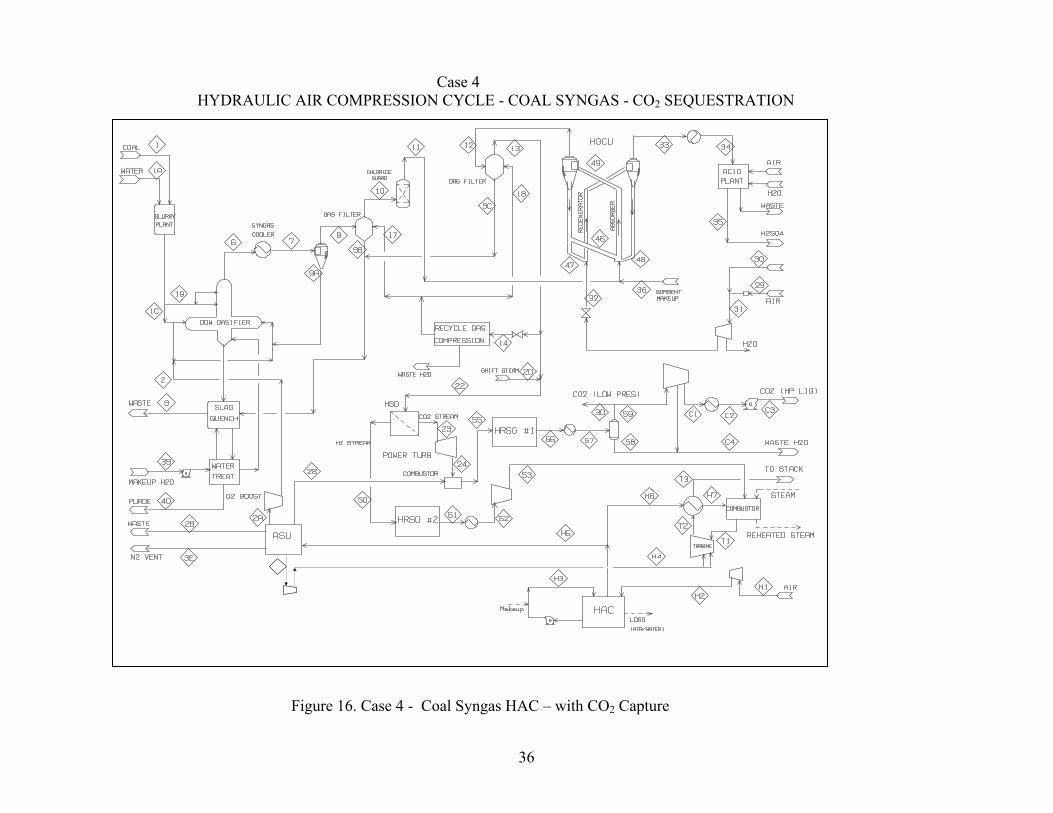
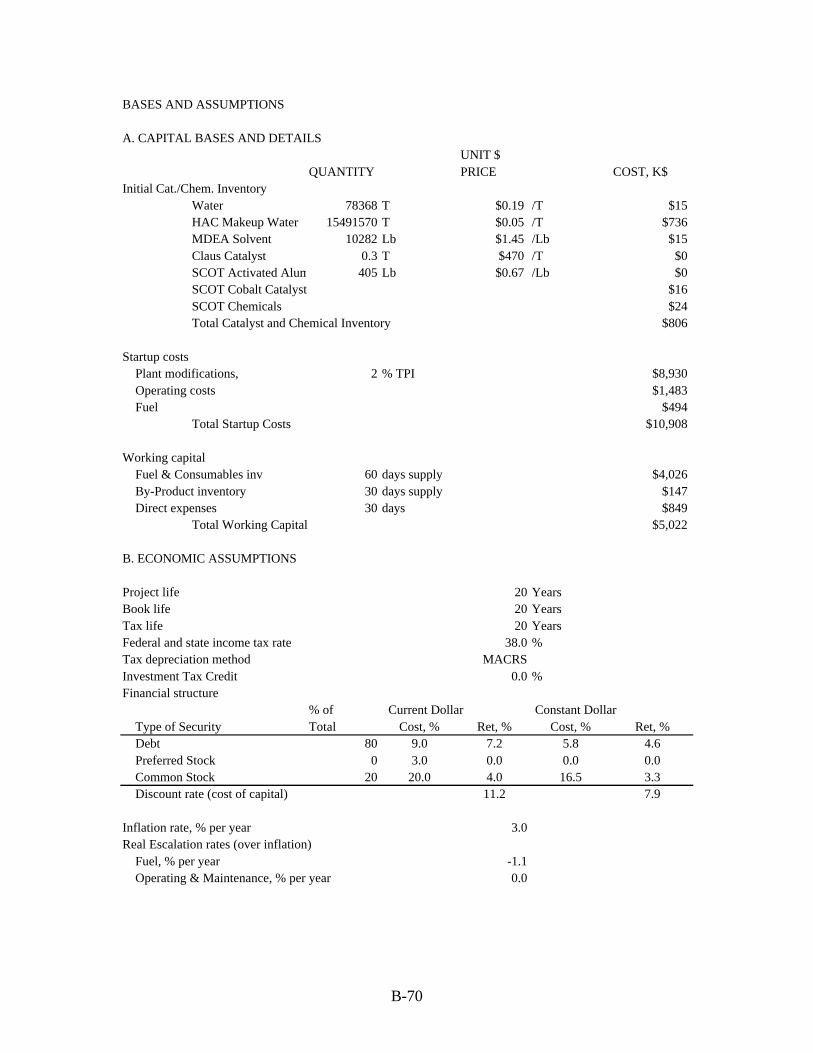
II-1.4 Hydraulic Air Compression Cycle (HAC) – Summary In Table 8, the simulation cases are summarized with the performance and the power listed for major process areas. The overall process efficiencies obtained for all cases do not approach the goals of the Vision 21 program and are lower when compared with reference cases. The use of the HAC module requires from 170 – 202 MW due primarily for water pumps and varies with the case’s air requirement. The air required for the coal cases is higher since the HAC supplies both the gas turbine combustor and the ASU. The HAC power requirements are somewhat less than the original air compressor (> 240 MW) that has been assumed to be removed from the gas turbine. For all cases a recuperator preheats the high pressure air with the turbine exhaust as part of the HAC module resulting in the loss or major reduction of the power generated from steam turbines normally found in the NGCC or IGCC power plants. This offsets the power gained by removing the air compressor. The results in Table 8 indicate net power losses of approximately 30 – 90 MWe when compared with corresponding reference plants. Inclusion of CO2 capture lowers the efficiency significantly by 9.4 percentage points for natural gas and by 8.7 percentage points for coal. The large penalty for the natural gas case is directly related to the poor performance inherit in removing CO2 from the flue gas stream. The compression power (compression to 2100 psia) and the amine power (inlet flue gas blower, included in MISC/AUX in Table 8) requirements significantly reduce the net power generated. Removing CO2 in the coal case was based on treating the coal syngas by a membrane reactor system (an advanced technology presently in the research stage of development) that produces a H2 rich fuel stream and a CO2 rich stream. This case required an increase in coal flowrate compared to the case without CO2 capture to obtain sufficient fuel to obtain the same turbine expansion power. Additionally, more CO2 is produced using the coal fueled process compared to the natural gas fueled process. This is reflected in power requirements for the CO2 compression section and the MISC/AUX section shown in Table 7. The cost analysis included process contingencies of 25% for the HAC section and 50% for the HSD section to reflect that these two areas represent technology that is in a development stage and not commercially available. Additionally, a 25% contingency was used in estimating the costs for the modified turbine expander/combustor required for these cases. The water pumps costs are also very significant and were based on using the ICARUS cost estimating package and on information obtained from a vendor [18 ]. The COE spreadsheets are provided in Appendix B.
39
Table 7. Summary of HAC Cases - with/without CO2 Sequestration
CASE 1 2 3 4
FUEL CH4 CH4 COAL COAL
CO2 CAPTURE NO YES NO YES
HHV % 48.1 39.6 42.3 33.9
LHV % 53.2 43.8 43.8 35.2
NET POWER MWe 323.5 300.2 325.9 312.4
work/power MWe:
Gas Turbine Exp 494.8 498.8 499.1 501.7
CO2 Expander - - - 58.5
Steam Turbines 6.1 - 30.9 47.6
HAC 170.7 170.7 184.1 204.1
CO2 Separation - 11.4 - 28.2
H2 Compression - - - 26.1
MISC / AUX 6.6 16.5 20 36.9
40
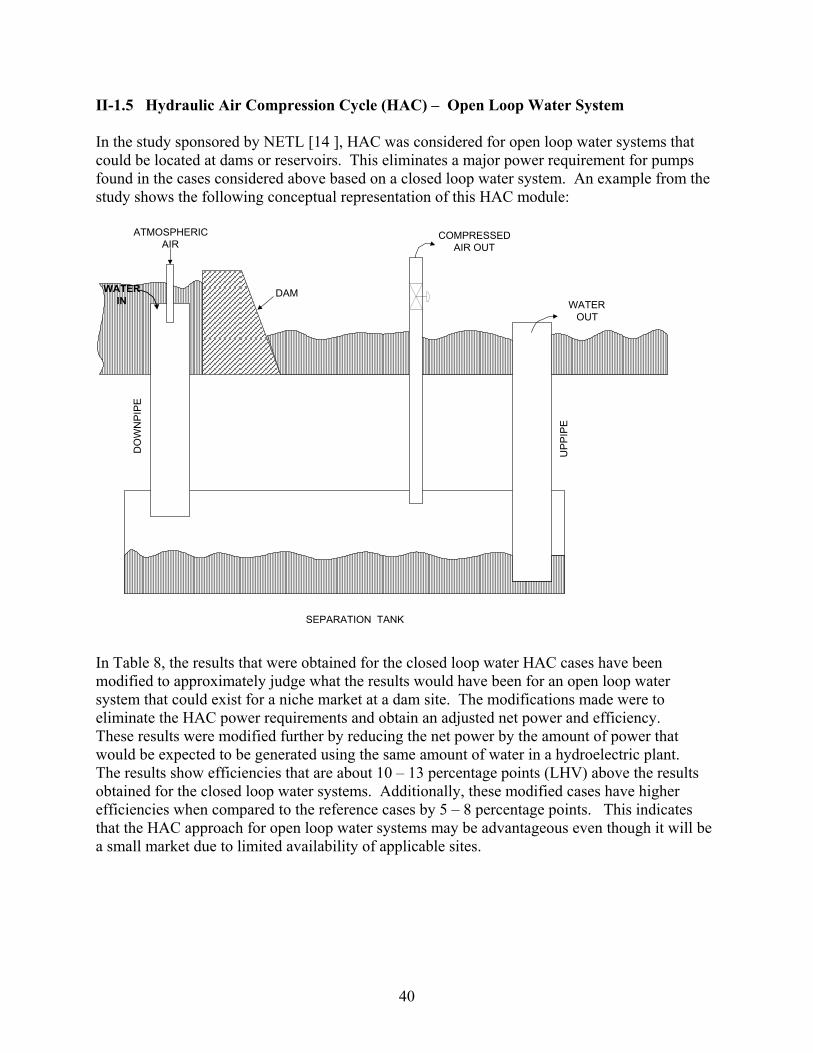
II-1.5 Hydraulic Air Compression Cycle (HAC) – Open Loop Water System In the study sponsored by NETL [14 ], HAC was considered for open loop water systems that could be located at dams or reservoirs. This eliminates a major power requirement for pumps found in the cases considered above based on a closed loop water system. An example from the study shows the following conceptual representation of this HAC module:
DAM
ATMOSPHERICAIR
WATERIN
COMPRESSEDAIR OUT
WATEROUT
SEPARATION TANK
DO
WN
PIPE
UPP
IPE
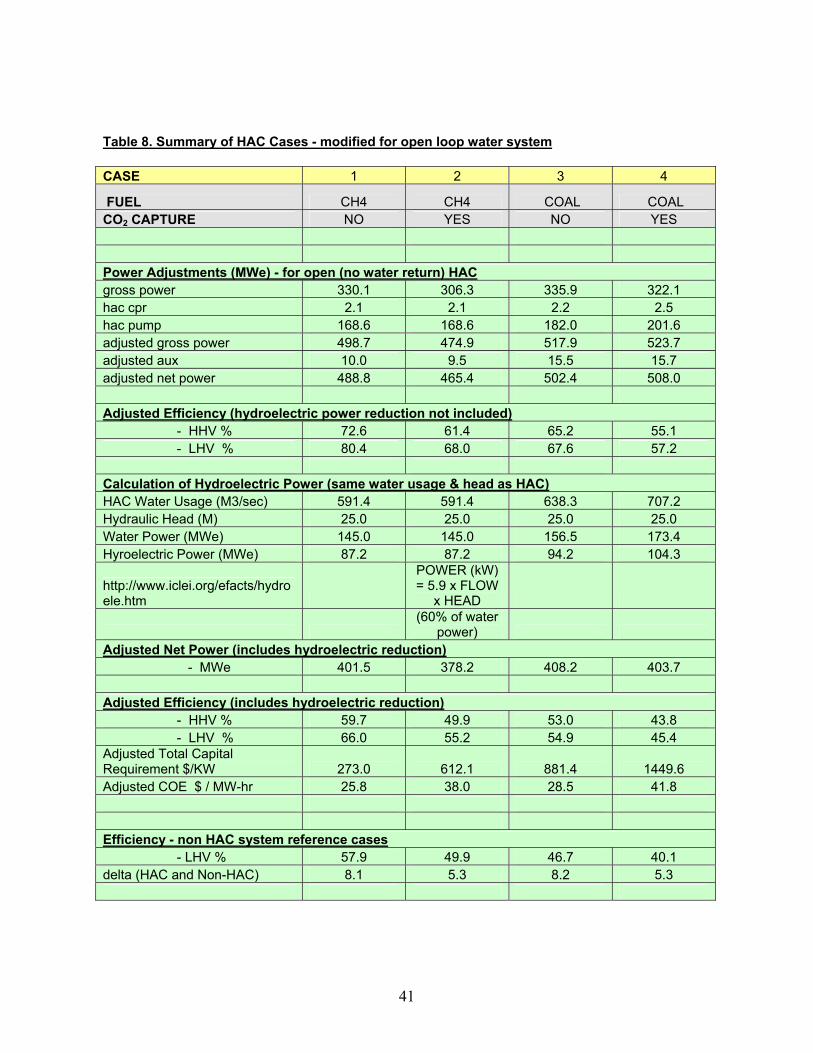
In Table 8, the results that were obtained for the closed loop water HAC cases have been modified to approximately judge what the results would have been for an open loop water system that could exist for a niche market at a dam site. The modifications made were to eliminate the HAC power requirements and obtain an adjusted net power and efficiency. These results were modified further by reducing the net power by the amount of power that would be expected to be generated using the same amount of water in a hydroelectric plant. The results show efficiencies that are about 10 – 13 percentage points (LHV) above the results obtained for the closed loop water systems. Additionally, these modified cases have higher efficiencies when compared to the reference cases by 5 – 8 percentage points. This indicates that the HAC approach for open loop water systems may be advantageous even though it will be a small market due to limited availability of applicable sites.
41
Table 8. Summary of HAC Cases - modified for open loop water system CASE 1 2 3 4
FUEL CH4 CH4 COAL COAL CO2 CAPTURE NO YES NO YES Power Adjustments (MWe) - for open (no water return) HAC gross power 330.1 306.3 335.9 322.1 hac cpr 2.1 2.1 2.2 2.5 hac pump 168.6 168.6 182.0 201.6 adjusted gross power 498.7 474.9 517.9 523.7 adjusted aux 10.0 9.5 15.5 15.7 adjusted net power 488.8 465.4 502.4 508.0 Adjusted Efficiency (hydroelectric power reduction not included) - HHV % 72.6 61.4 65.2 55.1 - LHV % 80.4 68.0 67.6 57.2 Calculation of Hydroelectric Power (same water usage & head as HAC) HAC Water Usage (M3/sec) 591.4 591.4 638.3 707.2 Hydraulic Head (M) 25.0 25.0 25.0 25.0 Water Power (MWe) 145.0 145.0 156.5 173.4 Hyroelectric Power (MWe) 87.2 87.2 94.2 104.3
http://www.iclei.org/efacts/hydroele.htm
POWER (kW) = 5.9 x FLOW
x HEAD
(60% of water
power) Adjusted Net Power (includes hydroelectric reduction) - MWe 401.5 378.2 408.2 403.7 Adjusted Efficiency (includes hydroelectric reduction) - HHV % 59.7 49.9 53.0 43.8 - LHV % 66.0 55.2 54.9 45.4 Adjusted Total Capital Requirement $/KW 273.0 612.1 881.4 1449.6 Adjusted COE $ / MW-hr 25.8 38.0 28.5 41.8 Efficiency - non HAC system reference cases - LHV % 57.9 49.9 46.7 40.1 delta (HAC and Non-HAC) 8.1 5.3 8.2 5.3
42
II-2. CLEAN ENERGY SYSTEMS (CES) – ROCKET ENGINE STEAM CYCLE
Clean Energy Systems (CES) [19] has proposed an electric power generation system based on using fossil fuels such as natural gas, coal syngas (cleaned of sulfur), and coal-bed methane. The system, termed Zero Emission Steam Technology (ZEST) uses a combustion process that burns nearly pure oxygen with a hydrocarbon fuel under stoichiometric conditions. This essentially eliminates the formation of oxides of nitrogen and produces a product that contains primarily carbon dioxide and steam. In the CES process, Figure 18, a gas generator injected with a recycled high pressure water/steam mixture is fired with a fossil fuel using high pressure oxygen. The exhaust powers a high pressure/high temperature turbine (HPT). The HPT exit stream is used for water/steam heating and sent to a combustor reheater to increase the temperature to levels expected for advanced combustion turbines (i.e. >2500 oF). The remaining turbine sections may have intermediate feed water heaters before the exhaust stream (approximately 90% H2O, 10% CO2) enters a partial condenser and then a condenser / CO2 recovery section.
Figure 18. CES Process (provided by CES – version NNN21).
43
Current overall efficiency projections (LHV basis) provided by CES to NETL [20] for natural gas systems ranged from 44 % - 62 % and recently published results for coal systems [21] ranged from 32% to 44%. The higher values assume turbine technology developments that allow for inlet temperatures of 3200 oF, low last turbine stage exhausts (0.65 psia) and the use of oxygen generation using membranes. Aspen Plus® simulations were developed based on flow diagrams provided by CES (Larry Hoffman, CES) for both a natural gas system and a coal system. Emissions for NOx were considered negligible since high purity oxygen (99.5%) was used in the simulations. CO2 was estimated from the ASPEN simulations and considered sequestered as a liquid using a CO2 compression scheme. The COE estimates were developed using information provided by CES in reports and communications to NETL. [22]. Footprint (battery limits) were developed for the natural gas case based on the ASU plant being the major equipment section. The coal case used this approach and the footprint determined for a Destec IGCC plant. In Table 9, results obtained are listed: Table 9. CES – Rocket Engine Systems
POWER SYSTEM
Generation Cycle
CES Natural Gas
(gas generator) (CO2 CAPTURE)
CES / COAL (gas generator)
Destec HP (E-Gas) HGCU
(CO2 CAPTURE)
Net Pow er MWe 398.4 406.2
Net Plant Ef f iciency 48.27 41.4 % LHV
Total Capital Requirement 975 1768$ / KW
Cost of Electricity 49.2 49.3Constant $ / MW-hr
NOx emissions NEG NEGlb/MW-hr
Sox emissions --- 0.044lb/MW-hr
CO2 Productionlb/MW-hr a) Emitted to atmosphere --- --- b) Sequesterable 901 1702
Footprint (battery limits) 825 1458sq f t/MW
ROCKET ENGINE (CES)
44
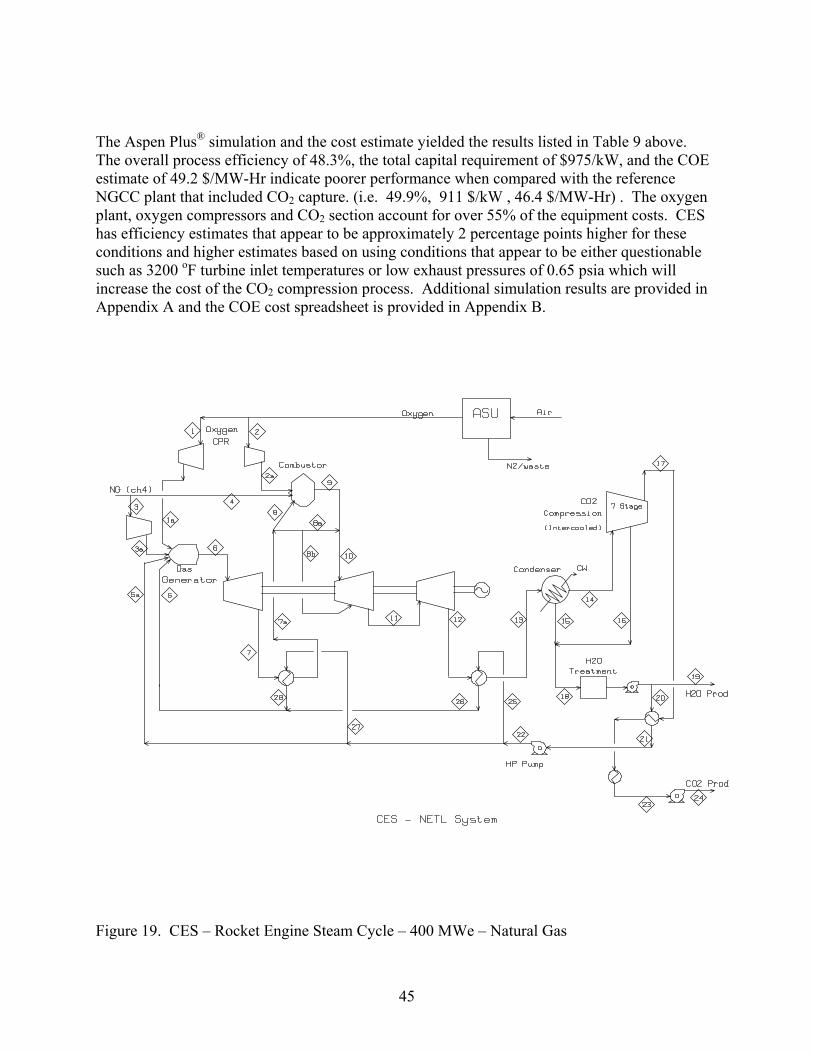
II-2.1 Clean Energy Systems (CES) - Natural Gas System An Aspen Plus® simulation was developed for the natural gas fueled CES proposed process as shown in Figure 19. The key process sections are:
• Cryogenic ASU – to reduce the amount of nitrogen in the turbine exhaust stream that enters the downstream condenser section, a high purity low pressure oxygen plant that is commercially available and produces a high purity oxygen (99.5%, volume) product is used. The power requirements were estimated as 359.4 kW / (lb/sec O2).
• Oxygen / Fuel Compressors – Two multistage intercooled oxygen compressors were
used, a six stage unit supplies oxygen at 2500 psia to the gas generator and a three stage unit supplies oxygen at 420 psia to the reheat combustor. A two stage compressor is used for the fuel stream supplied to the gas generator.
• Gas Generator – this section was represented using an ASPEN reactor model. The
input streams consisted of natural gas (represented as methane), high pressure steam and high pressure water. The cost estimate was made using information furnished in CES reports with a process contingency of 25% used.
• High Pressure Turbine / Steam generator – Power was generated using a HPT with
the exhaust used to generate steam before being sent to the reheat combustor.
• Reheater – oxygen combustor that reheats the process stream using additional methane fuel to raise the temperature to 2600 oF before entering a final series of turbine expanders. Again the cost estimate was based on CES information.
• Intermediate/Low Pressure Turbines – The gas stream has a composition of about
90% steam, 10 % CO2 with small amounts of nitrogen/argon impurities. Thermodynamic properties used were based on an equation of state for highly non-ideal system (Schwartzentruber-Renon) to accurately represent this stream. Costs for all turbines (HPT,IPT,LPT) were based on using the ICARUS costing software. A 25% process contingency was used.
• Heat Recovery / Condenser – the process stream at 2.1 psia enters a heat exchanger
used to generate steam before entering the condenser. Depending on the temperature of available cooling water, different amounts of water can be condensed out. Based on cooling the process stream to 100 oF, approximately 88% of the water is condensed out for recycling.
• CO2 Compression Process - An intercooled seven stage compression process was
used to eliminate any remaining water and to produce a CO2 product stream at 2100 psia which was cooled to 100 oF and then pumped to 3000 psia for storage. An ICARUS estimate for this section results in a cost of 31500 K$ or approximately $1000/kW. (based on the compressor power). The first stage compressor because of the low inlet pressure (1.9 psia) is beyond most available single train equipment and will require several trains of equipment.
45
The Aspen Plus® simulation and the cost estimate yielded the results listed in Table 9 above. The overall process efficiency of 48.3%, the total capital requirement of $975/kW, and the COE estimate of 49.2 $/MW-Hr indicate poorer performance when compared with the reference NGCC plant that included CO2 capture. (i.e. 49.9%, 911 $/kW , 46.4 $/MW-Hr) . The oxygen plant, oxygen compressors and CO2 section account for over 55% of the equipment costs. CES has efficiency estimates that appear to be approximately 2 percentage points higher for these conditions and higher estimates based on using conditions that appear to be either questionable such as 3200 oF turbine inlet temperatures or low exhaust pressures of 0.65 psia which will increase the cost of the CO2 compression process. Additional simulation results are provided in Appendix A and the COE cost spreadsheet is provided in Appendix B. Figure 19. CES – Rocket Engine Steam Cycle – 400 MWe – Natural Gas
46
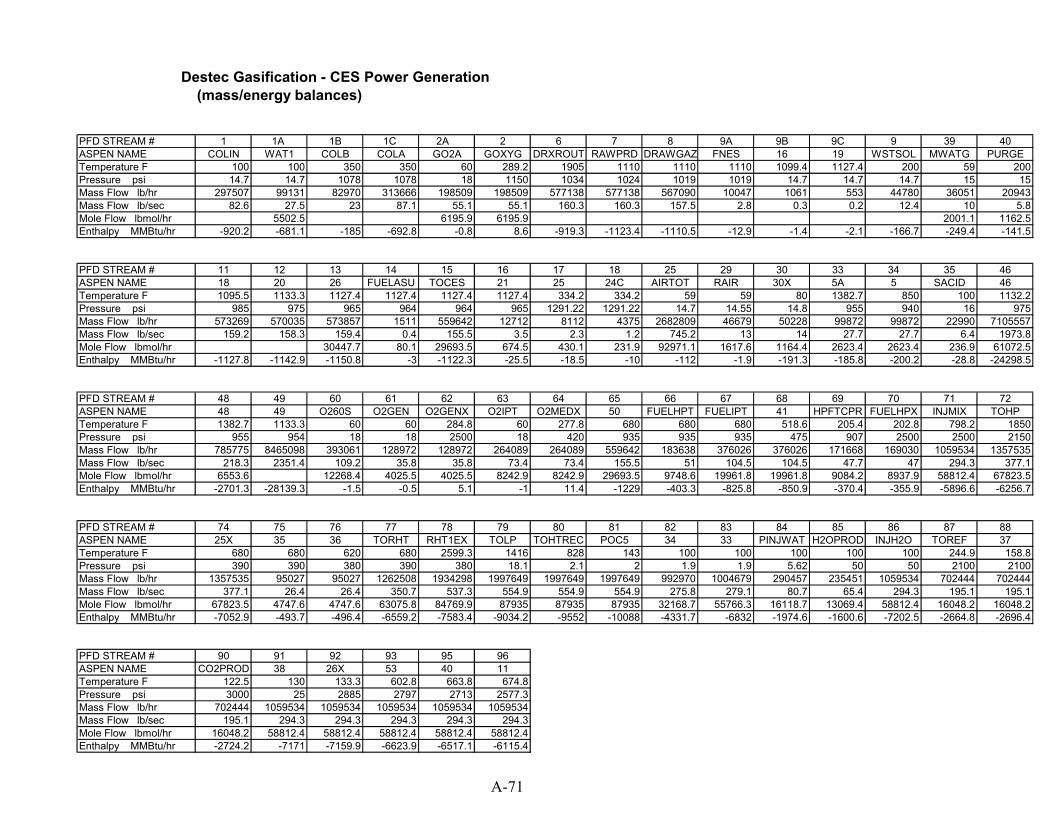
II-2.2 Clean Energy Systems (CES) - Coal Syngas System An Aspen Plus® simulation, Figure 20, was developed to evaluate the performance and cost of the proposed CES process when fueled with a coal syngas. The representation for the natural gas system was combined with sections of a Destec IGCC process based on HGCU. The major sections included were:
• Cryogenic ASU – the same high oxygen purity system was used and the capacity adjusted to provide oxygen for the gasification area.
• Destec Gasification / Syngas Cooler – the gasifier was operated at approximately 1000
psia. The higher pressure gasifier was used to provide the highest pressure deemed feasible for the fuel stream being generated for the CES gas generator. The syngas cooler was integrated into the CES section to serve as a steam superheater. The coal flowrate used was adjusted to obtain a net power output of approximately 400 MWe.
• Coal Syngas Cleanup – the gasifier/syngas cooler as in the reference IGCC case was
followed with cyclones for particulate removal and a chloride guard bed . The transport desulfurizer / acid plant approach were used to remove H2S and COS from the syngas stream. Depending on the requirements of the CES process this may have to be augmented with additional guard bed to further reduce the sulfur level. The gas stream from the HGCU regenerator enters a heat exchanger before proceeding to the acid plant. This exchanger also was integrated into the CES process to superheat steam.
• CES process - Includes the same sections as described in the previous sections with the feed water heaters adjusted to include heat recovery from the gasifier syngas cooler and from the cooler that precedes the acid plant. Due to the use of the coal syngas instead of methane, the amount of CO2 generated approximately doubles. This is reflected in a higher CO2 percentage in the low pressure turbine exhaust of about 18% versus 10% for the natural gas case.
The ASPEN Plus simulation and the cost estimate yielded the results listed in Table 9 above. A comparison with the Destec reference case that included CO2 capture indicated slightly better performance: (reference case shown in brackets) Overall Process Efficiency : 41.4% [ 40.1%] , Total Capital Cost $/kW : 1768 [ 1897 ] , COE $/MW-Hr : 49.2 [ 46.4 ]. CES has efficiency estimates that were based on using a Texaco gasification process that appear approximately the same as these results for the process efficiency. Details of these two simulations have been provided to CES (Larry Hoffman) and are provided in Appendix A and Appendix B.
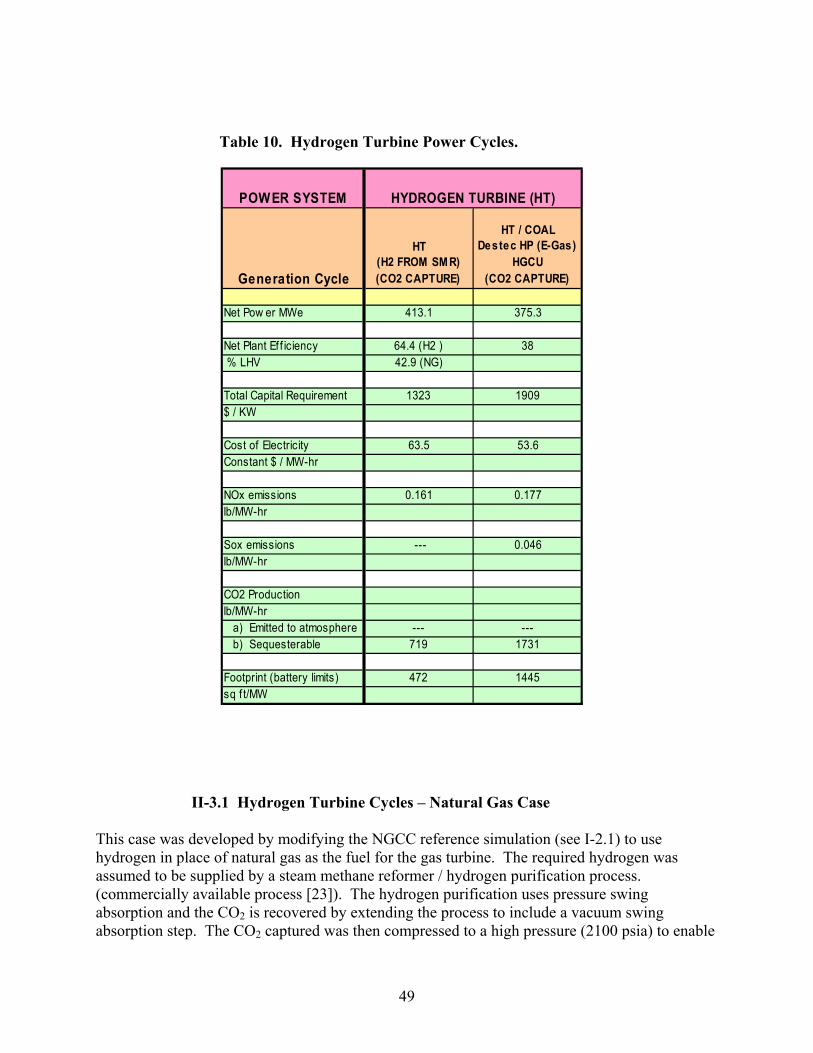
II-2.3 Clean Energy Systems (CES) - Summary The CES Rocket Engine Steam cycles based on either natural gas or coal syngas do not appear to be able to reach the performance levels of the Vision 21 program. Additionally, considerable effort both in research and funding is anticipated to develop the gas generator and the ultra high pressure/temperature turbines. The oxygen combustion process envisioned increases the oxygen required significantly when compared with an oxygen blown IGCC process. This leads to some projected improvement in performance and cost if the cryogenic ASU is replaced with a membrane process (ITM or OTM) for oxygen production. Another problem area is the large compression cost for the first stage of the carbon dioxide recovery system resulting from the low exhaust pressure of 0.65 – 2.1 proposed by CES. The Aspen Plus® simulations also assumed that both the gas generator and reheater combustor could combust the fuel using near stoichometric amounts of oxygen. Some consideration may be warranted to increasing the low pressure exhaust temperature to near atmospheric levels, recovering energy by generating steam for injection and then condensing the water out and starting the carbon dioxide compression from this higher pressure point. II-3. HYDROGEN TURBINE CYCLES As an alternate approach for achieving CO2 capture, two cases were developed using a power cycle based on the gas turbine being fueled with hydrogen. High pressure air supplied by the compressor section was still used in the combustor. The hydrogen stream in the first case is based on using steam reforming of natural gas (methane used for simulations) and for the second case on using an IGCC process that uses coal. The results from the Aspen Plus® simulations and the COE analysis are shown in Table 10. In both cases, the gas turbine fueled by hydrogen produces 269 MWe of power. The CO2 compression section power requirements are (as expected) significantly different (13.5 MWe in case 1 versus 31.6 MWe in case 2) due to the coal case generating more than double the amount of CO2 as for the natural gas case. Flow diagrams are provided with material and energy balance summaries in Appendix A and the COE results are in Appendix B. For both cases, the hydrogen produced probably is bettered used as a chemical product rather than for power generation. Table 10 indicates both a process efficiency based on the amount of methane required in the steam reformer and based on the amount of hydrogen used. An alternate process that uses less methane would result in an efficiency between these two values.
49
Table 10. Hydrogen Turbine Power Cycles.
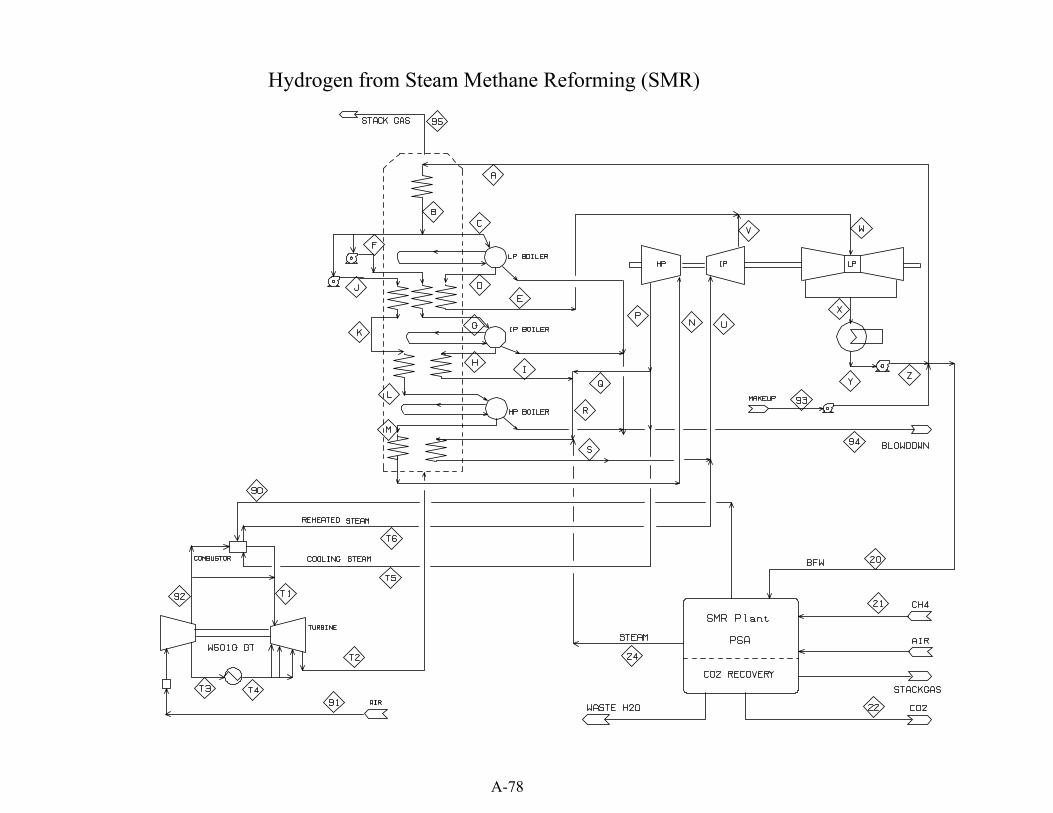
II-3.1 Hydrogen Turbine Cycles – Natural Gas Case This case was developed by modifying the NGCC reference simulation (see I-2.1) to use hydrogen in place of natural gas as the fuel for the gas turbine. The required hydrogen was assumed to be supplied by a steam methane reformer / hydrogen purification process. (commercially available process [23]). The hydrogen purification uses pressure swing absorption and the CO2 is recovered by extending the process to include a vacuum swing absorption step. The CO2 captured was then compressed to a high pressure (2100 psia) to enable
POWER SYSTEM
Generation Cycle
HT (H2 FROM SMR) (CO2 CAPTURE)
HT / COAL Destec HP (E-Gas)
HGCU (CO2 CAPTURE)
Net Pow er MWe 413.1 375.3
Net Plant Ef f iciency 64.4 (H2 ) 38 % LHV 42.9 (NG)
Total Capital Requirement 1323 1909$ / KW
Cost of Electricity 63.5 53.6Constant $ / MW-hr
NOx emissions 0.161 0.177lb/MW-hr
Sox emissions --- 0.046lb/MW-hr
CO2 Productionlb/MW-hr a) Emitted to atmosphere --- --- b) Sequesterable 719 1731
Footprint (battery limits) 472 1445sq f t/MW
HYDROGEN TURBINE (HT)
50
sequestration as a liquid product. (The economic analysis does not assume a value for this product or include a transportation charge for disposal.) The steam generated in the SMR was integrated into the combined cycle process to recover additional power. The net power generated was calculated based on the simulation results for the gas turbine, steam turbine, CO2 captured and a literature estimate for the SMR process. The process efficiency was calculated using the net power generated using both the hydrogen used (in the gas turbine) and the methane used (in the SMR) to generate this hydrogen. Emissions were calculated for CO2 based on the natural gas (methane) used in the SMR as fuel. The NOx was estimated based on 9 ppmv for the gas turbine section added to an estimate for the SMR plant. The COE cost analysis relied on the NGCC reference case augmented by the cost of the SMR plant and the CO2 compression section. The footprint (battery limits) of the NGCC reference case was similarly increased by an estimate for the SMR and CO2 recovery equipment. For costing, the overall plant site was considered to cover 100 acres. Figure 21 illustrates the simulation model representation, Appendix A contains the material and energy balance summaries and Appendix B contains the COE spreadsheet summary. Figure 21. Hydrogen Turbine Cycle – Natural Gas
51
II-3.2 Hydrogen Turbine Cycles – Coal Case The Aspen Plus® simulation model was developed by modifying the simulation developed and described above (see section II-1.3) for the Hydraulic Air Compression (HAC) case with CO2 capture. The major plant sections: high pressure Destec Gasifier, ASU, HGCU, Acid plant, HSD, H2 stream HRSG, CO2 stream HRSG , CO2 compression, steam turbines are retained from the HAC case. The necessary changes are:
• the insertion of a section for the hydrogen powered “G” gas turbine , HRSG and steam cycle to replace the hydraulic compression/recuperator sections in the HAC case. This is the section equivalent to the above natural gas case (see II-3.1, Figure 21).
The resulting process is shown in Figure 22 (similar to Figures 16, 17). This case indicates a decrease in process efficiency to 38 % (LHV) compared to the 42.9% determined for the natural gas fueled hydrogen turbine cycle. Again as a power plant this case appears to have no hope of meeting Vision 21 goals. Alternately, the gas turbine and steam cycle sections can be omitted and the process viewed as producing hydrogen and power. The heating value of the hydrogen (100%) is then used to calculate a combined heat and power efficiency for which the Vision 21 goal is 85 – 90% (HHV) based on coal fuel [24]. The present case based on a hydrogen production (45384 lbs/hr) and the remaining net power would yield the following: CHP eff. (HHV) = 100% * (H2 heating value + net power*3414) / (coal heating value) = 79.4% This is again below the Vision 21 objectives.
52
Figure 22. Hydrogen Turbine Cycle – Coal
53
II-3.3 Hydrogen Turbine Cycles – Summary The hydrogen turbine cycles as summarized in Table 10 have poorer performance and higher cost when compared with reference cases. The natural gas fueled case has an efficiency of 42.9% (LHV) and a COE of 61.2 $/MW-Hr. The NGCC reference case that uses an amine process for CO2 capture has a higher efficiency of 49.9% and a COE of 46.4. The coal fueled case efficiency of 38.0% is approximately the same as the Destec/CGCU reference case results of 40.1% . An alternate hydrogen turbine cycle has been proposed for coal gasification systems that rely on hydrogen combustion with oxygen [25]. Steam is injected in the combustors in a manner that is somewhat similar to the CES systems described in II-2. The coal syngas generated by gasification is shifted and sulfur compounds and CO2 removed using the RECTISOL absorption process and sulfur recovered in a CLAUS/SCOT section. The hydrogen produced is split between a high pressure combustor and a reheat combustor between two turbine expander sections. A HRSG is used to generate steam before the flue gas (essentially steam) is expanded in a low pressure turbine section. The process projects efficiencies of approximately 50% (HHV) which includes CO2 compression to 80 bar (1160 psia).
54
II-4. HYBRID - TURBINE / FUEL CELL CYCLES A Hybrid power system configured as a combined cycle based on using a high temperature Fuel Cell and a Gas Turbine holds promise for approaching the efficiency goals of the Vision 21 program. DOE is currently sponsoring a number of programs both to develop fuel cells, to compare different hybrid concepts and to evaluate related technical issues [26]. Major hurdles also included reducing the cost and size of the fuel cell modules to make hybrid systems available for generating electrical power in commercial power plant sizes > 100 MWe. The current report considers the systems summarized in Table 11 and are based on using Solid Oxide Fuel Cells (SOFC). The efficiencies shown are based on using currently available components and projected performance for the SOFC modules. Modest improvements in turbine and/or fuel cell performance would probably result in these systems obtaining the Vision 21 goals of 75% (LHV) for natural gas systems and 60% (HHV) for coal systems. Table 11. Hybrid Turbine/Fuel Cell
POWER SYSTEM
Generation Cycle
Natural Gas Hybrid Turbine-
SOFC Cycle
HYB / COAL Destec (E-Gas)
HGCU "G" GT / SOFC
(NO CO2 CAPTURE)
HYB / COAL Destec HP (E-Gas)
HGCU / HSD "G" GT / SOFC
(CO2 CAPTURE)
HYB / COAL Destec (E-Gas)
OTM / CGCU "G" GT / SOFC
(NO CO2 CAPTURE)
Net Pow er MWe 19 643.6 754.6 675.2
Net Plant Eff iciency 67.3 56.4 49.7 57 % LHV
Total Capital Requirement 1476 1508 1822 1340$ / KW
Cost of Electricity 53.4 41.1 48.8 38Constant $ / MW-hr
NOx emissions 0.0132 0.107 0.093 0.101lb/MW-hr
Sox emissions --- 0.005 0.004 0.014lb/MW-hr
CO2 Productionlb/MW-hr a) Emitted to atmosphere 661 1254 101 1237 b) Sequesterable 1323
II-4.1 Hybrid - Turbine/Fuel Cell Cycles – Natural Gas Case
The results for this case were obtained from a report “Pressurized Solid Oxide Fuel Cycle/Gas Turbine Power System” by Siemens Westinghouse / Rolls-Royce Allison for the DOE. (DE-AC26-98FT40355 , February 2000) [27]. (The reported performance was verified using an Aspen Plus® simulation). The DOE report describes the development of a conceptual design for a pressurized SOFC/GT power system that was intended to generate 20 MWe with at least 70% efficiency. The system shown, Figure 23, designated the HEFPP system cycle (High Efficiency Fossil Power Plant) integrates an intercooled, recuperated, reheated gas turbine with two SOFC generator stages. One SOFC stage operates at high pressure, and generates power as well as providing all heat needed by the high pressure turbine. The second SOFC generator operates at a lower pressure, generates power, and provides all heat for the low pressure reheat turbine. The system is projected to have an efficiency of 67.3% (LHV).
Figure 23. High Efficiency Fossil Power Plant Cycle (HEFPP)
SOFCGenerator
HighPressure
Recuperator Exhaust
FuelAir
Exhaust
Combustor
Air Heater
DC
PowerConditioningSystem
G
AC
SOFCGenerator
LowPressure
DC
PowerConditioningSystem
Air Heater
Filter
Air
IntercoolerAC
AC
Desulfurizer
NaturalGas
FuelRecuperator
H2 Supply for FuelDesulfurization
FuelHeater
AC
Compressor
HP Turbine
LP Turbine
56
The following design conditions are summarized from the report: Approximate Power Generation : 15 MWe from SOFC and 4 MWe from Gas Turbine. Fuel – Methane (96%), Nitrogen (2%), Carbon dioxide (2%), Sulfur (4 ppmv) Air – inlet flow rate to air compressor = 40 lbs /sec, 59 οF, 14.7 psia. Air Compressor – two stages intercooled , overall pressure ratio = 7:1 , isentropic efficiency = 86.4%. Recuperator – preheats high pressure air using LP turbine exhaust to about 1126 οF.
HP SOFC – operates at exit conditions of about 1600 οF and 92 psia , required fuel inlet sulfur level 0.1 ppmv , 90% fuel utilization.
HP Turbine – isentropic efficiency = 90.7 % , inlet temperature = 1600 οF. LP SOFC - inlet conditions of 46 psia and 1300 οF , exhaust at 40 psia and 1600 οF, 90% fuel utilization. LP Turbine - exhaust at 1197 οF and 15.5 psia, isentropic efficiency = 91.3%. Emissions - CO2 = 661 lbs / MW-hr , NOx 0.013228 lbs / MW-hr
The Cost Estimate developed was based on the following changes from the report which were made for consistency with other COE estimates: Plant Costs - adjusted from 1998 basis to first quarter 2002 basis Fuel Costs – adjusted from $3.0 / MMBU to $3.2 / MMBTU. Annual Operating Capacity Factor – adjusted from 92% to 85% The following costs were modified from the report to the values shown below : $ / KWe (installed Capital Cost) SOFC Equipment - Generator 486 - Power Conditioning 110 Gas Turbine Equipment 218 BOP 267 Site Prep, M & E 72 Overhead and Profit 300 Spare parts, startup, & land 23 Total Capital Requirement $1476 / KWe
Several battery limits designs were proposed that ranged from 0.5 – 0.6 acres. The battery limits are dominated by the SOFC requirements. Siemens Westinghouse / Rolls-Royce Allison project that an optimized system can obtain an efficiency > 70%. It should be noted that the SOFC performance has been estimated with perhaps an optimistic assumption of 90% fuel utilization. A coal fueled version of this system for a nominal 500 MWe size plant has been previously formulated and projected to have an efficiency of 59% (HHV) [26]. Additional studies are
57
currently being sponsored by NETL for systems based on Shell and Texaco gasifiers. [28]. The results will be available in 2003. II-4.2 Hybrid - Turbine/Fuel Cell Cycles – Coal Cases Aspen Plus® simulations were developed for two new cases based on using coal and these results are combined with a third case from an earlier study [29] and summarized in Table 12. All cases were based on using a Destec gasifier, a W501G gas turbine, and a SOFC. The syngas generated was split with 58% sent to the SOFC and the remaining 42% sent to the gas turbine combustor. The coal flowrate was adjusted so that the power produced by the gas turbine was approximately 275 MW for all three cases. Shifting more syngas to the fuel cell will increase efficiency but additionally increase the COE because of the increase in the number of fuel cell modules required. (A capital cost of $800/KW was assumed for the fuel cell section).
Table 12. SUMMARY - SIMULATION FOR COAL SYNGAS HYBRID POWER SYSTEMS
II-4.2.1 Hybrid - Turbine/Fuel Cell Cycles – Coal Cases – Case 1 (No CO2 Capture) Case 1 was developed based on making the following modifications to the reference Destec / HGCU case (see Table 2, Figure 8) and does not include CO2 capture:
• An additional zinc oxide guard bed is added to the HGCU section to reduce the sulfur content of the cleaned fuel gas to acceptable levels for use in the SOFC. (assumed 1-5 ppmv was acceptable and obtainable).
• The SOFC section was added using a previously developed fuel cell model [30]. A fuel
utilization of 85% was assumed. The anode and cathode exit streams are combined and the remaining fuel combusted to raise the temperature > 2000 οF. This stream is used to preheat the cathode inlet stream and then routed to the gas turbine combustor.
58
• The gas turbine compressor outlet provides 50% of the air required by the ASU and all
the air required by the HGCU regenerator as in the reference case. The remaining air is combined with a nitrogen recycle from the ASU and sent to the cathode preheater before entering the fuel cell.
• The cleaned fuel gas is split between 58% entering the fuel cell and 42% sent to the gas
turbine combustor.
• The steam cycle design is the same as for the reference case. In Figure 24, the resulting hybrid GT/SOFC is shown. Appendix A has material and energy balances and Appendix B contains the COE spreadsheet results. Figure 24. Case 1 . Hybrid GT/SOFC – Coal Syngas – no CO2 capture. Figure 24. Case 1. Hybrid GT/SOFC – Coal Syngas – No CO2 Capture
59
II-4.2.2 Hybrid - Turbine/Fuel Cell Cycles – Coal Cases – Case 2 (CO2 Capture) Case 2 was developed based on making the following modifications to the Hydrogen Turbine Coal Cycle case (see Table 10, Figure 22) and includes CO2 capture:
• An additional zinc oxide guard bed is added to the HGCU section to reduce the sulfur content of the cleaned fuel gas to acceptable levels for use in the SOFC. (assumed 1-5 ppmv was acceptable and obtainable).
• The SOFC section was added using a previously developed fuel cell model [30]. A fuel
utilization of 85% was assumed. The cathode exhaust is used to preheat the cathode inlet stream (high pressure air from the gas turbine) and returns to the gas turbine combustor. The anode stream containing unspent fuel is expanded in a power turbine and combined with the CO2 rich stream from the HSD (hydrogen separation device) and the combined stream enters a catalytic combustor.
• The gas turbine compressor outlet provides 50% of the air required by the ASU and all
the air required by the HGCU regenerator. The remaining air is sent to the cathode preheater before entering the fuel cell.
• The cleaned fuel gas is split between 58% entering the fuel cell and 42% sent to the HSD.
The fuel sent to the HSD is used to produce hydrogen for the gas turbine.
• Nitrogen is recycled from the ASU to the gas turbine combustor after being preheated in two heat exchangers. The first exchanger uses the hydrogen exhaust stream from the HSD and the second exchanger uses the exhaust from the catalytic combustor.
• Heat Recovery Steam Generators (HRSG) are used to recover available heat in the
turbine exhaust, gasifier syngas cooler and the catalytic combustor exhaust. The generated steam is used for power generation and supplying steam for the HSD (shift reaction) and for heating in the slurry plant.
• The CO2 capture uses the same approach as in the Hydrogen Turbine Case with a high
pressure liquid stream produced. In Figure 25, the resulting hybrid GT/SOFC is shown. In Figure 26, the steam cycle is shown. Appendix A has material and energy balances and Appendix B contains the COE spreadsheet results. As in Case1, the efficiency will improve as more fuel is sent directly to the fuel cell. The fuel split assumed (58% to the fuel cell) was made due to the high capital cost ($800/KW) used for the SOFC modules and the desire to use the modified W501G gas turbine.
60
Figure 25. Case 2 . Hybrid GT/SOFC – Coal Syngas – CO2 capture
61
Figure 26. Case 2 . Hybrid GT/SOFC – Coal Syngas – CO2 capture
62
II-4.2.3 Hybrid - Turbine/Fuel Cell Cycles – Coal Cases – Case 3 (No CO2 Capture) Case 3 was initially developed as part of a CRADA between NETL and Praxair [29]. This CRADA examined replacing the cryogenic ASU for oxygen production with a membrane process (OTM) in a number of power plant schemes. Case 3 is included in the present report to provide a hybrid that integrates the SOFC with both the ASU and the gas turbine. This takes advantage of the similarity in operating temperature between the OTM and SOFC. Additionally the case uses a CGCU (RECTISOL) to clean the fuel gas to low sulfur levels. In Figure 27, the process is shown. Details of the SOFC/OTM process are confidential and were provided to NETL as a “black box” as shown on the flow diagram. (The Aspen Plus® model developed used a combination of intrinsic reactor models (RGIBBS) and separation operations to obtain approximately the information furnished by Praxair.) Key features include:
• A commercially available process, RECTISOL, is used instead of the HGCU approach used in Case 1 and Case 2 to remove sulfur from the fuel stream.
• The ASU is based on an advanced process under development that is projected to have
lower costs and lower energy requirements compared with cryogenic oxygen plants.
• The SOFC is integrated both with the gas turbine and the ASU (OTM). The combined air stream from the gas turbine and supplemental compressor and fuel from the gasification unit are sent to the SOFC/OTM section. The SOFC is assumed to produce power at 50% efficiency.
• CO2 capture is not included. It is expected that modifications are possible that would
result in a CO2 rich stream. However, an efficiency penalty of 6-7% would be projected as in other cases.
• Developers of ASU processes expect performance and costs to improve over the
assumptions used for the present case that yields a 57% (LHV) efficiency.
• The steam cycle integrates available heat into a three pressure level steam cycle similar to Case 1. Steam is provided for the CGCU and Slurry plant sections.
63
Figure 27. Case 3 . Hybrid GT/SOFC/OTM – Coal Syngas – No CO2 Capture
64
II-4.3 Hybrid - Turbine/Fuel Cell Cycles – Summary The Hybrid cases based on using a combination of a SOFC and turbines resulted in the highest efficiencies obtained for the systems included in this report. The systems considered as summarized in Table 11 have efficiencies that are approaching the goals of the Vision 21 program of 75% (LHV, natural gas) and 60% (HHV, coal). The coal cases considered in this report will have higher efficiencies as more of the fuel is sent directly to the fuel cell. The fuel split assumed was primarily made because of the high cost currently projected for fuel cells and the use of the “G” turbine. The natural gas case uses turbines with relatively low firing temperatures and performance will increase with different choices for the turbines. However, this optimistic feeling is made assuming that the fuel cells performance can be demonstrated for large modules and that the cost ($/KW) is drastically reduced. II-5. HUMID AIR TURBINE (HAT) CYCLES Humid Air Turbine (HAT) cycles have been proposed for a number of years as a means for reducing costs when compared to Combined Cycles (CC). A typical HAT cycle uses a high pressure ratio gas turbine (pressure ratio > 50) composed of a high pressure intercooled shaft and a low pressure power shaft . The high pressure air from the compressor is cooled and then humidified in an air saturator. The humidified air is heated in a heat recovery section that uses the turbine exhaust before entering the turbine combustor. Compared to a combined cycle , the argument is usually made that while the efficiency of the HAT cycle is typically lower by several percentage points that the advantage is in the cost being lower. This is based on the HAT cycle claiming that eliminating the HRSG/Steam Cycle reduces cost more than the added cost of a more expensive gas turbine and the addition of the air saturator and a number of heat exchangers. Two HAT cycles were considered in the present study (natural gas case, and a syngas case) based on a turbine design provided to NETL by Pratt & Whitney Power Systems (PWPS) [31]. Comparisons to the reference cases for NGCC and a Destec/CGCU IGCC indicated approximately the same efficiencies and higher costs for the HAT cycles. PWPS would not provide a cost estimate for the high pressure ratio gas turbine since it’s currently in the research and development stage. This cost was estimated based on information from the EG&G Cost Estimating Notebook (version 1.11) and are included with the COE spreadsheets for these cases in Appendix B. (The COE results can be easily revised if information becomes available.) Since the two HAT cases developed demonstrated no advantage over reference cases, HAT cycles that include carbon dioxide capture were not considered. NETL is currently funding systems studies (no COE analysis) based on HAT cycles combined with SOFC [28], that demonstrate high efficiencies. However, the efficiency gain found in these studies is due to the use of fuel cells and partly due to optimistic efficiencies assumed for compressors and turbine expanders. HAT
65
cycles in non-hybrid systems appear to have no hope of meeting Vision 21 goals. The results obtained for the two cases in the present study are listed in Table 13. Table 13. HAT Cycle Summary II-5.1 Humid Air Turbine (HAT) Cycles – Natural Gas Based on the information provided by PWPS, a natural gas HAT cycle was developed and is shown in Figure 28. The aeroderivative turbine consists of a dual shaft arrangement having an overall pressure ratio of 54.2. Other conditions include an inlet air flowrate of 643.3 lbs/sec and a turbine inlet temperature of 2750 oF. The HAT approach results in the elimination of the HRSG/Steam Cycle of the NGCC and adds several heat exchangers (water heating), an air saturator and a heat recovery section. The heat integration allows the high pressure air stream exiting the saturator to have a moisture content of 19.2%. This plant produces a net power of
POWER SYSTEM
Generation Cycle
HAT (PW GT)
Natural Gas
HAT COAL
(PW GT) Destec (E-Gas)
CGCU
Net Pow er MWe 318.7 407.4
Net Plant Eff iciency 57.6 44.9 % LHV
Total Capital Requirement 873 1552$ / KW
Cost of Electricity 47 45.1Constant $ / MW-hr
NOx emissions 0.074 0.071lb/MW-hr
Sox emissions --- 0.353lb/MW-hr
CO2 Productionlb/MW-hr a) Emitted to atmosphere 758 1576 b) Sequesterable
Footprint (battery limits) 175 811sq ft/MW
HUMID AIR TURBINE (HAT)
66
318.7 MWe and has an efficiency of 57.6% (LHV). Appendix A contains the material and energy balances and the COE is included in Appendix B. Figure 28. HAT Cycle – Natural Gas - PW Aeroderivative Turbine
67
II-5.2 Humid Air Turbine (HAT) Cycles – Coal Syngas An Aspen Plus® simulation model was developed for an Integrated Gasification Humid Air Turbine (IGHAT) based on the following key sections:
• Destec (E-Gas) Gasifier - operates at exit conditions of 1900 oF and 412 psia. Condition and model incorporated from reference Destec/CGCU case.
• ASU – cryogenic oxygen plant (low pressure). • High Temperature Syngas Cooling - used to both reheat the clean syngas and to heat
high pressure water sent to the air saturator.
• Low Temperature Syngas Cooling – includes COS Hydrolysis and heat recovery. Heat recovery used to generate low pressure steam used for the CGCU section stripper and slurry heating. Condenses most of the water from syngas.
• CGCU – used MDEA/CLAUS/SCOT system for sulfur recovery.
• Syngas Compressor / Reheater – compresses and reheats the clean syngas from the
MDEA section for use in the gas turbine combustor.
• PW Aeroderivative Turbine – uses the turbine model representation developed for the natural gas HAT case. (Pressure Ratio = 54.2, TIT = 2750 oF)
• Air Saturator – used to humidify the high pressure air from the gas turbine.
• Heat Recovery Unit (HRU) – uses the turbine exhaust to heat the air from the saturator
and to heat a portion of the water used in the saturator. Figure 29 shows a flow diagram for the process which resulted in a net power generation of 407.3 MWe and an overall efficiency of 44.9% (LHV). This is slightly lower when compared to the 46.7% obtained for the reference Destec/CGCU IGCC process. Material and Energy balance summaries are in Appendix A and the COE spreadsheet results are in Appendix B.
68
Figure 29. IGHAT – Destec/ CGCU
COS HYDROLYSIS
69
II-5.3 Humid Air Turbine (HAT) Cycles - Summary HAT cycles produced efficiencies that were only comparable to corresponding reference combined cycles (NGCC, IGCC). HAT cycles without the addition of a fuel cell and the resulting conversion to a hybrid cycle will not be able to achieve anywhere near Vision 21 objectives. In Table 14 following, a summary is provided of key conditions used and a comparison with simulation results provided by PWPS [31] for a modified HAT cycle based on a TEXACO gasifier. This case uses a small steam cycle and results in a lower moisture content for the humidified air when compared to the Destec HAT cycle. The efficiency is somewhat higher but still significantly below Vision 21 objectives. Systems studies that include hybrid HAT cycles are currently being funded by NETL [28].
Table 14. Comparison with P&W hybrid system and NETL IGHAT Cycle P&W IGHAT NETL IGHAT NETL NGHAT
Fuel
Syngas (TEXACO Gasifier)
Syngas (DESTEC Gasifier)
Natural Gas (CH4)
Gas Turbine: - Pressure Ratio : 54.2 54.2 54.2 - Inlet Air (lbs/sec): 643.3 643.3 643.3 - TIT (οF) : 2750 2750 2750 - weight % Moisture : 17 28.1 19.2 (air to Combustor) Results Power (MWe) - Gas Turbine 359.9 457.6 326.5 - Steam Turbine 69.6 - Expander 5 - Total Gross 434.5 457.6 326.5 - Misc & Aux 51.4 50.2 7.8 - Net Power 383.1 407.4 318.7 Efficiency % - HHV 46 43.3 51.9 - LHV 47.7 44.9 57.6
70
References
1. M. M. Shah , L. Bool, and W. W. Shelton, “Oxygen Transport Membranes (OTM) , CRADA (99-FO32), Task 3: OTM Integrated Combustion Processes, CRADA between Praxair, Inc. and NETL , DOE. April 2001.
2. T.L. Buchanan, M.R. DeLallo, H.N. Goldstein, G.W. Grubbs and J.S. White, “Market-Based Advanced Coal Power System,” (Section 3.1, Pulverized Coal-Fired Subcritical Plant , 400 MWe), Final Report, December 1998, Prepared For: The United States Department of Energy, Office of Fossil Energy, Contract No. DE-AC01-94FE62747, BY: Parsons Infrastructure & Technology, Reading, Pennsylvania.
3. Praxair, Inc. - communication from M. Shah , (commercially available costs), to NETL , 1/15/2001.
4. G. T. Rochelle, University of Texas at Austin, “Carbon Dioxide Capture by Absorption with Potassium Carbonate” , NETL funded project , March 6, 2002.
5. Private Communication - R. Birnbarw (DOW Chemical) to NETL, April 11, 2002.
6. “Gas Turbine World 2001"
7. “Gasification Technologies – Gasification Markets and Technologies – Present and Future – An Industry Perspective” (DOE report, July 2002)
9. NETL/Gasification Technologies team website (Wabash River Coal Gasification Repowering Project): http://www.netl.doe.gov/coalpower/gasification/projects/system
10. NETL/Gasification Technologies team website (Global Energy, Nexant) : http://www.netl.doe.gov/coalpower/gasification/projects/systems/docs/40342R01.PDF
11. Private Communication – “SSK , “Sulfur Tolerant Shift Catalyst”, Jens Houken (Haldor Topsoe, Inc.) to P. Le (NETL), March 27,1997.
12. NETL/Gasification Technologies team website (System Studies FY2000) : http://www.netl.doe.gov/coalpower/gasification/system/shell3x_.pdf
13. NETL/Gasification Technologies team website (Publications) : http://www.netl.doe.gov/coalpower/gasification/pubs/pdf/igcc-co2.pdf
14. D. J. White , “High Efficiency Hybrid Gas Turbine And Hydraulic Air Compressor – Final Report”, TRITEX Consulting , Final Report Number TRC-101-2001.
15. Private Communication, E. Parsons (NETL) to W. Shelton (EG&G), October 10, 2002.
16. D. E. Fain (ORNL), “Research and Development on Hydrogen Separation Technology with Inorganic Membranes”, Pittsburgh Coal Conference 1999.
17. T.L. Buchanan, M. G. Klett, M. D. Rutkowski and J.S. White, “Decarbonized Fuel Production Facilities Base Case Comparisons “, Letter Report, June 1999, Prepared For: The United States Department of Energy, Office of Fossil Energy, Contract No. DE-AMO1-98FE65271 BY: Parsons Infrastructure & Technology, Reading, Pennsylvania.
18. Private Communication , Patterson Pump Company (Toccoa, Georgia) to J. Lyons (EG&G), October 20, 2002.
19. Clean Energy Systems, Inc., the proposed technology is covered by one or more of the following U.S. Patents: 5,437,899; 5,590,528; 5,680,764; 5,709,077; 5,715,673; 5,956,937; 5,970,702; 6,170,264; 6,206,684; 6,247,316. Additional patents are pending.
20. Private Communication - Larry Hoffman (Clean Energy Systems, Inc.) to NETL, July 21, 2002.
21. R. E. Anderson, H. Brandt and F. Viteri, (Clean Energy Systems, Inc.), “Power Generation from Coal with Zero Atmospheric Emissions”, Eighteenth Annual International Pittsburgh Coal Conference December 3-7, 2001 Newcastle, Australia.
22. Costs were provided to NETL in a series of reports / presentations by CES to the NETL and other government organizations. (e.g. documentation from R. Smith (LLNL) to A. Layne (NETL) on proposed ZEST Research Facility, Nov. 22, 2000.)
23. J. D. Fleshman (Foster Wheeler USA), “FW Hydrogen Production”, in Meyers Handbook of Petroleum Refining Processes – Second Edition.
24. The Objectives and Goals of the Vision 21 program of the U.S. DOE can be explored on http://www.netl.doe.gov/coalpower/vision21/index.html.
25. G. Cau, D. Cocco, A. Montisci, “Performance of Zero Emissions Integrated Gasification Hydrogen Combustion (ZE-IGHC) Power Plants with CO2 Removal”, ASME Turbo Expo 2001, June 2001, New Orleans, LA.
26. “Fuel Cell Handbook – Fifth Edition” , U.S. DOE NETL, October 2000.
27. “Pressurized Solid Oxide Fuel Cycle/Gas Turbine Power System” by Siemens Westinghouse / Rolls-Royce Allison for the DOE. (DE-AC26-98FT40355 , February 2000).
28. A. Rao, G. Samuelsen, (University of California – Irvine), F. Robson (kraftWork Systems, Inc.) and R. Geisbrecht (NETL), “Power Plant System Configurations for the 21ST Century.”, ASME Turbo Expo 2002, June 2002, Amsterdam, Nederlands.
29. M. M. Shah , K. Mahoney, W. W. Shelton and J. Lyons, “Oxygen Transport Membranes (OTM) , CRADA (99-FO32), Task 1: OTM Integrated Gasification Combined Cycle Processes, CRADA between Praxair, Inc. and NETL , DOE, June 2000.
30. C. White (EG&G) , “SOFCELL – ASPEN Model for Solid Oxide Fuel Cell”, developed for NETL – last revision 2000.
31. Private Communication – F. Robson (UTRC) and W. Day (Pratt & Whitney) to NETL, December 5, 2001.
Appendix A
Process Flow Diagrams Material & Energy Balances
Case Page Pulverized Coal (PC) PC Steam Cycle – No CO2 Capture A-3 PC Steam Cycle - Amine CO2 Capture A-8 PC Steam Cycle - O2 Boiler / CO2 Capture A-13 Combined Cycle Natural Gas Combined Cycle (NGCC) - No CO2 Capture A-18 Natural Gas Combined Cycle (NGCC) - CO2 Capture A-21 IGCC Destec (E-GasTM) / CGCU / “G” Gas Turbine A-25 IGCC Destec (E-GasTM) / HGCU / “G” Gas Turbine A-30 IGCC Destec (E-GasTM) / CGCU / “G” Gas Turbine / CO2 Capture A-35 IGCC Shell /CGCU/“G” Gas Turbine A-40 IGCC Shell /CGCU/“G” Gas Turbine / CO2 Capture A-45 Hydraulic Air Compression (HAC) Natural Gas HAC - No CO2 Capture A-48 Natural Gas HAC - CO2 Capture A-51 Coal Syngas HAC
- Destec (E-GasTM) / CGCU / “G” GT / No CO2 Capture A-54 - Destec High Pressure (E-GasTM) / HGCU / “G” GT / CO2 Capture A-58 Rocket Engine (CES) - CO2 Capture
Natural Gas CES (gas generator) A-63 Coal Syngas CES (gas generator) – Destec HP / HGCU A-69 Hydrogen Turbine - CO2 Capture Hydrogen from Steam Methane Reforming (SMR) A-77 Destec High Pressure (E-GasTM) / HGCU / HSD A-80
A-2
(continued) Process Flow Diagrams Material & Energy Balances
Case Page Hybrid Cycles ( Turbine / SOFC) Natural Gas Hybrid Turbine / SOFC A-85 Destec (E-GasTM) / HGCU / “G” GT / No CO2 Capture A-88 Destec High Pressure (E-GasTM) / HGCU / “G” GT / CO2 Capture A-93 Destec (E-GasTM) / OTM / CGCU / “G” GT / No CO2 Capture A-98 Humid Air Turbine (HAT) Natural Gas / Pratt Whitney GT A-103 Coal Syngas / Destec (E-GasTM) / CGCU / Pratt Whitney GT A-106
A-3
Pulverized Coal (PC)
PC Steam Cycle – No CO2 Capture
A-4
A-5
Streams Summary PFD ID 1 2 3 4 5 6 7 ASPEN STREAM ID AIRFD AIRPR COALFEED TOESP ASH5 ASH6 FLUEGAS Description Main Air Primary Air Coalfeed to ESP Ash Boiler Ash ESP Fluegas Temperature F 60 60 59 289.1 289.1 289.1 289.1 Pressure psi 14.7 14.7 14.7 14.4 14.4 14.4 14.4 Mass Flow lb/hr 2675327 821832 309464 3800348 6272 25088 3775260 Mole Flow lbmol/hr 92712 28480 127371 Enthalpy MMBtu/hr -111.1 -34.1 -1138.9 -3696.6 -14.6 -58.5 -3638.1 Mole Frac O2 0.20747 0.20747 0.04557 0.04557 N2 0.77316 0.77316 0.73674 0.73674 AR 0.00921 0.00921 0.00876 0.00876 CO2 0.00030 0.00030 0.12835 0.12835 H2O 0.00986 0.00986 0.07858 0.07858 SO2 0.00190 0.00190 CL2 0.00010 0.00010
CL2 0.00010 0.00009 0.00000 TOTAL 1.00000 1.00000 1.00000 1.00000
FLOW DIAGRAM ID 15 16 17 18 19 20 21 ASPEN STREAM ID SLURRY H1 H2 H3 H4 H5 H7 Description Slurry exit Steam-HP bleed bld to ip bld to ip to FWH4 to seal reg Temperature F 129.1 1000 1000 1000 801.6 631.4 655.4 Pressure psi 14.8 2415 2415 2415 1207.5 603.6 603.6 Mass Flow lb/hr 297308 2734080 1083 3788 32207 5521 10989 Mole Flow lbmol/hr 14719 151763 60 210 1788 306 610 Enthalpy MMBtu/hr -1949.1 -14780.2 -5.9 -20.5 -176.7 -30.7 -60.9 Mole Frac H2O 1.00000 1.00000 1.00000 1.00000 1.00000 1.00000 1.00000 TOTAL 1.00000 1.00000 1.00000
FLOW DIAGRAM ID 22 23 24 25 26 27 28 ASPEN STREAM ID H8 H9 H8A I2 I3 I4 I5 Description stm->reheat to FWH7 Reheat->IP to FWH6 to Deaerator to LP Turb to seal reg Temperature F 631.4 631.4 1000 811.8 695.1 695.1 695.1 Pressure psi 603.6 603.6 545.4 278.9 174.9 174.9 174.9 Mass Flow lb/hr 2425661 255913 2425661 81934 160845 2215094 3784 Mole Flow lbmol/hr 134643 14205 134643 4548 8928 122955 210 Enthalpy MMBtu/hr -13477.7 -1421.9 -12970.8 -445.6 -883.6 -12168.4 -20.8 Mole Frac H2O 1.00000 1.00000 1.00000 1.00000 1.00000 1.00000 1.00000 TOTAL
A-6
Stream Summary (continued) FLOW DIAGRAM ID 29 30 31 32 33 34 35 ASPEN STREAM ID L1 L2 L3 L4 L5 L6 L7 Description to LP #1 to LP #2 to LP #3 from LP #1 to FWH4 to FWH3 to FWH2 Temperature F 695.1 695.1 695.1 101.7 479.5 293.2 205.1 Pressure psi 174.9 174.9 174.9 1 66.5 24.2 12.8 Mass Flow lb/hr 866582 1248002 100510 866582 125975 68312 64645 Mole Flow lbmol/hr 48102 69274 5579 48102 6993 3792 3588 Enthalpy MMBtu/hr -4760.5 -6855.8 -552.1 -5070.8 -704.7 -388 -370 Mole Frac H2O 1.00000 1.00000 1.00000 1.00000 1.00000 1.00000 1.00000 TOTAL 1.00000 1.00000 1.00000 1.00000 1.00000 1.00000 1.00000
FLOW DIAGRAM ID 36 37 38 39 40 41 42 ASPEN STREAM ID L8 L9 L10 S1 S2 S3 S4 Description to FWH1 From LP #2 from LP #3 to seal reg to FWH1 to cd reheat to Deaer Temperature F 172.2 110.7 113.3 625.2 625.2 625.2 625.2 Pressure psi 6.3 1.3 1.4 174.9 174.9 174.9 174.9 Mass Flow lb/hr 118188 835339 100510 14773 9545 2815 2413 Mole Flow lbmol/hr 6560 46368 5579 820 530 156 134 Enthalpy MMBtu/hr -677.4 -4862.6 -586.5 -81.7 -52.8 -15.6 -13.3 Mole Frac H2O 1.00000 1.00000 1.00000 1.00000 1.00000 1.00000 1.00000 TOTAL 1.00000 1.00000 1.00000 1.00000 1.00000 1.00000 1.00000
FLOW DIAGRAM ID 43 44 45 46 47 48 49 ASPEN STREAM ID S5 S6 MK1 C0 CD0 CDA CD1 Description to FWH1 to Deaer makeup to Deaer from Cond pump cdn cdn-->FWH1 Temperature F 204.7 113.3 60 106.3 96.4 96.7 98.3 Pressure psi 6.3 1.4 14.7 1.4 0.9 330 321 Mass Flow lb/hr 127733 2815 13125 395001 2248513 2248513 2248513 Mole Flow lbmol/hr 7090 156 729 21926 124810 124810 124810 Enthalpy MMBtu/hr -730.1 -19.1 -89.7 -2682.8 -15293.5 -15290.9 -15287.3 Mole Frac H2O 1.00000 1.00000 1.00000 1.00000 1.00000 1.00000 1.00000 TOTAL 1.00000 1.00000 1.00000 1.00000 1.00000 1.00000 1.00000
FLOW DIAGRAM ID 50 51 52 53 54 55 56 ASPEN STREAM ID CD2 CD3 CD4 CD5 C76 C5 P1 Description cdn-->FWH2 cdn-->FWH3 cdn-->FWH4 to Deaer to Deaer from Deaer to FWH6 Temperature F 167.8 199.4 232 293.5 405.7 365.9 372.3 Pressure psi 300 250 210 175 263.8 164.8 2903.3 Mass Flow lb/hr 2248513 2248513 2248513 2248513 337847 2747205 2652976 Mole Flow lbmol/hr 124810 124810 124810 124810 18753 152491 147261 Enthalpy MMBtu/hr -15131.7 -15060.8 -14987.3 -14847.2 -2190.4 -17933.2 -17289.7 Mole Frac H2O 1.00000 1.00000 1.00000 1.00000 1.00000 1.00000 1.00000 TOTAL 1.00000 1.00000 1.00000 1.00000 1.00000 1.00000 1.00000
FLOW DIAGRAM ID 57 58 59 60 61 62 63 64 ASPEN STREAM ID P3 P4 P2 C1 C2 C3 C4 C7 Description to FWH7 to econ to pc from FWH1 from FWH2 from FWH3 from FWH4 from FWH7 Temperature F 404.3 485.5 372.3 106.2 175.4 206.7 239.1 415.5Pressure psi 2620 2758 2903.3 6 11.9 22.4 62.4 588.5Mass Flow lb/hr 2652976 2652976 94229 392186 264453 199808 131495 255913Mole Flow lbmol/hr 147261 147261 5230 21769 14679 11091 7299 14205Enthalpy MMBtu/hr -17201.6 -16966.7 -614.1 -2663.7 -1777.8 -1337 -875.6 -1656.8Mole Frac H2O 1.00000 1.00000 1.00000 1.00000 1.00000 1.00000 1.00000 1.00000
TOTAL 1.00000 1.00000 1.00000 1.00000 1.00000 1.00000 1.00000 1.00000
A-7
POWER SUMMARY PC Steam Cycle - No CO2 Capture
TURBINE SECTION POWER KW POWER KW
HP TURBINE -119608.27 LP Turb #3 -10068.36 (lp turb #3 supplies power forIP TURBINE -102672.41 HP Pump 8632.28 the hp feedwater pump)LP TURBINE #1 -90957.98 extra -1436.08LP TURBINE #2 -113113.83
TOTAL TURBINE -426352.49 ***NOTE - ASPEN sign conventionGENERATOR LOSS 6395.29 "-" power producedNET STEAM TURBINE -419957.19 "+" power required
DRAFT FANS POWER KW - Primary Air 915.19 - Forced 871.17 - Induced 3057.95TOTAL FANS 4844.31
MISC WORK 17564.86CONDENSER PUMP 755.99
NET POWER (MWe) -396.79COALFEED (LBS/HR) 309464.00EFF % (HHV) 37.51
A-8
Pulverized Coal (PC)
PC Steam Cycle - Amine CO2 Capture
A-9
A-10
Amine Case - Stream Summary FLOW DIA. ID 1 2 3 4 5 6 7 ASPEN STREAM ID AIRFD AIRPR COALFEED TOESP ASH5 ASH6 FLUEGAS Description Main Air Primary Air Coalfeed to ESP Ash Boiler Ash ESP Fluegas Temperature F 60 60 59 289.1 289.1 289.1 289.1 Pressure psi 14.7 14.7 14.7 14.4 14.4 14.4 14.4 Mass Flow lb/hr 2675327 821832 309464 3800348 6272 25088 3775260 Mole Flow lbmol/hr 92712 28480 127371 Enthalpy MMBtu/hr -111.1 -34.1 -1138.9 -3696.6 -14.6 -58.5 -3638.1 Mole Frac O2 0.20747 0.20747 0.04557 0.04557 N2 0.77316 0.77316 0.73674 0.73674 AR 0.00921 0.00921 0.00876 0.00876 CO2 0.00030 0.00030 0.12835 0.12835 H2O 0.00986 0.00986 0.07858 0.07858 SO2 0.00000 0.00000 0.00190 0.00190 CL2 0.00000 0.00000 0.00010 0.00010 TOTAL 1.00000 1.00000 1.00000 1.00000
FLOW DIA. ID 8 9A 9B 9C 9 11 12 ASPEN STREAM ID 20 TOAMINE LIQW STACKGAS CO2HP OXIDANT LMSTONE Description to FGD to MEA liquid waste to stack HP CO2 Air to FGD Lmstone Temperature F 299.9 129 95.7 101 228 60 60 Pressure psi 15.1 14.8 14.7 14.7 1500 14.7 14.7 Mass Flow lb/hr 3775260 3973687 234034 3058207 692907 61971 96893 Mole Flow lbmol/hr 127371 137427 12979 110132 15772 2148 4040 Enthalpy MMBtu/hr -3627.8 -4630.9 -1603.4 -1040.2 -2665.1 -2.6 -623.4 Mole Frac O2 0.04557 0.04467 0.00000 0.05575 0.00006 0.20747 0.00000 N2 0.73674 0.69491 0.00000 0.86727 0.00045 0.77316 0.00000 AR 0.00876 0.00826 0.00000 0.01031 0.00000 0.00921 0.00000 CO2 0.12835 0.12058 0.00044 0.00741 0.99677 0.00030 0.00000 H2O 0.07858 0.13134 0.99951 0.05910 0.00272 0.00986 1.00000 SO2 0.00190 0.00014 0.00000 0.00000 0.00000 0.00000 0.00000 CL2 0.00010 0.00009 0.00000 0.00000 0.00000 0.00000 0.00000 MEA 0.00000 0.00000 0.00005 0.00016 0.00000 0.00000 0.00000 TOTAL 1.00000 1.00000 1.00000 1.00000 1.00000 1.00000 1.00000
FLOW DIAGRAM ID 54 55 56 57 58 59 60 ASPEN STREAM ID C76 C5 P1 P3 P4 P2 C1 Description to Deaer from Deaer to FWH6 to FWH7 to econ to pc from FWH1 Temperature F 405.7 365.9 372.3 404.3 485.5 372.3 106.2 Pressure psi 263.8 164.8 2903.3 2620 2758 2903.3 6 Mass Flow lb/hr 337847 2747205 2652976 2652976 2652976 94229 233387 Mole Flow lbmol/hr 18753 152491 147261 147261 147261 5230 12955 Enthalpy MMBtu/hr -2190.4 -17933.2 -17289.7 -17201.6 -16966.7 -614.1 -1585.1 Mole Frac H2O 1 1 1 1 1 1 1
TOTAL 1.00000 1.00000 1.00000 1.00000 1.00000 1.00000 1.00000
A-12
Amine Case - Stream Summary FLOW DIAGRAM ID 61 62 63 64 65 ASPEN STREAM ID C2 C3 C4 C7 11 Description from FWH2 from FWH3 from FWH4 from FWH7 from MEA Temperature F 175.4 206.7 239.1 415.5 232.3 Pressure psi 11.9 22.4 62.4 588.5 215 Mass Flow lb/hr 183742 155796 131496 255913 1276467 Mole Flow lbmol/hr 10199 8648 7299 14205 70854 Enthalpy MMBtu/hr -1235.2 -1042.5 -875.6 -1656.8 -8507.8 Mole Frac H2O 1 1 1 1 1 TOTAL 1.00000 1.00000 1.00000 1.00000 1.00000
POWER SUMMARY - BASE CASE modified for providing steam to amine system reboiler(Basis - CO2 in exit gas = 692806 lbs/hr - 95% of CO2 generated, reboiler duty in amine system = 4.08 MMBTU/Metric Ton CO2, Steam provided from steam cycle at 35 psia and 372 F, Condensate return at 215 psia and 232 F, Steam flowrate = 1276467 lbs/hr) TURBINE SECTION POWER KW POWER KW
HP TURBINE -119608.27 LP Turb #3 -10068.36 (lp turb #3 supplies power forIP TURBINE -102672.41 HP Pump 8632.28 the hp feedwater pump)LP TURBINE #1 -55936.54 **** extra -1436.08LP TURBINE #2 -75546.58 ****
TOTAL TURBINE -353763.80 ***NOTE - ASPEN sign conventionGENERATOR LOSS -5306.457 "-" power producedNET STEAM TURBINE -348457.34 "+" power required
DRAFT FANS POWER KW **** POWER REDUCED FROM BASE CASE DUE TO STEAM - Primary Air 915.19 EXTRACTION FOR AMINE SYSTEM REBOILER, - Forced 871.17 LP Turbine section #2 was modified by reducing bleeds, assumes - Induced 3057.95 returning steam sent to the reboiler as condensate at 215 psia and 232 FTOTAL FANS 4844.31
MISC WORK 17564.86CONDENSER PUMP 343.09 (REDUCED SINCE CONDSEROR FLOW IS REDUCEDCOND. RETURN- AMINE 266.47 (PUMPS REBOILER CONDENSATE FROM 25 PSIA TO 215 PSIA)Amine plant 12567.90 (calculated as 40 kWh/metric ton co2 * 692806/2205 metric ton co2)CO2 COMPRESSOR 29791.38 717334.895 = compr inlet lb/hr
FLOW DIAGRAM ID 54 55 56 57 58 59 60 ASPEN STREAM ID C76 C5 P1 P3 P4 P2 C1 Description to Deaer From Deaer to FWH6 to FWH7 to econ to pc from FWH1 Temperature F 405.7 365.9 372.3 404.3 485.5 372.3 106.2 Pressure psi 263.8 164.8 2903.3 2620 2758 2903.3 6 Mass Flow lb/hr 337671 2745776 2651596 2651596 2651596 94180 391982 Mole Flow lbmol/hr 18743 152412 147184 147184 147184 5228 21758 Enthalpy MMBtu/hr -2189.3 -17923.9 -17280.7 -17192.7 -16957.9 -613.8 -2662.3 Mole Frac H2O 1.00000 1.00000 1.00000 1.00000 1.00000 1.00000 1.00000
TOTAL 1.00000 1.00000 1.00000 1.00000 1.00000 1.00000 1.00000
A-17
PC Steam Cycle – O2 Boiler/CO2 Capture - Stream Summary FLOW DIAGRAM ID 61 62 63 64 65 66 ASPEN STREAM ID C2 C3 C4 C7 STMEXT CNDSASU Description from FWH2 From FWH3 from FWH4 from FWH7 to ASU from ASU Temperature F 175.4 206.7 239.1 415.5 695.1 370.7 Pressure psi 11.9 22.4 62.4 588.5 174.9 174.9 Mass Flow lb/hr 264315 199704 131427 255780 20249 20249 Mole Flow lbmol/hr 14672 11085 7295 14198 1124 1124 Enthalpy MMBtu/hr -1776.9 -1336.3 -875.1 -1656 -111.2 -132.1 Mole Frac H2O 1.00000 1.00000 1.00000 1.00000 1.00000 1.00000 TOTAL 1.00000 1.00000 1.00000 1.00000 1.00000 1.00000 POWER SUMMARY - CRYOGENIC ASU
TURBINE SECTION POWER KW POWER KW
HP TURBINE -119546.04 LP Turb #3 -10063.12 (lp turb #3 supplies power forIP TURBINE -102618.99 HP Pump 8627.79 the hp feedwater pump)LP TURBINE #1 -88785.26 extra -1435.33LP TURBINE #2 -113054.98
TOTAL TURBINE -424005.27 ***NOTE - ASPEN sign conventionGENERATOR LOSS 6360.08 "-" power producedNET STEAM TURBINE -417645.18 "+" power required
DRAFT FANS - Primary small - Forced small - Induced 2847.99TOTAL FANS 2847.99
CO2 COMPRESSOR 33853.73
WORK ASU 64299.99(ESTIMATE -PRAXAIR)
MISC WORK 17468.1567CONDENSER PUMP 755.61
NET POWER (MWe) -298.42COALFEED (LBS/HR) 296097EFF % (HHV) 29.48 INCLUDES CO2 COMPRESSOREFF % (HHV) 32.83 NO CO2 COMPRESSOR
A-18
Combined Cycle
Natural Gas Combined Cycle (NGCC) - No CO2 Capture
A-19
Natural Gas Combined Cycle (NGCC) - No CO2 Capture
POWER kWCO2 Compression (with CO2 Sequestration)CO2 Compressor #1 13428.52 Gross Power -404440.70CO2 Compressor #2 8573.21 Auxiliary (1.5%) 6066.61CO2 Compressor #3 8147.99 Net Power (KWe) -398374.09 total 30149.71
POWER SUMMARY(ASPEN CONVENTION , "+" is power usage, "-" is power generation)
Air Separation Plant POWER kW GROSS POWER -414527 - Gasification 21835.9557 - CES (generator+reheater) 43236.6613 Auxiliary POWER (2% of GROSS POWER) 8291total 65072.617
NET PLANT POWER -406237Oxygen Compression - for gasifier 12071.374 COAL USAGE (lbs/hr , dry) 264424 - for CES generator 9380.54256 - HHV (Btu/lb , dry) 13126.00 - for CES reheater 12066.522 - LHV ( " ) 12656.94total 33518.43856
OVERALL EFFICIENCYSyngas - HHV basis % 39.96 - HP Cpr for CES generator 4460.46151 - LHV basis % 41.44 - Expander for CES reheater (credit) -7256.7916total -2796.33009
Thermal InputCO2 Compression - LHV (KW) 980316.6311 -0.414393496 - # 1 (1.9 to 17.85 psia) 25825.9715 - HHV (KW) 1016646.846 -0.399585005 - # 2 (17.5 to 163.2 psia) 16320.2041 - # 3 (160 to 2100 psia) 15416.7619total 57562.9375 CO2 as low pressure gas (No sequestration - approximate)
Gross Power -451520.98Gasification Misc Net Power -442490.56 - HGCU/Recycle 5852.94348 HHV % 43.52 - pumps (slurry, makeup) 228.84847 LHV % 45.14total 6081.79195
Cooling tower - pumps 6241.94946 - fan 1978.63286total 8220.58232
CES pumps - condensate 65.5863712 - HP water 3254.10419 - CO2 pump 1146.33903total 4466.029591
Power Turbines - HP Turb -113883.77 - IP Turb -323285.88 - LP Turb -149483.8total -586653.45
A-76
CO2 Compression
(ASPEN Representation was a series of three intercooled multistage compressors)
Stream PFD # T3 T4 T5 T6ASPEN Name ID 3 12 C3 C4Temperature F 813.2 600 712 1103.2Pressure psi 282.2 277 518 492Mass Flow lb/hr 527109 527109 80000 80000Mole Flow lbmol/hr 18267 18267 4441 4441Enthalpy MMBtu/hr 76.7 47.9 -440.2 -423.2
A-85
Hybrid Cycles ( Turbine / SOFC)
Natural Gas Hybrid Turbine / SOFC
A-86
SOFCGenerator
HighPressure
Recuperator Exhaust
FuelAir
Exhaust
Combustor
Air Heater
DC
PowerConditioningSystem
G
AC
SOFCGenerator
LowPressure
DC
PowerConditioningSystem
Air Heater
Filter
Air
IntercoolerAC
AC
Desulfurizer
NaturalGas
FuelRecuperator
H2 Supply for FuelDesulfurization
FuelHeater
AC
Compressor
HP Turbine
LP Turbine
A-87
Natural Gas Hybrid M&E See report:
“Pressurized Solid Oxide Fuel Cycle/Gas Turbine Power System” by Siemens Westinghouse / Rolls-Royce Allison for the DOE. (DE-AC26-98FT40355 , February 2000).
A-88
Hybrid Cycles ( Turbine / SOFC)
Destec (E-GasTM) / HGCU / “G” GT / No CO2 Capture
A-89
A-90
E-GAS (DESTEC) GASIFICATION - HYBRID POWER SYSTEM
4/29/2002 (GAS TURBINE / HGCU/SOFC/STEAM CYCLE) (NO CO2 SEQUESTRATION) (58% syngas to SOFC)
POWER kWGAS TURBINE -276.1 LHV EFFICIENCY 56.4 %SOFC -221.4STEAM TURBINE -207.7 HHV EFFICIENCY 54.4 %MISC 41.6AUX 19.9NET POWER -643.6
Cost of Electricity Analysis The cost of electricity was evaluated using data from the EG&G Cost Estimating notebook (version 1.11) and several contractor reports. The format follows the guidelines set by EPRI TAG. The individual section costs for each case are listed in the following COE spreadsheet summarizies and are based on capacity-factored techniques. All costs are reported in 1st Quarter 2002 dollars. . Bulk Plant Items Bulk plant items include water systems, civil/structural/architectural, piping, control and instrumentation, and electrical systems. These were calculated based on a percentage of the total installed equipment costs. The percentages in parenthesis, for coal systems, are for the hot-gas cleanup process, which has a lower water requirement, and therefore, a smaller percentage for piping and water systems. The following percentages were used in this report.
% of Installed Equipment Cost Plant Type : Natural Gas PC Plant Coal Bulk Plant Item Water Systems 7.1 6.3 5.5 (3.5) Civil/Structural/Architectural 13.9 10.0 6.2 Piping 7.1 6.3 5.5 (3.5) Control and Instrumentation 8.0 6.0 4.0 Electrical Systems 15.8 12.2 8.7
Total 51.9 40.8 29.9 (25.9)
B-3
Table 1, Table 2, and Table 3 show the assumptions used in this COE analysis.
* PPC = Process Plant Cost ** TPC = Total Plant Cost *** TPI = Total Plant Investment
Table 1. Capital Cost Assumptions Engineering Fee 10% of PPC* Project Contingency 15% of PPC Construction Period 4 Yrs (coal), 2 Yrs (NG) Inflation Rate 3% Discount Rate 11.2% Prepaid Royalties 0.5% of PPC Catalyst and Chemical Inventory 30 Dys Spare Parts 0.5% of TPC** Land 200 Acres @ $6,500/Acre Start-Up Costs Plant Modifications 2% of TPI*** Operating Costs 30 Dys Fuel Costs 7.5 Dys Working Capital Coal 60 Dys By-Product Inventory 30 Dys O&M Costs 30 Dys
B-4
Table 2. Operating & Maintenance Assumptions Consumable Material Prices Illinois #6 Coal $24.36/Ton Natural Gas $3.20 / 1000 SCF Raw Water $0.19 /Ton MDEA Solvent $1.45/Lb Claus Catalyst $470/Ton SCOT Activated Alumina $0.067/Lb Sorbent $6,000/Ton Nahcolite $275/Ton Limestone (FGD) $16/Ton Off-Site Ash/Sorbent Disposal Costs $8.00/Ton Operating Royalties 1% of Fuel Cost Operator Labor $34.00/hour Number of Shifts for Continuous Operation 4.2 Supervision and Clerical Labor 30% of O&M Labor Maintenance Costs 2.2% of TPC Insurance and Local Taxes 2% of TPC Miscellaneous Operating Costs 10% of O&M Labor Capacity Factor 85%
Discount Rate 11.2% Debt 80% of Total 9.0% Cost 7.2% Return Preferred Stock 0% of Total 0.0% Cost 0% Return Common Stock 20% of Total 20.0% Cost 4.0% Return
11.2% Total Book Life 20 Yrs Tax Life 20 Yrs State and Federal Tax Rate 38% Investment Tax Credit 0% Number of Years Levelized Cost 10 Yrs
B-5
Cost of Electricity (COE) Spreadsheet Listings
Case Page Pulverized Coal (PC) PC Steam Cycle – No CO2 Capture B-7 PC Steam Cycle – Amine CO2 Capture B-12 PC Steam Cycle – O2 Boiler / CO2 Capture B-17 Combined Cycle Natural Gas Combined Cycle (NGCC) - No CO2 Capture B-22 Natural Gas Combined Cycle (NGCC) - CO2 Capture B-27 IGCC Destec (E-GasTM) / CGCU / “G” Gas Turbine B-32 IGCC Destec (E-GasTM) / HGCU / “G” Gas Turbine B-37 IGCC Destec (E-GasTM) / CGCU / “G” Gas Turbine / CO2 Capture B-42 IGCC Shell /CGCU/“G” Gas Turbine B-47 IGCC Shell /CGCU/“G” Gas Turbine / CO2 Capture B-52 Hydraulic Air Compression (HAC) (results for closed loop water cycle) Natural Gas HAC - No CO2 Capture B-57 Natural Gas HAC - CO2 Capture B-62 Coal Syngas HAC
- Destec (E-GasTM) / CGCU / “G” GT / No CO2 Capture B-67 - Destec High Pressure (E-GasTM) / HGCU / “G” GT / CO2 Capture B-72 Rocket Engine (CES) - CO2 Capture
Natural Gas CES (gas generator) B-77 Coal Syngas CES (gas generator) – Destec HP / HGCU B-82
B-6
Case Page Hydrogen Turbine - CO2 Capture Hydrogen from Steam Methane Reforming (SMR) B-87 Destec High Pressure (E-GasTM) / HGCU / HSD B-92 Hybrid Cycles ( Turbine / SOFC) Natural Gas Hybrid Turbine/SOFC Cycle B-97 Destec (E-GasTM) / HGCU / “G” GT / No CO2 Capture B-102 Destec High Pressure (E-GasTM) / HGCU / “G” GT / CO2 Capture B-107 Destec (E-GasTM) / OTM / CGCU / “G” GT / No CO2 Capture B-112 Humid Air Turbine (HAT) Natural Gas / Pratt Whitney GT B-117 Coal Syngas / Destec (E-GasTM) / CGCU / Pratt Whitney GT B-122
B-7
Pulverized Coal (PC) PC Steam Cycle – No CO2 Capture
B-8
PULIVERIZED COAL (PC) PLANT 397 MW POWER PLANT1st Q 2002 Dollar
Total Plant Investment PROCESS PROCESS COST, K$AREA NO PLANT SECTION DESCRIPTION CONT, % CONT, K$ W/O CONT
Engineering Fees $35,366 Process Contingency (Using cont. listed) $0 Project Contingency, 15 % Proc Plt & Gen Plt Fac $53,049
Total Plant Cost (TPC) $442,075
Plant Construction Period, 3.0 Years (1 or more)Construction Interest Rate, 11.2 %Adjustment for Interest and Inflation $36,030
Total Plant Investment (TPI) $478,105
Prepaid Royalties $1,768 Initial Catalyst and Chemical Inventory $333 Startup Costs $12,273 Spare Parts $2,210 Working Capital $7,103 Land, 200 Acres $1,300
Total Capital Requirement (TCR) $503,092 $/kW 1268
Working capital Fuel & Consumables inv 60 days supply $6,211 By-Product inventory 30 days supply $0 Direct expenses 30 days $892
Total Working Capital $7,103
B. ECONOMIC ASSUMPTIONS
Project life 20 YearsBook life 20 YearsTax life 20 YearsFederal and state income tax rate 38.0 %Tax depreciation method ACRSInvestment Tax Credit 0.0 %Financial structure
% of Current Dollar Constant Dollar Type of Security Total Cost, % Ret, % Cost, % Ret, % Debt 80 9.0 7.2 5.8 4.6 Preferred Stock 0 3.0 0.0 0.0 0.0 Common Stock 20 20.0 4.0 16.5 3.3 Discount rate (cost of capital) 11.2 7.9
Inflation rate, % per year 3.0Real Escalation rates (over inflation) Fuel, % per year -1.1 Operating & Maintenance, % per year 0.0
B-11
C. COST OF ELECTRICITY
The approach to determining the cost of electricity is based upon themethodology described in the Technical Assessment Guide, published bythe Electric Power Research Institute. The cost of electricity isstated in terms of 10th year levelized dollars.
Current $ Constant $Levelizing Factors Capital Carrying Charge, 10th yr 0.179 0.148 Fuel, 10th year 1.091 0.948 Operating & Maintenance, 10th yr 1.151 1.000
Engineering Fees $47,250 Process Contingency (Using cont. listed) $0 Project Contingency, 15 % Proc Plt & Gen Plt Fac $70,875
Total Plant Cost (TPC) $590,625
Plant Construction Period, 3.0 Years (1 or more)Construction Interest Rate, 11.2 %Adjustment for Interest and Inflation $48,137
Total Plant Investment (TPI) $638,761
Prepaid Royalties $2,362 Initial Catalyst and Chemical Inventory $969 Startup Costs $16,538 Spare Parts $2,953 Working Capital $8,739 Land, 200 Acres $1,300
Total Capital Requirement (TCR) $671,624 $/kW 2373
Working capital Fuel & Consumables inv 60 days supply $7,708 By-Product inventory 30 days supply $0 Direct expenses 30 days $1,031
Total Working Capital $8,739
B. ECONOMIC ASSUMPTIONS
Project life 20 YearsBook life 20 YearsTax life 20 YearsFederal and state income tax rate 38.0 %Tax depreciation method ACRSInvestment Tax Credit 0.0 %Financial structure
% of Current Dollar Constant Dollar Type of Security Total Cost, % Ret, % Cost, % Ret, % Debt 80 9.0 7.2 5.8 4.6 Preferred Stock 0 3.0 0.0 0.0 0.0 Common Stock 20 20.0 4.0 16.5 3.3 Discount rate (cost of capital) 11.2 7.9
Inflation rate, % per year 3.0Real Escalation rates (over inflation) Fuel, % per year -1.1 Operating & Maintenance, % per year 0.0
B-16
C. COST OF ELECTRICITY
The approach to determining the cost of electricity is based upon themethodology described in the Technical Assessment Guide, published bythe Electric Power Research Institute. The cost of electricity isstated in terms of 10th year levelized dollars.
Current $ Constant $Levelizing Factors Capital Carrying Charge, 10th yr 0.179 0.148 Fuel, 10th year 1.091 0.948 Operating & Maintenance, 10th yr 1.151 1.000
Engineering Fees $47,646 Process Contingency (Using cont. listed) $0 Project Contingency, 15 % Proc Plt & Gen Plt Fac $71,468
Total Plant Cost (TPC) $595,570
Plant Construction Period, 3.0 Years (1 or more)Construction Interest Rate, 11.2 %Adjustment for Interest and Inflation $48,540
Total Plant Investment (TPI) $644,110
Prepaid Royalties $2,382 Initial Catalyst and Chemical Inventory $327 Startup Costs $15,869 Spare Parts $2,978 Working Capital $6,998 Land, 200 Acres $1,300
Total Capital Requirement (TCR) $673,964 $/kW 2259
Working capital Fuel & Consumables inv 60 days supply $5,962 By-Product inventory 30 days supply $0 Direct expenses 30 days $1,036
Total Working Capital $6,998
B. ECONOMIC ASSUMPTIONS
Project life 20 YearsBook life 20 YearsTax life 20 YearsFederal and state income tax rate 38.0 %Tax depreciation method ACRSInvestment Tax Credit 0.0 %Financial structure
% of Current Dollar Constant Dollar Type of Security Total Cost, % Ret, % Cost, % Ret, % Debt 80 9.0 7.2 5.8 4.6 Preferred Stock 0 3.0 0.0 0.0 0.0 Common Stock 20 20.0 4.0 16.5 3.3 Discount rate (cost of capital) 11.2 7.9
Inflation rate, % per year 3.0Real Escalation rates (over inflation) Fuel, % per year -1.1 Operating & Maintenance, % per year 0.0
B-21
C. COST OF ELECTRICITY
The approach to determining the cost of electricity is based upon themethodology described in the Technical Assessment Guide, published bythe Electric Power Research Institute. The cost of electricity isstated in terms of 10th year levelized dollars.
Current $ Constant $Levelizing Factors Capital Carrying Charge, 10th yr 0.179 0.148 Fuel, 10th year 1.091 0.948 Operating & Maintenance, 10th yr 1.151 1.000
Engineering Fees $12,855 Process Contingency (Using cont. listed) $4,723 Project Contingency, 15 % Proc Plt & Gen Plt Fac $19,283
Total Plant Cost (TPC) $165,412 $/kw $436
Plant Construction Period, 2.0 Years (1 or more)Construction Interest Rate, 11.2 %Adjustment for Interest and Inflation $6,567
Total Plant Investment (TPI) $171,979
Prepaid Royalties $643 Initial Catalyst and Chemical Inventory $5 Startup Costs $9,925 Spare Parts $827 Working Capital $11,705 Land, 100 Acres @ $1500/acre $150
Total Capital Requirement (TCR) $195,233 $/kW 515
B-24
ANNUAL OPERATING COSTS
Capacity Factor = 85 %
Consumables UNIT $ ANNUALCOST ITEM QUANTITY PRICE COST, K$
Natural Gas 58,760 1000 SCF/day $3.20 /1000 SCF $58,337 Water 2,263 1000 gal/day $0.80 /1000 gal $562
Working capital Fuel & Consumables inv 60 days supply $11,391 Direct expenses 30 days $314
Total Working Capital $11,705
B. ECONOMIC ASSUMPTIONS
Project life 20 YearsBook life 20 YearsTax life 20 YearsFederal and state income tax rate 38.0 %Tax depreciation method MACRSInvestment Tax Credit 0.0 %Financial structure
% of Current Dollar Constant Dollar Type of Security Total Cost, % Ret, % Cost, % Ret, % Debt 80 9.0 7.2 5.8 4.6 Preferred Stock 0 0.0 0.0 0.0 0.0 Common Stock 20 20.0 4.0 16.5 3.3 Discount rate (cost of capital) 11.2 7.9
Inflation rate, % per year 3.0Real Escalation rates (over inflation) Fuel, % per year 0.2 Operating & Maintenance, % per year 0.0
B-26
C. COST OF ELECTRICITY
The approach to determining the cost of electricity is based upon the methodology described in the Technical Assessment Guide, published by the Electric Power Research Institute.The cost of electricity is stated in terms of 10th year levelized dollars.
Current $ Constant $Levelizing Factors Capital Carrying Charge, 10th yr 0.179 0.148 Fuel, 10th year 1.162 1.010 Operating & Maintenance, 10th yr 1.151 1.000
Combined Cycle Natural Gas Combined Cycle (NGCC) - CO2 Capture
B-28
Natural Gas Combined Cycle 327 MW POWER PLANT W501G + CO2 CAPTURE 1st Q 2002 DollarTotal Plant Investment PROCESS PROCESS COST, K$AREA NO PLANT SECTION DESCRIPTION CONT, % CONT, K$ W/O CONT
15 Gas Turbine 5 $2,619 $52,38915 Steam Cycle 5 $1,872 $37,43820 Amine System 5 $3,453 $69,05320 CO2 Compression/drying 5 $526 $10,53018 Water Systems 0 $6,378 30 Civil/Structural/Architectural 0 $12,486 40 Piping 0 $6,378 50 Control/ Instrumentation 0 $7,186 60 Electrical 0 $14,193
Subtotal, Process Plant Cost $201,836
Engineering Fees $20,184 Process Contingency (Using cont. listed) $8,470 Project Contingency, 15 % Proc Plt & Gen Plt Fac $30,275
Total Plant Cost (TPC) $260,765 $/kw $798
Plant Construction Period, 2.0 Years (1 or more)Construction Interest Rate, 11.2 %Adjustment for Interest and Inflation $10,352
Total Plant Investment (TPI) $271,117
Prepaid Royalties $1,009 Initial Catalyst and Chemical Inventory $5 Startup Costs $12,264 Spare Parts $1,304 Working Capital $11,794 Land, 100 Acres @ $1500/acre $150
Total Capital Requirement (TCR) $297,643 $/kW 911
B-29
ANNUAL OPERATING COSTS
Capacity Factor = 85 %
Consumables UNIT $ ANNUALCOST ITEM QUANTITY PRICE COST, K$
Natural Gas 58,760 1000 SCF/day $3.20 /1000 SCF $58,337 Water 2,263 1000 gal/day $0.80 /1000 gallons $562 Amine Chemicals 130 ton CO2/hr $3.00 /ton CO2 Captured $2,893
Working capital Fuel & Consumables inv 60 days supply $11,391 Direct expenses 30 days $404
Total Working Capital $11,794
B. ECONOMIC ASSUMPTIONS
Project life 20 YearsBook life 20 YearsTax life 20 YearsFederal and state income tax rate 38.0 %Tax depreciation method MACRSInvestment Tax Credit 0.0 %Financial structure
% of Current Dollar Constant Dollar Type of Security Total Cost, % Ret, % Cost, % Ret, % Debt 80 9.0 7.2 5.8 4.6 Preferred Stock 0 0.0 0.0 0.0 0.0 Common Stock 20 20.0 4.0 16.5 3.3 Discount rate (cost of capital) 11.2 7.9
Inflation rate, % per year 3.0Real Escalation rates (over inflation) Fuel, % per year 0.2 Operating & Maintenance, % per year 0.0
B-31
C. COST OF ELECTRICITY
The approach to determining the cost of electricity is based upon the methodology described in the Technical Assessment Guide, published by the Electric Power Research Institute.The cost of electricity is stated in terms of 10th year levelized dollars.
Current $ Constant $Levelizing Factors Capital Carrying Charge, 10th yr 0.179 0.148 Fuel, 10th year 1.162 1.010 Operating & Maintenance, 10th yr 1.151 1.000
Engineering Fees $36,727 Process Contingency (Using cont. listed) $8,613 Project Contingency, 15 % Proc Plt & Gen Plt Fac $55,090
Total Plant Cost (TPC) $467,695
Plant Construction Period, 4.0 Years (1 or more)Construction Interest Rate, 11.2 %Adjustment for Interest and Inflation $58,710
Total Plant Investment (TPI) $526,405
Prepaid Royalties $1,836 Initial Catalyst and Chemical Inventory $69 Startup Costs $12,745 Spare Parts $2,338 Working Capital $5,719 Land, 200 Acres $1,300
Total Capital Requirement (TCR) $550,414 $/kW 1374
Working capital Fuel & Consumables inv 60 days supply $4,633 By-Product inventory 30 days supply $170 Direct expenses 30 days $916
Total Working Capital $5,719
B. ECONOMIC ASSUMPTIONS
Project life 20 YearsBook life 20 YearsTax life 20 YearsFederal and state income tax rate 38.0 %Tax depreciation method MACRSInvestment Tax Credit 0.0 %Financial structure
% of Current Dollar Constant Dollar Type of Security Total Cost, % Ret, % Cost, % Ret, % Debt 80 9.0 7.2 5.8 4.6 Preferred Stock 0 3.0 0.0 0.0 0.0 Common Stock 20 20.0 4.0 16.5 3.3 Discount rate (cost of capital) 11.2 7.9
Inflation rate, % per year 3.0Real Escalation rates (over inflation) Fuel, % per year -1.1 Operating & Maintenance, % per year 0.0
B-36
C. COST OF ELECTRICITY
The approach to determining the cost of electricity is based upon themethodology described in the Technical Assessment Guide, published bythe Electric Power Research Institute. The cost of electricity isstated in terms of 10th year levelized dollars.
Current $ Constant $Levelizing Factors Capital Carrying Charge, 10th yr 0.179 0.148 Fuel, 10th year 1.091 0.948 Operating & Maintenance, 10th yr 1.151 1.000
Destec HGCU IGCC 400 MW POWER PLANT1st Q 2002 Dollar
Total Plant Investment PROCESS PROCESS COST, K$AREA NO PLANT SECTION DESCRIPTION CONT, % CONT, K$ W/O CONT
11 Coal Slurry Preparation 0 $0 $25,91412 Oxygen Plant 0 $0 $46,75112 Destec Gasifier 5 $2,853 $57,05412 Gas Compression (Recycle and Quench) 5 $275 $5,49114 Gas Conditioning 10 $1,532 $15,32114 Air Boost Compressor 0 $0 $88214 Transport Desulfurizer 15 $1,322 $8,81514 Sulfuric Acid Plant 0 $0 $18,55415 Gas Turbine System 5 $2,868 $57,36815 HRSG/Steam Turbine 5 $2,454 $49,08218 Water Systems 0 $0 $9,983 30 Civil/Structural/Architectural 0 $0 $17,684 40 Piping 0 $0 $9,983 50 Control/ Instrumentation 0 $0 $11,409 60 Electrical 0 $0 $24,815
Subtotal, Process Plant Cost $359,109
Engineering Fees $35,911 Process Contingency (Using cont. listed) $11,304 Project Contingency, 15 % Proc Plt & Gen Plt Fac $53,866
Total Plant Cost (TPC) $460,191
Plant Construction Period, 4.0 Years (1 or more)Construction Interest Rate, 11.2 %Adjustment for Interest and Inflation $57,768
Total Plant Investment (TPI) $517,958
Prepaid Royalties $1,796 Initial Catalyst and Chemical Inventory $302 Startup Costs $12,548 Spare Parts $2,301 Working Capital $5,768 Land, 200 Acres $1,300
Total Capital Requirement (TCR) $541,973 $/kW 1354
Working capital Fuel & Consumables inv 60 days supply $4,402 By-Product inventory 30 days supply $457 Direct expenses 30 days $909
Total Working Capital $5,768
B. ECONOMIC ASSUMPTIONS
Project life 20 YearsBook life 20 YearsTax life 20 YearsFederal and state income tax rate 38.0 %Tax depreciation method MACRSInvestment Tax Credit 0.0 %Financial structure
% of Current Dollar Constant Dollar Type of Security Total Cost, % Ret, % Cost, % Ret, % Debt 80 9.0 7.2 5.8 4.6 Preferred Stock 0 3.0 0.0 0.0 0.0 Common Stock 20 20.0 4.0 16.5 3.3 Discount rate (cost of capital) 11.2 7.9
Inflation rate, % per year 3.0Real Escalation rates (over inflation) Fuel, % per year -1.1 Operating & Maintenance, % per year 0.0
B-41
C. COST OF ELECTRICITY
The approach to determining the cost of electricity is based upon themethodology described in the Technical Assessment Guide, published bythe Electric Power Research Institute. The cost of electricity isstated in terms of 10th year levelized dollars.
Current $ Constant $Levelizing Factors Capital Carrying Charge, 10th yr 0.179 0.148 Fuel, 10th year 1.091 0.948 Operating & Maintenance, 10th yr 1.151 1.000
Engineering Fees $45,675 Process Contingency (Using cont. listed) $8,511 Project Contingency, 15 % Proc Plt & Gen Plt Fac $68,512
Total Plant Cost (TPC) $579,445
Plant Construction Period, 4.0 Years (1 or more)Construction Interest Rate, 11.2 %Adjustment for Interest and Inflation $72,737
Total Plant Investment (TPI) $652,182
Prepaid Royalties $2,284 Initial Catalyst and Chemical Inventory $84 Startup Costs $15,538 Spare Parts $2,897 Working Capital $6,062 Land, 200 Acres $1,300
Total Capital Requirement (TCR) $680,347 $/kW 1897
Working capital Fuel & Consumables inv 60 days supply $4,863 By-Product inventory 30 days supply $178 Direct expenses 30 days $1,021
Total Working Capital $6,062
B. ECONOMIC ASSUMPTIONS
Project life 20 YearsBook life 20 YearsTax life 20 YearsFederal and state income tax rate 38.0 %Tax depreciation method MACRSInvestment Tax Credit 0.0 %Financial structure
% of Current Dollar Constant Dollar Type of Security Total Cost, % Ret, % Cost, % Ret, % Debt 80 9.0 7.2 5.8 4.6 Preferred Stock 0 3.0 0.0 0.0 0.0 Common Stock 20 20.0 4.0 16.5 3.3 Discount rate (cost of capital) 11.2 7.9
Inflation rate, % per year 3.0Real Escalation rates (over inflation) Fuel, % per year -1.1 Operating & Maintenance, % per year 0.0
B-46
C. COST OF ELECTRICITY
The approach to determining the cost of electricity is based upon themethodology described in the Technical Assessment Guide, published bythe Electric Power Research Institute. The cost of electricity isstated in terms of 10th year levelized dollars.
Current $ Constant $Levelizing Factors Capital Carrying Charge, 10th yr 0.179 0.148 Fuel, 10th year 1.091 0.948 Operating & Maintenance, 10th yr 1.151 1.000
Engineering Fees $37,685 Process Contingency (Using cont. listed) $9,486 Project Contingency, 15 % Proc Plt & Gen Plt Fac $56,528
Total Plant Cost (TPC) $480,549
Plant Construction Period, 4.0 Years (1 or more)Construction Interest Rate, 11.2 %Adjustment for Interest and Inflation $60,323
Total Plant Investment (TPI) $540,873
Prepaid Royalties $1,884 Initial Catalyst and Chemical Inventory $61 Startup Costs $13,039 Spare Parts $2,403 Working Capital $5,788 Land, 200 Acres $1,300
Total Capital Requirement (TCR) $565,348 $/kW 1370
Working capital Fuel & Consumables inv 60 days supply $4,685 By-Product inventory 30 days supply $175 Direct expenses 30 days $928
Total Working Capital $5,788
B. ECONOMIC ASSUMPTIONS
Project life 20 YearsBook life 20 YearsTax life 20 YearsFederal and state income tax rate 38.0 %Tax depreciation method ACRSInvestment Tax Credit 0.0 %Financial structure
% of Current Dollar Constant Dollar Type of Security Total Cost, % Ret, % Cost, % Ret, % Debt 80 9.0 7.2 5.8 4.6 Preferred Stock 0 3.0 0.0 0.0 0.0 Common Stock 20 20.0 4.0 16.5 3.3 Discount rate (cost of capital) 11.2 7.9
Inflation rate, % per year 3.0Real Escalation rates (over inflation) Fuel, % per year -1.1 Operating & Maintenance, % per year 0.0
B-51
C. COST OF ELECTRICITY
The approach to determining the cost of electricity is based upon themethodology described in the Technical Assessment Guide, published bythe Electric Power Research Institute. The cost of electricity isstated in terms of 10th year levelized dollars.
Current $ Constant $Levelizing Factors Capital Carrying Charge, 10th yr 0.179 0.148 Fuel, 10th year 1.091 0.948 Operating & Maintenance, 10th yr 1.151 1.000
Engineering Fees $51,744 Process Contingency (Using cont. listed) $33,498 Project Contingency, 15 % Proc Plt & Gen Plt Fac $77,616
Total Plant Cost (TPC) $680,297
Plant Construction Period, 4.0 Years (1 or more)Construction Interest Rate, 11.2 %Adjustment for Interest and Inflation $85,397
Total Plant Investment (TPI) $765,695
Prepaid Royalties $2,587 Initial Catalyst and Chemical Inventory $76 Startup Costs $17,972 Spare Parts $3,401 Working Capital $6,011 Land, 200 Acres $1,300
Total Capital Requirement (TCR) $797,043 $/kW 2270
Working capital Fuel & Consumables inv 60 days supply $4,720 By-Product inventory 30 days supply $175 Direct expenses 30 days $1,116
Total Working Capital $6,011
B. ECONOMIC ASSUMPTIONS
Project life 20 YearsBook life 20 YearsTax life 20 YearsFederal and state income tax rate 38.0 %Tax depreciation method ACRSInvestment Tax Credit 0.0 %Financial structure
% of Current Dollar Constant Dollar Type of Security Total Cost, % Ret, % Cost, % Ret, % Debt 80 9.0 7.2 5.8 4.6 Preferred Stock 0 3.0 0.0 0.0 0.0 Common Stock 20 20.0 4.0 16.5 3.3 Discount rate (cost of capital) 11.2 7.9
Inflation rate, % per year 3.0Real Escalation rates (over inflation) Fuel, % per year -1.1 Operating & Maintenance, % per year 0.0
B-56
C. COST OF ELECTRICITY
The approach to determining the cost of electricity is based upon themethodology described in the Technical Assessment Guide, published bythe Electric Power Research Institute. The cost of electricity isstated in terms of 10th year levelized dollars.
Current $ Constant $Levelizing Factors Capital Carrying Charge, 10th yr 0.179 0.148 Fuel, 10th year 1.091 0.948 Operating & Maintenance, 10th yr 1.151 1.000
Engineering Fees $13,453 Process Contingency (Using cont. listed) $19,739 Project Contingency, 15 % Proc Plt & Gen Plt Fac $20,179
Total Plant Cost (TPC) $187,897
Plant Construction Period, 2.0 Years (1 or more)Construction Interest Rate, 11.2 %Adjustment for Interest and Inflation $7,460
Total Plant Investment (TPI) $195,357
Prepaid Royalties $673 Initial Catalyst and Chemical Inventory $68 Startup Costs $10,822 Spare Parts $939 Working Capital $12,417 Land, 100 Acres @ $1500/acre $150
Total Capital Requirement (TCR) $220,425 $/kW 681
B-59
ANNUAL OPERATING COSTS
Capacity Factor = 85 %UNIT $ ANNUAL
Consumables UNIT $ ANNUALCOST ITEM QUANTITY PRICE COST, K$
Natural Gas 54,568 1000 SCF/D $3.20 $/1000 SCF $54,175 Water 562,826 T/d $0.05 /T $8,294
Working capital Fuel & Consumables inv 60 days supply $12,081 Direct expenses 30 days $335
Total Working Capital $12,417
B. ECONOMIC ASSUMPTIONS
Project life 20 YearsBook life 20 YearsTax life 20 YearsFederal and state income tax rate 38.0 %Tax depreciation method MACRSInvestment Tax Credit 0.0 %Financial structure
% of Current Dollar Constant Dollar Type of Security Total Cost, % Ret, % Cost, % Ret, % Debt 80 9.0 7.2 5.8 4.6 Preferred Stock 0 0.2 0.0 0.0 0.0 Common Stock 20 20.0 4.0 16.5 3.3 Discount rate (cost of capital) 11.2 7.9
Inflation rate, % per year 3.0Real Escalation rates (over inflation) Fuel, % per year 0.2 Operating & Maintenance, % per year 0.0
B-61
C. COST OF ELECTRICITY
The approach to determining the cost of electricity is based upon the methodologydescribed in the Technical Assessment Guide, published by the Electric PowerResearch Institute. The cost of electricity is stated in terms of 10th yearlevelized dollars.
Current $ Constant $Levelizing Factors Capital Carrying Charge, 10th yr 0.179 0.148 Fuel, 10th year 1.162 1.010 Operating & Maintenance, 10th yr 1.151 1.000
Engineering Fees $22,379 Process Contingency (Using cont. listed) $19,739 Project Contingency, 15 % Proc Plt & Gen Plt Fac $33,568
Total Plant Cost (TPC) $299,471
Plant Construction Period, 2.0 Years (1 or more)Construction Interest Rate, 11.2 %Adjustment for Interest and Inflation $11,889
Total Plant Investment (TPI) $311,360
Prepaid Royalties $1,119 Initial Catalyst and Chemical Inventory $68 Startup Costs $14,219 Spare Parts $1,497 Working Capital $13,841 Land, 100 Acres @ $1500/acre $150
Total Capital Requirement (TCR) $342,254 $/kW 1140
B-64
ANNUAL OPERATING COSTS
Capacity Factor = 85 %UNIT $ ANNUAL
Consumables UNIT $ ANNUALCOST ITEM QUANTITY PRICE COST, K$
Natural Gas 61,439 1000 SCF/D $3.20 $/1000 SCF $60,997 Water 562,826 T/d $0.05 /T $8,294 Amine Chemicals 141 ton CO2/hr $3.00 /ton CO2 Captured $3,147
Working capital Fuel & Consumables inv 60 days supply $13,400 Direct expenses 30 days $440
Total Working Capital $13,841
B. ECONOMIC ASSUMPTIONS
Project life 20 YearsBook life 20 YearsTax life 20 YearsFederal and state income tax rate 38.0 %Tax depreciation method MACRSInvestment Tax Credit 0.0 %Financial structure
% of Current Dollar Constant Dollar Type of Security Total Cost, % Ret, % Cost, % Ret, % Debt 80 9.0 7.2 5.8 4.6 Preferred Stock 0 0.2 0.0 0.0 0.0 Common Stock 20 20.0 4.0 16.5 3.3 Discount rate (cost of capital) 11.2 7.9
Inflation rate, % per year 3.0Real Escalation rates (over inflation) Fuel, % per year 0.2 Operating & Maintenance, % per year 0.0
B-66
C. COST OF ELECTRICITY
The approach to determining the cost of electricity is based upon the methodologydescribed in the Technical Assessment Guide, published by the Electric PowerResearch Institute. The cost of electricity is stated in terms of 10th yearlevelized dollars.
Current $ Constant $Levelizing Factors Capital Carrying Charge, 10th yr 0.179 0.148 Fuel, 10th year 1.162 1.010 Operating & Maintenance, 10th yr 1.151 1.000
Engineering Fees $29,956 Process Contingency (Using cont. listed) $22,267 Project Contingency, 15 % Proc Plt & Gen Plt Fac $44,935
Total Plant Cost (TPC) $396,723
Plant Construction Period, 4.0 Years (1 or more)Construction Interest Rate, 11.2 %Adjustment for Interest and Inflation $49,800
Total Plant Investment (TPI) $446,523
Prepaid Royalties $1,498 Initial Catalyst and Chemical Inventory $806 Startup Costs $10,908 Spare Parts $1,984 Working Capital $5,022 Land, 200 Acres $1,300
Total Capital Requirement (TCR) $468,041 $/kW 1436
Working capital Fuel & Consumables inv 60 days supply $4,026 By-Product inventory 30 days supply $147 Direct expenses 30 days $849
Total Working Capital $5,022
B. ECONOMIC ASSUMPTIONS
Project life 20 YearsBook life 20 YearsTax life 20 YearsFederal and state income tax rate 38.0 %Tax depreciation method MACRSInvestment Tax Credit 0.0 %Financial structure
% of Current Dollar Constant Dollar Type of Security Total Cost, % Ret, % Cost, % Ret, % Debt 80 9.0 7.2 5.8 4.6 Preferred Stock 0 3.0 0.0 0.0 0.0 Common Stock 20 20.0 4.0 16.5 3.3 Discount rate (cost of capital) 11.2 7.9
Inflation rate, % per year 3.0Real Escalation rates (over inflation) Fuel, % per year -1.1 Operating & Maintenance, % per year 0.0
B-71
C. COST OF ELECTRICITY
The approach to determining the cost of electricity is based upon themethodology described in the Technical Assessment Guide, published bythe Electric Power Research Institute. The cost of electricity isstated in terms of 10th year levelized dollars.
Current $ Constant $Levelizing Factors Capital Carrying Charge, 10th yr 0.179 0.148 Fuel, 10th year 1.091 0.948 Operating & Maintenance, 10th yr 1.151 1.000
Engineering Fees $44,457 Process Contingency (Using cont. listed) $25,119 Project Contingency, 15 % Proc Plt & Gen Plt Fac $66,686
Total Plant Cost (TPC) $580,833
Plant Construction Period, 4.0 Years (1 or more)Construction Interest Rate, 11.2 %Adjustment for Interest and Inflation $72,912
Total Plant Investment (TPI) $653,745
Prepaid Royalties $2,223 Initial Catalyst and Chemical Inventory $1,710 Startup Costs $15,587 Spare Parts $2,904 Working Capital $6,366 Land, 200 Acres $1,300
Total Capital Requirement (TCR) $683,834 $/kW 2189
Water 122909 T $0.19 /T $23 HAC Makeup Water 17166600 T $0.05 /T $815 HGCU Sorbent 15 T $6,000 /T $16 Nahcolite 59 T $275 /T $855 Total Catalyst and Chemical Inventory $1,710
Working capital Fuel & Consumables inv 60 days supply $4,835 By-Product inventory 30 days supply $509 Direct expenses 30 days $1,022
Total Working Capital $6,366
B. ECONOMIC ASSUMPTIONS
Project life 20 YearsBook life 20 YearsTax life 20 YearsFederal and state income tax rate 38.0 %Tax depreciation method MACRSInvestment Tax Credit 0.0 %Financial structure
% of Current Dollar Constant Dollar Type of Security Total Cost, % Ret, % Cost, % Ret, % Debt 80 9.0 7.2 5.8 4.6 Preferred Stock 0 3.0 0.0 0.0 0.0 Common Stock 20 20.0 4.0 16.5 3.3 Discount rate (cost of capital) 11.2 7.9
Inflation rate, % per year 3.0Real Escalation rates (over inflation) Fuel, % per year -1.1 Operating & Maintenance, % per year 0.0
B-76
C. COST OF ELECTRICITY
The approach to determining the cost of electricity is based upon themethodology described in the Technical Assessment Guide, published bythe Electric Power Research Institute. The cost of electricity isstated in terms of 10th year levelized dollars.
Current $ Constant $Levelizing Factors Capital Carrying Charge, 10th yr 0.179 0.148 Fuel, 10th year 1.091 0.948 Operating & Maintenance, 10th yr 1.151 1.000
Engineering Fees $26,980 Process Contingency (Using cont. listed) $9,982 Project Contingency, 15 % Proc Plt & Gen Plt Fac $40,469
Total Plant Cost (TPC) $347,228
Plant Construction Period, 3.0 Years (1 or more)Construction Interest Rate, 11.2 %Adjustment for Interest and Inflation $28,300
Total Plant Investment (TPI) $375,527
Prepaid Royalties $1,349 Initial Catalyst and Chemical Inventory $16 Startup Costs $8,662 Spare Parts $1,736 Working Capital $697 Land, 200 Acres @ $1500/acre $300
Working capital Fuel & Consumables inv 60 days supply $53 By-Product inventory 30 days supply $0 Direct expenses 30 days $644
Total Working Capital $697
B. ECONOMIC ASSUMPTIONS
Project life 20 YearsBook life 20 YearsTax life 20 YearsFederal and state income tax rate 38.0 %Tax depreciation method MACRSInvestment Tax Credit 0.0 %Financial structure
% of Current Dollar Constant Dollar Type of Security Total Cost, % Ret, % Cost, % Ret, % Debt 80 9.0 7.2 5.8 4.6 Preferred Stock 0 3.0 0.0 0.0 0.0 Common Stock 20 20.0 4.0 16.5 3.3 Discount rate (cost of capital) 11.2 7.9
Inflation rate, % per year 3.0Real Escalation rates (over inflation) Fuel, % per year 0.2 Operating & Maintenance, % per year 0.0
B-81
C. COST OF ELECTRICITY
The approach to determining the cost of electricity is based upon themethodology described in the Technical Assessment Guide, published bythe Electric Power Research Institute. The cost of electricity isstated in terms of 10th year levelized dollars.
Current $ Constant $Levelizing Factors Capital Carrying Charge, 10th yr 0.179 0.148 Fuel, 10th year 1.162 1.010 Operating & Maintenance, 10th yr 1.151 1.000
Engineering Fees $47,374 Process Contingency (Using cont. listed) $20,224 Project Contingency, 15 % Proc Plt & Gen Plt Fac $71,061
Total Plant Cost (TPC) $612,402
Plant Construction Period, 4.0 Years (1 or more)Construction Interest Rate, 11.2 %Adjustment for Interest and Inflation $76,875
Total Plant Investment (TPI) $689,276
Prepaid Royalties $2,369 Initial Catalyst and Chemical Inventory $122 Startup Costs $16,319 Spare Parts $3,062 Working Capital $6,898 Land, 200 Acres @ $1500/acre $300
Total Capital Requirement (TCR) $718,346 $/kW 1768
Working capital Fuel & Consumables inv 60 days supply $5,283 By-Product inventory 30 days supply $563 Direct expenses 30 days $1,052
Total Working Capital $6,898
B. ECONOMIC ASSUMPTIONS
Project life 20 YearsBook life 20 YearsTax life 20 YearsFederal and state income tax rate 38.0 %Tax depreciation method MACRSInvestment Tax Credit 0.0 %Financial structure
% of Current Dollar Constant Dollar Type of Security Total Cost, % Ret, % Cost, % Ret, % Debt 80 9.0 7.2 5.8 4.6 Preferred Stock 0 3.0 0.0 0.0 0.0 Common Stock 20 20.0 4.0 16.5 3.3 Discount rate (cost of capital) 11.2 7.9
Inflation rate, % per year 3.0Real Escalation rates (over inflation) Fuel, % per year -1.1 Operating & Maintenance, % per year 0.0
B-86
C. COST OF ELECTRICITY
The approach to determining the cost of electricity is based upon themethodology described in the Technical Assessment Guide, published bythe Electric Power Research Institute. The cost of electricity isstated in terms of 10th year levelized dollars.
Current $ Constant $Levelizing Factors Capital Carrying Charge, 10th yr 0.179 0.148 Fuel, 10th year 1.091 0.948 Operating & Maintenance, 10th yr 1.151 1.000
Engineering Fees $37,681 Process Contingency (Using cont. listed) $13,461 Project Contingency, 15 % Proc Plt & Gen Plt Fac $56,522
Total Plant Cost (TPC) $484,476
Plant Construction Period, 2.0 Years (1 or more)Construction Interest Rate, 11.2 %Adjustment for Interest and Inflation $19,234
Total Plant Investment (TPI) $503,710
Prepaid Royalties $1,884 Initial Catalyst and Chemical Inventory $4 Startup Costs $20,643 Spare Parts $2,422 Working Capital $17,602 Land, 100 Acres @ $1500/acre $150
Total Capital Requirement (TCR) $546,415 $/kW 1323
B-89
ANNUAL OPERATING COSTS
Capacity Factor = 85 %UNIT $ ANNUAL
Consumables UNIT $ ANNUALCOST ITEM QUANTITY PRICE COST, K$
Natural Gas 86,047 MMBtu/D $3.24 $/MMBtu $86,538 Water 8,175 T/d $0.19 /T $482
Working capital Fuel & Consumables inv 60 days supply $16,829 Direct expenses 30 days $773
Total Working Capital $17,602
B. ECONOMIC ASSUMPTIONS
Project life 20 YearsBook life 20 YearsTax life 20 YearsFederal and state income tax rate 38.0 %Tax depreciation method MACRSInvestment Tax Credit 0.0 %Financial structure
% of Current Dollar Constant Dollar Type of Security Total Cost, % Ret, % Cost, % Ret, % Debt 80 9.0 7.2 5.8 4.6 Preferred Stock 0 0.2 0.0 0.0 0.0 Common Stock 20 20.0 4.0 16.5 3.3 Discount rate (cost of capital) 11.2 7.9
Inflation rate, % per year 3.0Real Escalation rates (over inflation) Fuel, % per year 0.2 Operating & Maintenance, % per year 0.0
B-91
C. COST OF ELECTRICITY
The approach to determining the cost of electricity is based upon the methodologydescribed in the Technical Assessment Guide, published by the Electric PowerResearch Institute. The cost of electricity is stated in terms of 10th yearlevelized dollars.
Current $ Constant $Levelizing Factors Capital Carrying Charge, 10th yr 0.179 0.148 Fuel, 10th year 1.162 1.010 Operating & Maintenance, 10th yr 1.151 1.000
Engineering Fees $47,678 Process Contingency (Using cont. listed) $15,139 Project Contingency, 15 % Proc Plt & Gen Plt Fac $71,517
Total Plant Cost (TPC) $611,116
Plant Construction Period, 4.0 Years (1 or more)Construction Interest Rate, 11.2 %Adjustment for Interest and Inflation $76,713
Total Plant Investment (TPI) $687,829
Prepaid Royalties $2,384 Initial Catalyst and Chemical Inventory $132 Startup Costs $16,375 Spare Parts $3,056 Working Capital $6,922 Land, 200 Acres @ $1500/acre $300
Total Capital Requirement (TCR) $716,998 $/kW 1909
Working capital Fuel & Consumables inv 60 days supply $5,308 By-Product inventory 30 days supply $563 Direct expenses 30 days $1,051
Total Working Capital $6,922
B. ECONOMIC ASSUMPTIONS
Project life 20 YearsBook life 20 YearsTax life 20 YearsFederal and state income tax rate 38.0 %Tax depreciation method MACRSInvestment Tax Credit 0.0 %Financial structure
% of Current Dollar Constant Dollar Type of Security Total Cost, % Ret, % Cost, % Ret, % Debt 80 9.0 7.2 5.8 4.6 Preferred Stock 0 3.0 0.0 0.0 0.0 Common Stock 20 20.0 4.0 16.5 3.3 Discount rate (cost of capital) 11.2 7.9
Inflation rate, % per year 3.0Real Escalation rates (over inflation) Fuel, % per year -1.1 Operating & Maintenance, % per year 0.0
B-96
C. COST OF ELECTRICITY
The approach to determining the cost of electricity is based upon themethodology described in the Technical Assessment Guide, published bythe Electric Power Research Institute. The cost of electricity isstated in terms of 10th year levelized dollars.
Current $ Constant $Levelizing Factors Capital Carrying Charge, 10th yr 0.179 0.148 Fuel, 10th year 1.091 0.948 Operating & Maintenance, 10th yr 1.151 1.000
Project life 20 YearsBook life 20 YearsTax life 20 YearsFederal and state income tax rate 38.0 %Tax depreciation method MACRSInvestment Tax Credit 0.0 %Financial structure
% of Current Dollar Constant Dollar Type of Security Total Cost, % Ret, % Cost, % Ret, % Debt 80 9.0 7.2 5.8 4.6 Preferred Stock 0 3.0 0.0 0.0 0.0 Common Stock 20 20.0 4.0 16.5 3.3 Discount rate (cost of capital) 11.2 7.9
Inflation rate, % per year 3.0Real Escalation rates (over inflation) Fuel, % per year 0.2 Operating & Maintenance, % per year 0.0
B-101
C. COST OF ELECTRICITY
The approach to determining the cost of electricity is based upon themethodology described in the Technical Assessment Guide, published bythe Electric Power Research Institute. The cost of electricity isstated in terms of 10th year levelized dollars.
Current $ Constant $Levelizing Factors Capital Carrying Charge, 10th yr 0.179 0.148 Fuel, 10th year 1.162 1.010 Operating & Maintenance, 10th yr 1.151 1.000
Engineering Fees $65,151 Process Contingency (Using cont. listed) $13,157 Project Contingency, 15 % Proc Plt & Gen Plt Fac $97,726
Total Plant Cost (TPC) $827,543
Plant Construction Period, 4.0 Years (1 or more)Construction Interest Rate, 11.2 %Adjustment for Interest and Inflation $103,881
Total Plant Investment (TPI) $931,424
Prepaid Royalties $3,258 Initial Catalyst and Chemical Inventory $430 Startup Costs $21,871 Spare Parts $4,138 Working Capital $8,085 Land, 200 Acres $1,300
Total Capital Requirement (TCR) $970,505 $/kW 1508
Working capital Fuel & Consumables inv 60 days supply $6,184 By-Product inventory 30 days supply $646 Direct expenses 30 days $1,254
Total Working Capital $8,085
B. ECONOMIC ASSUMPTIONS
Project life 20 YearsBook life 20 YearsTax life 20 YearsFederal and state income tax rate 38.0 %Tax depreciation method MACRSInvestment Tax Credit 0.0 %Financial structure
% of Current Dollar Constant Dollar Type of Security Total Cost, % Ret, % Cost, % Ret, % Debt 80 9.0 7.2 5.8 4.6 Preferred Stock 0 3.0 0.0 0.0 0.0 Common Stock 20 20.0 4.0 16.5 3.3 Discount rate (cost of capital) 11.2 7.9
Inflation rate, % per year 3.0Real Escalation rates (over inflation) Fuel, % per year -1.1 Operating & Maintenance, % per year 0.0
B-106
C. COST OF ELECTRICITY
The approach to determining the cost of electricity is based upon themethodology described in the Technical Assessment Guide, published bythe Electric Power Research Institute. The cost of electricity isstated in terms of 10th year levelized dollars.
Current $ Constant $Levelizing Factors Capital Carrying Charge, 10th yr 0.179 0.148 Fuel, 10th year 1.091 0.948 Operating & Maintenance, 10th yr 1.151 1.000
Engineering Fees $92,592 Process Contingency (Using cont. listed) $16,426 Project Contingency, 15 % Proc Plt & Gen Plt Fac $138,889
Total Plant Cost (TPC) $1,173,833
Plant Construction Period, 4.0 Years (1 or more)Construction Interest Rate, 11.2 %Adjustment for Interest and Inflation $147,351
Total Plant Investment (TPI) $1,321,183
Prepaid Royalties $4,630 Initial Catalyst and Chemical Inventory $195 Startup Costs $30,701 Spare Parts $5,869 Working Capital $10,651 Land, 200 Acres $1,300
Total Capital Requirement (TCR) $1,374,529 $/kW 1822
Working capital Fuel & Consumables inv 60 days supply $8,199 By-Product inventory 30 days supply $872 Direct expenses 30 days $1,580
Total Working Capital $10,651
B. ECONOMIC ASSUMPTIONS
Project life 20 YearsBook life 20 YearsTax life 20 YearsFederal and state income tax rate 38.0 %Tax depreciation method MACRSInvestment Tax Credit 0.0 %Financial structure
% of Current Dollar Constant Dollar Type of Security Total Cost, % Ret, % Cost, % Ret, % Debt 80 9.0 7.2 5.8 4.6 Preferred Stock 0 3.0 0.0 0.0 0.0 Common Stock 20 20.0 4.0 16.5 3.3 Discount rate (cost of capital) 11.2 7.9
Inflation rate, % per year 3.0Real Escalation rates (over inflation) Fuel, % per year -1.1 Operating & Maintenance, % per year 0.0
B-111
C. COST OF ELECTRICITY
The approach to determining the cost of electricity is based upon themethodology described in the Technical Assessment Guide, published bythe Electric Power Research Institute. The cost of electricity isstated in terms of 10th year levelized dollars.
Current $ Constant $Levelizing Factors Capital Carrying Charge, 10th yr 0.179 0.148 Fuel, 10th year 1.091 0.948 Operating & Maintenance, 10th yr 1.151 1.000
Working capital Fuel & Consumables inv 60 days supply $6,396 By-Product inventory 30 days supply $239 Direct expenses 30 days $1,202
Total Working Capital $7,836
ECONOMIC ASSUMPTIONS
Project life 20 YearsBook life 20 YearsTax life 20 YearsFederal and state income tax rate 38.0 %Tax depreciation method ACRSInvestment Tax Credit 0.0 %Financial structure
% of Current Dollar Constant Dollar Type of Security Total Cost, % Ret, % Cost, % Ret, % Debt 80 9.0 7.2 5.8 4.6 Preferred Stock 0 3.0 0.0 0.0 0.0 Common Stock 20 20.0 4.0 16.5 3.3 Discount rate (cost of capital) 11.2 7.9
Inflation rate, % per year 3.0Real Escalation rates (over inflation) Fuel, % per year -1.1 Operating & Maintenance, % per year 0.0
B-116
COST OF ELECTRICITYThe approach to determining the cost of electricity is based upon the methodologydescribed in the Technical Assessment Guide, published by the Electric PowerResearch Institute, The cost of electricity is stated in terms of 10th year levelized dollars.
Current $ Constant $Levelizing Factors Capital Carrying Charge, 10th yr 0.179 0.148 Fuel, 10th year 1.091 0.948 Operating & Maintenance, 10th yr 1.151 1.000
Humid Air Turbine (HAT) Natural Gas / Pratt Whitney GT
B-118
Natural Gas HAT 319 MW POWER PLANT1st Q 2002 Dollar
Total Plant Investment PROCESS PROCESS COST, K$AREA NO PLANT SECTION DESCRIPTION CONT, % CONT, K$ W/O CONT
15 HAT Gas Turbine 10 $8,822 $88,22415 HAT Heat Recovery 10 $2,399 $23,99315 HAT Air Saturator 10 $740 $7,40218 Water Systems 0 $0 $8,493 30 Civil/Structural/Architectural 0 $0 $16,627 40 Piping 0 $0 $8,493 50 Control/ Instrumentation 0 $0 $9,569 60 Electrical 0 $0 $18,900
Subtotal, Process Plant Cost $181,701
Engineering Fees $18,170 Process Contingency (Using cont. listed) $11,962 Project Contingency, 15 % Proc Plt & Gen Plt Fac $27,255
Total Plant Cost (TPC) $239,088
Plant Construction Period, 3.0 Years (1 or more)Construction Interest Rate, 11.2 %Adjustment for Interest and Inflation $19,486
Total Plant Investment (TPI) $258,574
Prepaid Royalties $909 Initial Catalyst and Chemical Inventory $0 Startup Costs $7,288 Spare Parts $1,195 Working Capital $10,178 Land, 100 Acres @ $1500/acre $150
Working capital Fuel & Consumables inv 60 days supply $9,636 By-Product inventory 30 days supply $0 Direct expenses 30 days $542
Total Working Capital $10,178
B. ECONOMIC ASSUMPTIONS
Project life 20 YearsBook life 20 YearsTax life 20 YearsFederal and state income tax rate 38.0 %Tax depreciation method MACRSInvestment Tax Credit 0.0 %Financial structure
% of Current Dollar Constant Dollar Type of Security Total Cost, % Ret, % Cost, % Ret, % Debt 80 9.0 7.2 5.8 4.6 Preferred Stock 0 3.0 0.0 0.0 0.0 Common Stock 20 20.0 4.0 16.5 3.3 Discount rate (cost of capital) 11.2 7.9
Inflation rate, % per year 3.0Real Escalation rates (over inflation) Fuel, % per year 0.2 Operating & Maintenance, % per year 0.0
B-121
C. COST OF ELECTRICITY
The approach to determining the cost of electricity is based upon themethodology described in the Technical Assessment Guide, published bythe Electric Power Research Institute. The cost of electricity isstated in terms of 10th year levelized dollars.
Current $ Constant $Levelizing Factors Capital Carrying Charge, 10th yr 0.179 0.148 Fuel, 10th year 1.162 1.010 Operating & Maintenance, 10th yr 1.151 1.000
Destec Coal IGHAT 407 MW POWER PLANT1st Q 2002 Dollar
Total Plant Investment PROCESS PROCESS COST, K$AREA NO PLANT SECTION DESCRIPTION CONT, % CONT, K$ W/O CONT
11 Coal Slurry Preparation 0 $0 $28,07312 Oxygen Plant 0 $0 $46,46012 Destec Gasifier 5 $1,378 $27,55512 Recycle Gas Compressor 0 $0 $1,91412 Syngas Cooler/ Fuel Reheater/ Cyclone 0 $0 $3,88114 Low Temperature Gas Treatment 0 $0 $9,91114 MDEA/Claus/SCOT 0 $0 $19,78514 Clean Fuel Compressor 0 $0 $10,93615 HAT Gas Turbine 10 $10,803 $108,03115 HAT Heat Recovery 10 $2,770 $27,70115 HAT Air Saturator 10 $740 $7,40518 Water Systems 0 $0 $16,041 30 Civil/Structural/Architectural 0 $0 $18,082 40 Piping 0 $0 $16,041 50 Control/ Instrumentation 0 $0 $11,666 60 Electrical 0 $0 $25,374
Subtotal, Process Plant Cost $378,855
Engineering Fees $37,886 Process Contingency (Using cont. listed) $15,691 Project Contingency, 15 % Proc Plt & Gen Plt Fac $56,828
Total Plant Cost (TPC) $489,261
Plant Construction Period, 4.0 Years (1 or more)Construction Interest Rate, 11.2 %Adjustment for Interest and Inflation $61,417
Total Plant Investment (TPI) $550,677
Prepaid Royalties $1,894 Initial Catalyst and Chemical Inventory $120 Startup Costs $13,347 Spare Parts $2,446 Working Capital $6,131 Land, 200 Acres @ $1500/acre $300
Total Capital Requirement (TCR) $574,915 $/kW 1411
Working capital Fuel & Consumables inv 60 days supply $5,011 By-Product inventory 30 days supply $184 Direct expenses 30 days $936
Total Working Capital $6,131
B. ECONOMIC ASSUMPTIONS
Project life 20 YearsBook life 20 YearsTax life 20 YearsFederal and state income tax rate 38.0 %Tax depreciation method MACRSInvestment Tax Credit 0.0 %Financial structure
% of Current Dollar Constant Dollar Type of Security Total Cost, % Ret, % Cost, % Ret, % Debt 80 9.0 7.2 5.8 4.6 Preferred Stock 0 3.0 0.0 0.0 0.0 Common Stock 20 20.0 4.0 16.5 3.3 Discount rate (cost of capital) 11.2 7.9
Inflation rate, % per year 3.0Real Escalation rates (over inflation) Fuel, % per year -1.1 Operating & Maintenance, % per year 0.0
B-126
C. COST OF ELECTRICITY
The approach to determining the cost of electricity is based upon themethodology described in the Technical Assessment Guide, published bythe Electric Power Research Institute. The cost of electricity isstated in terms of 10th year levelized dollars.
Current $ Constant $Levelizing Factors Capital Carrying Charge, 10th yr 0.179 0.148 Fuel, 10th year 1.091 0.948 Operating & Maintenance, 10th yr 1.151 1.000
NATURAL GAS – assumed 100% Methane for ASPEN simulation.
D-1
APPENDIX D – VISION 21 GOALS Goals
The primary goal of the Vision 21 Program is to effectively remove all environmental concerns associated with the use of fossil fuels for producing electricity, transportation fuels, and high-value chemicals. This goal is to be accomplished at competitive costs. The specific performance targets, costs, and timing for Vision 21 plants are shown below. Vision 21 Energy Plant Performance Targets
Efficiency - Electricity Generation:
• 60% for coal-based systems (HHV) • 75% for natural gas-based systems (LHV)
Efficiency - Combined Heat & Power:
• Overall thermal efficiency above 85% (HHV); also meets efficiency goals for electricity (based on fuel)
Efficiency - Fuels Only Plant:
• 75% feedstock utilization efficiency (LHV) when producing fuels such as H2 or liquid transportation fuels alone from coal
Environmental:
• Atmospheric release of near zero emissions of - sulfur - nitrogen oxides - particulate matter - trace elements and organic compounds or liquid transportation fuels alone from coal
• 40-50% reduction of CO2 emissions by efficiency improvement - 100% reduction with sequestration
Costs:
• Aggressive targets for capital and operating costs and RAM (reliability, availability, and maintenance). Cost of electricity 10% lower than conventional systems
• Products of Vision 21 plants must be cost-competitive with other energy subsystems with comparable environmental performance, including specific carbon emissions
Timing:
• Major benefits from improved technologies begin by 2005 • Designs for most Vision 21 subsystems and modules available by 2012 • Vision 21 commercial plant designs available by 2015