Internal report not for distribution. If quoted use the web (http://www.aquanovaLLC.com) as the source. 1 Advanced (hyper) eutrophication and harmful algal blooms in impoundments – watershed managers’ dilemma and puzzle (Review) Vladimir Novotny 1 Abstract: As a result of the intensification of agriculture, use of phosphate detergents and implementing sewerage in growing communities over the last fifty years, nutrient loads to receiving surface and groundwater have, in the second half of the last century, dramatically increased throughout the world, creating eutrophic and hypereutrophic water quality in lakes and reservoirs providing water supply to communities, recreation, fishing and other benefits. The hypereutrophic status is often exhibited by harmful algal blooms of cyanobacteria (Cyano-HAB) which are becoming endemic in Europe, Asia and also in the US. High nitrate loads are one of the cause of hypereutrophication; however, they also appear to suppress internal phosphate loading from sediments. The processes of in the water/sediment interface are described and a potential effect of denitrification on carbon sequestering is outlined. The key processes in many hypereutrophic water bodies occur in sediments which may contain orders of magnitude larger concentrations of hibernating cyanobacteria than those in the water column during the bloom. Also the phosphate content in the sediment of hypereutrophic impoundments may exceed by orders of magnitude the quantity in the incoming external annual load. The key processes in sediments affecting internal loads are denitrification, anaerobic digestion, reduction of iron and aluminum phosphate compounds and reduction of sulfate to sulfide. The last process is also responsible for formation of methyl mercury. New models need to be developed and the strategy of mitigation practices has to be reevaluated. Possible strategies are outlined. Key Words: Eutrophication; Hypereutrophic conditions; Harmful algal blooms; Agriculture effects; Nitrogen; Nutrient inputs; Phosphorus; Total maximum daily load; Greenhouse gas emissions; Nitrate pollution control; Nitrate layer; Boundary layers; Wetlands; Nitrification; Denitrification; Sulfate; Reduction processes in sediments; 1 Professor Emeritus Marquette University (Milwaukee, WI) and Northeastern University (Boston, MA); Managing Partner AquaNova LLC, [email protected]
Transcript
Internal report not for distribution. If quoted use the web (http://www.aquanovaLLC.com) as the source.
1
Advanced (hyper) eutrophication and harmful algal blooms inimpoundments – watershed managers’ dilemma and puzzle
(Review)
Vladimir Novotny1
Abstract: As a result of the intensification of agriculture, use of phosphate detergents
and implementing sewerage in growing communities over the last fifty years, nutrient
loads to receiving surface and groundwater have, in the second half of the last century,
dramatically increased throughout the world, creating eutrophic and hypereutrophic water
quality in lakes and reservoirs providing water supply to communities, recreation, fishing
and other benefits. The hypereutrophic status is often exhibited by harmful algal blooms
of cyanobacteria (Cyano-HAB) which are becoming endemic in Europe, Asia and also in
the US. High nitrate loads are one of the cause of hypereutrophication; however, they
also appear to suppress internal phosphate loading from sediments. The processes of in
the water/sediment interface are described and a potential effect of denitrification on
carbon sequestering is outlined. The key processes in many hypereutrophic water bodies
occur in sediments which may contain orders of magnitude larger concentrations of
hibernating cyanobacteria than those in the water column during the bloom. Also the
phosphate content in the sediment of hypereutrophic impoundments may exceed by
orders of magnitude the quantity in the incoming external annual load. The key processes
in sediments affecting internal loads are denitrification, anaerobic digestion, reduction of
iron and aluminum phosphate compounds and reduction of sulfate to sulfide. The last
process is also responsible for formation of methyl mercury. New models need to be
developed and the strategy of mitigation practices has to be reevaluated. Possible
Agriculture effects; Nitrogen; Nutrient inputs; Phosphorus; Total maximum daily load;
Greenhouse gas emissions; Nitrate pollution control; Nitrate layer; Boundary layers;
Wetlands; Nitrification; Denitrification; Sulfate; Reduction processes in sediments;
1 Professor Emeritus Marquette University (Milwaukee, WI) and Northeastern University(Boston, MA); Managing Partner AquaNova LLC, [email protected]
Internal report not for distribution. If quoted use the web (http://www.aquanovaLLC.com) as the source.
2
1. INTRODUCTIONDuring the last fifty years, in spite of billions of dollars spent mostly on abatement of
point sources of pollution in developed countries, due to excessive loads of nutrients (nitrogenand phosphorus) water quality of many impoundments and coastal water bodies deteriorated on aglobal scale. The main causes were (1) intensification and industrialization of agriculture (GreenRevolution) relying mostly on industrial fertilizers that also resulted in high soil erosion fromfarms, (2) use of phosphate detergents, (3) wetland drainage for farming and urbanization, and(4) implementation of treatment of municipal wastewater that removed biodegradable organicsbut left most of the nutrients in the effluent.
Figure 1
Concentrations of nitrate-N in the ŽelivkaRiver in Švihov (Czech Republic) andindustrial nitrogen fertilizer application in thewatershed. Data compiled from varioussources by Lexa et al. (2006)
The resulting excessive eutrophication of surface waters has become the most severeproblem h in many developed and developing countries. The consequences of the increased loadsand overloads of soils with industrial fertilizers have been devastating to the receiving fresh andmarine water bodies and groundwater in many countries (Novotny, 2011). Figure 1 shows thetrend of nitrogen fertilizer applications and nitrate concentrations in the Želivka River which isthe main tributary to the Švihov Reservoir providing most of the drinking water for Prague(Population 1.2 Million), the capital city of the Czech Republic. The quality of surface waterresources diminished due to eutrophication, leading sometimes to hypereutrophic conditionscaused by the increased nutrient loads from agriculture on top of the loads from suburbanlandscape (lawns), municipal and industrial point sources and to a great degree, loads of releasednitrogen from draining wetlands and land conversion to agriculture. Many lakes, reservoirs andcoastal waters have been plagued by excessive algal blooms such as mats of filamentous Ulva inthe Lagoon of Venice in the 1980s and cyanobacteria in thousands water bodies worldwide.Groundwater resources have been contaminated in some regions by nitrates to the point ofbecoming unfit for potable water supplies.
2. PROBLEMS WITH NUTRIENT ENRICHMENT OF IMPOUNDMENTS2.1 Eutrophication and hypertrophy
Eutrophication is a process of nutrient enrichment of water bodies that leads to increasedprimary productivity of organic matter by algae that progresses from oligotrophic, to
Internal report not for distribution. If quoted use the web (http://www.aquanovaLLC.com) as the source.
3
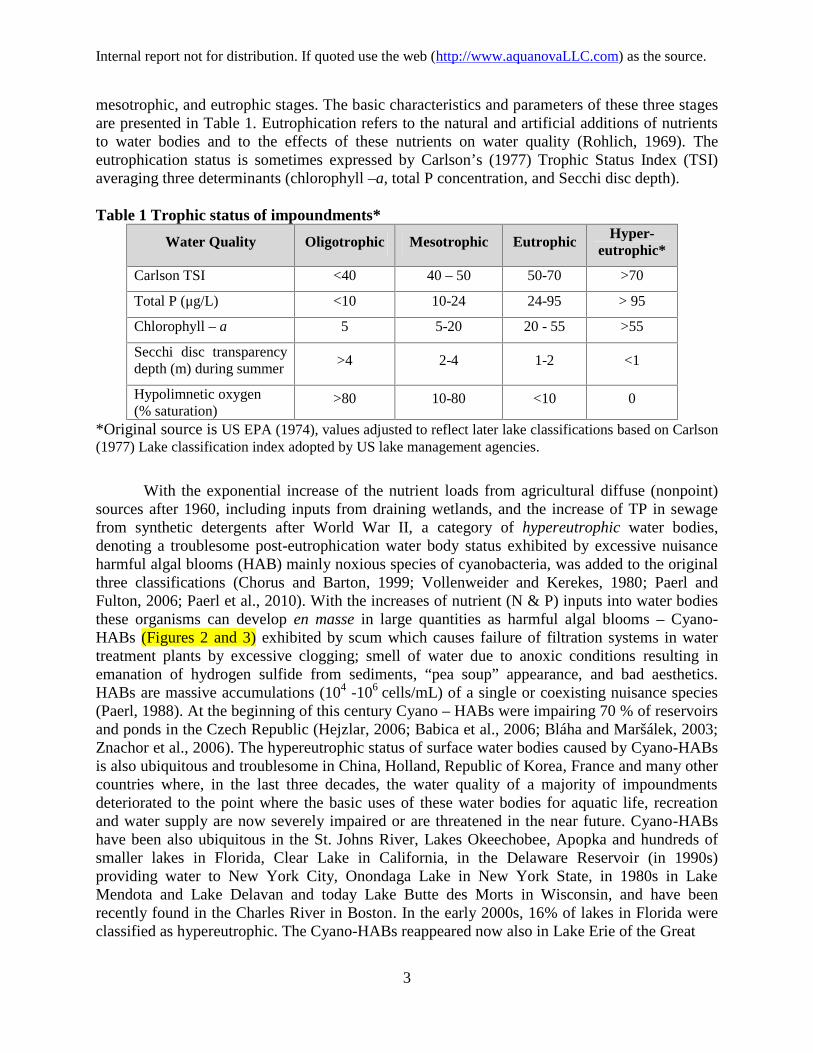
mesotrophic, and eutrophic stages. The basic characteristics and parameters of these three stagesare presented in Table 1. Eutrophication refers to the natural and artificial additions of nutrientsto water bodies and to the effects of these nutrients on water quality (Rohlich, 1969). Theeutrophication status is sometimes expressed by Carlson’s (1977) Trophic Status Index (TSI)averaging three determinants (chlorophyll –a, total P concentration, and Secchi disc depth).
Table 1 Trophic status of impoundments*
Water Quality Oligotrophic Mesotrophic Eutrophic Hyper-eutrophic*
Carlson TSI <40 40 – 50 50-70 >70
Total P (μg/L) <10 10-24 24-95 > 95
Chlorophyll – a 5 5-20 20 - 55 >55
Secchi disc transparencydepth (m) during summer
>4 2-4 1-2 <1
Hypolimnetic oxygen(% saturation)
>80 10-80 <10 0
*Original source is US EPA (1974), values adjusted to reflect later lake classifications based on Carlson(1977) Lake classification index adopted by US lake management agencies.
With the exponential increase of the nutrient loads from agricultural diffuse (nonpoint)sources after 1960, including inputs from draining wetlands, and the increase of TP in sewagefrom synthetic detergents after World War II, a category of hypereutrophic water bodies,denoting a troublesome post-eutrophication water body status exhibited by excessive nuisanceharmful algal blooms (HAB) mainly noxious species of cyanobacteria, was added to the originalthree classifications (Chorus and Barton, 1999; Vollenweider and Kerekes, 1980; Paerl andFulton, 2006; Paerl et al., 2010). With the increases of nutrient (N & P) inputs into water bodiesthese organisms can develop en masse in large quantities as harmful algal blooms – Cyano-HABs (Figures 2 and 3) exhibited by scum which causes failure of filtration systems in watertreatment plants by excessive clogging; smell of water due to anoxic conditions resulting inemanation of hydrogen sulfide from sediments, “pea soup” appearance, and bad aesthetics.HABs are massive accumulations (104 -106 cells/mL) of a single or coexisting nuisance species(Paerl, 1988). At the beginning of this century Cyano – HABs were impairing 70 % of reservoirsand ponds in the Czech Republic (Hejzlar, 2006; Babica et al., 2006; Bláha and Maršálek, 2003;Znachor et al., 2006). The hypereutrophic status of surface water bodies caused by Cyano-HABsis also ubiquitous and troublesome in China, Holland, Republic of Korea, France and many othercountries where, in the last three decades, the water quality of a majority of impoundmentsdeteriorated to the point where the basic uses of these water bodies for aquatic life, recreationand water supply are now severely impaired or are threatened in the near future. Cyano-HABshave been also ubiquitous in the St. Johns River, Lakes Okeechobee, Apopka and hundreds ofsmaller lakes in Florida, Clear Lake in California, in the Delaware Reservoir (in 1990s)providing water to New York City, Onondaga Lake in New York State, in 1980s in LakeMendota and Lake Delavan and today Lake Butte des Morts in Wisconsin, and have beenrecently found in the Charles River in Boston. In the early 2000s, 16% of lakes in Florida wereclassified as hypereutrophic. The Cyano-HABs reappeared now also in Lake Erie of the Great
Internal report not for distribution. If quoted use the web (http://www.aquanovaLLC.com) as the source.
4
Figure 2Sedlice Reservoir in the Želivka Riversystem during cyanobacteria Microcystisbloom in 2003. Picture taken in summer2003 by the Biology Centre of the CzechAcademy of Sciences
Figure 3
Cyanobacteria Microcystis outbreak anddead fish in Taihu. Photo taken by astudent of Wuxi University. Therepeating outbreaks are due to excessivenutrient inputs from industrial andagricultural sources.
Lakes and infested Clear Lake which is the largest fresh water lake in California and the numberof cyanobacteria infested water bodies increased during the record breaking hot weather yeas ofthe third millennium in south and the southwest US.
It has also been suspected for some time that, due to the ongoing climatic changes,Cyano-HABs by their preference for warm waters may form algal blooms in higher latitudesand/or at lower nutrient concentrations elsewhere (Kosten et al., 2009). Moss et al. (2011)recently advanced this hypothesis even further by suggesting that advanced eutrophication maypromote climatic change by increasing the loss of dissolved organic carbon from catchments tofreshwater where it will undergo faster metabolic changes increasing carbon dioxide emissionsby respiration, and greater release of methane from deoxygenated water and sediments. Warmingalso decreases the organic carbon storage in sediments and substrate of wetlands and its morerapid conversion to carbon dioxide and methane. Global warming potential of methane is 25times greater than that of CO2.
Water managers have been fighting the HABs for the last forty-fifty years, beginningwith using algaecides (copper sulfate, arsenic) that caused legacy pollution in sediment of theimpacted impoundments; weed cutting and scum collection that recycled the nutrients in thealgal macrophyte biomass into the sediments; destratification and aeration of the hypolimnion of
Internal report not for distribution. If quoted use the web (http://www.aquanovaLLC.com) as the source.
5
the impoundments which sometimes brought nutrient rich hypolimnetic waters to the surface andtriggered massive algal blooms; using iron and aluminum salts to seal the bottom and preventingphosphates from being released from the sediments into the overlying water; fish managementand eradication; to temporarily releasing water from the impoundments and dredging nutrientrich sediments. Concurrently, TMDL (Total Maximal Daily Load) in the US or similar programsin developed countries are focusing on reduction of nutrient loads from the watershed byinstalling wastewater treatment plants that reduce nitrogen and some phosphorus loads frompoint sources and best management practices (BMPs) for diffuse (nonpoint) sources.
2.2 Causes, Characteristics and Idiosyncrasy of HypereutrophyThe phenomenon of HABs has been known and studied for more than seventy years
(Mortimer, 1941; 1942; Rohlich, 1969; Vollenweider, 1975; Vollenweider and Kerekes, 1980;Paerl and Fulton, 2006; Paerl et al., 2001; Bláha and Maršálek, 2009). For example, in the early1980s Lake Delavan in Wisconsin, suffering from harmful algal blooms, includingcyanobacteria, was restored by a massive overhaul and clean – up that included control of pointand nonpoint sources of phosphorus from the watershed, change of lake’s hydraulics, creating aheadwater wetland, for reducing nutrient loads, massive and complete eradication of carp andbuffalo fish overpopulation and subsequent restocking with a balanced fish population,phosphorus precipitation in water and sealing of sediment by application of aluminum sulfate(Wisc. DNR, 1989). Similar massive overhauls have been conducted on the Brno Reservoir inCzech Republic (Maršálek et al., 2012) and several lakes in Wisconsin and Minnesota. However,only in the last twenty five years has the problem reached alarming proportions on a large scale.Table 2 shows the characteristic in the Czech hypereutrophic reservoirs infested bycyanobacteria blooms. The most common species found in the survey of Czech and Chineseimpoundments were Microcystis aeruginosa (67%) (Figure 4) and Anabaena flos-aquae (20%)(Figure 5). There are other cyanobacteria species that can populate Cyano-HAB, generallydivided into those that can fix atmospheric N2 (e.g., Anabaena) and those that cannot (e.g.,Microcystis), listedand described in Paerl (1988) and Paerl et al. (2001).
Figure 4
Microcystis aeruginosa – a common bloom formingcyanobacteria (Source and credit Czech Academy ofScience, Institute of Hydrobiology)
Figure 5
Anabaena flos - aquae – a filamentous N2 fixingcyanobacteria with spores (Source and credit CzechAcademy of Science, Institute of Hydrobiology)
Internal report not for distribution. If quoted use the web (http://www.aquanovaLLC.com) as the source.
6
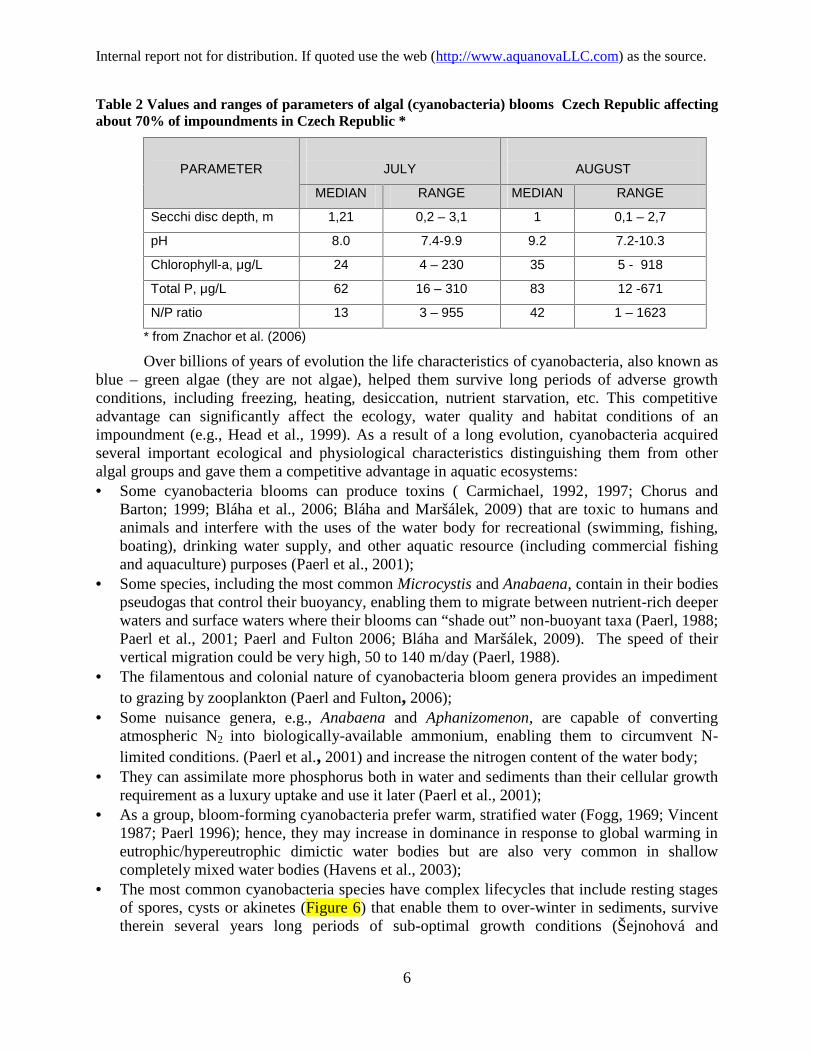
Table 2 Values and ranges of parameters of algal (cyanobacteria) blooms Czech Republic affectingabout 70% of impoundments in Czech Republic *
PARAMETER JULY AUGUST
MEDIAN RANGE MEDIAN RANGE
Secchi disc depth, m 1,21 0,2 – 3,1 1 0,1 – 2,7
pH 8.0 7.4-9.9 9.2 7.2-10.3
Chlorophyll-a, μg/L 24 4 – 230 35 5 - 918
Total P, μg/L 62 16 – 310 83 12 -671
N/P ratio 13 3 – 955 42 1 – 1623
* from Znachor et al. (2006)
Over billions of years of evolution the life characteristics of cyanobacteria, also known asblue – green algae (they are not algae), helped them survive long periods of adverse growthconditions, including freezing, heating, desiccation, nutrient starvation, etc. This competitiveadvantage can significantly affect the ecology, water quality and habitat conditions of animpoundment (e.g., Head et al., 1999). As a result of a long evolution, cyanobacteria acquiredseveral important ecological and physiological characteristics distinguishing them from otheralgal groups and gave them a competitive advantage in aquatic ecosystems: Some cyanobacteria blooms can produce toxins ( Carmichael, 1992, 1997; Chorus and
Barton; 1999; Bláha et al., 2006; Bláha and Maršálek, 2009) that are toxic to humans andanimals and interfere with the uses of the water body for recreational (swimming, fishing,boating), drinking water supply, and other aquatic resource (including commercial fishingand aquaculture) purposes (Paerl et al., 2001);
Some species, including the most common Microcystis and Anabaena, contain in their bodiespseudogas that control their buoyancy, enabling them to migrate between nutrient-rich deeperwaters and surface waters where their blooms can “shade out” non-buoyant taxa (Paerl, 1988;Paerl et al., 2001; Paerl and Fulton 2006; Bláha and Maršálek, 2009). The speed of theirvertical migration could be very high, 50 to 140 m/day (Paerl, 1988).
The filamentous and colonial nature of cyanobacteria bloom genera provides an impedimentto grazing by zooplankton (Paerl and Fulton, 2006);
Some nuisance genera, e.g., Anabaena and Aphanizomenon, are capable of convertingatmospheric N2 into biologically-available ammonium, enabling them to circumvent N-limited conditions. (Paerl et al., 2001) and increase the nitrogen content of the water body;
They can assimilate more phosphorus both in water and sediments than their cellular growthrequirement as a luxury uptake and use it later (Paerl et al., 2001);
As a group, bloom-forming cyanobacteria prefer warm, stratified water (Fogg, 1969; Vincent1987; Paerl 1996); hence, they may increase in dominance in response to global warming ineutrophic/hypereutrophic dimictic water bodies but are also very common in shallowcompletely mixed water bodies (Havens et al., 2003);
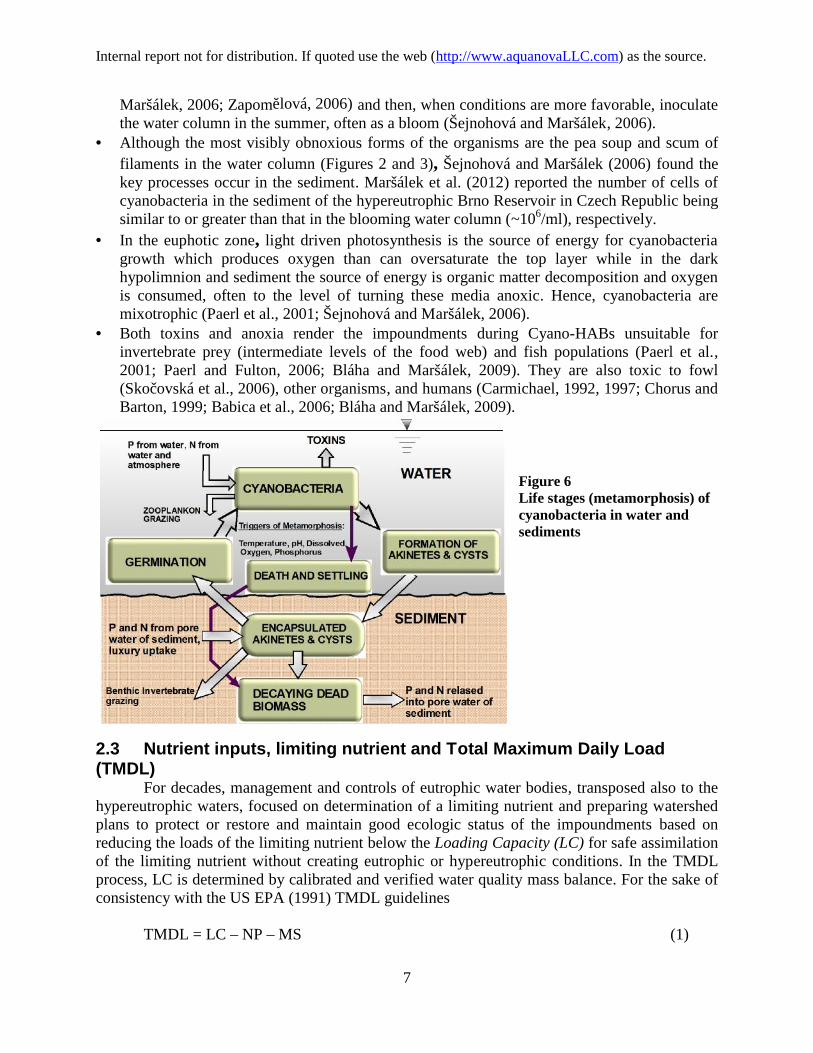
The most common cyanobacteria species have complex lifecycles that include resting stagesof spores, cysts or akinetes (Figure 6) that enable them to over-winter in sediments, survivetherein several years long periods of sub-optimal growth conditions (Šejnohová and
Internal report not for distribution. If quoted use the web (http://www.aquanovaLLC.com) as the source.
7
Maršálek, 2006; Zapomĕlová, 2006) and then, when conditions are more favorable, inoculatethe water column in the summer, often as a bloom (Šejnohová and Maršálek, 2006).
Although the most visibly obnoxious forms of the organisms are the pea soup and scum offilaments in the water column (Figures 2 and 3), Šejnohová and Maršálek (2006) found thekey processes occur in the sediment. Maršálek et al. (2012) reported the number of cells ofcyanobacteria in the sediment of the hypereutrophic Brno Reservoir in Czech Republic beingsimilar to or greater than that in the blooming water column (~106/ml), respectively.
In the euphotic zone, light driven photosynthesis is the source of energy for cyanobacteriagrowth which produces oxygen than can oversaturate the top layer while in the darkhypolimnion and sediment the source of energy is organic matter decomposition and oxygenis consumed, often to the level of turning these media anoxic. Hence, cyanobacteria aremixotrophic (Paerl et al., 2001; Šejnohová and Maršálek, 2006).
Both toxins and anoxia render the impoundments during Cyano-HABs unsuitable forinvertebrate prey (intermediate levels of the food web) and fish populations (Paerl et al.,2001; Paerl and Fulton, 2006; Bláha and Maršálek, 2009). They are also toxic to fowl(Skočovská et al., 2006), other organisms, and humans (Carmichael, 1992, 1997; Chorus andBarton, 1999; Babica et al., 2006; Bláha and Maršálek, 2009).
Figure 6Life stages (metamorphosis) ofcyanobacteria in water andsediments
2.3 Nutrient inputs, limiting nutrient and Total Maximum Daily Load(TMDL)
For decades, management and controls of eutrophic water bodies, transposed also to thehypereutrophic waters, focused on determination of a limiting nutrient and preparing watershedplans to protect or restore and maintain good ecologic status of the impoundments based onreducing the loads of the limiting nutrient below the Loading Capacity (LC) for safe assimilationof the limiting nutrient without creating eutrophic or hypereutrophic conditions. In the TMDLprocess, LC is determined by calibrated and verified water quality mass balance. For the sake ofconsistency with the US EPA (1991) TMDL guidelines
TMDL = LC – NP – MS (1)
Internal report not for distribution. If quoted use the web (http://www.aquanovaLLC.com) as the source.
8
where NP represents loadings of the limiting nutrient from natural (background) anduncontrollable nonpoint sources, and MS is typically a poorly defined margin of safety. Thetraditional loading capacity models for impoundments are based on the Vollenweider (1975)completely mixed steady state phosphorus (nitrogen) mass balance (Havens and Schelske, 2001)
Min + Matm = W = P Qout + P As Knet = P Qout (1+ σy τw ) (2)
where W is total phosphorus loading in g/year, Min is P or N input in g/year from the tributariesand other external loads, Matm is atmospheric nutrient input (g/year), As is the impoundmentsurface area in m2, Qout is outflow volume from the impoundment in m3/year, and P is thephosphorus (or nitrogen) concentration in the impoundment in g/m3 (mg/L). Knet is the netexchange rate of P to and from the sediment in m/year. The P retention coefficient (year-1) isσy = (annual mass of P deposited into sediment)/(mass of P in the impoundment), or
σy = P As Knet /P V = Knet/H (3)
where H is the depth of the impoundment in meters, τw = V/Q = is the hydraulic residence timeof the impoundment in years and V = volume of water in the impoundment. In the Vollenweidermodel all of the above variables are annual or seasonal. The original assumption with theintroduction of σy or Knet was that both parameters are constant.By substituting a nutrient criterion, Ptarget, for P, LC is estimated.
LC = Ptarget (Qout + As Knet ) (4)
It can also be seen that the model expressed by Equation 2 becomes
PL
K qnet s
(5)
where qs = Qout/As is the overflow rate (m/year) and L = W/As is the specific load in g/m2-year.Vollenweider (1975) and Dillon and Rigler (1974) suggested empirical relationships for Knet.Chapra (1997) pointed out that reported values of Knet by different authors ranged from less than1 to over 200 m/year. Reckow (1979) statistically analyzed data from 47 American lakes withphosphorus concentrations in the range of 4 to 135 μg/L which resulted in
Knet = 11.6 +0.2 qs (6)
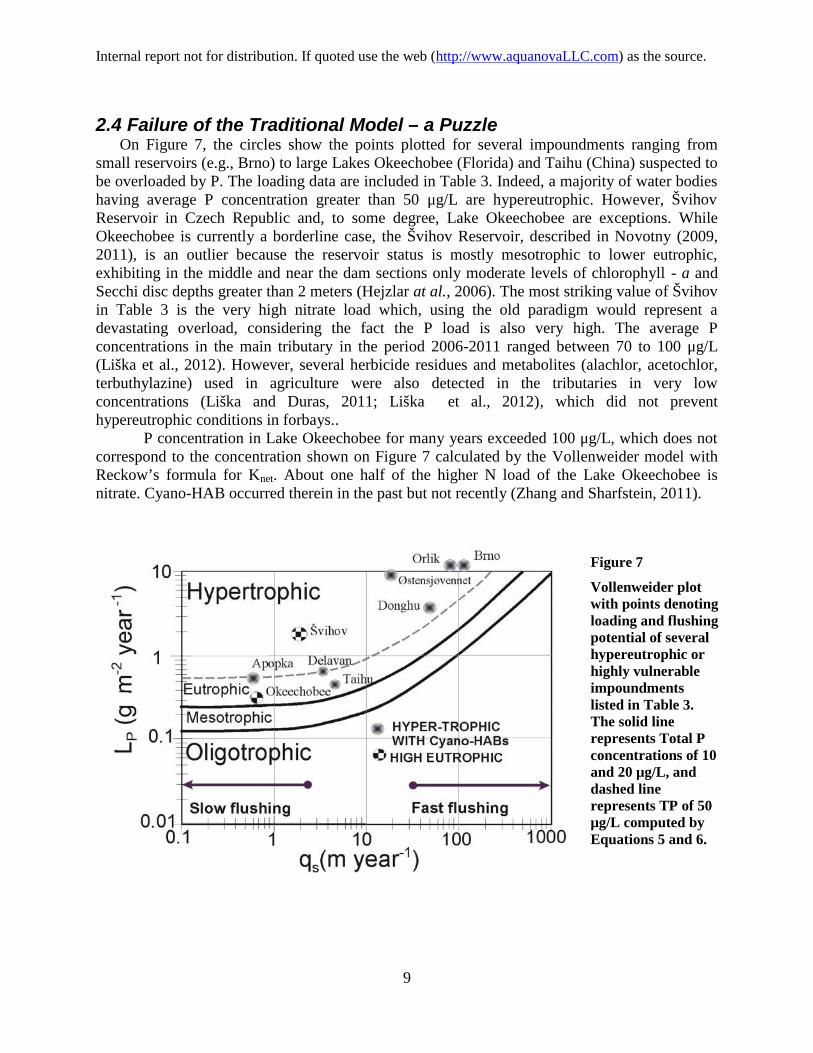
Following Equations 5 and 6 and substituting old (Sawyer, 1947) but commonly acceptedborderline P concentrations for transition from oligotrophic to mesotrophic water body status (10μg P/L) and from mesotrophic to eutrophic status (20 μg P/L), led to the loading chart (Figure 7used by lake managers and TMDL developers even for hypereutrophic water bodies. Theconcentrations separating the tropic stages defined in Table 1 were calculated by theVollenweider/Reckow model (Equations 5 and 6).
Internal report not for distribution. If quoted use the web (http://www.aquanovaLLC.com) as the source.
9
2.4 Failure of the Traditional Model – a PuzzleOn Figure 7, the circles show the points plotted for several impoundments ranging from
small reservoirs (e.g., Brno) to large Lakes Okeechobee (Florida) and Taihu (China) suspected tobe overloaded by P. The loading data are included in Table 3. Indeed, a majority of water bodieshaving average P concentration greater than 50 μg/L are hypereutrophic. However, ŠvihovReservoir in Czech Republic and, to some degree, Lake Okeechobee are exceptions. WhileOkeechobee is currently a borderline case, the Švihov Reservoir, described in Novotny (2009,2011), is an outlier because the reservoir status is mostly mesotrophic to lower eutrophic,exhibiting in the middle and near the dam sections only moderate levels of chlorophyll - a andSecchi disc depths greater than 2 meters (Hejzlar at al., 2006). The most striking value of Švihovin Table 3 is the very high nitrate load which, using the old paradigm would represent adevastating overload, considering the fact the P load is also very high. The average Pconcentrations in the main tributary in the period 2006-2011 ranged between 70 to 100 μg/L(Liška et al., 2012). However, several herbicide residues and metabolites (alachlor, acetochlor,terbuthylazine) used in agriculture were also detected in the tributaries in very lowconcentrations (Liška and Duras, 2011; Liška et al., 2012), which did not preventhypereutrophic conditions in forbays..
P concentration in Lake Okeechobee for many years exceeded 100 μg/L, which does notcorrespond to the concentration shown on Figure 7 calculated by the Vollenweider model withReckow’s formula for Knet. About one half of the higher N load of the Lake Okeechobee isnitrate. Cyano-HAB occurred therein in the past but not recently (Zhang and Sharfstein, 2011).
Figure 7
Vollenweider plotwith points denotingloading and flushingpotential of severalhypereutrophic orhighly vulnerableimpoundmentslisted in Table 3.The solid linerepresents Total Pconcentrations of 10and 20 μg/L, anddashed linerepresents TP of 50μg/L computed byEquations 5 and 6.
Internal report not for distribution. If quoted use the web (http://www.aquanovaLLC.com) as the source.
10
Table 3 Nitrogen and phosphorus loading parameters for Figure 6
1 Data from Paerl et al (2010); mean loading values for 2001 to 2005 and Qin, Liu, and Havens (2007)2 Tang and Xie (2000)3 Hejzlar et al (2006); mean loading values for 2001 to 20054 Hejzlar et al. (2010); Duras (2008), mean loading values for 2001-20045 Before restoration Maršálet et al. (2012)6 Magley (2003)7 Zhang , J. and B . Sharfstein (2011)8 Before restoration Field and Duerk, (1988)9 Grøterud and Haaland, (2007)10 Havens et al (2001)
Internal report not for distribution. If quoted use the web (http://www.aquanovaLLC.com) as the source.
11
It is clear the old paradigm need to be scrutinized. The obvious Achilles heel of using thesimple steady state mass balance model and charts for characterizing and modelinghypereutrophic water bodies are:
Figure 8
Net P sedimentation (retention)coefficient σy calculated from thephosphorus budget for the LakeOkeechobee. From Zhang andSharfstein (2011)
1. The phosphorus settling rate, Knet, represents the net removal of phosphorus from the watercolumn into the sediment. It cannot be measured and is generally calculated from the massbalance model but, as reported in the preceding sections, these values vary over a wide but,supposedly, positive range and were assumed to be more-or-less constant. High net removalrates are unrealistic for eutrophic and hypereutrophic impoundments where sediments can besources of phosphorus rather than a sink. In his original paper, Vollenweider (1975) himselfstated (paraphrased) that “our models do not apply to instances where sediments act assources such as phosphorus release from sediments under anaerobic conditions”. Figure 8shows the plot of σy for Lake Okeechobee in Florida which has an average depth of 2.7meters; hence, the apparent settling rate Knet decreased over the years from about 7 m/year toa minimum of less than zero in 2005 which was the year when the lake was borderlinehypereutrophic. The water quality situation improved in 2010 (Zhang and Sharfstein, 2011;Havens et al., 2003). Negative Knet implies the internal load of P from the sediment is greaterthan P settling. A similar transient phenomenon of excessive P release was measured byLehman (2011) on the hypereutrophic Ford impoundment in Michigan. Since P is aconservative substance Havens and James (2005) postulated that the reason for decreasing oreven negative Knet is apparent loss of the sediment P retention capacity.
2. In eutrophic and hypereutrophic water bodies the apparent “settling” is net rate of twoopposing processes, i.e., phosphorus settling into and release from the sediments. Hence,according to Chapra and Canale (1991), Pollmand and James (2011) and others Knet = vs – vt,where vs = settling velocity of P from water to sediment, and vt = internal recycle masstransfer of P from sediment to water. Chapra and Canale and Pollman and James then addeda third interstitial transfer coefficient, vb, which accounts for a permanent burial of P in thesediment shown later which, as it will be shown later in this article, may not be permanent.They related the magnitude of the release to the dissolved oxygen in the water column(anoxic hypolimnion). This concept of relating the P release rate to the DO in thehypolimnion has been advocated by limnologists for more than seventy years, beginning withEinsele (1936) and Mortimer (1941, 1942) who attributed it to the reduction of FeOOH-
Internal report not for distribution. If quoted use the web (http://www.aquanovaLLC.com) as the source.
12
phosphate complexes. Nűrnberg (1984, 1994) noted that lakes with anoxic hypolimnion didnot follow the classic Vollenweider model because of the internal phosphorus load andrelated phosphorus release to the fraction of the surface area of the anoxic sediment.However, Einsele (1936) and thirty five years later, Caraco et al. (1981) discovered thatsulfate was a far more important variable that had a high correlation to P release from thesediment both under oxic and anoxic conditions in the sediment. Recent investigationssummarized in Hupper and Lewandowski (2008) proved that the hypothesis of relating Pretention release to oxygen was simplistic and potentially leading to ineffective or erroneouslake/reservoir management measures. Golterman (2001) further analyzed Mortimer’s (1941)data and postulated that the data not only indicated the effect of releasing Fe(III) bound Punder the anoxic hypolimnion conditions but also revealed a possibility that other processescan take part in the anoxic P release (see also Selig and Schlungbaum, 2003).
3. During blooms in highly eutrophic and hypereutrophic conditions, most of phosphorus andorganic nitrogen in water is associated with cellular mass either as a component of theorganic matter of the cell or adsorbed on the organic C of the cell. Algal bloommicroorganisms such as cyanobacteria may scavenge the dissolved P and store it in the cellsas luxury uptake (Paerl et al., 2001) which results in very low dissolved P concentrationsduring blooms. For cellular P and N of cyanobacteria “settling” is actually a buoyancyvertical floating throughout the impoundment in search for better conditions.
4. In modeling onset and behavior of Cyano HABs, traditional mass balance dynamic modelsare treating algae as chemical constituent whereby the chlorophyll-a or algal biomassconcentrations change by growth affected by the limiting nutrient and light, die-off, settling,zooplankton grazing, temperature and so forth. It was already pointed out in the precedingsection that zooplankton grazing is suppressed in Cyano-HABs. Furthermore, cyanobacteriacan undergo several life stages (Figure 6) and their movement to sediments (settling) may berapid, en masse, and temporal for over wintering and nourishment (Hellweger et al., 2008).
5. While the Vollenweider chart (Figure 7) may be useful for illustrative purposes it has becomea mantra of the water managers and sometimes a cause of inappropriate decisions whendealing with water bodies suffering from or being vulnerable to Cyano-HABs.
Limiting nutrients. Traditionally, phosphorus has been considered as the limiting nutrient forcontrolling eutrophication of inland impoundments and even more so for hypereutrophic waterbodies with CyanoHABs because some species; for example, filamentous cyanobacteriaAnabaena flos-aquae can fix atmospheric N2 and convert it into ammonium.
Havens et al. (2003) summarized the literature and views on the effects of N:P supplyratio. Earlier findings and hypotheses established that high P concentrations and low N:P supplyratios favored production of cyanobacteria dominated algal bloom (Smith and Bennett, 1999). Itwas generally assumed that larger N loads favored non-N2 fixing Cyano-HABs, includingbuoyant Microcystis, while excessive phosphorus loads would lead to N2 fixing Cyano-HABs.However, Paerl (1988) pointed out that in stratified systems the mobility and free migration ofcyanobacteria between epilimnion and hypolimnion enables them to find the zone which wouldhave the most optimal N:P ratio for their growth. Hypereutrophic systems which exhibitexcessive nutrient supplies (in comparison to the growth requirement) are especially challengingfor prediction of Cyano-HABs based on the N:P ratio. The fact that both N2 fixers (e.g.,Anabaena flos-aquae) and non fixing Microcystis are often present in water and sediments ofhypereutrophic impoundments such as Taihu (“hu” is “lake” in Mandarin Chinese and “Tai”
Internal report not for distribution. If quoted use the web (http://www.aquanovaLLC.com) as the source.
13
approximately means “large”) in China (Paerl et al., 2010) and the majority of affected Czechreservoirs (Bláha and Maršálek, 2003, 2009) could have led to a conclusion that control of Nloads was inconsequential and the remediation should mainly focus on reducing P loads, mostlyassociated with sediment. Sometimes, managers set “easy goals” such as achieving “average “ Pconcentrations of 50 - 100 μg/L, instead of dramatically curtailing the P loads to 20 μg/L whichmay be necessary. Once the Cyano-HABs have developed, cyanobacteria may persist inimpoundments during periods with low P concentrations because of their P luxury uptakecapability and can settle into sediments where they can survive and assimilate nutrients fromnutrient rich sediments for years. Gulati and Van Donk (2002) in The Netherlands found thatcyanobacteria in hypereutrophic water bodies can tolerate a wide range of P availability.
The premise that eutrophication cannot be controlled by reducing N inputs, was alsoincluded in Schindler et al. (2008) who based it on the observation that many systems exhibitingadvanced eutrophication (hypereutrophication) also contain a significant N2 fixing Cyano-HABpopulation, and on the assumption that its N2 fixing can meet the system N requirements.However, Paerl et al. (2010), in a seminal study of Taihu, quoted diverse studies and also provedby their bioassays and lake monitoring that only a fraction of the system N demand, far less than50%, can be met by N2 fixing species. N2 fixation rates are lower and may not supply enoughnew N, even when N fixing cyanobacteria are present. The fact that Microcystis sp. were notreplaced by N2 fixing CyanoHABs during N limited but P sufficient summer periods in Taihu isevidence that predictions of successions from non-N2 fixers to N2 fixing taxa based on N:Pstochiometry may not apply to hypereutrophic impoundments. Excess inputs of both N and P,combined with internal cycling of both nutrients, may overwhelm the ability of a single nutrientto control increasing eutrophication and bloom intensification (Paerl et al., 2010). Paerl et al. alsoconcluded that serious P input reductions are an important component of lake management andrestoration in larger lakes and reservoirs; however, failure to control N inputs may result incontinued eutrophication problems caused by non-N2 fixing CyanoHABs. Controlling only Ploads focuses on control of sediment loads from fields, construction erosion, and P in effluentsand combined sewer overflows (CSOs) while N loads arrive to the receiving bodies both insurface runoff as TKN (Total Kjeldahl nitrogen which is the sum of organic N and ammonium)and dissociated nitrate, and subsurface groundwater nitrate flows. Hence, both N and P should becontrolled in Taihu, the Czech reservoirs, Lake Okeechobee, Clear Lake in California and manyother impoundments suffering or being highly vulnerable to Cyano-HABs. This was summarizedby the leading cyanobacteria limnologists in a Science article (Conley et al., 2009) which alsopointed out other reasons why N should be controlled even in apparent P limited water bodieswith advanced eutrophication or hypertrophy, namely, failure to control N may lead to severeproblems downstream such hypoxia of coastal waters (e.g., Gulf of Mexico).
3. INTERNAL LOADS – RELEASE OF P AND N FROM SEDIMENTS
The major difference between mesothrophic/lower eutrophic and hypereutrophicimpoundments is the effect of the P content of sediment. Internal loads of phosphorus andammonium from anaerobic sediments of highly eutrophic and hypereutrophic water bodies canbe very high and represent a significant portion of the total P load (Mortimer, 1941; Nürnberg,1994; Søndergaard, Jensen, and Jeppesen, 2003). The mesotrophic and lower eutrophic status isgoverned mainly by the allochthonous inputs of nutrients and nutrients stored in the sedimentshave less or no immediate relevance; also the phosphate release from the sediments is relatively
Internal report not for distribution. If quoted use the web (http://www.aquanovaLLC.com) as the source.
14
small. The hypereutrophic status, on the other hand, may occur when a significant mass ofphosphorus is released from the sediment storage that accumulated over years. In most naturalimpoundments, such as Lake Okeechobee, major increases of P in sediments occurred in the lastfifty to sixty years (Brezonik and Engstrom, 1998) although the lake was formed about 5000years ago. The differences between the water phosphorus content of highly eutrophic andhypereutrophic impoundments and that of their sediment may be staggering. For example, theannual input of P into Lake Okeechobee in Florida was approximately 500 tons of P/year duringthe 2007 – 2011 period. In contrast, the P content in the upper 10 cm of the lake sediment is30,000 tons of phosphorus that has accumulated over the last 80 years (Brezonik and Engstrom,1998; Zhang and Sharfstein, 2011). It should be pointed out that the mud type sediments of thelake containing most of phosphorus comprise only 44% of the lake bottom area (Brezonik andEngsrom, 1988; Pollman and James, 2011).
A great portion of phosphorus is in settled live or dead decomposing algae biomass. Thiscoincides with the observations of Šejnohová and Maršálek (2006) documenting largercyanobacteria biomass concentration in the sediment of the Brno Reservoir than that in theblooming water. Maršálek et al. (2012) also reported very high nutrient content andconcentrations in the sediments of this reservoir which in the top 20 cm ranged from 4,000 to6,000 mg/kg dry weight for N and 1,500 to 2,500 mg/kg of P, respectively. In addition to P inorganic biomass, mineral phosphate is held in the sediment in Fe(III) and Al(III) complexes, as amineral apatite after combining with calcium and other elements, and by adsorption on clay andorganic particulates. If this holding capacity of the sediment is lost by a loss of oxygen and/ornitrate in the upper layer, or by stirring the sediment (e.g., by a hurricane or even by bottomfeeding fishes) a flux of P from the sediment may occur, triggering a Cyano-HAB. Søndergaard,Jensen, and Jeppesen have outlined the mechanisms by which phosphorus can be released fromthe sediment, including
1. resuspension,2. change of redox conditions,3. pH,4. iron/phosphorus ratio,5. chemical diffusion and bioturbation,6. mineralization and microbial processes, and7. the effects of submerged macrophytes.
Resuspension may be ubiquitous in shallow water bodies wherein the turbulence isinduced by currents and/or winds resulting in bottom shear stress of the overlaying water greaterthan 5 – 10 Newton/m2. Massive resuspension can occur in regions affected by hurricanes suchas Lake Okeechobee or Apopka in Florida. Resuspension can also occur due to the benthosfeeding activity of fish such as carp, bream or buffalo. Although resuspension increases turbidityand release of phosphorus adsorbed on the sediments it may not necessarily lead to the increaseof available phosphate in the water column because, in the aerobic water column, phosphate canbe adsorbed on clay and organic particulates (Novotny and Chesters, 1989) and combine withFe(III) oxihydroxides, which makes it less available to algae. Also apatite is not readily availablefor algal growth (Brezonik and Engstrom, 1988). The concentration of bioavailable phosphate(PO4
3-) depends on the equilibrium, affected by pH, between dissolved (ionic available tophytoplankton) and adsorbed unavailable phosphorus forms.
Internal report not for distribution. If quoted use the web (http://www.aquanovaLLC.com) as the source.
15
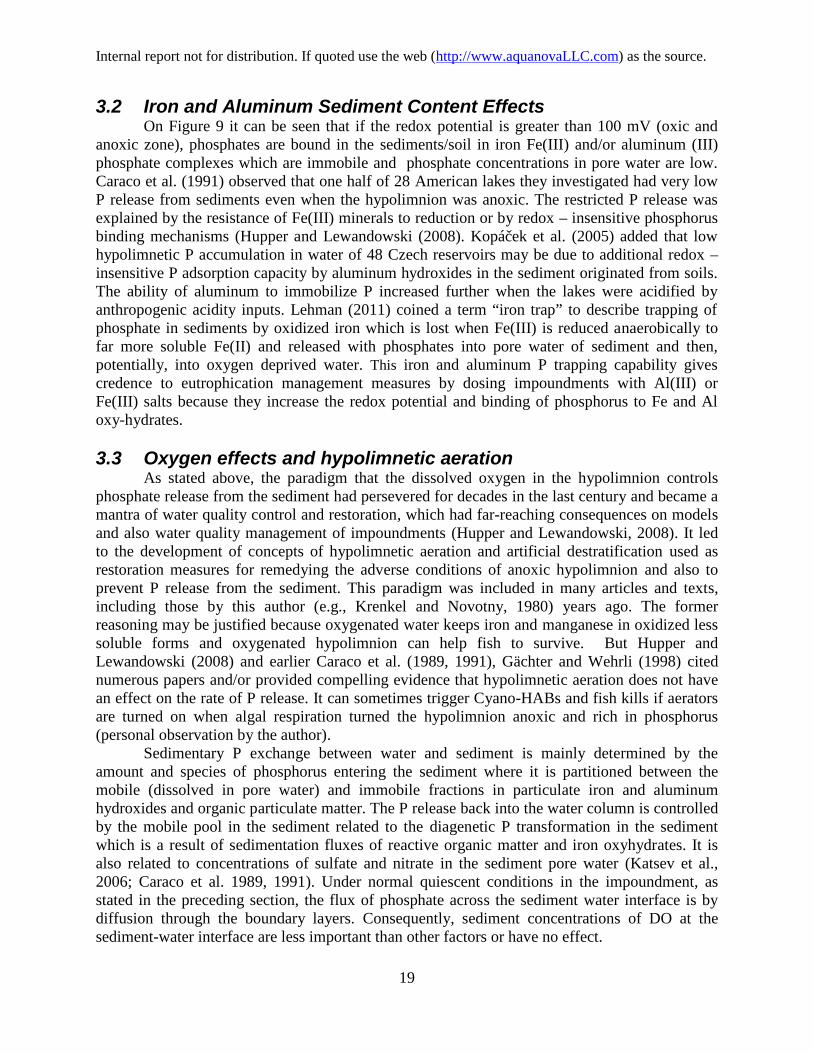
Figure 9
Effect of Redox potential zones inwet soils or sediments on microbialoxidation/reduction (based onReddy et al. (1986))
In stratified water bodies with advanced eutrophication/hypertrophy the lowerhypolimnion becomes hypoxic or anoxic and, in extreme cases, anaerobic. The differing redoxpotential creates layers in the sediment or wetland substrate as shown on Figure 9. If thehypolimnion or completely mixed water column above the sediment is oxic, an oxygenatedinterstitial layer on top of the sediment can be formed but it is relatively thin, only a fewmillimeters at best (Jørgensen and Revsbech, 1985; Søndergaard, Jensen, and Jeppesen, 2003).This fact was also reported sixty years ago by Fair and Gayer (1954) who specified themaximum of 4 mm for the oxic layer of organic sediments. Jørgensen and Revsbech postulatedthat the redox potential in the sediment may not be proportional to the oxygen concentration inwater. Søndergaard, Jensen, and Jeppesen stated that the redox dependent release of phosphorusbound to iron and aluminum, along with microbial processes, are the two most importantmechanisms by which phosphorus can be released from the sediment into the water column.
In impoundments, the transport of phosphorus, ammonium and methane into the watercolumn occurs from the anaerobic sediment bottom layer but the dissolved phosphorus fluxcould be buffered in the thicker (centimeters) anoxic sediment layer with a higher redox potentialand smaller pore water dissolved P concentration than those in the anaerobic zones below. Pexchange between water and sediment is mainly determined by the amount and species ofphosphorus entering the sediment where it is partitioned between the mobile (dissolved in porewater) and immobile fractions in particulate iron and aluminum hydroxides and organicparticulate matter. In eutrophic and hypereutrophic lakes a great portion of P enters sediment asdead or living (cyanobacteria cysts or akinetes) algal biomass (Pettersson, 2001; Hupper andLewandowski, 2005; Šejnohova and Maršálek, 2006). The dead algal biomass is aerobically oranaerobically decomposed, which releases phosphate into the pore water of the sediment. Thisprocess is controlled by temperature.
3.1 Mass transfer across the water –sediment interstitial layerSeveral chemical compounds are important in determining the trophic status of surface
water bodies that exist both in water and sediment and exchange their mass between water andsediment: (1) phosphorus that in various forms (particulate mineral and organic and dissociatedphosphate) enter into sediment and could be released back from the sediment as dissolved
Internal report not for distribution. If quoted use the web (http://www.aquanovaLLC.com) as the source.
16
phosphate by diffusion or particulate phosphorus by resuspension by currents or bioturbation ofsediment borrowing or feeding organisms; (2) nitrate that will enter sediment as ions by diffusionfrom the water column and/or is formed by nitrification in the upper oxic layer of the sediment;(3) oxygen expressed as sediment oxygen demand; (4) ammonium formed in the anaerobic layerof the sediment and released into water; (5) methane formed in the anaerobic layer and releasedinto water by diffusion and ebullition, (6) sulfate ions entering sediment from water by diffusion,and (7) sulfide formed from sulfates during anaerobic decomposition emanating from sediments.
Particulate compounds settle into sediment by gravity as a part of the sediment particle(organic P and N) or being adsorbed on the sediment (ammonium and phosphate) or with thesettling biomass of cyanobacteria and algae. As stated above they can reenter the water columnby scour related to the shear stress of moving water above or by resuspension activity of benthicfeeding organisms. The flux of dissociated ions (phosphate, nitrate, sulfate, part of ammonium)and dissolved methane is governed by the diffusion processes in the boundary layers in the water–sediment interstitial layer (Novotny, 1968, 1969; Jørgensen and Revsbech, 1985; Jørgensen andDes Marais, 1990; DiToro et al, 1990). These boundary layers are most important fordetermining the rate of transfer of oxygen, dissolved phosphate and other dissolved/dissociatedcompounds between moving water and sediment.
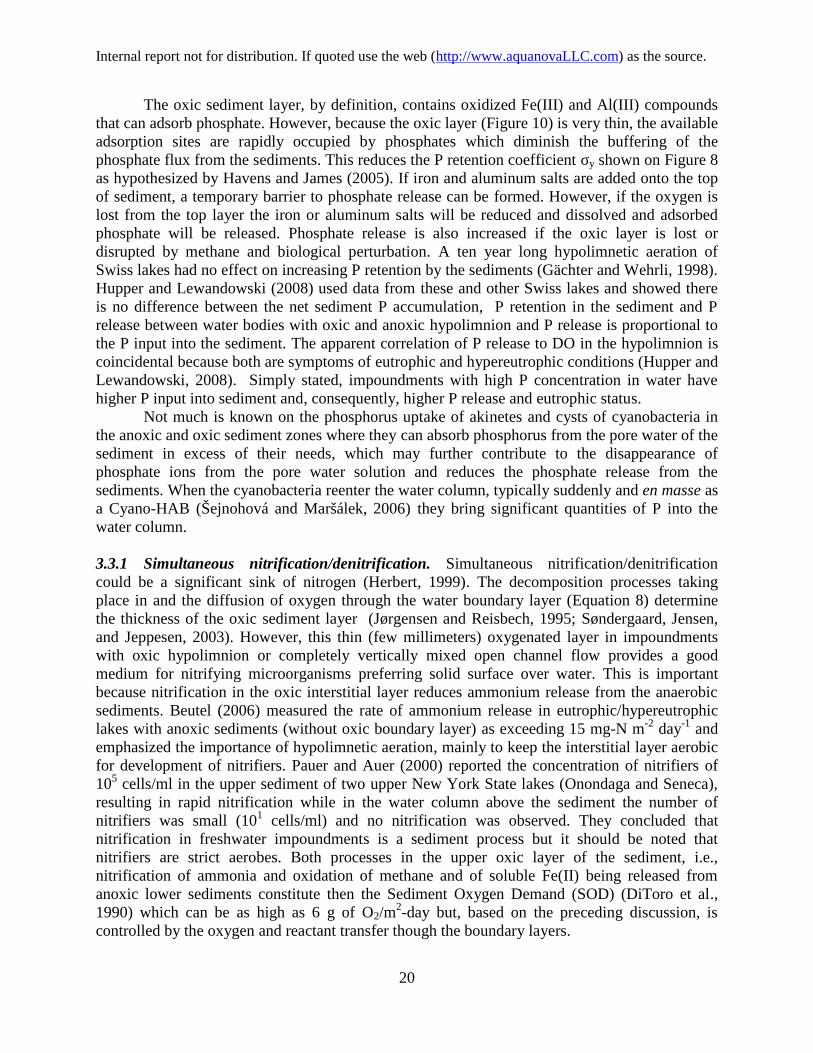
The key boundary layers through which the ions and molecules must penetrate betweenwater and sediment, shown on Figures 10 , are (Novotny, 1968, 1969; Jørgensen and Revsbech,1985; Higashino and Stefan, 2004; Roberts and McMinn, 2004; Thibodeaux, 1996):
Figure 10Carbon and nitrogen cycles anddiagenesis in wetlands andimpoundments receivinganthropogenic nitrate inputs withcarbon sequestering into alkalinity.POC-particulate organic carbon,PON – particulate nitrogen, DOC –dissolved organic carbon
1. Viscous flow boundary layer formed in water on top of the sediment where the flow islaminar. Its thickness is related to the Reynolds number at the top of the viscous (laminar)layer as Re = u y/ν ~ 1, where u is the flow velocity at the top of the laminar layer, y isthe thickness of the laminar layer, and ν is kinematic viscosity of water which at 20oC is10-6 m2/s and at 0oC about 1.7x10⁻⁶ m2/s, respectively. Within this layer, the turbulenteddy diffusion is diminishing.
2. Diffusion boundary layer through which dissolved molecules (e.g., methane, DOC or O2)or dissociated ions (e.g., NO3
-, PO43-, SO4
2-) pass by diffusion. Hence, the rate ofdiffusion or release of the molecules or ions to and from the sediment is restricted. The
Internal report not for distribution. If quoted use the web (http://www.aquanovaLLC.com) as the source.
17
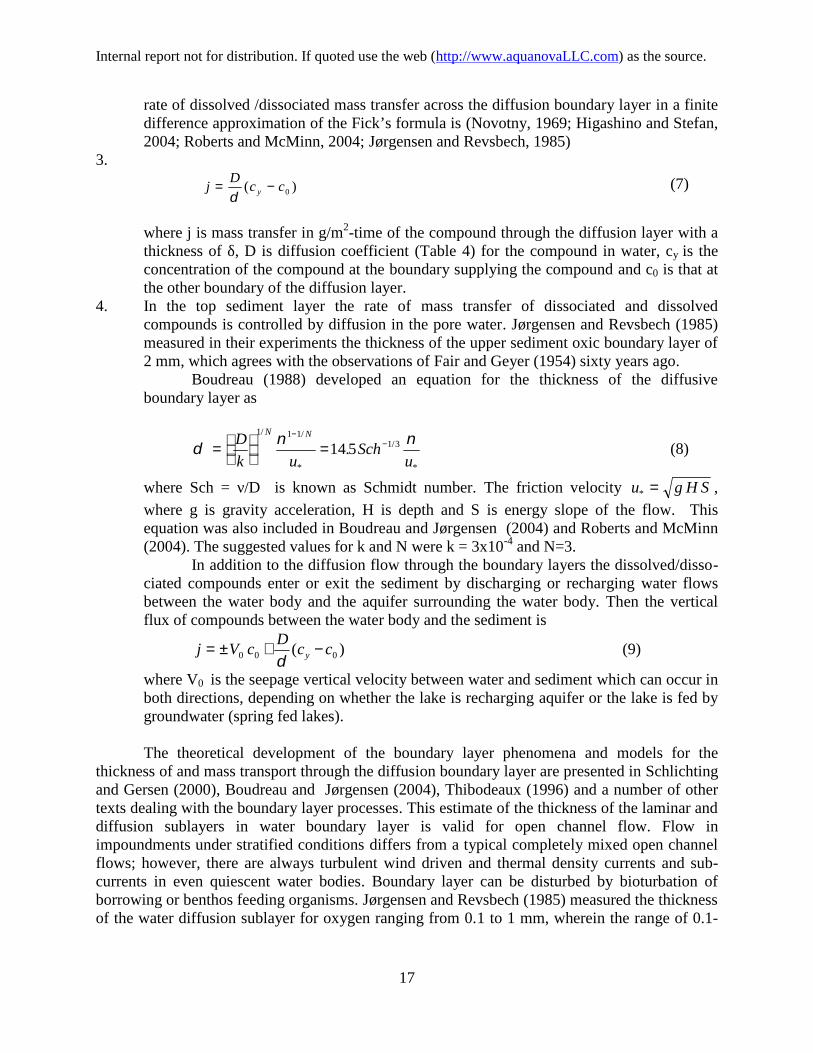
rate of dissolved /dissociated mass transfer across the diffusion boundary layer in a finitedifference approximation of the Fick’s formula is (Novotny, 1969; Higashino and Stefan,2004; Roberts and McMinn, 2004; Jørgensen and Revsbech, 1985)
3.
jD
c cy
( )0(7)
where j is mass transfer in g/m2-time of the compound through the diffusion layer with athickness of δ, D is diffusion coefficient (Table 4) for the compound in water, cy is theconcentration of the compound at the boundary supplying the compound and c0 is that atthe other boundary of the diffusion layer.
4. In the top sediment layer the rate of mass transfer of dissociated and dissolvedcompounds is controlled by diffusion in the pore water. Jørgensen and Revsbech (1985)measured in their experiments the thickness of the upper sediment oxic boundary layer of2 mm, which agrees with the observations of Fair and Geyer (1954) sixty years ago.
Boudreau (1988) developed an equation for the thickness of the diffusiveboundary layer as
D
k uSch
u
N N1 1 11 314 5
/ /
*
/
*
. (8)
where Sch = ν/D is known as Schmidt number. The friction velocity u g H S* ,
where g is gravity acceleration, H is depth and S is energy slope of the flow. Thisequation was also included in Boudreau and Jørgensen (2004) and Roberts and McMinn(2004). The suggested values for k and N were k = 3x10⁻⁴ and N=3.
In addition to the diffusion flow through the boundary layers the dissolved/disso-ciated compounds enter or exit the sediment by discharging or recharging water flowsbetween the water body and the aquifer surrounding the water body. Then the verticalflux of compounds between the water body and the sediment is
j V cD
c cy 0 0 0( ) (9)
where V0 is the seepage vertical velocity between water and sediment which can occur inboth directions, depending on whether the lake is recharging aquifer or the lake is fed bygroundwater (spring fed lakes).
The theoretical development of the boundary layer phenomena and models for thethickness of and mass transport through the diffusion boundary layer are presented in Schlichtingand Gersen (2000), Boudreau and Jørgensen (2004), Thibodeaux (1996) and a number of othertexts dealing with the boundary layer processes. This estimate of the thickness of the laminar anddiffusion sublayers in water boundary layer is valid for open channel flow. Flow inimpoundments under stratified conditions differs from a typical completely mixed open channelflows; however, there are always turbulent wind driven and thermal density currents and sub-currents in even quiescent water bodies. Boundary layer can be disturbed by bioturbation ofborrowing or benthos feeding organisms. Jørgensen and Revsbech (1985) measured the thicknessof the water diffusion sublayer for oxygen ranging from 0.1 to 1 mm, wherein the range of 0.1-
Internal report not for distribution. If quoted use the web (http://www.aquanovaLLC.com) as the source.
18
0.2 mm was typical for higher flow rate in their experiments and 0.8 – 1 mm for very low flowrates, respectively.
Table 4 Diffusion coefficients of key dissolved and dissociated compounds in water at 20oC
CompoundMolecular Diffusion
coefficient SchmidtNumber Source
cm2 sec-1 m2 day-1
Oxygen O2 1.98x10⁻⁵ 0.0017 505 Crank (19)
Nitrate NO3- 1.7x10⁻⁵ 0.0015 588 Picioreanu et al. (1997)
Acetate CH3CO2- 1.2x10⁻⁵ 0.001 833 Newman nad Thomas-Alyea
(2004)
Ammonium NH4+ 9.8x10⁻⁶ 0.008 1020 Krom and Berner (1980)
Sulfate SO42- 5x10⁻⁶ 0.0052 2000
Krom and Berner (1980)
Iversen and Jϕrgensen (1993)
Ferrous ion Fe++ 7x10⁻⁶ 0.0006 1428 Newman nad Thomas-Alyea(2004)
Phosphate ion PO43- 3.6x10⁻⁶ 0.0003 2777 Krom and Berner (1980)
Methane (dissolved) 8.7x10⁻⁶ 0.0008 1150 Iversen and Jϕrgensen (1993)
For diffusion in the upper sediment boundary layer, the equations are more complicatedand the diffusion coefficient is affected by the tortuosity of the sediment and retarding effect ofadsorption on the sediment and by the biochemical processes occurring in the sediment boundarylayer. Iversen and Jørgensen (1993) presented the empirical equation for adjusting the diffusioncoefficient in the sediment, Ds, as
DD
ns 1 1( )
(10)
where ø = (pore volume/total volume) is dimensionless porosity and n = 3 for clay andsilt sediments and n = 2 for sand. The diffusion models for diffusive mass transfer processesthrough water and sediment boundary layers are quite complex (e.g., Vanderborght and Billen,1975) because beside diffusion they also contain convection, adsorption/desorption andtransformation (e.g., denitrification, deoxygenation) terms. Pollmand and James (2011)suggested that a five to ten centimeters thick completely mixed transitional layer forms in the topzone of the mud sediments in Lake Okeechobee and developed a model for the internal loadingof P from the anaerobic zone by diffusion through the upper sediment flux controlling layer.They added adsorption/desorption component to the mass balance model in the top mixed layerof the sediment represented by the Langmuir isotherm, which has a maximum adsorption limitthat explained the decrease of the net exchange rate of P between water and sediment.
Internal report not for distribution. If quoted use the web (http://www.aquanovaLLC.com) as the source.
19
3.2 Iron and Aluminum Sediment Content EffectsOn Figure 9 it can be seen that if the redox potential is greater than 100 mV (oxic and
anoxic zone), phosphates are bound in the sediments/soil in iron Fe(III) and/or aluminum (III)phosphate complexes which are immobile and phosphate concentrations in pore water are low.Caraco et al. (1991) observed that one half of 28 American lakes they investigated had very lowP release from sediments even when the hypolimnion was anoxic. The restricted P release wasexplained by the resistance of Fe(III) minerals to reduction or by redox – insensitive phosphorusbinding mechanisms (Hupper and Lewandowski (2008). Kopáček et al. (2005) added that lowhypolimnetic P accumulation in water of 48 Czech reservoirs may be due to additional redox –insensitive P adsorption capacity by aluminum hydroxides in the sediment originated from soils.The ability of aluminum to immobilize P increased further when the lakes were acidified byanthropogenic acidity inputs. Lehman (2011) coined a term “iron trap” to describe trapping ofphosphate in sediments by oxidized iron which is lost when Fe(III) is reduced anaerobically tofar more soluble Fe(II) and released with phosphates into pore water of sediment and then,potentially, into oxygen deprived water. This iron and aluminum P trapping capability givescredence to eutrophication management measures by dosing impoundments with Al(III) orFe(III) salts because they increase the redox potential and binding of phosphorus to Fe and Aloxy-hydrates.
3.3 Oxygen effects and hypolimnetic aerationAs stated above, the paradigm that the dissolved oxygen in the hypolimnion controls
phosphate release from the sediment had persevered for decades in the last century and became amantra of water quality control and restoration, which had far-reaching consequences on modelsand also water quality management of impoundments (Hupper and Lewandowski, 2008). It ledto the development of concepts of hypolimnetic aeration and artificial destratification used asrestoration measures for remedying the adverse conditions of anoxic hypolimnion and also toprevent P release from the sediment. This paradigm was included in many articles and texts,including those by this author (e.g., Krenkel and Novotny, 1980) years ago. The formerreasoning may be justified because oxygenated water keeps iron and manganese in oxidized lesssoluble forms and oxygenated hypolimnion can help fish to survive. But Hupper andLewandowski (2008) and earlier Caraco et al. (1989, 1991), Gächter and Wehrli (1998) citednumerous papers and/or provided compelling evidence that hypolimnetic aeration does not havean effect on the rate of P release. It can sometimes trigger Cyano-HABs and fish kills if aeratorsare turned on when algal respiration turned the hypolimnion anoxic and rich in phosphorus(personal observation by the author).
Sedimentary P exchange between water and sediment is mainly determined by theamount and species of phosphorus entering the sediment where it is partitioned between themobile (dissolved in pore water) and immobile fractions in particulate iron and aluminumhydroxides and organic particulate matter. The P release back into the water column is controlledby the mobile pool in the sediment related to the diagenetic P transformation in the sedimentwhich is a result of sedimentation fluxes of reactive organic matter and iron oxyhydrates. It isalso related to concentrations of sulfate and nitrate in the sediment pore water (Katsev et al.,2006; Caraco et al. 1989, 1991). Under normal quiescent conditions in the impoundment, asstated in the preceding section, the flux of phosphate across the sediment water interface is bydiffusion through the boundary layers. Consequently, sediment concentrations of DO at thesediment-water interface are less important than other factors or have no effect.
Internal report not for distribution. If quoted use the web (http://www.aquanovaLLC.com) as the source.
20
The oxic sediment layer, by definition, contains oxidized Fe(III) and Al(III) compoundsthat can adsorb phosphate. However, because the oxic layer (Figure 10) is very thin, the availableadsorption sites are rapidly occupied by phosphates which diminish the buffering of thephosphate flux from the sediments. This reduces the P retention coefficient σy shown on Figure 8as hypothesized by Havens and James (2005). If iron and aluminum salts are added onto the topof sediment, a temporary barrier to phosphate release can be formed. However, if the oxygen islost from the top layer the iron or aluminum salts will be reduced and dissolved and adsorbedphosphate will be released. Phosphate release is also increased if the oxic layer is lost ordisrupted by methane and biological perturbation. A ten year long hypolimnetic aeration ofSwiss lakes had no effect on increasing P retention by the sediments (Gächter and Wehrli, 1998).Hupper and Lewandowski (2008) used data from these and other Swiss lakes and showed thereis no difference between the net sediment P accumulation, P retention in the sediment and Prelease between water bodies with oxic and anoxic hypolimnion and P release is proportional tothe P input into the sediment. The apparent correlation of P release to DO in the hypolimnion iscoincidental because both are symptoms of eutrophic and hypereutrophic conditions (Hupper andLewandowski, 2008). Simply stated, impoundments with high P concentration in water havehigher P input into sediment and, consequently, higher P release and eutrophic status.
Not much is known on the phosphorus uptake of akinetes and cysts of cyanobacteria inthe anoxic and oxic sediment zones where they can absorb phosphorus from the pore water of thesediment in excess of their needs, which may further contribute to the disappearance ofphosphate ions from the pore water solution and reduces the phosphate release from thesediments. When the cyanobacteria reenter the water column, typically suddenly and en masse asa Cyano-HAB (Šejnohová and Maršálek, 2006) they bring significant quantities of P into thewater column.
3.3.1 Simultaneous nitrification/denitrification. Simultaneous nitrification/denitrificationcould be a significant sink of nitrogen (Herbert, 1999). The decomposition processes takingplace in and the diffusion of oxygen through the water boundary layer (Equation 8) determinethe thickness of the oxic sediment layer (Jørgensen and Reisbech, 1995; Søndergaard, Jensen,and Jeppesen, 2003). However, this thin (few millimeters) oxygenated layer in impoundmentswith oxic hypolimnion or completely vertically mixed open channel flow provides a goodmedium for nitrifying microorganisms preferring solid surface over water. This is importantbecause nitrification in the oxic interstitial layer reduces ammonium release from the anaerobicsediments. Beutel (2006) measured the rate of ammonium release in eutrophic/hypereutrophiclakes with anoxic sediments (without oxic boundary layer) as exceeding 15 mg-N m-2 day-1 andemphasized the importance of hypolimnetic aeration, mainly to keep the interstitial layer aerobicfor development of nitrifiers. Pauer and Auer (2000) reported the concentration of nitrifiers of105 cells/ml in the upper sediment of two upper New York State lakes (Onondaga and Seneca),resulting in rapid nitrification while in the water column above the sediment the number ofnitrifiers was small (101 cells/ml) and no nitrification was observed. They concluded thatnitrification in freshwater impoundments is a sediment process but it should be noted thatnitrifiers are strict aerobes. Both processes in the upper oxic layer of the sediment, i.e.,nitrification of ammonia and oxidation of methane and of soluble Fe(II) being released fromanoxic lower sediments constitute then the Sediment Oxygen Demand (SOD) (DiToro et al.,1990) which can be as high as 6 g of O2/m
2-day but, based on the preceding discussion, iscontrolled by the oxygen and reactant transfer though the boundary layers.
Internal report not for distribution. If quoted use the web (http://www.aquanovaLLC.com) as the source.
21
Due to the concentration gradient between the nitrate content in the oxygenatedinterstitial sediment layer and that in the anoxic sediment below the net flux of nitrate isdownward into the anoxic sediment where it is ultimately denitrified to nitrogen gas (Figure 10)in the nitrate layer. Because benthic nitrifying organisms are strictly aerobic, disappearance ofoxygen from water overlying sediments stops simultaneous nitrification/denitrification processbut not denitrification in the nitrate layer. Hence, if enough nitrate is available from the anoxic orhypoxic overlying water column and top sediment layer, ammonium and methane are releasedfrom the sediments but iron (FeIII) or Al(III) phosphate complexes in the nitrate layer are notreduced and phosphate is not released because of the nitrate barrier (trap).
In wetlands, oxygenated zones with nitrifying microorganisms are also formed near therhizomes of the wetland plants (Mitsch and Gosselink, 2007). Therefore, a part of the dissolvedmethane emanating from the anaerobic sediment could be oxidized in these oxic zones byheterotrophic bacteria.
5. EFFECT OF HIGHER NITRATE AND SULFATE LOADS4.1 Nitrate paradox
The form of nitrogen in water and sediment is important and may distort the effect of theN:P ratio on eutrophication and even retard the eutrophication process if the N form is nitrate.The nitrate concentrations in the waters of the Czech Republic and other countries are very high,reaching and sometimes exceeding the World Health Organization potable water safety criterionof 10 mg of NO3
--N/L (see Table 5). A major part of nitrate loading originates from excessiveapplications of industrial fertilizers in agriculture and from converting wetlands to agriculture.The nitrate loads may be difficult to control because the soils and groundwater in manyagricultural watersheds are today oversaturated with nitrate-N (Stalnacke et al., 2009). The thirdsource is nitrate load from wastewater treatment facilities which in the EU communities (becauseof the EU nitrate directive) and also in the US, Japan and other countries, are now beingconverted to nitrify and denitrify TKN in wastewater. Less nitrate can be found in the Chinese orJapanese impoundments because rice fields (essentially artificial wetlands effectively denitrifyand remove nitrate, and most municipal effluents are not nitrified.
Table 5 Characteristic values of C90%* (C10% for DO) in the monitoring profiles of the direct
tributaries of the Švihov reservoir. Data from the Vltava Watershed (Povodi) Agency byHejzlar at al. (2006)
Parameter
Monitoring Profile
Želivka42000
Martinicky p.3000
Blažejovský p.2100
Sedlický p.0500
BOD5, mg/L 3.7 3.1 5.0 4.0
Chlophyll a, μg/L 26 23 28 38
pH 8.0 7.9 7.9 8.5
N-NH4+, mg/L 0.37 0.17 0.20 0.44
N-NO3-, mg/L 10.3 12.4 9.3 13.8
Total P, μg/L 170 180 180 140
C90% defines 90 percent of concentration is less or equal the value in the table
Internal report not for distribution. If quoted use the web (http://www.aquanovaLLC.com) as the source.
22
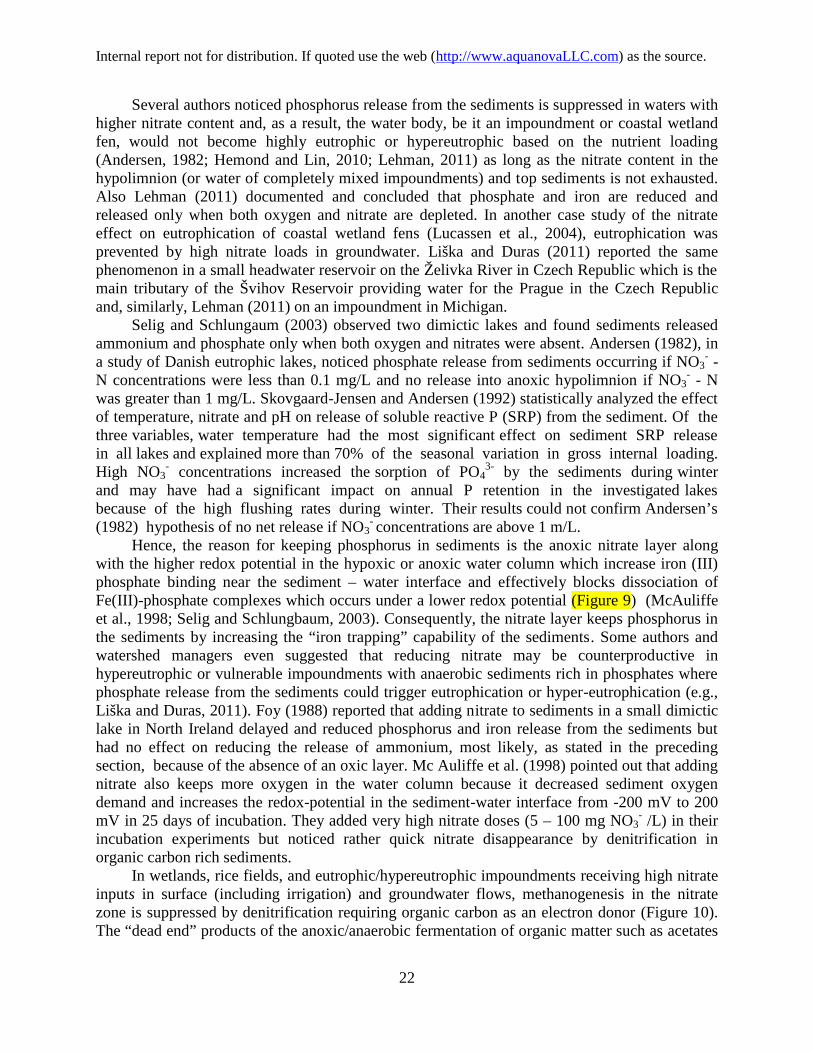
Several authors noticed phosphorus release from the sediments is suppressed in waters withhigher nitrate content and, as a result, the water body, be it an impoundment or coastal wetlandfen, would not become highly eutrophic or hypereutrophic based on the nutrient loading(Andersen, 1982; Hemond and Lin, 2010; Lehman, 2011) as long as the nitrate content in thehypolimnion (or water of completely mixed impoundments) and top sediments is not exhausted.Also Lehman (2011) documented and concluded that phosphate and iron are reduced andreleased only when both oxygen and nitrate are depleted. In another case study of the nitrateeffect on eutrophication of coastal wetland fens (Lucassen et al., 2004), eutrophication wasprevented by high nitrate loads in groundwater. Liška and Duras (2011) reported the samephenomenon in a small headwater reservoir on the Želivka River in Czech Republic which is themain tributary of the Švihov Reservoir providing water for the Prague in the Czech Republicand, similarly, Lehman (2011) on an impoundment in Michigan.
Selig and Schlungaum (2003) observed two dimictic lakes and found sediments releasedammonium and phosphate only when both oxygen and nitrates were absent. Andersen (1982), ina study of Danish eutrophic lakes, noticed phosphate release from sediments occurring if NO3
- -N concentrations were less than 0.1 mg/L and no release into anoxic hypolimnion if NO3
- - Nwas greater than 1 mg/L. Skovgaard-Jensen and Andersen (1992) statistically analyzed the effectof temperature, nitrate and pH on release of soluble reactive P (SRP) from the sediment. Of thethree variables, water temperature had the most significant effect on sediment SRP releasein all lakes and explained more than 70% of the seasonal variation in gross internal loading.High NO3
- concentrations increased the sorption of PO43- by the sediments during winter
and may have had a significant impact on annual P retention in the investigated lakesbecause of the high flushing rates during winter. Their results could not confirm Andersen’s(1982) hypothesis of no net release if NO3
- concentrations are above 1 m/L.Hence, the reason for keeping phosphorus in sediments is the anoxic nitrate layer along
with the higher redox potential in the hypoxic or anoxic water column which increase iron (III)phosphate binding near the sediment – water interface and effectively blocks dissociation ofFe(III)-phosphate complexes which occurs under a lower redox potential (Figure 9) (McAuliffeet al., 1998; Selig and Schlungbaum, 2003). Consequently, the nitrate layer keeps phosphorus inthe sediments by increasing the “iron trapping” capability of the sediments. Some authors andwatershed managers even suggested that reducing nitrate may be counterproductive inhypereutrophic or vulnerable impoundments with anaerobic sediments rich in phosphates wherephosphate release from the sediments could trigger eutrophication or hyper-eutrophication (e.g.,Liška and Duras, 2011). Foy (1988) reported that adding nitrate to sediments in a small dimicticlake in North Ireland delayed and reduced phosphorus and iron release from the sediments buthad no effect on reducing the release of ammonium, most likely, as stated in the precedingsection, because of the absence of an oxic layer. Mc Auliffe et al. (1998) pointed out that addingnitrate also keeps more oxygen in the water column because it decreased sediment oxygendemand and increases the redox-potential in the sediment-water interface from -200 mV to 200mV in 25 days of incubation. They added very high nitrate doses (5 – 100 mg NO3
- /L) in theirincubation experiments but noticed rather quick nitrate disappearance by denitrification inorganic carbon rich sediments.
In wetlands, rice fields, and eutrophic/hypereutrophic impoundments receiving high nitrateinputs in surface (including irrigation) and groundwater flows, methanogenesis in the nitratezone is suppressed by denitrification requiring organic carbon as an electron donor (Figure 10).The “dead end” products of the anoxic/anaerobic fermentation of organic matter such as acetates
Internal report not for distribution. If quoted use the web (http://www.aquanovaLLC.com) as the source.
23
and hydrogen are the best sources of the needed electrons. Because of the higher nitrate inputs,denitrification occurring in a thicker (several centimeters) anoxic layer has a critical influence onsuppressing methanogenesis in that layer.
Nitrate from the nitrate zone is converted to nitrous oxide and finally dinitrogen gas by thefacultative denitrifying bacteria according to the sequence below
NO3- → NO2
- → N2O → N2
Nitrate Nitrite Nitrous oxide(g) dinitrogen gas
requiring organic matter as electron. In the denitrification process, denitrifying bacteriaoutcompete the methanogens (Claren et al; 2006; Westerman and Kiǽr-Ahrig, 1987). Hence,acetogenesis is the source of organic carbon or hydrogen providing electrons for denitrificationand only after denitrification is carried to completion and nitrate is exhausted, can methane beformed. Watanabe, Motoyama, and Kuroda (2001) and Van de Pas-Schoonen et al. (2005)documented that both acetate and hydrogen gas produced by acetogenesis are used by twodifferent mixed species groups of denitrifying microorganisms and the final product is alkalinity(HCO3
-) and dinitrogen gas. The processes are represented by two stochiometrically and electrontransfer balanced models:Heterotrophic denitrification uses acetates as an electron donor, or
8NO3- + 5CH3 COOH → 4N2 + 10 CO2 + 6 H2O + 8 OH-
In the presence of hydrogen gas, also produced by acetogenesis, autotrophic denitrificationoccurs (most likely simultaneously) by a different microorganism group, or
2 NO3- + 5 H2 → N2 + 4 H2O + 2 OH-
Adding the two equations together and dividing by 5 one obtains
Carbon dioxide combines with the hydroxyl ion to produce alkalinity, hence, most carbon issequestered and not converted to gaseous methane
CO2 + OH- ↔ HCO3-
or after combining2 NO3
- + CH3 COOH + H2(g) → N2(g)+ 2 HCO3- + 2 H2O
The above models describing the simultaneous reactions illustrated on Figure 10 indicatedenitrification with acetate as an electron donor not only suppresses equivalent methaneformation it also minimizes emissions of nitrous oxides and carbon dioxide because most of theproduced carbon dioxide is converted to alkalinity and denitrification is completed to di-nitrogengas. The conversion of nitrate to dinitrogen gas is complete if enough acetate is present (Caldereret al., 2010). When nitrate is denitrified and organic carbon is still present that can produce
Internal report not for distribution. If quoted use the web (http://www.aquanovaLLC.com) as the source.
24
acetates the same denitrifying bacteria can reduce insoluble ferric iron(III)-phosphate complexesto soluble ferrous compounds which released P into pore water
Oh and Silvester (1999) found denitrification of nitrate completed when the OrganicC/Nitrate N ratio was greater than 2. This indicates that, with nitrate, simultaneous denitrificationand acetogenesis occurring in wetlands and organic aquatic sediments could suppress methaneformation and may provide significant carbon sequestering by converting carbon in thedecomposing biomass of algae and wetland plants assimilating CO2 to bicarbonate (alkalinity)instead to GHGs carbon dioxide and methane. Stochiometrically, 3.57 g of alkalinity as CaCO3is produced per gram of nitrate nitrogen reduced, or, for each gram of N denitrified, 0.9 grams ofC is sequestered into alkalinity. Additional carbon, N and P are incorporated into biomass andpeat formation which may be controlled by the availability of P. In rice fields, C, P and N areincorporated into husks and stalks. Wetland and lake sediments research should be conducted tofind out the best conditions for these processes to occur. It is also important to assure thatnitrogen gas is the final product of the nitrate reduction because nitrous oxide is a potent GHGand also interferes with the ozone layer. Microbial denitrification using dissolved methane as anelectron donor has been discovered in the laboratory in oxygen limited reactors but not innatural wetlands (Islas-Lima et al., 2006; Costa et al., 2000; Raghoebarsig et al., 2006).Nevertheless, it is possible.
4.1.1 Effect of the thickness of the nitrate layer on P release from the sediment. The nitratelayer is a part of the top boundary layer of the sediment and is located below the oxic layer, ifpresent. It is the zone in which denitrification occurs. It is thicker, in centimeters, than the oxiclayer (Søndergaard, Jensen, and Jeppesen, 2003; Vanderborght and Billen (1975). Measuredsediment profiles in laboratory and in situ revealed the thickness of the nitrate layer, which alsocontains the oxic layer, if present, in centimeters. Vanderborght and Billen developed a modelfor describing nitrate concentrations in the top sediment layer. In their calculations andlaboratory experiments the nitrate layer was 6 cm thick and the denitrification was a first orderprocess affected by temperature and sediment organic matter content (Pfenning and McMahon,1996; Opdyke and David, 2007). Several literature sources indicate if the source of organiccarbon is insufficient, nitrite can accumulate in water and pore water of the substrate/sedimentor, because of shortage of an electron donor, denitrification is concluded by emitting nitrousoxide gas (N2O) which is a potent GHG (Pfenning and Mcmahon, 1996; Westerman and KiǽrAhrig, 1987; Ettwig et al, 2008).
The concept of the flux through the oxic and nitrate boundary layers approximatelydescribed by Equation 9 fully explains the buffering of P release from sediments. The two layersin the sediment and in the diffusion layer above the sediment create a sharp redox potentialgradient in the top sediment and water diffusion layers, ranging from -100 to -200 mV in thesulfate anoxic/anaerobic layer interface between anoxic sulfate and nitrate layers to + 300 mV inthe oxic zone (Figure 9). In the anaerobic sediment layers, pore water concentrations of P arehigh. The P flux is directly proportional to the concentration difference between anaerobicsediment and that in the water above the boundary layers, and inversely proportional to thethickness of the boundary layers which are related to the third root of the Schmidt numbers.While third roots of the Schmidt number for nitrate and oxygen are about same (Table 5), thediffusion oxic layers in the upper sediment and water above are much thinner because theintensive deoxygenation process (SOD) in the oxic layers is faster than denitrification in thenitrate layer. If an oxic layer is present, denitrification in it is suppressed and nitrate is produced
Internal report not for distribution. If quoted use the web (http://www.aquanovaLLC.com) as the source.
25
from penetrating ammonium by nitrifying bacteria. Only when nitrate layer is lost or not presentthe P flux will increase.
4.1.2 Are high nitrate loads really beneficial? The above discussion of the effect of nitrates onthe P release suppressing in no way is endorsing the high loads of nitrate into receiving waterbodies. The fact that Cyano-HABs are triggered by high N and P loads and water content has notbeen changed. Nitrate in the water body epilimnion is still a critical nutrient and its highconcentration or addition reduces only the P input from the sediment but not from externalsources and could shift the Cyano HABs towards those dominated by Microcystis along withother cyanobacteria species that do not fix N2. Relatively rapid denitrification in organic carbonrich sediments decreases the N/P ratio which also shifts the development of HABs towardscyanobacteria dominated blooms (Lehman, 2011; Havens et al., 2003). It is true that high nitrateloads may positively impact and reduce net internal P loads tied in the sediments and substrate ofwetlands. However, as nitrates in the anoxic hypolimnion become depleted, the release ofphosphorus from P rich sediment will occur or significantly increase. Selig and Schlungbaum(2003) reported that anoxic nitrate protection lasted in the observed lakes until July when thehypolimnia became anaerobic and releases of ammonium and phosphate from the sedimentsincreased dramatically thereafter. It was already pointed out in the preceding sections thatsediment may contain far more phosphorus than that in the annual inflow of P fromallochthonous sources and nitrates in the sediment is transient and unreliable. Also at some pointof time if excessive allochthonous P loads from point and nonpoint source continue, the sedimentretention capacity will be exhausted. Consequently, relying on nitrates to prevent and/or controlhypereutrophic conditions is dealing with a time bomb.
4.2 Effects of sulfates on P exchange with water columnDuring the last century, sulfate loads to fresh and marine waters have significantly
increased due to industrial discharges, runoff from mining areas from pyrite oxidation, drainingof wetlands and use of sulfur for soil acidification conditioning in agriculture. The question iswhat the role of the sulfate reduction process in sediments is, besides giving sediments acharacteristic black color by metal sulfide particulates and pungent hydrogen sulfide smells.There is overwhelming evidence that adding more sulfates to receiving waters and increasingsulfate concentrations in water releases P from the sediments (Caraco et al, 1981; Zak, Kleeberg,and Hupper, 2006; Lamers et al., 2002; Lucassen et al., 2004) and under very specific instancesmay cause methyl mercury formation (Choi et al., 1994; Ekstrom et al., 2003; Gu et al., 2011) aswell as fish and biota methyl mercury tissue contamination (Gu et al., 2011).
Caraco et al. (1981) suggested three mechanisms by which sulfates can influence theability of sediment to retain or release phosphates: (1) sulfate in extremely high concentrationscan compete with phosphate for anion sorption sites in marine sediments (apparently notapplicable to fresh water bodies); (2) sulfides from sulfate reduction could bind iron in anoxicsediment to form ferrous sulfide compounds (pyrite) that releases phosphate from the Fe(III)-phosphate complexes, and (3) sulfate reduction increases alkalinity and pH which could preventP sorption onto sediments. The first process occurs only in marine sediments and coastalbrackish lakes and estuaries.
In anaerobic sediments sulfur reducing bacteria (SRB) reduce sulfate to sulfides usingcarbon from the products of anaerobic decomposition of organic matter in the sediment, such asacetates, as electron donor. This process may progress concurrently with methanogenesis.
Internal report not for distribution. If quoted use the web (http://www.aquanovaLLC.com) as the source.
26
However, methane is also a suitable electron source in the sulfate reduction (Meulepas et al.,2010); hence, sulfates can control releases of the GHG methane from the sediment. The reactionsdescribing the process are (Figure 11)
Acetate as an electron donor CH3COO- + SO42- → HS- + 2 HCO3
-
Methane as an electron donor CH4 + SO42- → HS- + HCO3
- + H2O
The former reaction occurs in both marine and freshwater sediments, the latter is typicalfor marine sediments (Meupelas et al., 2010). Hence, sulfate reducing microorganisms contributeto the mineralization of organic matter and could sequester carbon into alkalinity, preventing orreducing release CO2, and also reduce emissions of methane, both being green house gasses. Thesulfate to sulfide reduction effect on iron-phosphorus bonding reduces Fe(III) to Fe(II) whichleads to the release of PO4
3- into pore water and subsequently into water (Caraco et al., 1989;Lamers et al., 2002). However, both oxygen and nitrate inhibit the sulfate and iron reductions(He et al., 2010). In the absence of nitrates, sulfates in anoxic sediments pump phosphate intopore water. The released phosphorus can be absorbed in the sediment by over winteringcyanobacteria cysts and akinetes as a luxury uptake and can be, in this form, released into thewater column during the algal bloom when these forms leave the sediment and germinate (Figure6). The phosphate in pore water will also penetrate into water column by diffusion.
The concentration of dissolved sulfide (HS-) depends on the availability of reactive Fe inthe sediment (Lamers et al., 1998; 2002). Sulfides are toxic even at low concentrations,especially to aquatic macrophytes (Lamers et al., 1998; 2002) which may not grow in spite of theP release into pore water. Sulfur reducing bacteria in wetlands and sediments of impoundmentsplay a major role in immobilization of toxic metals. Normally, dissociated divalent metal ionscombine with the sulfide ion to form insoluble and detoxified metal-sulfide complexes as
2 HS- + Me2+ → MeS2(s) + H2
In the sediments, solid pyrite (FeS2) is the most abundant metal sulfide formed in the anoxiczone when nitrate is exhausted or not present (Morse and Luther III, 1999). Pyrite is notavailable for combining with phosphate. Lead, zinc, and cadmium precipitate faster as MeS2
solids than iron. As a matter of fact, sediment metal toxicity criteria for cadmium, lead, copperand zinc in the US are related to the acid volatile sulfide (AVS) content of the sediment inμmol/g. AVS are common even in anoxic sandy sediments (DiToro et al, 1990b). If the molarconcentration of AVS is greater than the total molar concentration of potentially toxic metals(including mercury) in the sediment, the metals are bound in MeS2 complexes and are not toxic(Salomons and Főstner, 1990, Salomons and Stol, 1995; DiToro and DeRosa, 1995; Novotny,2003).4.2.1 Methyl mercury formation. Normally, mercury in high concentrations could react withsulfides to form cinnabar (HgS2) (Morse and Luther III, 1999). However, when the sulfateconcentration in water becomes low, dissolved organic carbon is between 10 to 20 mg/L (Figure12) and mercury is present even in nanogram/L concentrations, which could originate fromregional atmospheric deposition, highly toxic and bioaccumulative di-methyl mercury can beformed (Mergler et al., 2007). This compound is toxic to fish, other aquatic biota and throughbioaccumulation and fish consumption to humans and is known for some very serious mercurypoisoning episodes (e.g., Minamata in Japan) (Mergler et al., 2007). Sulfur reducing bacteria inanoxic sediments are the primary producers of methyl mercury (Choi et al., 1994; Ekstrom et al.,
Internal report not for distribution. If quoted use the web (http://www.aquanovaLLC.com) as the source.
27
2004) and the input into the methylation process is acetate, an intermediate product of anaerobicdigestion, and not the final product methane. Production of methyl mercury is most favoredunder biochemical conditions where sulfate is sufficient to support significant rates of microbialsulfate reduction by sulfur reducing bacteria without much accumulation of aqueous hydrogensulfide (Gu et al., 2011).
Figure 12
Sulfate reduction, methyl mercuryformation and metal immobilization inanaerobic sediments and wetlandsubstrate
6. CONCLUSIONSWidely spread harmful algal blooms (Cyano-HABs) and hypereutrophic conditions of
impoundments in some countries in the last thirty to forty years are a result of intensification ofagriculture exhibited by increased use and overuse of industrial fertilizers and tile drainage, andnutrient discharges from urban point and diffuse sources. Use of phosphate detergents and oftenlack of adequate treatment increased point source phosphorus loads. Today, hypereutrophicwater bodies on a large scale are endemic in China, Holland, Korea and the Czech Republic butthe danger is spreading (e.g., Florida, Texas and California in the US, France, Germany).
In hypereurophic water bodies important metabolic processes occur in sediments andcyanobacteria in modified form can settle into the sediments at their convenience where they cansurvive and receive nourishment for years and subsequently can reenter the water column andcreate algal bloom. Management practices must therefore focus on both reducing the nutrients inthe water column and preventing cyanobacteria growth and nourishment by nutrients in thesediment. The mass of nutrients and of hibernating cyanobacteria microorganisms typicallyexceed those in the water column during a bloom.
In order to prevent the hypereutrophic status, both nutrients must be controlled butcontrolling high nitrate loads may be more difficult because the soil in the watershed may beoverloaded by legacy of over fertilization. China’s fertilizer application rates nationwide arehigher than those in the Czech Republic or the US (Novotny et al., 2010; Novotny 2011) but inChina more nitrate is lost by denitrification in rice fields. Phosphate detergents manufacturingand distribution was banned only recently (in 2006) in the Czech Republic and, as of 2011, wasstill only proposed by the EU community and in China. Focusing on reducing nitrate (vis a visthe mandate by the EU nitrate directive) more than phosphorus in water bodies vulnerable to orin initial stages of hypereutrophy may diminish the anoxic nitrate barrier in the hypolimnion andsediments, triggering a release of phosphorus from the sediments. Nitrate can be graduallyreduced after phosphate input is significantly reduced and oxic hypolimnion and the oxic and
Internal report not for distribution. If quoted use the web (http://www.aquanovaLLC.com) as the source.
28
nitrate barrier in the sediments are firmly established. Nevertheless, the “beneficial role” ofnitrates is only tempory. Adding nitrates may have some benefits when the situation is alreadybad, i.e., the water body is already eutrophic and vulnerable to becoming hypereutrophic.However, the nitrate layer alone can only delay the onset of Cyano-HABs but the length of thedelay is difficult to predict. More research, better understanding of hypertrophy and Cyano-HABs, development of better multilayer models are needed to prevent and control thisphenomenon which may also be affected by anticipated climatic changes.
The change from mesotrophic/eutrophic status to a hypereutrophic one with harmfulcyanobacteria blooms (Cyano HAB) is non-linear and when the switch occurs, reversing back toan acceptable status is difficult and very costly. Some changes may be irreversible (Folke et al.,2005). The classic Vollenweider’s (1975) model fails when applied to cyanobacteria and hyper-eutrophic conditions (Hellweger et al., 2008). There is an urgent need to develop new generationmodels that would portray accurately the peculiar behavior of cyanobacteria, their mobility toand from the sediments and their behavior and nourishment that would be coupled to multilayernutrient models of the impoundment (see Hellweger et al., 2008).
The standards (criteria-goals) for the total maximum daily load (TMDL) assessments andplanning for vulnerable water bodies must be stringent with regards to phosphorus loads and inthe margin of safety respect the fact that the current models are inadequate to properly describethe phosphorus (and other chemicals) exchange between water and sediment. Bringing only the Pconcentration in the water column to the values typical for eutrophic impoundments (e.g., 50 to70 μg/L) will not revert the water body from hypereutrophic status to a better status. Specifically,for protecting impoundments providing water supply or recreation, the standard should be lessthan 50 μg/L and the goal should be to bring the water body to the mesotrophoic status (Total P< 25 μg/L). Nitrate is regulated by the World Health Organization worldwide criterion specifying10 mg/L of nitrate N as a limit for water supply water bodies. The European Community nitratedirective restricts nitrate loads in vulnerable watersheds to protect mainly large marine waterbodies, North, Baltic, and Black Seas, from excessive algal growths (HABs) that are nitrogenlimited. Ammonium (TKN) is controlled in the US by the toxicity criteria issued by the US EPA(2009). TKN is a more dangerous pollutant than nitrate, based on the “apparent” retarding effectof nitrate in preventing hyper-eutrophication.
The ability of wetlands and sediments remove nitrates and immobilize phosphatesprovides an argument for installing or restoring alluvial wetlands as buffers to high nitrate andphosphate load to water bodies vulnerable to eutrophication. The additional significantunexpected benefits of removing nitrates are sequestering carbon in a form of alkalinity,reducing methane emissions, and producing biomass for manufacturing biofuel. Carbonsequestering is limited in wetlands with low nitrate loads from which methane and carbondioxide emissions may be significant Mitsch, and Gosselink, 2007).
Simple remediation measures such as reducing phosphorus only will not work in theeffort to revert already hyper-trophic water bodies back to mesothrophic or lower hyper-trophicconditions because the internal loads in such bodies may vastly exceed the allochthonous loads.Some simple mitigation measures may be outright harmful such as destratification by mixing andaeration. The current mitigation measures are extensive and multifaceted, including watershed,and, if not done properly and vigorously, may not always be successful in a long term. Torestore and/or protect water bodies of a great importance such as those providing water supply tolarge municipalities the abatement is regional, not just focusing on the impacted water body.
Internal report not for distribution. If quoted use the web (http://www.aquanovaLLC.com) as the source.
29
Acknowledgment. The author appreciates and acknowledges the opportunity given to him bythe US Fulbright Foundation-US Department of State, University of Chemical Technology(VŠChT) in Prague and A.R.C. Corporation in Prague to study the problem of the danger ofhypereutrophic water bodies, work with colleagues from the Czech Republic and present hisviews therein. He appreciates collaboration and comments of Professors Jiří Wanner andBlahoslav Maršálek of VŠCHT, Ing, Jiří Holas of A.R.C. sro, and Associate Professor JosefHejzlar from the Hydrobiological Institute of the Czech Academy of Sciences (ČAV) in ČeskéBudĕjovice. The views expressed in this paper are solely t hose of the author. The author alsoacknowledges the cooperation with Professor Chengqin Yin from Chinese Academy of Sciencein Beijing who organized the site visits of Taihu watershed and the provincial government ofBeijing sponsoring author’s participation and invited presentation on this topic at the World LakeCongress in Wuhan in November 2009. Special thanks are expressed to Professor PatrickBrezonik (Professor Emeritus at the University of Minnesota) who reviewed the manuscript andprovided valuable comments and suggestions for improvement.
7. REFERENCESAndersen, J.M. (1982) Effect of nitrate concentrations in lake water on phosphate release from
the sediment, Water Research 16(7): 1119-1126Babica, P., L. Bláha, J. Kohoutek. O. Adamovský, L. Bláhová, and B. Maršálek (2006)
Microcystiny v pitných vodách ČR (Microcystins in potable waters of Czech Republic)Conf. Proceedings Cyanobakterie 2006, biologie, toxikologie and management, Centrefor Cyanobacteria and their Toxins, Masaryk University, Brno, Czech Republic May 24-25, 2006, pp. 54
Beutel, M.W. (2006) Inhibition of ammonia release from anoxic profundal sediments in lakesusing hypolimnetic oxygenation, Ecological Engineering 18: 271-279
Bláha, L., and B. Maršálek (2003) Contamination of drinking water in the Czech Republic bymicrocystins, Archiv fűr Hydrobiologie, 158:421-429
Bláha, L., and B. Maršálek (2009) Toxiny sinic a jejich účinky na vodní ecosystémy (Toxins ofcyano-bacteria and their effects on aquatic ecosystems – in Czech), Vodní Hospodářství59(2):50-54
Bláha, L., P, Babica, K. Kohoutek, L. Bláhová, O. Adamovský, B. Maršálek, et al., (2006)Koncentrace microcistnů v ČR – Dlouhodobé trendy a sezónní variability(Concentrations of microcystins in Czech Republic – Long term trends and seasonalvariability – in Czech) Conf. Proceedings Cyanobakterie 2006, biologie, toxikologie andmanagement, Centre for cyanobacteria and their toxins, Masaryk University, Brno, CzechRepublic May 24-25, 2006, pp. 37-43
Boudreau, B.P. (1988) Mass-transport constraints on the growth of discoidal ferromanganesenodules, Am. J. Sci. 288:777-797
Boudreau, B.P., and B.B. Jørgensen (2004) The benthic boundary layer: Transport processesand biochemistry, Oxford University Press, Oxford
Brezonik, P. L., and D.R. Engstrom (1988) Modern and historic accumulation rates ofphosphorus in Lake Okeechobee, Florida, Journal of Paleolimnology 20:31-46
Calderer, M. et al. (2010) Denitrification in presence of acetate and glucose for bioremediationof nitrate-contaminated groundwater, Environmental Technology 31(7):799-814
Internal report not for distribution. If quoted use the web (http://www.aquanovaLLC.com) as the source.
30
Caraco, N. F., J. J. Cole, and G. E. Likens (1989) Evidence for sulphate-controlled phosphorusrelease from sediments of aquatic systems, Nature 341(6240):316-318.
Carlson, R.E. (1977) A trophic state index, Limnology and Oceanography 22:361-369Carmichael, W.W. (1992) A Status Report on Planktonic Cyanobacteria (Blue-green algae) and
their toxins. 9/600/R-92/079, U.S. Environmental Protection Agency, Washington, DC,141 pp
Carmichael WW (1997) The cyanotoxins, Advances in Botanical Research. 27:211-256Chapra, S.C. (1997) Surface Water Quality Modeling, McGraw-Hill Co., New YorkChapra, S. C., and P.R Canale (1991) Long-term phenomenological model of phosphorus and
oxygen for stratified lakes. Water Res., 25(6):707-715Choi, S.C., T. Chase, Jr., and R. Bartha (1994) Metabolic pathways leading to mercury
methylation in Desulfovibro desulfuricans LS, Appl. Environ. Microbiology60(11):4072-4077
Chorus, I., and J. Barton, eds. (1999) Toxic Cyanobacteria in Waters – A Guidance to theirPublic Health Consequences, Monitoring, and Management, WHO Publications, E & FNSpoon Publishers
Claren, M., N. Bernet, J.P. Delgenes, and R. Moletta (20, NY06) Effects of nitrogen oxides anddenitrification on acetotrophic methanogenesis by Methanosarcina mazei, FEMSMicrobioology Ecology 25:271-276
Conley, D.J., H.W. Paerl, R.W. Howarrth, D.F. Boesch, S. P. Seitzinger, K.E. Havens, C.Lancelot, and G.E. Likens (2009) Controlling Eutrophication: Nitrogen and Phosphorus,Science 323:1014-1015
Costa, C., C. Dijkema, M. Friederich, P. Garcia-Encina, F. Fernandez-Polanco, and A.J. Stams(2000) Denitrification with methane as electron donor in oxygen-limited bioreactors,Appl. Microbiol. Biotechnol. 53(6):75-62
Crank, J. (1973) The Mathematics of Diffusion, Oxford University Press, Oxford, UKDillon, P.J., and F.H. Rigler (1974) A test of a simple nutrient budget model predicting the
phosphorus concentration in lake water, Journal of the Fisheries Research Board ofCanada 31:1771-1778
Di Toro, D. M., P R. Paquin, K Subburamu, and D A. Gruber (1990 a) Sediment OxygenDemand Model: Methane and Ammonia Oxidation. J. Environ. Engr. ASCE 116(5):945-986
DiToro, D.M., et al. (1990 b) Toxicity of cadmium in sediments: the role of acid volatile sulfide,Environ. Toxicol. Chem. 9:1487-1502
DiToro, D.M. and L.D. DeRosa (1995) Sediment toxicity and equilibrium partitioning:development of sediment quality criteria for toxic substances, in Remediation andManagement of Degraded River Basins (V.Novotny and L. Somlyódy, eds.) , Springer-Verlag, New York, pp. 197-230
Duras, J. (2008) Workshop “Revitalization of the Orlik Reservoir” (in Czech), LimnologicalNews, Czech Limnological Society, No. 4, pp. 1-4
Einsele, W. (1936) Über die Bezienhungen des Eisenkreislauf in eutrophen See (Relationships iniron cycling of eutrophic lakes), Arch. Hydrobiol.29:664-686
Ekstrom, E. B., F.M.M. Morel, and J.M. Benoit (2003) Mercury methylation independent ofacetyl-coenzyme A pathway in sulfate reducing bacteria, Appl. Environ. Microbiology69(9):5414-5422
Internal report not for distribution. If quoted use the web (http://www.aquanovaLLC.com) as the source.
31
Ettwig, K.F., S. Shina, K.T. Van de Pas-Schoonen, J. Kannt, M.H. Medena, H.J. Op den Camp,M.S. M. Jetten, and M. Strous (2008) Denitrifying bacteria anaerobically oxidizemethane in the absence of Archaea, Environ. Microbiol. 10:3164-73
Fair, G.M. and J.C. Geyer (1954) Water Supply and Waste-water Disposal, J. Wiley & Sons,New York, NY
Field, S.J., and M.D. Duerk (1988) Hydrology and Water Quality of Delavan Lake inSouthwestern Wisconsin, Water Res. Investigation Rep. 87-4168, US Geological Survey,Madison, WI
Fogg, G.E. (1969) The physiology of an algal nuisance. Proc. R. Soc. London B. 173:175-189Folke, C., S. Carpenter, B. Walker, M. Scheffer, T. Elmquist, L. Gunderson, and C.S. Holling
(2005) Regime shifts, resilience, and biodiversity in ecosystem management, Ann.Review of Ecology, Evolution and Systematics, 35:557-581
Foy, R.H. (1988) Suppression of phosphorus release from lake sediments by the addition ofnitrate, Wat. Res. 20(11):1345-1351
Gächter, R., and B. Wehrli (1998) Ten years of artificial mixing and oxygenation: no effect onthe internal phosphorus loading in two eutrophic lakes, Environ. Scvi. Technol. 32:3659-3665
Golterman, H.L. (2001) Phosphate release from anoxic sediments or “What did Mortimer reallywrite?”, Hydrobiologia 450:99-106
Grøterud, O., and S. Haaland (2007) Φstensjøvannet- a shallow hypereutrophic lake in Norwaywith significant internal phosphorus loading during summer, VATTEN 63:313-320
Gulati, R.D. and E. Van Donk (2002) Lakes in the Netherlands, their origin, eutrophication, andrestoration: State of the art, Hydrobiologia 478:73-106
Gu, B. et al. (2011) Regional mercury and sulfur monitoring and environmental management,Chapter 3B, 2012 South Florida Environmental Report, SF Water Management District,West Palm Beach, FL,http://my.sfwmd.gov/portal/page/portal/xweb%20about%20us/agency%20reports
Havens, K.E. and C.L. Schelske (2001) The importance of considering biological processeswhen setting total maximum daily loads (TMDL) for phosphorus in shallow lakes andreservoirs, Environmental Pollution 113:1-9
Havens, K.E., R.T. James, T.L. East and V.H. Smith (2003) N:P ratios, light limitations, andcyanobacterial dominance is a subtropical lake impounded by non-point source nutrientpollution, Environmental Pollution 122:379-390
Havens, K.E., and R.T. James (2005) Phosphorus mass balance of Lake Okeechobee, Florida:Implications for eutrophication management, Lake and Reservoir Management21(2):139-148
Havens, K.E., T. Fukushima, P. Xie, T. Iwakuma, R.T. James, N. Takamura, T. Hanazato, and T.Yamamoto (2001) Nutrient dynamics and the eutrophication of shallow lakes,Kasamigaura (Japan), Donghu (PR China) and Okeechobee (USA), EnvironmentalPollution 111:263-272
He, Q., Z. He, D.C. Joyner, M. Joachimiak, M. N. Proce, Z. K, Yang et al. (2010) The ISMEJournal 4:1386-1397, doi:10.1038/ismej.2010.59
Head, R. M., Jones, R. I., Bailey-Watts, A. E. (1999). An assessment of the influence ofrecruitment from the sediment on the development of planktonic populations ofcyanobacteria in a temperate mesotrophic lake. Freshwater Biology 41: 759-769.
Internal report not for distribution. If quoted use the web (http://www.aquanovaLLC.com) as the source.
32
Hejzlar, J. (2006) Management options to control ecological potential of reservoirs, Proc. The 5th
Interntl. Conf. Reservoir Limnology and Water Quality, August 27-31, 2006, Brno,Czech Republic, Institute of Botany of the Czech Academy of Sciences
Hejzlar, J., K. Forejt, J. Duras, J. Goldbach, M. Liška, P. Maleček, and R. Ziegler (2006)Vodárenská Nádrž Švihov, - Výsledky Monitoringu v Období 2001-2005 (Water supplyreservoir, Švihov- Monitoring Results from the 2001-2005 Period- in Czech), PovodíVltavy (Vltava River Watershed Management Agency), Prague
Hejzlar, J., J. Borovec, P. Mošnerová, J. Polívka, J. Turek, A. Volková, and J. Žaloudík (2010) Amass balance of nutrient sources in the catchment of Orlik Reservoir: 1. Principles,methods, results (in Czech). In Proceedings Restoration of Orlik Reservoir,Hydrobiological Institute of Czech Academy of Sciences, České Budĕjovice, CzechRepublic, ISBN 978-80-254-9014-3.
Hellweger, F., E. Kravchuk, V. Novotny and M. Gladyshev (2008), Agent-based modeling of acomplex lifecycle of cyanobacterium (Anabaena) in a shallow lake, Limnol. Ocean.53(40):1227-1241
Hemond, H.F. and K. Lin (2010) Nitrate suppresses internal phosphorus loading in an eutrophiclake, Water Research 44:3645-3650
Higashino, M., and H. Stefan (2004) Diffusive boundary layer development above a sediment –water interface, Water Environment Research 76(4):292 -300
Hupper, M., and J. Lewandowski (2005) Retention and early diagenetic transformation ofphosphorus in Lake Arendsee (Germany) – consequences for managing strategies. Arch.Hydrobiol. 164:143-167
Hupper, M. and J. Lewandowski (2008) Oxygen controls the phosphate release from sediments –a long- last paradigm in limnology, Internat. Rev. Hydrobiol. 93(4-5):415-432
Islas-Lima, S., F. Thalasso, and J. Gomez-Hernandez (2003) Evidence of anaerobic methaneoxidation coupled to denitrification, Water Research 38(1):13- 16
Iversen, N., and B.B. Jørgensen (1993) Diffusion coefficient of sulfate and methane in marinesediments: Influence of porosity, Geochimica & Cosmochimica Acta 57(3):571-578
Jørgensen, B.B., and N. P. Revsbech (1985) Diffusive boundary layer and the oxygen uptake ofsediments and detritus. Limnol. Oceanogr. 30(1):111-122
Jørgensen, B.B., and D.J.Des Marais (1990) The diffusive boundary layer of sediments: Oxygenmicrogradients over microbial mat Limnol. Oceanogr. 35(6):1343-1355
Katsev, S., I. Tsandev, I. L’Heureux, and D. G. Rancourt (2006) Factors controlling long-termphosphorus efflux from lake sediments: Exploratory reactive-transport modeling,Chemical Geology 234:127-147
Kosten, S., A. Kamarainen, E. Jeppersen, H. van der Nes, E.T. H.M. Peeters, G. Lacerot, and M.Scheffer (2009) Climate-related differences in the dominance of submerged macrophytesin shallow lakes, Glob Change Biol. 15:2503-2517
Kopáček, J., M. Marešová, and J. Hejzlar (2007) Natural inactivation of phosphorus byaluminum in preindustrial lake sediments, Limnol. Oceanogr. 53(3):1147-11455
Krenkel, P. and V. Novotny (1980) Water Quality Management, Academic Press, New York,NY
Krom, M.D. and R. A Berger (1980) The diffusion coefficients of sulfate, ammonium, andphosphate ions in anoxic marine sediments, Limnol. Oceanogr. 25(2):327-337
Internal report not for distribution. If quoted use the web (http://www.aquanovaLLC.com) as the source.
33
Lamers, L.P.M., H.B. Tomassen, and J.G.M. Roelofs (1998) Sulfate-induced eutrophication andphytotoxicity in freshwater wetlands, Environ. Sci. Technol., 32:199-205
Lamers, L.P.M., S.J. Falla, E.M. Samborska, I.A. R. van Dulken, G. van Hengstum, and J.G.M.Reelofs (2002) Factors controlling the extent of eutrophication and toxicity in sulfate-polluted freshwater wetands, Limnology and Oceanography 47(2):585-593
Lehman, J.T. (2011) Nuisance cyanobacteria in an urbanizing impoundment: interacting internalphosphorus loading, nitrogen metabolism, and polymixis, Hydrobiologia 661:
Liška, M., and J. Duras (2011) VN Švihov – monitoring water quality in the catchment and itsresults (in Czech with English abstract) Vodní Hospodářsví (Water Management) No3:93-98
Liška, M., M. Krátký, J. Goldbach, K. Soukupová, and K. Forejt (2012) The largest source ofpotable water in Czech Republic – Water reservoir Švihov on the Želivka River ( InCzech with English abstract), Vodní Hospodářsví (Water Management) No. 3, pp.78-82
Lucassen, E.C.H.E.T., A.J.P. Smolders, A.L. Van der Salm, and J.G. Roelofs (2004) Highgroundwater nitrate concentrations inhibit eutrophication of sulphate-rich freshwaterwetlands, Biogeochemistry, 67:249-267
Magley, W. (2003) Total Maximum Daily Load for Total Phosphorus for Lake Apopka, Lake andOrange Counties, Florida, Florida Dept. of Environmental Protection, WatershedAssessment Section, Tallahassee, FL
Maršálek, B. , M. Drábková, M. Feldmanová, and K. Hilscherová (2012) Sediments of Brnoreservoir: remove, reuse, or treatment in situ? Power point presentation, RECETOX,Masaryk University, Brno, accessed March 2012http://www.recetox.muni.cz/coe/sources/workshop_3_soil_sed/Marsalek.pdf,
McAuliffe, T.F., R.J. Lukatelich, A.J. McComb, and S. Qiu (1998) Nitrate application to controlphosphorus release from sediments of a shallow eutrophic estuary: an experimentalevaluation, Marine and Freshwater Research 49(6):463-473
Mergler, D., H.A. Anderson, L.H.M. Chan, K.R. Mahaffey, M. Murray, M. Sakamoto and A.H.Stern (2007) Methylmercury exposure and health effects in humans: a worldwideconcern. AMBIO: A Journal of the Human Environment, 36: 3-11
Meulepas R.J., C.G. Jagersma, A.F. Khaden, A.J.M. Stams, and P.N.L. Lens (2010) Effect ofmethanogenic substrates on anaerobic oxidation of methane and sulfate reduction by ananaerobic methanotrophic enrichment, Appl. Microbiol. Biotechnol. 87:1499-1506
Mitsch, W.J., and J. Gosselink (2007) Wetlands (4th ed.), J. Wiley ands Sons, Hoboken, NJMortimer, C.H. (1941, 1942) The exchange of dissolved substances between mud and water in
lakes, J. Ecology 29:280-329, J. Ecology 30:147-201Morse, J.W., and G.W. Luther III (1999) Chemical influence on trace metal-sulfide interactions
in anoxic sediments, Geochimica et Cosmochimica 63:3373-3378Moss, B., S. Kosten, M. Meerhoff, R. Battabee, E. Jeppesen, N. Mazzeo, et al. (2011) Allied
attack: climatic change and eutrophication, Inlands Waters 1:101-105, DOI:10.5268 IW-1.2.359
Newman, J., and K.E. Thomas-Alyea (2004) Electrochemical Systems, J. Wiley & Sons,Hoboken, NJ
Novotny, V. (1968) On the diffusion phenomenon in boundary layers of turbulent flow and itsinfluence on the course of self-purification of small streams, Water Research 2(1):6-8
Novotny, V. (1969) Boundary layer effects on the course of self-purification of small streams,Advances in Water Pollution Research, Pergamon Press, Elmsford, NY, pp.39-50
Internal report not for distribution. If quoted use the web (http://www.aquanovaLLC.com) as the source.
34
Novotny, V. (2003) WATER QUALITY: Diffuse Pollution and Watershed Management, J. Wiley,Hoboken, NJ
Novotny, V. (2009) Cyanobacteria blooms and hypertrophy in reservoirs with a focus on theŽelivka River, Water Management (Vodní Hospodářství), Prague 59(5):171-179
Novotny, V. (2011) The Danger of Hypereutrophic Status of Water Supply ImpoundmentsResulting from Excessive Nutrient Loads from Agricultural and Other Sources, Journalof Water Sustainability 1(1):1-22
Novotny, V. and G. Chesters (1989) Handbook of Nonpoint Pollution: Sources andManagement, Van Nostrand Reinhold Publ., New York, NY
Novotny. V., X. Wang, A.J. Englande, David Bedoya, L. Promakasikorn, and R. Tirado (2010)Comparative assessment of pollution by the use of industrial agricultural fertilizers in fourrapidly developing Asian countries, Environment, Development, and Sustainability,12:491-509
Nürnberg, G.K. (1984) The prediction of internal phosphorus load in lakes with anoxichypolimnia, Limnol. Oceanogr., 29(1):111-124
Nürnberg, G.K. (1994) Phosphorus release from anoxic sediments: What we know and how wecan deal with it, Limnetica 10(1):1-4
Oh, J., and J.A. Silversten (1999( Acetate limitations and nitrite accumulation during denitrifica-tion, J. Envir. Eng.. Div. (ASCE) 125(3):234-242
Opdyke, M. R., and M.B. David (2007) Response of sediment denitrification rates to environ-mental variables in streams heavily impacted by agriculture, Journal of FreshwaterEcology, 22(3):371-382
Paerl, H.W (1988) Nuisance phytoplankton blooms in coastal, estuarine, and inland waters.Limnol. Oceanogr. 33:823-847
Paerl, HW (1996) A comparison of cyanobacterial bloom dynamics is freshwater, estuarine andmarine environments. Phycologia 35(6):25-35
Paerl, H.W., R.S. Fulton,III, P.H. Moisander, and J. Dyble (2001) Harmful freshwater algalblooms, with an emphasis on Cyanobacteria, The Scientific World 1:76-113
Paerl, H.W. and R.S. Fulton III (2006) Ecology of harmful cyanobacteria, Chapter 89 in Ecologyof Harmful Algae ( E. Grandeli and J.T. Turner, eds) Ecological Studies Vol. 189, pp.95-109 , Sopringer – Verlag Berlin Heidelberg
Paerl, H.W., H. Xu, M. McCarthy, G. Zhu, B. Qin, Y. Li, and W. Gardner (2010) Controllingharmful cyanobacteria blooms in a hyper-eutrophic lake (Lake Taihu, China): The needfor a dual nutrient (N & P) management strategy, Water Researchdoi:101016/j.waters.2010.09.018
Pfening, K.S. and P.R. Mc. Mahon (1996) Effect of nitrate, organic carbon, and temperature onpotential denitrification rates in nitrate-rich riverbed sediments, Journal of Hydrology187:283-295
Pauer, J.J. and M. T. Auer (2000) Nitrification in the water column and sediments of ahypereutrophic lake and adjoining river system, Water Research 34(4):1247-1254
Pettersson, K. (2001) Phosphorus characteristics of settling and suspended particles in LakeErken, Sci. Total Environ. 266:79-86
Picioreanu, C., M.C.M. van Loostdrecht, and J.J. Heinen (1997) Modeling the effect of oxygenconcentration on nitite accumulation in a biofilm airlift suspension reactor, Water Science& Technology 6(7):147-156
Internal report not for distribution. If quoted use the web (http://www.aquanovaLLC.com) as the source.
35
Pollman, C. D., and T. James (2011) A simple model of internal loading of phosphorus in LakeOkeechobee, Lake and Reservoir Management 27:15-27
Prandtl, L. (2010) Eine bezihung zwischen wärmenaustausch und strömungwiderstand derflüsigkaiten (Relation between heat exchange and flow friction of streams- in German),Physikalische Zeitschrift 11:1072
Raghoebarsing, A.A., et al. (2006) A microbial consortium couples anaerobic methane oxidationto denitrification, Nature 440:918-921
Reckow, K. (1979) Uncertainty analysis applied to Vollenweider’s phosphorus loading criterion,Journal WPCF 51(8):2123-2128
Reddy, K.R., T.C. Feije, W.H. Patrick (1986) Effect of soil redox conditions on microbialoxidation of organic matter, in Role of Organic Matter in Modern Agriculture (Y. Chenand Y.Ennimelech, eds.), Martinus Nijhoff, Dortrecht, The Netherlands
Roberts, J. and A. McMinn (2004) Marine diffusive layers at high latitudes, Limnol. Oceanogr.,49(4-PartI):934-939
Rohlich, G.A. (1969): Causes, Consequences, Correctives, National Academy of Sciences,Washington, DC, pp. 307
Salomons, W., and U. Főrstner (1984) Metals in the Hydrosphere, Springer Verlag. BerlinSalomons, W., and B. Stol. (1995). Soil pollution and its mitigation: Impact of land use changes
on soil storage of pollutants, in Nonpoint Pollution and Urban Stormwater Management(V. Novotny, ed.), TECHNOMIC Publishing Co., Lancaster, PA, pp. 153-192
Sawyer, C.N. (1947) Fertilization of lakes by agricultural and urban drainage, Journal New Engl.Water Works Assoc., 51:109-157
Schindler, D.W., R.E. Hecky, D.L. Findley, M.P. Stainton, B.R. Parker, M. Paterson, K.G.Beaty, M. Lyng, and S. E. M. Kasian (2008) Eutrophication of lakes cannot be controlledby reducing nitrogen inputs: Results of a 37 year whole ecosystem experiment.Proceedings of the National Academy of Science USA 105:11254-11258
Schlichting, H., and K. Gersen (2000) Boundary Layer Theory, Springer VerlagSelig, U. and G. Schlungbaum (2003) Characterization and quantification of phosphorus release
from profundal bottom sediments in two dimictic lakes during summer stratification, J.Limnol. 62(2):151-162
Skovgaard-Jensen, H. and F. Ø. Andersen (1992) Importance of temperature, nitrate and pH forphosphorus release from aerobic sediments of four shallow, eutrophic lakes, Limnol.Oceanogr., 37(3):377-389
Smith, V.H., and S.J. Bennett (1999) Nitrogen: phosphorus supply ratios and phytoplanktoncommunity structure in lakes, Archiv für Hydrobiologie 146:37-53
Søndergaard, M., J.P. Jensen, and E. Jeppesen (2003) Role of sediment and internal loading ofphosphorus in shallow lakes, Hydrobiologia 506-509: 1350145
Stalnacke, P., A. Pengerud, M. Bechmann, J. Garnier, C. Humborg, and V. Novotny (2009)Nitrogen driving force and pressure relationships at contrasting scales: implications forcatchment management Journal of River Basin Management, 7(3):221-232
Šejnohová, L., and B. Maršálek (2006 ) MICROCYSTIS – Dominující rod vodních květů: Novépoznatky v autekologii ( MICROCISTIS – A dominant species of algal blooms: Newfindings in autecology- in Czech), Conf. Proceedings Cyanobakterie 2006, biologie,toxikologie and management, Centre fro cyanobacteria and their toxins, MasarykUniversity , Brno, Czech Republic May 24-25, 2006, pp. 7-12
Internal report not for distribution. If quoted use the web (http://www.aquanovaLLC.com) as the source.
36
Tang, H. and P. Xie (2000) Budgets and dynamics of nitrogen and phosphorus in a shallow,hypereutrophic lake in China, Journal of Freshwater Ecology 15(4):505-514
Thibodeaux, L.J. (1996) Environmental Chemodynamics: Movement of Chemicals in Air, Water,and Soil, 2nd. Ed., Environmental Science and Technology Texts and Monographs (J.Schnoor and A. Zehnder, eds.), J. Wiley, Hoboken, NJ
U.S. Environmental Protection Agency (1974) The Relationship of Phosphorus and Nitrogen tothe Trophic State of Northeast and North-central Lakes and Reservoirs, NationalEutrophication Survey Work, Paper 23, U.S. EPA, Washington, DC
U.S. Environmental Protection Agency (1991) Guidance for Water Quality-based Decitions: TheTMDL Process, Assessment and Watershed Protection Division, U.S. EPA, Washington,DC
Van de Pas-Schoonen, K.T., S. Schalk-Otte, S. Haaijer, H.Op den Schimdt, M Strius, J. GijsKuene, and M. S. Jetten (2005) Complete conversion of nitrate into dinitrogen gas in co-cultures of denitrifying bacteria, Biochemical Society Transactions, Vol 33, Part 1, pp.205-209
Vanderborght, J.P. and G. Billen (1975) Vertical distribution of nitrate concentrations ininterstitial water of marine sediments with nitrification and denitrification, Limnologyand Ocenography 20(6):953-961
Vincent W.F. [Ed.] (1987) Dominance of bloom forming cyanobacteria (Blue-green algae). N.Z.Jour. Mar. and Freshwat. Res. 21(3):361-542.
Vollenweider, R.A. (1975) Input-output models with special reference to the phosphorus loadingconcept in limnology, Schweiz. Z. Hydrol. 37:53-83
Vollenweider, R.A. and J.J. Kerekes (1980) Background and summary results of the OECDcooperative program on eutrophication, in International Symposium on Inland Watersand Lake Restoration, EPA 440/5-81-010, US Environmental Protection Agency,Washington, DC
Watanabe, T., H. Motoyama, and M. Kuroda (2001) Denitrification and neutralization treatmentby direct feeding of an acidic wastewater containing copper ion and high-strength nitrateto a bio-electrochemical reactor process, Water Res., 35(17)4102-4110
Westerman, P., and B. Kiǽr Ahrig (1989) Dynamic of methane production, sulfate reduction,and denitrification in a permanently waterlogged Alder swamp, Appl. Environ. Microbiol.53(10):2554-2559
Wisconsin Department of Natural Resources (1989) Environmental Impact Statement – DelavanLake Rehabilitation Project, Madison, WI
Zak, D., A. Kleeberg, and M. Hupfer(2006) Sulphate- mediated phosphorus mobilization inriverine sediments at increasing sulphate concentrations, River Spree, NE Germany,Biogeochemistry 80:109-119
Zapomělová, E. (2006) Ekologie planktoních sinic rodu Anabaena – Literární přehled (Ecologyof planktonic cyanobacteria Anabaena – Literature overview – in Czech), Conf.Proceedings Cyanobakterie 2006, Biologie, Toxikologie and Management, Centre forcyanobacteria and their toxins, Masaryk University, Brno, Czech Republic May 24-25,2006, pp. 13-21
Zhang , J. and B . Sharfstein (2011) Lake Okeechobee Protection Plan, Chapter 8, 2012 SouthFlorida Environmental Report, SF Water Management District, West Palm Beach, FL,http://my.sfwmd.gov/portal/page/portal/xweb%20about%20us/agency%20reports
Internal report not for distribution. If quoted use the web (http://www.aquanovaLLC.com) as the source.
37
Znachor, P., T. Jurczak, J. Komarková, J. Jezbedrova, J. Mankiewicz, K. Kaštovská, and E.Zapomělová (2006) Summer changes in cyanobacteria bloom composition andmicrocystins concentration in eutrophic Czech Reservoirs Environ. Toxicol.21:236-243