+ All Categories
Home > Documents > Advanced Maternal Age Management of Pregnancy in Women …

Advanced Maternal Age Management of Pregnancy in Women …

Date post: 18-Dec-2021
Category:
Upload: others
View: 4 times
Download: 0 times
Share this document with a friend
16
10/15/2015 1 Advanced Maternal Age Management of Pregnancy in Women over 40 Kirsten E. Salmeen, MD Assistant Professor Obstetrics, Gynecology & Reproductive Sciences Maternal-Fetal Medicine I have nothing to disclose. Maternal age statistics and trends Assisted reproductive technologies (ART) Aneuploidy & Miscarriage Risk Underlying health problems Perinatal morbidity Management OUTLINE Infertility Infertility Assisted Reproductive Technology Age Multiple Gestations Medical Co-Morbidities
Transcript

10/15/2015

1

Advanced Maternal Age Management of Pregnancy in

Women over 40Kirsten E. Salmeen, MD

Assistant ProfessorObstetrics, Gynecology & Reproductive Sciences

Maternal-Fetal Medicine

I have nothing to disclose.

• Maternal age statistics and trends• Assisted reproductive technologies (ART)• Aneuploidy & Miscarriage Risk• Underlying health problems• Perinatal morbidity • Management

OUTLINE

InfertilityInfertility

Assisted Reproductive Technology

Age MultipleGestations

Medical Co-Morbidities

10/15/2015

2

MATERNAL AGE – STATISTICS AND TRENDSAge

What percent of births in the United States would you estimate are in women over age 40?

A. < 5%B. 5 – 10%C. 10 – 15%D. > 15%

< 5%

5 – 1 0

%

1 0 – 1

5 %

> 1 5

%

22%

11%

28%

39%

US Birth Rates Among Women ≥ 35

0%2%4%6%8%

10%12%

1997 2002 2008 2013

Deliveries to Women 35-39 Years

Deliveries to Women ≥ 40 Years

CDC, National Center for Health Statistics, National Vital Statistics System. http://www.cdc.gov/nchs/nvss.htm

3%

12%

10/15/2015

3

1997 2013Total # of Births in US 3,880,894 3,932,181Age 40-44 Years

# of Births (%) 76,084 (2) 109,484 (2.8)Age 45-49 Years

# of Births (%) 3,333 (0.09) 7,495 (0.19)Age ≥ 50 Years

# of Births (%) 144 (0.004) 677 (0.017)

CDC, National Center for Health Statistics, National Vital Statistics System. http://www.cdc.gov/nchs/nvss.htm

93%

InfertilityInfertility

Age

Age and Fertility

Practice Committee Committee Opinion No 589 Fertil Steril 2014Data from multiple non-contracepting communities over many decades

By age 40 it is ~ 5% per cycle

At age 30, a woman’s chance of conception

is ~ 20% per cycle

Age and FertilityBirths Resulting from ART Procedures

National Vital Statistics Data 2011Maternal Age Number of

BirthsNumber of Known

ART-Births Percent

< 35 2,273,953 19,285 0.8535-37 228,392 7,949 3.4838-40 117,937 5,905 5.0141-42 33,299 2,354 7.0743-44 11,717 1,379 11.77≥ 45 5,247 1,624 30.95

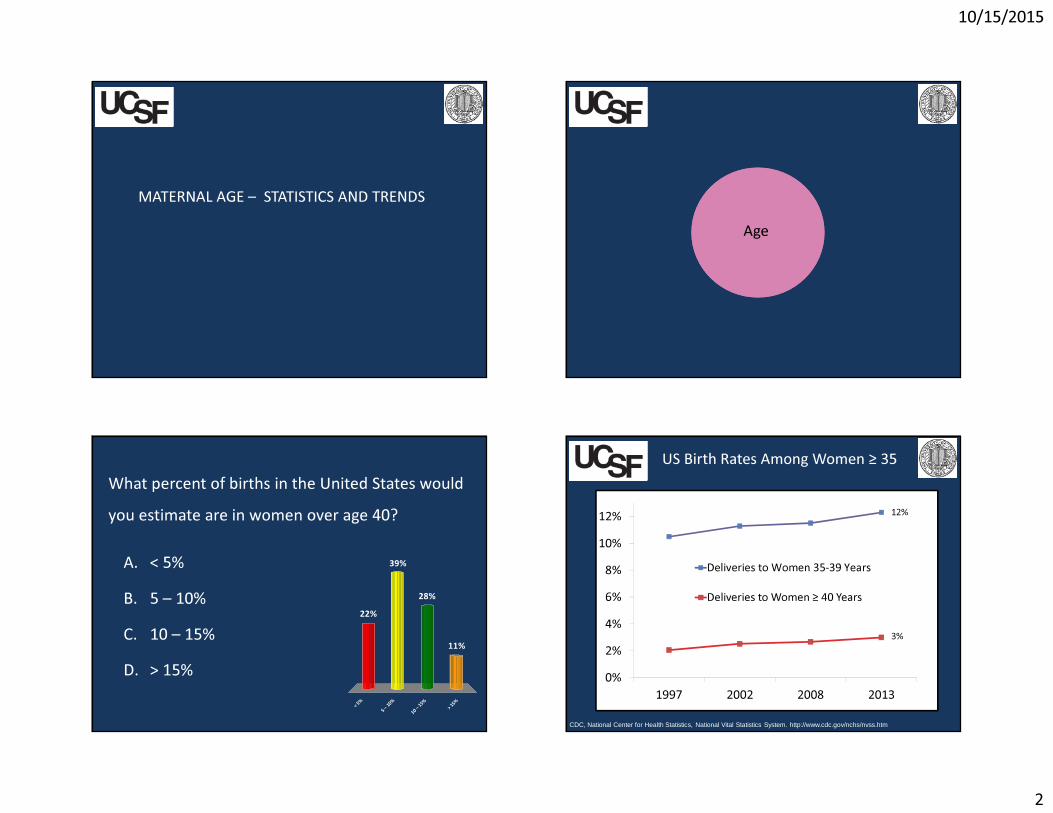
National Vital Statistics Reports, Vol. 63, No. 8, December 2014

10/15/2015

4

RISKS ASSOCIATED WITH ASSISTED REPRODUCTIVE TECHNOLOGIES InfertilityInfertility

Assisted Reproductive Technology

Age

ART & Multiple Gestation

• 25 – 30% of ART pregnancies are twins • 1.5 – 3% of ART pregnancies are triplets or more • Monozygotic twinning: 1.7 – 2.5% (vs 0.5%)

Kanter et al Trends and correlates of monozygotic twinning after single embryo transfer Ob Gyn 2015; cdc.gov Assisted Reproductive Technology (ART) National Summary Report 2010

InfertilityInfertility

Assisted Reproductive Technology

Age MultipleGestations

10/15/2015

5

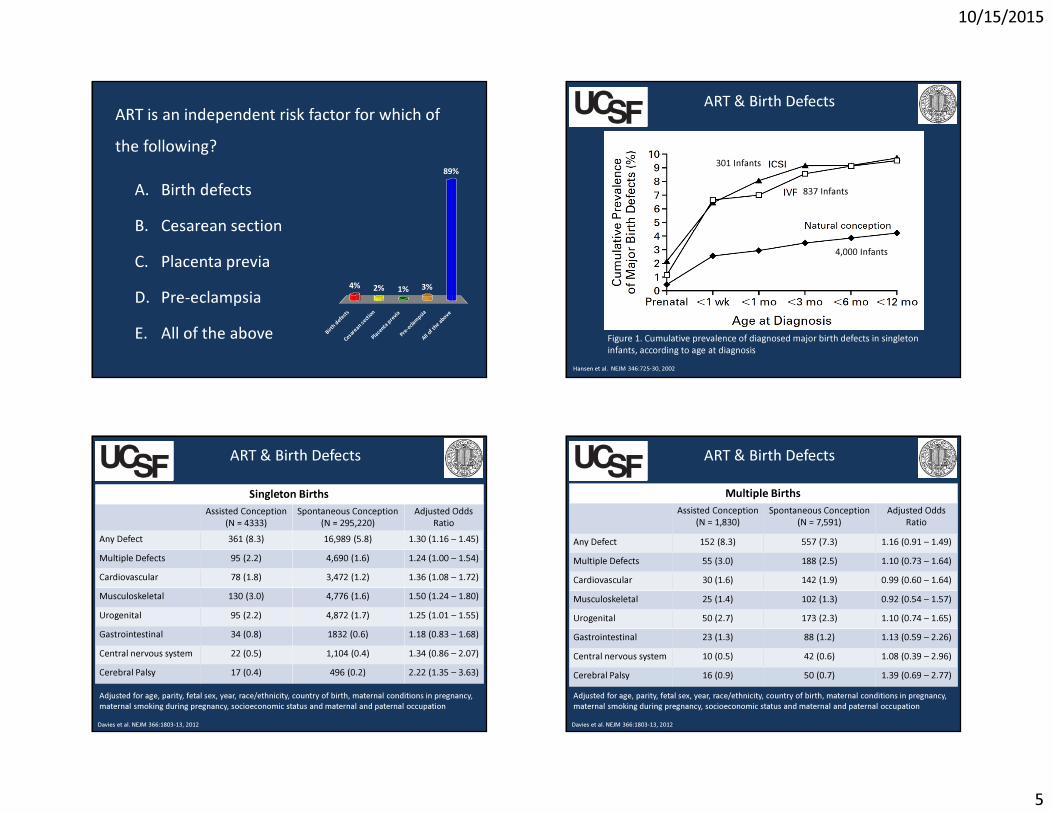
ART is an independent risk factor for which of the following?

A. Birth defectsB. Cesarean sectionC. Placenta previaD. Pre-eclampsiaE. All of the above B i r

t h de f e

c t s C e

s a re a n

s e ct i o n

P l ac e n

t a pr e v

i a P r e

- e cl a m

p s i a A l l

o f t h e

a bo v e

4% 2%

89%

3%1%

Hansen et al. NEJM 346:725-30, 2002

ART & Birth Defects

Figure 1. Cumulative prevalence of diagnosed major birth defects in singleton infants, according to age at diagnosis

301 Infants

837 Infants

4,000 Infants

ART & Birth Defects

Singleton BirthsAssisted Conception

(N = 4333)Spontaneous Conception

(N = 295,220)Adjusted Odds

RatioAny Defect 361 (8.3) 16,989 (5.8) 1.30 (1.16 – 1.45) Multiple Defects 95 (2.2) 4,690 (1.6) 1.24 (1.00 – 1.54) Cardiovascular 78 (1.8) 3,472 (1.2) 1.36 (1.08 – 1.72) Musculoskeletal 130 (3.0) 4,776 (1.6) 1.50 (1.24 – 1.80)Urogenital 95 (2.2) 4,872 (1.7) 1.25 (1.01 – 1.55)Gastrointestinal 34 (0.8) 1832 (0.6) 1.18 (0.83 – 1.68)Central nervous system 22 (0.5) 1,104 (0.4) 1.34 (0.86 – 2.07)Cerebral Palsy 17 (0.4) 496 (0.2) 2.22 (1.35 – 3.63)

Adjusted for age, parity, fetal sex, year, race/ethnicity, country of birth, maternal conditions in pregnancy, maternal smoking during pregnancy, socioeconomic status and maternal and paternal occupation Davies et al. NEJM 366:1803-13, 2012

Multiple BirthsAssisted Conception

(N = 1,830)Spontaneous Conception

(N = 7,591)Adjusted Odds

RatioAny Defect 152 (8.3) 557 (7.3) 1.16 (0.91 – 1.49)Multiple Defects 55 (3.0) 188 (2.5) 1.10 (0.73 – 1.64)Cardiovascular 30 (1.6) 142 (1.9) 0.99 (0.60 – 1.64) Musculoskeletal 25 (1.4) 102 (1.3) 0.92 (0.54 – 1.57)Urogenital 50 (2.7) 173 (2.3) 1.10 (0.74 – 1.65)Gastrointestinal 23 (1.3) 88 (1.2) 1.13 (0.59 – 2.26)Central nervous system 10 (0.5) 42 (0.6) 1.08 (0.39 – 2.96)Cerebral Palsy 16 (0.9) 50 (0.7) 1.39 (0.69 – 2.77)

ART & Birth Defects

Adjusted for age, parity, fetal sex, year, race/ethnicity, country of birth, maternal conditions in pregnancy, maternal smoking during pregnancy, socioeconomic status and maternal and paternal occupation Davies et al. NEJM 366:1803-13, 2012

10/15/2015

6

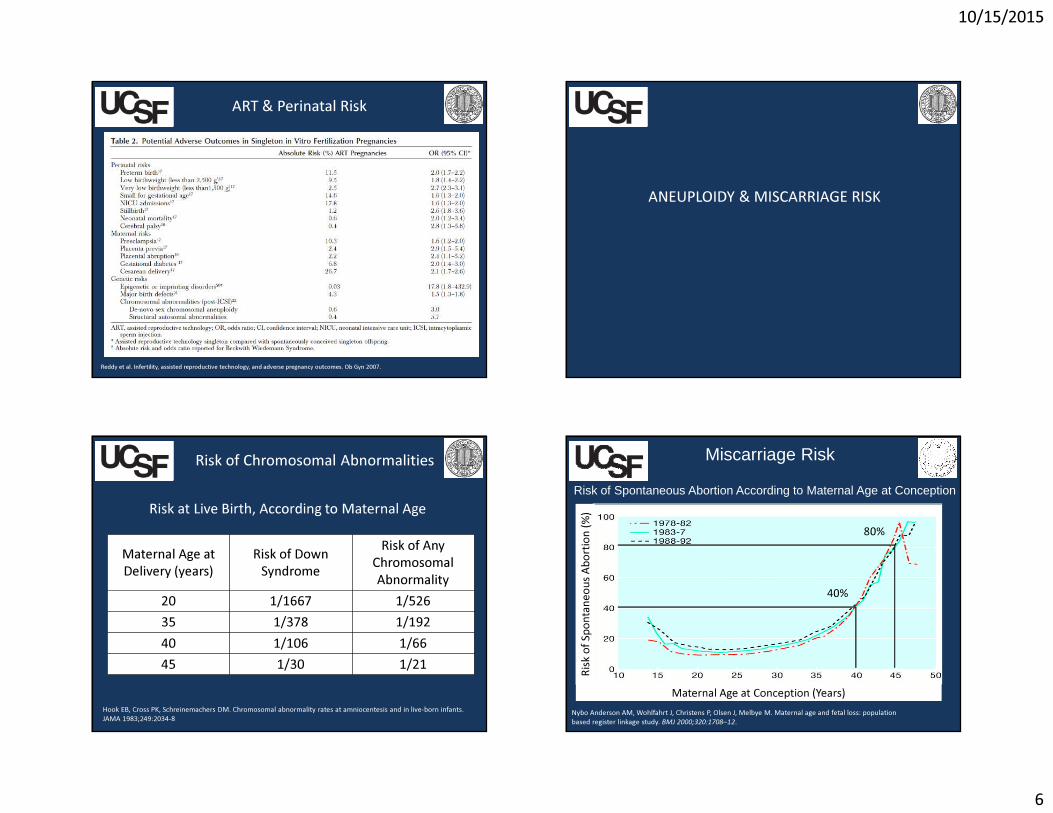
ART & Perinatal Risk

Reddy et al. Infertility, assisted reproductive technology, and adverse pregnancy outcomes. Ob Gyn 2007.

ANEUPLOIDY & MISCARRIAGE RISK

Risk of Chromosomal Abnormalities

Maternal Age at Delivery (years)

Risk of Down Syndrome

Risk of Any Chromosomal Abnormality

20 1/1667 1/52635 1/378 1/19240 1/106 1/6645 1/30 1/21

Risk at Live Birth, According to Maternal Age

Hook EB, Cross PK, Schreinemachers DM. Chromosomal abnormality rates at amniocentesis and in live-born infants. JAMA 1983;249:2034-8

Miscarriage Risk

Nybo Anderson AM, Wohlfahrt J, Christens P, Olsen J, Melbye M. Maternal age and fetal loss: population based register linkage study. BMJ 2000;320:1708–12.

Risk of Spontaneous Abortion According to Maternal Age at Conception

Risk o

f Spo

ntane

ous A

borti

on (%

)

Maternal Age at Conception (Years)

40%

80%

10/15/2015

7

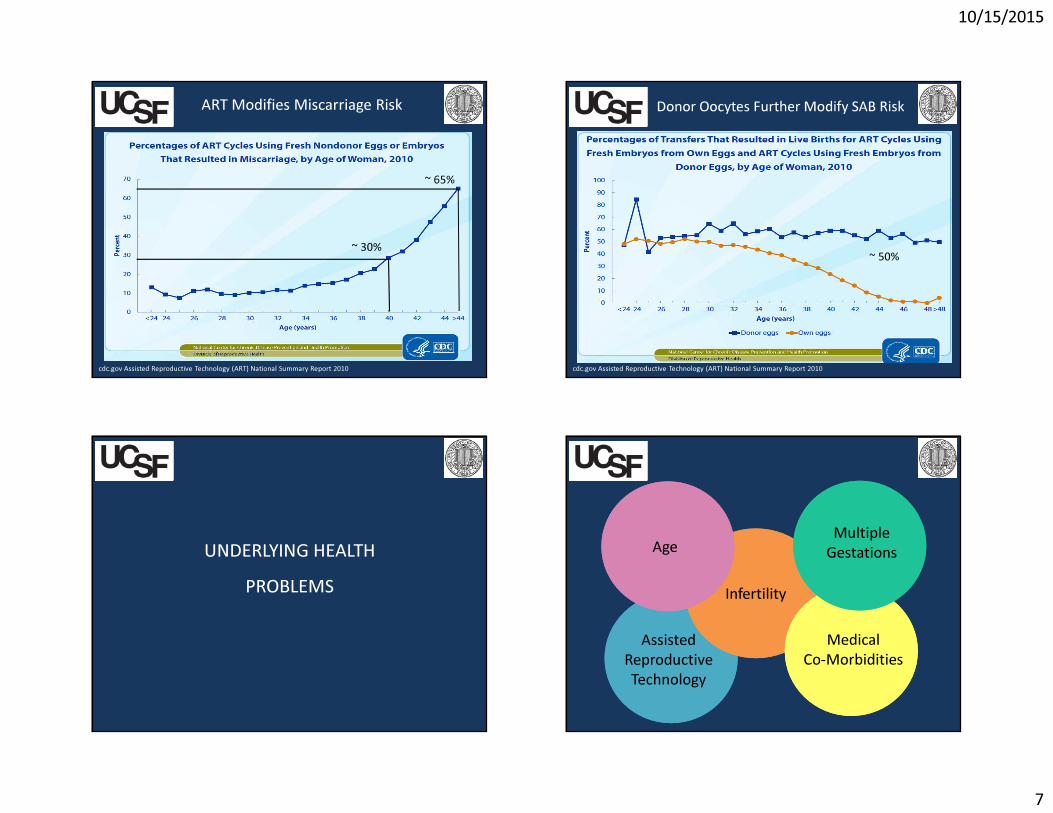
ART Modifies Miscarriage Risk

cdc.gov Assisted Reproductive Technology (ART) National Summary Report 2010

~ 30%

~ 65%

cdc.gov Assisted Reproductive Technology (ART) National Summary Report 2010

Donor Oocytes Further Modify SAB Risk

~ 50%

UNDERLYING HEALTH

PROBLEMS InfertilityInfertility

Assisted Reproductive Technology

Age MultipleGestations

Medical Co-Morbidities

10/15/2015

8

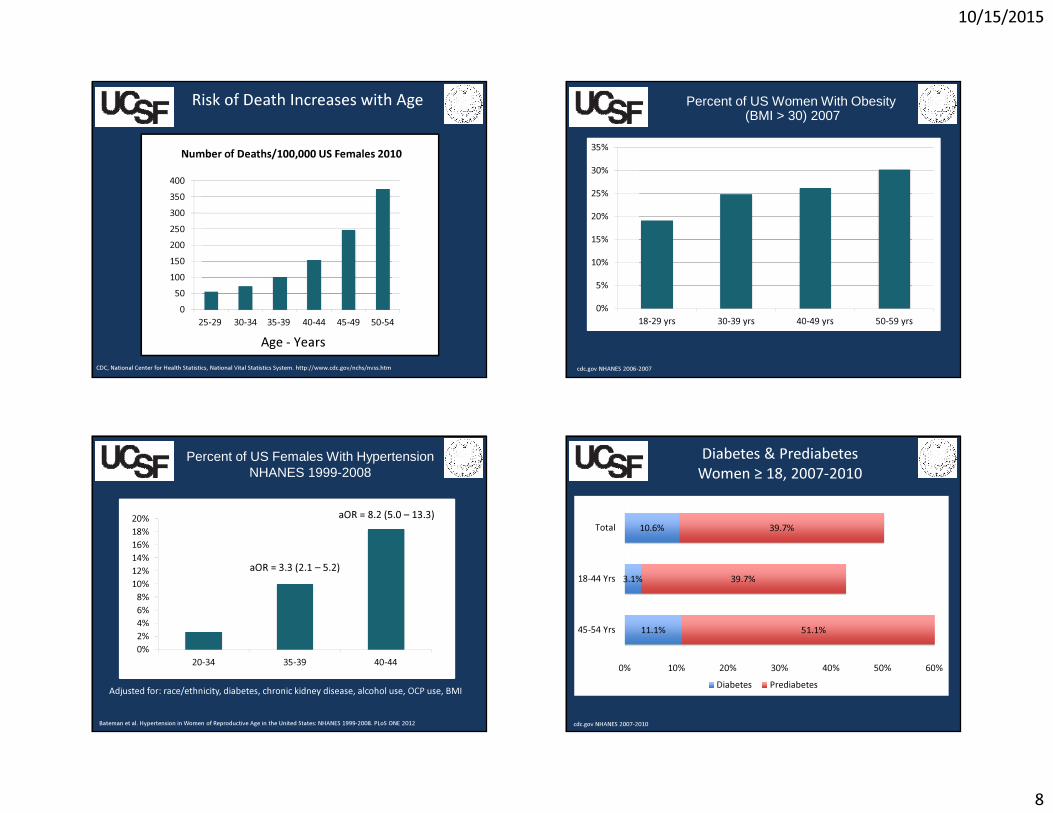
Risk of Death Increases with Age

050

100150200250300350400

25-29 30-34 35-39 40-44 45-49 50-54

Number of Deaths/100,000 US Females 2010

Age - YearsCDC, National Center for Health Statistics, National Vital Statistics System. http://www.cdc.gov/nchs/nvss.htm

Percent of US Women With Obesity(BMI > 30) 2007

0%

5%

10%

15%

20%

25%

30%

35%

18-29 yrs 30-39 yrs 40-49 yrs 50-59 yrs

cdc.gov NHANES 2006-2007

Percent of US Females With Hypertension NHANES 1999-2008

0%2%4%6%8%

10%12%14%16%18%20%

20-34 35-39 40-44

aOR = 3.3 (2.1 – 5.2)

aOR = 8.2 (5.0 – 13.3)

Bateman et al. Hypertension in Women of Reproductive Age in the United States: NHANES 1999-2008. PLoS ONE 2012

Adjusted for: race/ethnicity, diabetes, chronic kidney disease, alcohol use, OCP use, BMI

11.1%

3.1%

10.6%

51.1%

39.7%

39.7%

0% 10% 20% 30% 40% 50% 60%

45-54 Yrs

18-44 Yrs

Total

Diabetes Prediabetes

Diabetes & PrediabetesWomen ≥ 18, 2007-2010

cdc.gov NHANES 2007-2010

10/15/2015

9

0.00%

0.50%

1.00%

1.50%

2.00%

2.50%

30-39 yrs 40-49 yrs 50-59 yrs

Colon CancerBreast Cancer

Chance of Being Diagnosed with Breast or Colon Cancer in the Next 10 Years

http://www.cancer.org; http://www.cdc.gov/cancer/colorectal/statistics/age.htm

PERINATAL MORBIDITY

InfertilityInfertility

Assisted Reproductive Technology

Age MultipleGestations

Medical Co-Morbidities

0

50

100

150

20 25 30 35 40 45 50Age (Years)

Perinatal Risk

10/15/2015

10

%Odds

Ratio/Relative Risk

Maternal Age

Reference Age

Non-Chromosomal Congenital Anomalies

Reefhuis 1.1 – 1.9 35-40 25-29Loane 2.3 – 2.5 1 – 1.8 ≥ 40 25-29

Cleary-Goldman 2.8 – 2.9 1.4 – 1.7 ≥ 35 < 35Preterm Birth

Cleary-Goldman (< 37 wks) 8.6 – 11.8 1.0 – 1.4 ≥ 35 < 35Yogev (< 34 wks) 5.6 1.8 40-44 20-29Yogev (< 34 wks) 8.5 3.5 ≥ 45 20-29Luke (< 32 wks) 2.5 – 3.0 1.6 – 2.1 ≥ 40 30 – 34

Obstetrical Risks Associated with Increased Maternal Age

Reefhuis et al. Birth Defects Research (Part A) 70:572–579, 2004; Loane et al. BJOG 116:1111–1119, 2009; Yogev et al. Am J Obstet Gynecol 203:558.e1-7, 2010; Cleary-Goldman et al. Obstet Gynecol105:983–90, 2005; Luke B et al. Hum Reprod 22(5):1264-1272, 2007

% Odds Ratio/Relativ

e Risk

Maternal Age

Reference Age

Low Birth WeightCleary-Goldman 5.1 – 7.5 1.1 – 1.6 ≥ 35 < 35

Yogev 12.7 0.8 40-44 20-29Luke 7.7 – 9.2 NR ≥ 40 30-34Yogev 16.9 0.7 ≥ 45 20-29Salihu ~ 14 3.0 ≥ 50 20-29

Obstetrical Risks Associated with Increased Maternal Age

Cleary-Goldman et al. Obstet Gynecol 105:983–90, 2005; Yogev et al. Am J Obstet Gynecol 203:558.e1-7, 2010; Luke B et al. Hum Reprod 22(5):1264-1272, 2007; Salihu et al. Obstet Gynecol 102:1006 –14, 2003

Obstetrical Risks Associated with Increased Maternal Age

%Odds

Ratio/Relative Risk

Maternal Age

Reference Age

Pre-EclampsiaCleary-Goldman 2.3 – 3.0 0.9 – 1.1 ≥ 35 < 35

Yogev 2.4 NR 40-44 N/AYogev 10.7 NR ≥ 45 N/APare 13.4 aOR NS > 40 < 35Luke 6.2-7.4 1.3 – 1.6 > 40 30 – 34

Paulson 35 NR ≥ 50 N/A

Cleary-Goldman et al. Obstet Gynecol105:983–90, 2005; Yogev et al. Am J Obstet Gynecol 203:558.e1-7, 2010; Luke et al. Hum Reprod22(5):1264-1272, 2007; Paulson et al. JAMA;228:2320-2323, 2002

Obstetrical Risks Associated with Increased Maternal Age

% Odds Ratio/Relativ

e Risk

Maternal Age

Reference Age

Gestational DiabetesCleary-Goldman 5.3 – 7.3 1.8 – 2.4 ≥ 35 < 35

Yogev 10.2 NR 40-44 N/AYogev 17.0 NR ≥ 45 N/A

Paulson 17.5 NR ≥ 50 N/APlacenta Previa

Cleary-Goldman 0.9 – 1.9 1.8 – 2.8 ≥ 35 < 35Yogev 1.4 5.7 40-44 20-29Yogev 5.6 13.4 ≥ 45 20-29

Jacobsson 0.2 – 0.7 1.04 – 4.6 ≥ 40 20-29 Salihu 16.7 NR ≥ 50 N/A

Cleary-Goldman et al. Obstet Gynecol 105:983–90, 2005; Yogev et al. Am J Obstet Gynecol 203:558.e1-7, 2010; Paulson et al. JAMA;228:2320-2323, 2002; Jacobsson et al. Obstet Gynecol 104:727–33, 2004; Salihu et al. Obstet Gynecol 102:1006 –14, 2003

10/15/2015

11

Mode of Delivery

Cesarean Section

35 – 40 Yrs 40 – 45 Yrs 45 – 50 Yrs > 50 YrsCleary-

Goldman 31.4% 40.5% (aOR 2.0)

Yogev 42.9% (RR 3.7) 78.5% (RR 31.8)Luke

(primiparous) 43% (RR 1.96 54.1% (RR 3.14)

Jacobsson 23.5% (OR 2.8) 30.3% (OR 3.8)

Dulitzki 39.4% (OR 7.3)Paulson

(singletons) 68%

Dulitzki et al. Effect of very advanced maternal age on pregnancy outcome and rate of cesarean delivery. Ob Gyn 1998

Risk Factors for Cesarean Section

• Krieg: Stanford University, 40 pregnancies in oocyte recipients compared to women ≥ 38 yrs who underwent autologous IVF cycles– OR for C/S in oocyte recipients: 2.78 (1.44-5.36)– Each 1 year increase in maternal age was

associated with a 13% increase in the odds of C/S.

Cesarean Section & Oocyte Recipients

Krieg SA, Henne MB, Westphal LM. Obstetric outcomes in donor oocyte pregnancies compared with advanced maternal age in in vitro fertilization pregnancies. Fertil Steril 2008;90:65–70.

10/15/2015

12

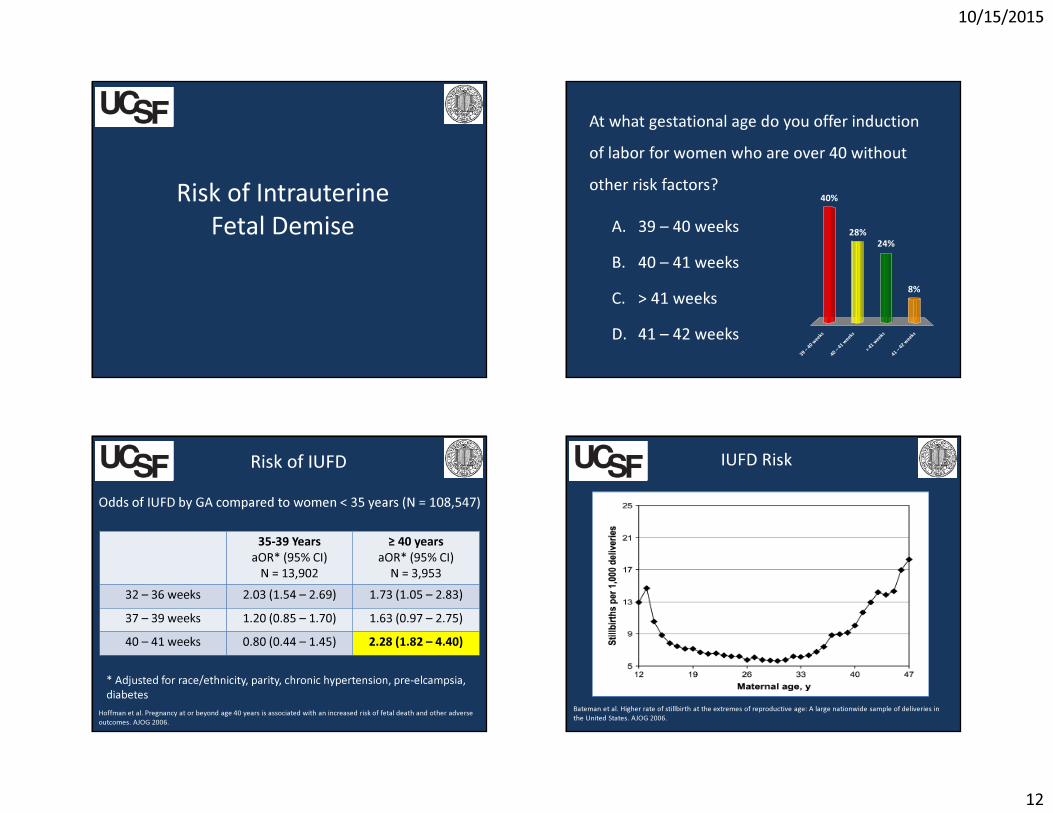
Risk of Intrauterine Fetal Demise

At what gestational age do you offer induction of labor for women who are over 40 without other risk factors?

A. 39 – 40 weeksB. 40 – 41 weeksC. > 41 weeksD. 41 – 42 weeks

3 9 – 4

0 we e k

s 4 0

– 41 w

e e ks

> 41 w

e e ks

4 1 – 4

2 we e k

s

40%

8%

24%28%

Hoffman et al. Pregnancy at or beyond age 40 years is associated with an increased risk of fetal death and other adverse outcomes. AJOG 2006.

Risk of IUFD

35-39 YearsaOR* (95% CI)

N = 13,902

≥ 40 yearsaOR* (95% CI)

N = 3,95332 – 36 weeks 2.03 (1.54 – 2.69) 1.73 (1.05 – 2.83)37 – 39 weeks 1.20 (0.85 – 1.70) 1.63 (0.97 – 2.75)40 – 41 weeks 0.80 (0.44 – 1.45) 2.28 (1.82 – 4.40)

Odds of IUFD by GA compared to women < 35 years (N = 108,547)

* Adjusted for race/ethnicity, parity, chronic hypertension, pre-elcampsia, diabetes

Bateman et al. Higher rate of stillbirth at the extremes of reproductive age: A large nationwide sample of deliveries in the United States. AJOG 2006.

IUFD Risk

10/15/2015

13

Reddy et al. Maternal age and the risk of stillbirth throughout pregnancy in the United States. AJOG 2006.

IUFD Risk Other Reported Risks

• Intensive care stay• Myocardial infarction• Pulmonary edema• Venous thromboembolism• Postpartum depression

Other Anecdotal Risks

• Anxiety• Difficulty with breastfeeding

A BRIEF DIVERSION TO ADVANCED PATERNAL AGE

10/15/2015

14

Advanced Paternal Age

Salmeen, Zlatnik. The oldest gravidas: a review of pregnancy risks in women over 45. Obstetrical and Gynecological Survey 2011

Possibly increased risk for other birth defects, autism-spectrum disorders

MANAGEMENT

What I do…

Without a lot of evidence

• Hemoglobin A1c, fasting glucose• TSH• Mammogram• EKG• Lipids• Serial BPs • Cardiac Stress Test/Cardiology evaluation

Preconception Work-Up for Women ≥ 40

(or ≥ 35 with risk factors)

10/15/2015

15

First Trimester Care for Women ≥ 40

• Determine mode of conception • Assess fetal number, chorionicity of multiples• TSH (if not recently obtained)• Early glucose testing • If hypertensive: baseline pre-eclampsia labs• Genetic counseling (adjust for oocyte-donor age)• Consideration of aspirin prophylaxis

** Aspirin Prophylaxis **

• In “high-risk” women, aspirin prophylaxis may reduce the risk of pre-eclampsia by up to 17%

• I consider women over 40 to be “high risk” and offer aspirin

• Detailed fetal anatomic survey• Low-threshold for fetal echocardiogram• Repeat glucose tolerance testing• Evaluation of fetal growth in the third trimester• Antenatal testing • Labor planning, counseling regarding mode of delivery• Labor induction 39-40 weeks

Prenatal Care for Women ≥ 40 (or ≥ 35 with risk factors) TAKE HOME POINTS

• Age-related risks are actually multifactorial• IUFD increases with increasing maternal age.

Induction for “post dates” may be appropriate after 39-40 weeks for women > 35 – 40 years.

• Age nor donor-oocyte recipient status are indications for cesarean delivery.

• Aspirin prophylaxis is indicated for women at high-risk for pre-eclampsia, including women over 40.

10/15/2015

16

Questions?


Recommended