Copyright 2006 McKinsey & Company. This Microsoft Excel model and allrelated documentation relating to advanced metering infrastructure (the"AMI Model") is proprietary to McKinsey & Company. It may be used by anenergy provider, regulatory commission, customer advocacy group, or AMIvendor to assist in analyzing an AMI deployment. It may not, however, besold, licensed, used in the provision of paid services, or otherwise exploitedcommercially in any manner.
The AMI Model is provided AS IS, without any express or implied warranty,including but not limited to warranties of merchantability or fitness for aparticular purpose. The AMI Model is not intended to cover all relevantanalyses for an AMI business case but is limited in scope to a simple NPVanalysis to help assess the feasibility of the project. Users are responsiblefor determining the appropriate inputs for their own situation and forvalidating all results. McKinsey & Company does not warrant any resultsobtained or conclusions drawn from the use of the AMI Model; has noobligation to maintain, update, or correct the AMI Model; and shall not beliable to you for any damages or losses resulting from use of AMI Model,including but not limited to lost profits or consequential damages.
McKinsey & Company may contact you to obtain information relating to youruse of the AMI Model. McKinsey will not use your contact information forany other purpose and will not share your contact information with anyoutside company.
This user guide and the associated financial model is intended to assistutilities, public utility commissions (PUCs), regulatory agencies, vendors,and customer advocacy groups in conducting a preliminary valueassessment for the installation of an Advanced Meter Infrastructure systemby providing an illustrative example model. The example model reflects acombined electric and gas utility, but it can be adapted to reflect either oneindividually. The user guide will cover the three main categories ofworksheets included in the corresponding model. These include:
• Summary worksheets
• Cost worksheets
• Benefit worksheets
For each worksheet, a brief overview is provided with several keyconsiderations for the sections within the worksheets. Users should befamiliar with basic Accounting and Excel techniques prior to accessing thisexample model. This user guide is intended to introduce some of the keyattributes of the model; however it will not address every aspect of themodel.
SCOPE
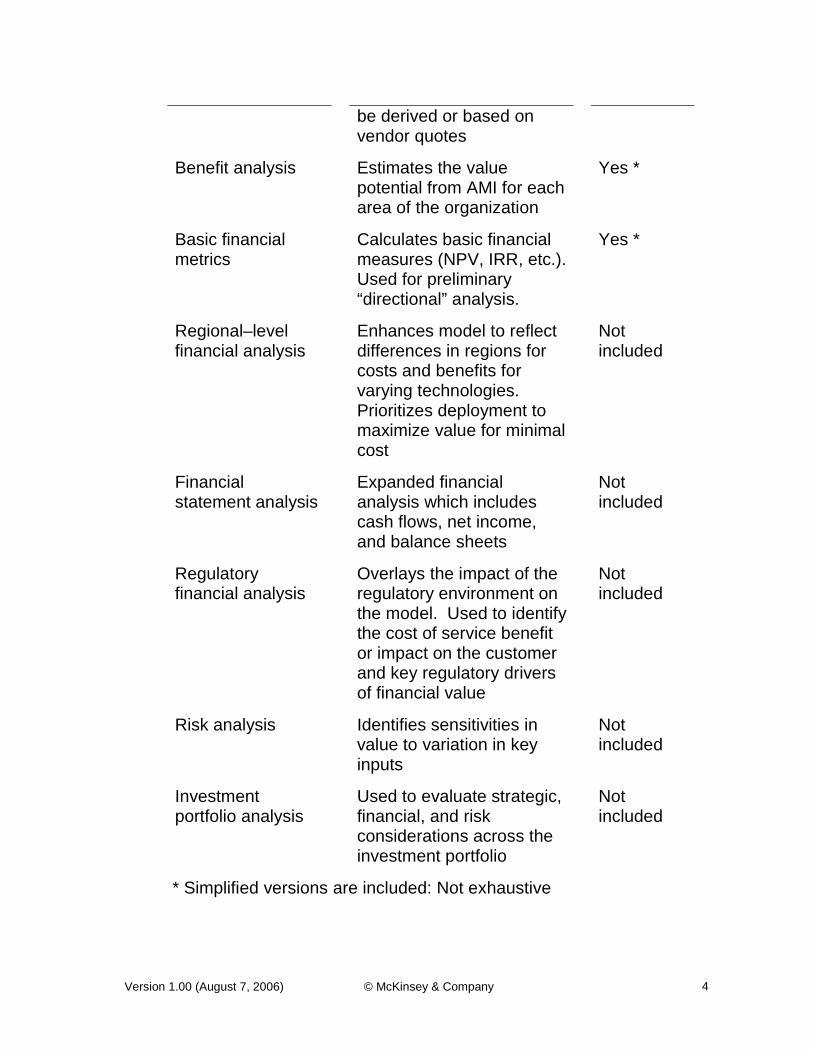
There are a variety of analyses which are appropriate when assessing apotential AMI deployment. This document and the associated modelrepresent only a subset of these analyses. A non-exhaustive list of thesetypes of analyses is shown below with an indication of whether or not eachanalysis is in scope for this model:
Analysis Description
Includedin thismodel
Cost analysis Identifies the basic costs ofan AMI deployment. May
Benefit analysis Estimates the valuepotential from AMI for eacharea of the organization
Yes *
Basic financialmetrics
Calculates basic financialmeasures (NPV, IRR, etc.).Used for preliminary“directional” analysis.
Yes *
Regional–levelfinancial analysis
Enhances model to reflectdifferences in regions forcosts and benefits forvarying technologies.Prioritizes deployment tomaximize value for minimalcost
Notincluded
Financialstatement analysis
Expanded financialanalysis which includescash flows, net income,and balance sheets
Notincluded
Regulatoryfinancial analysis
Overlays the impact of theregulatory environment onthe model. Used to identifythe cost of service benefitor impact on the customerand key regulatory driversof financial value
Notincluded
Risk analysis Identifies sensitivities invalue to variation in keyinputs
Notincluded
Investmentportfolio analysis
Used to evaluate strategic,financial, and riskconsiderations across theinvestment portfolio
Notincluded
* Simplified versions are included: Not exhaustive
The values shown in this model are for illustrative purposes and areintended only to provide a starting point for analysis. Users are responsiblefor updating assumptions to meet their own needs and for validating allcalculations and results.
In most cases, key inputs are colored blue in order to make them morevisible. Because values for some years are hidden for formatting reasons, itis critical to show these when updating assumptions.
Users should begin on the “General Assumptions” worksheet of the model.The first assumptions which should be updated include the “Revenue” and“Meter Population to be Automated” lines.
Users should then proceed to complete all assumptions in the “GeneralAssumptions” sheet and all subsequent sheets. The “Project Summary”page can be reviewed while updating the assumptions to view their effectson the project value.
Note that the type of deployment (e.g. Electric, Gas or Combined) and thetype of network (mobile, fixed, or combined) will have a significant effect onassumptions, so users should pay close attention to related inputsthroughout the model (for example, meter reading “Drive by operators” arerequired in a mobile AMI solution, but are not needed when only a fixednetwork is used). Similarly, identifying whether the utility is paying for anitem versus a third party should also be noted in appropriate locations in themodel (e.g. “Utility Paid”, “Utility Owned” and other similar fields have a“Yes” or “No” option)
The cover page displays the title and version number of the model. Refer tothis page in order to ensure that you are working from the most recentmodel revision. Please note that the model available on the internet may beupdated at any time.
PROJECT SUMMARY WORKSHEET
Worksheet overview
The project summary worksheet has three main sections:
• Project and financial summary
• Capital cost and benefits
• Net present value calculation
These sections are intended to provide a simple “snapshot” of each area ina consolidated manner.
Consistent with other sheets, this sheet will by default show the first 5 yearsof deployment, followed by years 10, 15, and 20. This is intended to providea compact method for viewing and printing the document, however thehidden years can be displayed as needed using standard MS Excelfunctions.
Project and financial summary section
This section identifies key attributes of the deployment, key financialinformation, and a brief summary of the costs and benefits associated withthe model. Note that the costs and benefits are both expressed as apercentage of the total costs and benefits to provide a high-level measure ofrelevance.
This portion of the “Project Summary” worksheet provides an overview ofthe capital expenditures for electric and gas, O&M expenses, and benefits.
Capital Expenditures
The key areas of cost for both Electric and Gas separately are:
• Meters: This primarily includes the hard meter assets (e.g.meters or modules)
• Network: Includes costs associated with the communicationnetworks
• Installation: Installation costs for Electric or Gas respectively
The “IT integration and Software section” is shared and is notallocated directly to Electric or Gas.
O&M Expenses
The O&M expenses are referenced directly from the “O&M Cost”worksheet
Benefits
The Benefits are separated into the following areas:
• Customer Service
• Distribution Operations
• Revenue Enhancement
• Avoided Capital
Each of the sections above reference the corresponding benefitsworksheets
Net Present Value Calculation section
Both electric and gas are separated out into a compact method ofcomputing the un-levered free cash flows. These are derived in an indirectcash flow method, starting with the EBITDA and then flowing through EBITand ultimately ending with un-levered free cash flows. The NPV and IRRare then calculated based on the assumed discount rate on the “GeneralAssumptions” worksheet.
The “General Assumptions” worksheet is used to capture key informationabout the company, project, economy, and financial environment.
Revenue section
Enter the revenues associated with Electric and Gas and for Residential andCommercial as appropriate in “Year 0”. Enter a zero for Gas or Electric ifone should be excluded from the model
Meter Population to be Automated section
Enter the appropriate meter counts in year 1. Note that these will then growor decline in subsequent years based on your assumed meter populationgrowth (See “Meter population growth” section below. Enter a zero for Gasor Electric for the number of meters if one should be excluded from themodel. Note that removing either gas or electric can effect the NPV of theother due to allocations of items between both areas.
Deployment schedule section
“Electric” input and “Gas” input:
For both electric and gas, enter the desired number of years for deployment.Note that the cells are formatted to add the word “years” at the end, but thecells accept integers.
“Electric Meters” inputs:
Enter the percentage of meters that will be deployed by year as apercentage of all electric meters (e.g. the “Percent Electric Meters with AMI”line should equal 100% after full deployment). Be careful not to “over-deploy” either commercial or residential meters, for new or retrofit meters.(e.g. you should check that the split that is chosen for deployment does notresult in a correct total while actually deploying more commercial orresidential meters than those which are actually available)
This section is calculated based on the “Electric Meters” inputs above andthe total number of meters developed in the “Meter Population to beAutomated” section above
“Gas Meters”:
Similar to the electric meters above, enter the percentage of all gas metersfor electric and gas which will be deployed by year. Be careful not to “over-deploy” either commercial or residential meters (e.g. you should check thatthe split that is chosen for deployment does not result in a correct total whileactually deploying more commercial or residential meters than those whichare actually available)
“Gas Meters with AMI”:
Calculates the number of gas meters for both residential and commercialthat will be deployed based on the inputs above
Optional Devices section
This section is used to capture any assumed costs for additional devicesincluding remote disconnect/ reconnect modules, load control devices, andprepaid meters. These should be entered in dollar amounts consistent withthe rest of the document (e.g. in dollars thousands ‘000s)
Operating Months in Year section
Enter the operating months in a given year (typically 12 in the U.S.A.)
Meter Read Cycles per Year section
Enter the meter read cycles per year (typically 12 in the U.S.A.)
Meter Population Growth section
This section is used to enter assumptions (in blue) for the growth rate inmeters deployed. These should be entered for Electric and Gas and forResidential and Commercial meters. The weighted averages areautomatically calculated based on those inputs
Enter the assumed meter failure rate for AMI to identify the neededreplacement frequency. Enter as a percent of deployed meters which willfail during that year
Discount Rate section
Enter the discount rate for the project as a percent (Enter only 1 discountrate where shown, not different rate under each year)
Property, Federal and Income Taxes section
Identify the assumptions for taxes annually. The “Effective Tax Rate” iscalculated based on these assumptions.
Inflation section
This model allows different inflation rates to be entered for Materials, Laborand Fuel. These should be entered for each year.
Benefits Loading section
This section is used to scale salaries to a fully loaded salary (e.g. to add thecost of benefits such as retirement and health care plans to the basesalary). The section is split into straight time and overtime, since theincremental costs for loading on overtime is much lower than that forstraight time (e.g. health care costs may not go up with overtime, but othersmay vary slightly). Enter the appropriate loading factors for CustomerService, Distribution Operations, and Gas Operations respectively.
The Capital Electric worksheet is used to record all capital allocated to theelectric portion of the project.
General Inputs section
The General Inputs section outlines several of the key drivers behindelectric costs.
Electric Meters to Automate: The incrementally installed count of meters iscalculated based on previous data and is shown under this heading.
The project/ contract lifetime and system deployment period are bothcalculated values.
Values should be entered for the Automated Read Yield, New Meter AssetBook Life, Retrofit Meter Asset Book Life, and Asset Tax Life. Note that theword “years” is appended to the relevant fields.
The components section is added to allow flexibility for either utility or third-party owned and installed assets. Select “Yes” if the utility pays for andcapitalizes the cost of the indicated component. The per-unit cost shouldalso be entered for both Hardware and Installation.
Summary of Capital Expenditures section
Capital expenditures are shown by type of asset in this section. Each of themajor asset classes are then included in a depreciation schedule within thissection. The primary breakdown of assets is as follows:
• Network Allocation (Note: The associated depreciation schedule forthis asset is located on the “Capital Infrastructure” worksheet)
New Meter Book Depreciation schedule
This section includes the depreciation schedule for the following items:
• Electric Meters – New
• Installation – New Meters
Retrofit Meter / Load Control Book Depreciationschedule
This section includes the depreciation schedule for the following items:
• Electric Meters – Retrofits
• Installation – Retrofit Electric
• Disconnect/ Load Control Installation
• Disconnect/ Load Control Devices
Tax Depreciation schedule
The tax depreciation is calculated based on the “Total System Equipment”line earlier in this section.
CAPITAL GAS WORKSHEET
Overview
Similar to the “Capital Electric” worksheet described above, the Capital Gasworksheet is used to record all capital allocated to the Gas portion of theproject
The General Inputs section outlines several of the key drivers behind Gascosts.
Gas Meters to Automate: The incrementally installed count of meters iscalculated based on previous data and is shown under this heading. Notethat it is assumed that Gas is installed using retrofit modules rather thannew meters.
The project/ contract term and system deployment period are bothcalculated values
Values should be entered for the Automated Read Yield, New MeterGrowth, Book Life, and Asset Tax Life. Note that the word “years” isappended to the relevant fields.
The components section is added to allow flexibility for either utility or third-party owned and installed assets. Select “Yes” if the utility pays for andcapitalizes the cost of the indicated component. The per-unit cost shouldalso be entered for both Hardware and Installation.
Summary of Capital Expenditures section
Capital expenditures are shown by type of asset in this section. Each of themajor asset classes are then included in a depreciation schedule within thissection. The primary breakdown of assets is as follows:
• Gas Modules
• Module Installation
• Network Allocation (Note: The associated depreciation schedule forthis asset is located on the “Capital Infrastructure” worksheet)
Book Depreciation schedule
This section includes the depreciation schedule for the following items:
The tax depreciation is calculated based on the “Total Gas SystemEquipment” line earlier in this section.
CAPITAL INFRASTRUCTURE WORKSHEET
Overview
This capital worksheet is used to capture the costs of infrastructurecomponents. The names and descriptions for these items will vary byvendor, but include items such as “repeaters”, “collectors”, and other similardevices.
General Inputs section
The model allows up to 5 unique component categories to be included.These should be entered in the blue cells, starting with the new names(replace “Infrastructure Component 1” with a title of your choosing for items1 – 5). Also, include the expected number of that component which isexpected for deployment.
Values should be entered for the Asset Book Life, and Asset Tax Life. Notethat the word “years” is appended to the relevant fields.
The components section is added to allow flexibility for either utility or third-party owned and installed assets. Select “Yes” if the utility pays for andcapitalizes the cost of the indicated component. The per-unit cost shouldalso be entered for both Hardware and Installation.
The Infrastructure Allocation section will compute the “automatic” allocationof cost based on the number of meters for electric and gas, however manualvalues can be entered to override the automatically calculated values (leavethe manual values at zero if no manual override is desired).
Summary of Capital Expenditures section
Capital expenditures are shown by type of asset in this section. Each of themajor asset classes are then included in a depreciation schedule within thissection. The primary breakdown of assets is as follows:
• Infrastructure Component 1-5 (Note that these names can bereplaced by changing the titles in the “General Inputs” section of thisworksheet
• Network Allocation (Note: The associated depreciation schedule forthis asset is located on the “Capital Infrastructure” worksheet)
Book Depreciation schedule
This section includes the depreciation schedule for each of the infrastructureitems listed above.
Tax Depreciation schedule
The tax depreciation is calculated based on the “Total InfrastructureEquipment” line earlier in this section.
CAPITAL IT AND IMPLEMENTATION WORKSHEET
Overview
This capital worksheet is used to capture the costs of IT andimplementation.
General Inputs section
Values should be entered for the Asset Book Life, and Asset Tax Life. Notethat the word “years” is appended to the relevant fields.
The components section is added to allow flexibility for either utility or third-party owned and installed assets. Select “Yes” if the utility pays for andcapitalizes the cost of the indicated component. The per-unit cost shouldalso be entered.
Unlike other capital worksheets mentioned previously, this worksheet alsoincludes a place to enter the FTE (Full Time Equivalent) number ofpersonnel needed for each portion of the IT/ Software Implementation. Anassociated salary should also be added.
Capital expenditures are shown by type of asset (implementation cost) inthis section. Each of the major asset classes are then included in adepreciation schedule within this section. The primary breakdown of assetsis as follows:
• Host Application
• Host Hardware
• Billing Interface
• Customer Service Interface
• Outage Management Interface
• Asset Management Interface
• Other 1: MDM Application
• Other 2: MDM Utility Personnel
• Other 3
Note that “Other 1-3” have been provided to allow the addition ofcomponents which are not listed. The MDM Application and personnel arelisted in Other 1 and Other 2 but may be omitted if the cost is includedelsewhere.
Book Depreciation schedule
This section includes the book depreciation schedule for each of theinfrastructure items listed above.
Tax Depreciation schedule
The tax depreciation is calculated based on the “Total Implementation Cost”line earlier in this section.
This worksheet is used to capture the O&M costs associated with theproject.
General Inputs section
The components section is added to allow flexibility for either utility or third-party owned and installed assets. Select “Yes” if the utility pays for theindicated component. The per-unit cost should also be entered.
The Headcount/ Operating Expense section is used to capture the Annualexpense associated with various items (if appropriate), the FTE/ Unitequivalents to indicate the number of FTEs or units, and finally the Salaryper FTE (if appropriate). Note that the formulas that are in this section mayrequire updating depending on what assumptions are made (e.g. ifswitching between an FTE driven item to a unit driven item). Please reviewformulas in this section carefully to ensure they correspond to the type ofinput listed.
Summary of section
O&M items are shown here to create a total O&M cost. The primarybreakdown of O&M costs is as follows:
Given that organization structures can vary significantly between utilities, anexample organization structure is assumed for this model. Two of the keyfunctional areas that realize benefits from AMI are
• Customer Service
• Distribution Operations
The sections below will more fully outline the groups included in each ofthese.
CUSTOMER SERVICE BENEFITS WORKSHEET
Overview
The Customer Service Benefits Worksheet identifies O & M benefits fromseveral categories for both Electric and Gas. These include:
• Meter Reading Savings
• Billing Savings
• Credit & Collections (C&C) Savings
• Call Center(s) Savings
• Miscellaneous Savings
• Description (Note that this can be changed to an item of choice)
• Description (Note that this can be changed to an item of choice)
• Description (Note that this can be changed to an item of choice)
Capital savings are also identified for Electric and Gas.
This section summarizes the benefits associated with Customer Service andis separated into two primary sections, each of which are separated intoboth Electric and Gas:
• O&M Savings
• Capital Savings
Each of the line items within these sections are referenced from separateschedules on the Customer Service Worksheet as noted on thecorresponding footnotes.
Meter Reading Savings section
The Meter Reading Savings section identifies the direct savings in the meterreading area that are associated with an AMI deployment (For example:Labor, overtime, telecommunications, etc.) . This section is calculatedbased on items on the General Assumptions worksheet and the MeterReading Budget worksheet. Further detail is available on the footnoteswithin the Meter Reading Savings section.
Billing Savings section
AMI will increase bill accuracy and reduce billing errors. This results in acorresponding reduction in the labor associated with resolving these issues.Although this section is largely driven by assumptions elsewhere in themodel, assumptions for the FTEs (Full Time Equivalent) time andassociated employee salaries is a required input in this section. Furtherdetail is available on the footnotes within the Billing Savings section.
Credit & Collections (C&C) Savings section
Savings can be realized throughout the Credit and Collections organization.This section splits the savings into several primary categories:
• C&C Activities Savings (e.g. Theft investigations, field collections, etc)
• Costs of Good Sold (e.g. the variable energy production costs) forGas & Electric
For the “C&C Activities Savings”, it is important to add the FTE equivalenttime for the events and the associated salary per FTE. Further detail isavailable on the footnotes within the Credit & Collections section.
Call Center(s) Savings section
Similar to savings in Credit and Collections, AMI can reduce excess callvolume of various call types. Key input variables for this are included at thebottom of the section and include the number of anticipated calls per yearwhich can be avoided by call type. The Average CR productivity and wagerate is then used to estimate the reduction in labor costs. An alternativemethod of quantifying the cost savings of reduced call volume can beachieved if a “cost per call” is known (e.g. if the call center is outsourced).This approach is referenced in footnote b. This cost per call value shouldbe left blank if not known (e.g. a similar number is calculated from the dataprovided in the first footnote. Further detail is available on the footnoteswithin the Call Center Savings section.
Miscellaneous Savings
This section is used to capture other savings from AMI. The exampleshown in the model includes the following:
• Reduction in Escalated Complaints
• Reduction in Regulatory Penalties
• Worker’s Compensation Insurance
• Legal Fees
• Description (Note: This is a placeholder for any other item that isappropriate)
Further detail is available on the footnotes within the Call Center Savingssection.
Meter Reading Capital Savings
Capital costs in the meter reading area which can be avoided with AMI areincluded here. The example shows avoided costs associated with hand-
held devices and vehicles. Two additional fields are available (currentlytitled “Description”) which can be changed.
DISTRIBUTION OPS SAVINGS WORKSHEET
Overview
The Distribution Operations Savings worksheet will incorporate savings inboth O&M and Capital areas. These savings are discussed further in thissection
Summary of Operations Savings section
This section provides an overview of each primary value driver forDistribution Operations. It is organized as follows:
O&M (For Electric and Gas)
• Remote System Monitoring
• Meter Inventory Operations Savings
• Distribution Meter Reads
Capital Savings (For Electric and Gas)
• Remote System Monitoring Savings
• Meter Inventory Operations Savings
• Distribution Asset Management
In addition, several fields (currently titled “Description” or “Other”) can beupdated to reflect other items for both the O&M and Capital Savings areas.
With the exception of these custom “Description” fields, these are largelyreferenced to the appropriate schedule within this worksheet. See thefootnotes in this section for detailed references.
Note: Demand Response benefits can also be realized including, but notlimited to, increased revenue, reduced capital, and lower energy costs.These have not been included in version 1.00 of the model. Users may,however, choose to incorporate demand response or other benefits in themodel where appropriate for a given analysis.
This section quantifies the benefits of having better information about yournetwork due to AMI. This includes reductions in restoration timesassociated with day-to-day trouble, storm outages, and re-dispatching. Byhaving an AMI solution in place (depending on the chosen technology), autility can more quickly identify outage areas and can, in some cases,identify if a meter has power (including voltage) on-demand prior to havingrepair crews leave an area. These types of efficiencies reduce the amountof time crews spend in the field, resulting in lower labor costs and improvedcustomer satisfaction.
The key O&M elements identified on this sheet include:
• Day to day trouble
• Storm trouble
• Re-dispatching
A worksheet for these areas is included in the footnote section to furtheridentify calculations (e.g. number of events, costs per events, etc.)
In addition, capital savings lines are available for electric and gas. See thefootnotes in this section for detailed references.
Meter Inventory Operations Savings section
Savings can be derived if new meters are deployed that have AMIcapabilities since the meters are a new product that is replacing an oftentimes old electromechanical meter. AMI Electric meters can be both solid-state and electromechanical, so this example assumes that new meters aresolid-state. Note that Gas meters are generally retrofitted and will havedifferent benefits.
O&M benefits listed include:
• Meter Testing
• Meter Refurbishment
• Several optional items (“Description” fields)
It is possible to reduce testing requirements by moving to newer and solidstate meters, this will reduce the associated testing costs.
Similarly, meter refurbishment can also be reduced or eliminated dependingon the type of deployment
Capital savings include
• Avoided new meter purchases
• Several optional items (“Description” fields)
The savings would be derived by a difference between the replacement rateand cost of the new meters versus the existing replacement rate of the oldmeters.
Distribution Asset Management Savings section
Deploying AMI can allow more sophisticated load analysis which can resultin more “right-sizing” of assets (to prevent over or under investment in anew asset or to monitor load on existing assets). This worksheet is intendedto provide a location to realize these saving. The section is separated intoO&M labor savings and Capital Savings. Several illustrative items havebeen added to each section, including:
• Substation and Transformer Sizing
• Circuit Maintenance
See the footnotes in this section of the model for further detail.
Miscellaneous Meter Reads savings section
Utilities often have “special reads” performed by non-meter readingpersonnel. This is due to a variety of reasons including complaints, etc.This section captures the cost associated with this activity and assumes thatthese miscellaneous reads are being performed outside of the meterreading organization, therefore they were not counted elsewhere in themeter reading budget.
The value is derived from the estimated costs per miscellaneous read, thenumber of reads and growth assumptions for the number of reads.
See the footnotes in this section of the model for further detail.
The Revenue Enhancement worksheet is intended to capture additionalrevenue items associated with AMI.
Several example value drivers for Gas and Electric are shown including:
• Improved theft detection and recovery
• Increased meter reading accuracy
• Unregistered meters
An example method of computing several of these is included at the bottomof the worksheet. See the footnotes in this section of the model for furtherdetail.
AVOIDED CAPITAL WORKSHEET
This worksheet aggregates the avoided capital components of severalworksheets. These include capital savings from several worksheets,including:
• Customer Service
• Distribution Operations (Both Electric and Gas)
See the footnotes in this section of the model for further detail.
METER READING BUDGET WORKSHEET
Overview
Many utilities may represent their meter reading benefits as a function of a“cost per read”. For increased accuracy, this worksheet is intended to buildup an example budget for the pre-AMI meter reading organization to morefully identify those savings which can be realized from the meter readingorganization.
Although a budgetary build-up is preferred to fully understand the valueopportunity, an alternative line has been added at the bottom of the budgetsection which allows direct entry of the savings opportunity for the DataCollection group. This will over-ride the calculated budget worksheet valueand is provided to enable a quick estimation without re-creating a budget.See the footnotes in this section of the model for further detail.
Budget Assumptions Section
This section is used for key budgetary inputs, including number ofemployees and salaries for personnel expenses and total costs for non-personnel expenses.
See the footnotes in this section of the model for further detail.
This user guide and the associated financial model has shown an illustrativeexample for how a utility or public utility commission (PUC) may conduct apreliminary value assessment for the installation of an Advanced MeterInfrastructure system. Individual users should adapt their own approach tofit the unique organizational, operational, and financial considerations oftheir own situation.
The associated model may be updated occasionally based on industrychanges or user feedback. Please ensure that you are using the mostrecent version by visiting “www.energydelivery.mckinsey.com” and thenselect the “Advanced Metering Infrastructure (AMI)” link. In addition, if youhave feedback or suggested changes, they can be submitted on this samewebsite.