Advanced Modeling and Simulation of Integrated Gasification Combined Cycle Power Plants with CO 2 -capture Von der Fakultät für Maschinenbau, Verfahrens- und Energietechnik der Technischen Universität Bergakademie Freiberg genehmigte Dissertation zur Erlangung des akademischen Grades Doktor-Ingenieur (Dr.-Ing) vorgelegt von Dipl.-Ing. Mathias Rieger geboren am 23.04.1978 in Hoyerswerda Gutachter: Prof. Dr.-Ing. Bernd Meyer, Freiberg Prof. Dr.-Ing. Michael Beckmann, Dresden Tag der Verleihung: 17.04.2014
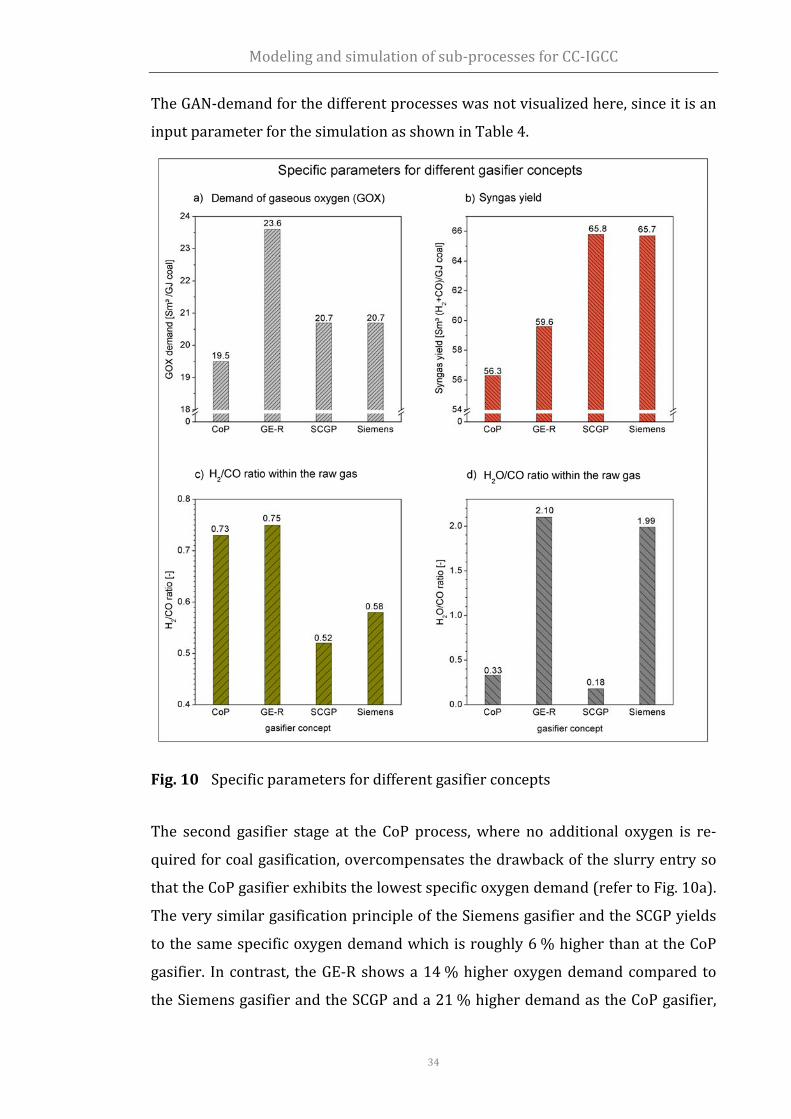
Transcript
Advanced Modeling and Simulation of
Integrated Gasification Combined Cycle
Power Plants with CO2-capture
Von der Fakultät für Maschinenbau, Verfahrens- und Energietechnik
der Technischen Universität Bergakademie Freiberg
genehmigte
Dissertation
zur Erlangung des akademischen Grades
Doktor-Ingenieur
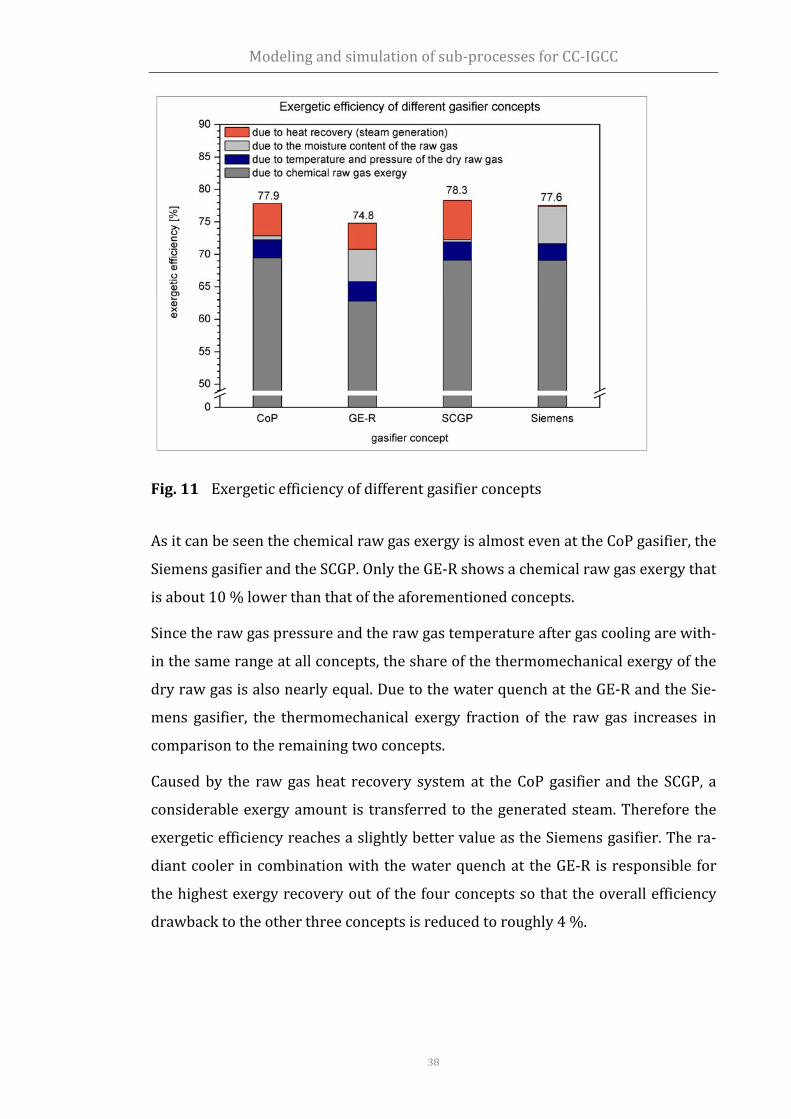
(Dr.-Ing)
vorgelegt
von Dipl.-Ing. Mathias Rieger
geboren am 23.04.1978 in Hoyerswerda
Gutachter: Prof. Dr.-Ing. Bernd Meyer, Freiberg
Prof. Dr.-Ing. Michael Beckmann, Dresden
Tag der Verleihung: 17.04.2014
II
Versicherung
Hiermit versichere ich, dass ich die vorliegende Arbeit ohne unzulässige Hilfe Drit‐
ter und ohne Benutzung anderer als der angegebenen Hilfsmittel angefertigt habe;
die aus fremden Quellen direkt oder indirekt übernommenen Gedanken sind als
solche kenntlich gemacht.
Bei der Auswahl und Auswertung des Materials sowie bei der Herstellung des Ma‐
nuskripts habe ich Unterstützungsleistungen von folgenden Personen erhalten:
Prof. Dr.‐Ing Bernd Meyer (Betreuer)
Dr. Ing. Karsten Riedl (Berechnung der GuD‐Investitionskosten; Appendix I5)
Weitere Personen waren an der Abfassung der vorliegenden Arbeit nicht beteiligt.
Die Hilfe eines Promotionsberaters habe ich nicht in Anspruch genommen. Weitere
Personen haben von mir keine geldwerten Leistungen für Arbeiten erhalten, die
nicht als solche kenntlich gemacht worden sind.
Die Arbeit wurde bisher weder im Inland noch im Ausland in gleicher oder ähnli‐
cher Form einer anderen Prüfungsbehörde vorgelegt.
Ort, Datum Dipl.‐Ing. Mathias Rieger
III
Danksagung
An dieser Stelle möchte ich all denen danken, die mich auf vielfältige Weise wäh‐
rend meiner Zeit am Institut für Energieverfahrenstechnik‐ und Chemieingenieur‐
wesen der TU Bergakademie Freiberg unterstützten.
Besonders danken möchte ich Herrn Prof. Dr.‐Ing. Bernd Meyer für die Betreuung
meiner Dissertation. Das in mich und meine Arbeitsweise gesetzte Vertrauen so‐
wie die fortwährende Unterstützung bei der Bewältigung neuer Herausforderun‐
gen haben meine persönliche und berufliche Entwicklung äußerst positiv beein‐
flusst.
Herrn Prof. Dr.‐Ing. Michael Beckmann danke ich für die Übernahme des Zweitgut‐
achtens.
Meinen ehemaligen Arbeitskollegen Hardy Rauchfuß, Robert Pardemann und Mar‐
tin Gräbner danke ich für wertvolle Hinweise und die jederzeit kollegiale und
freundschaftliche Zusammenarbeit.
Meinen lieben Eltern danke ich für die immerwährende und selbstlose Unterstüt‐
zung. Die Leistung meiner Eltern kann nicht mit Dankesworten aufgewogen wer‐
den – sie wird mir bestes Beispiel sein, für die Erziehung unserer eigenen Kinder.
Meiner lieben Ehefrau Franziska danke ich für die vielfältige Unterstützung, das
Verständnis für meine Arbeit und nicht zuletzt ihre Geduld mit mir.
Table of contents
IV
Table of contents
1 Motivation and objective ............................................................................................ 1
2 Literature survey ........................................................................................................... 2
2.1 Plant performance and economics of CC‐IGCC .................................................. 2
2.2 Optimization approaches for IGCC ......................................................................... 7
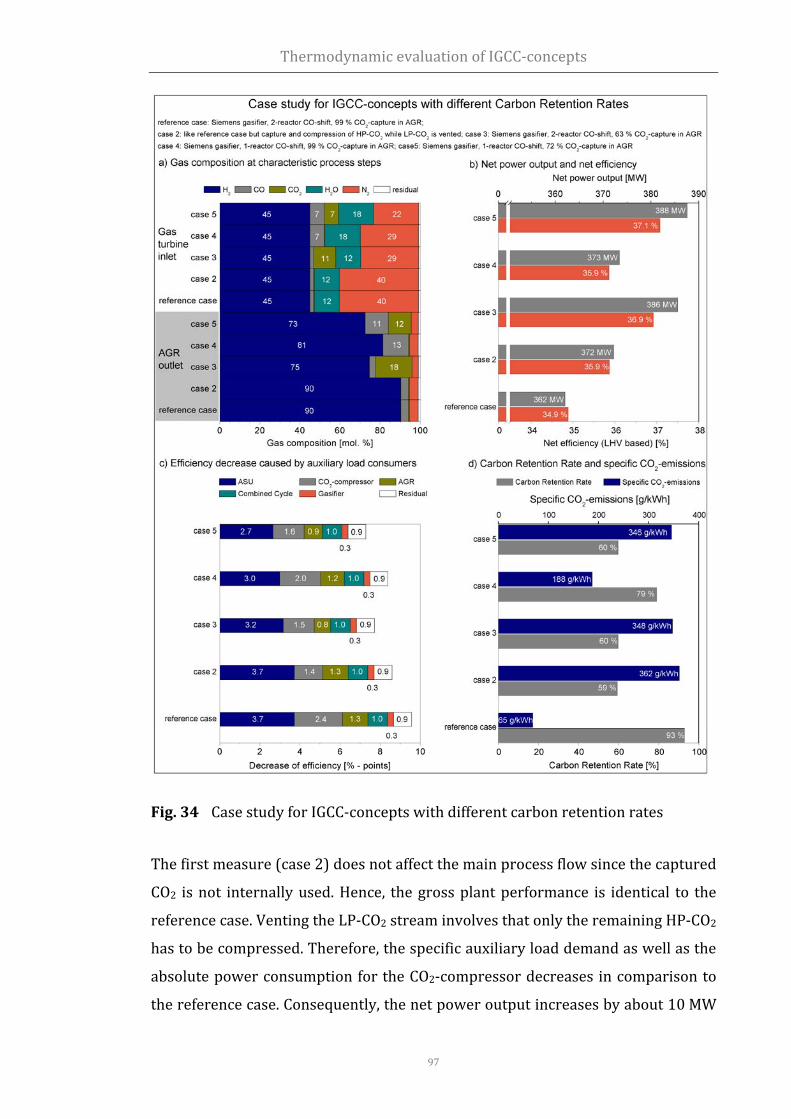
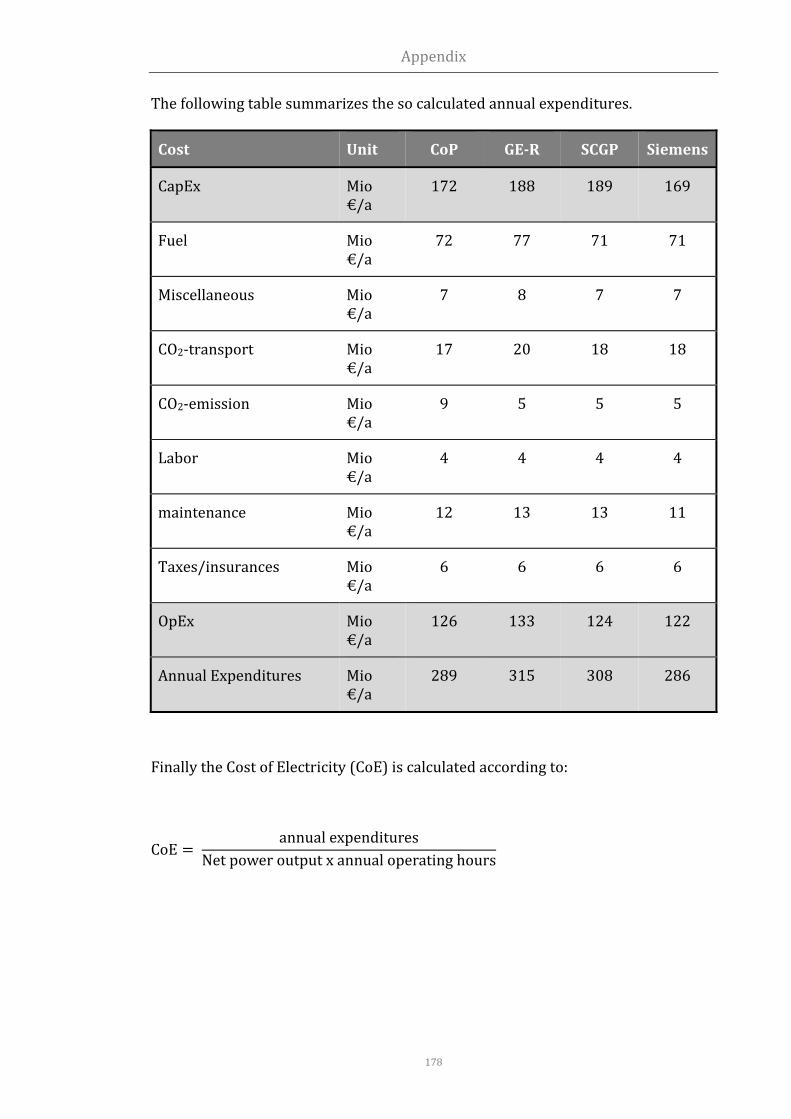
Fig. 34 Case study for IGCC‐concepts with different carbon retention rates ..... 97
Fig. 35 Cost of electricity for IGCC‐concepts with carbon capture ....................... 103
Fig. 36 Impact of realistic improvements to the cost of electricity (CoE) ......... 104
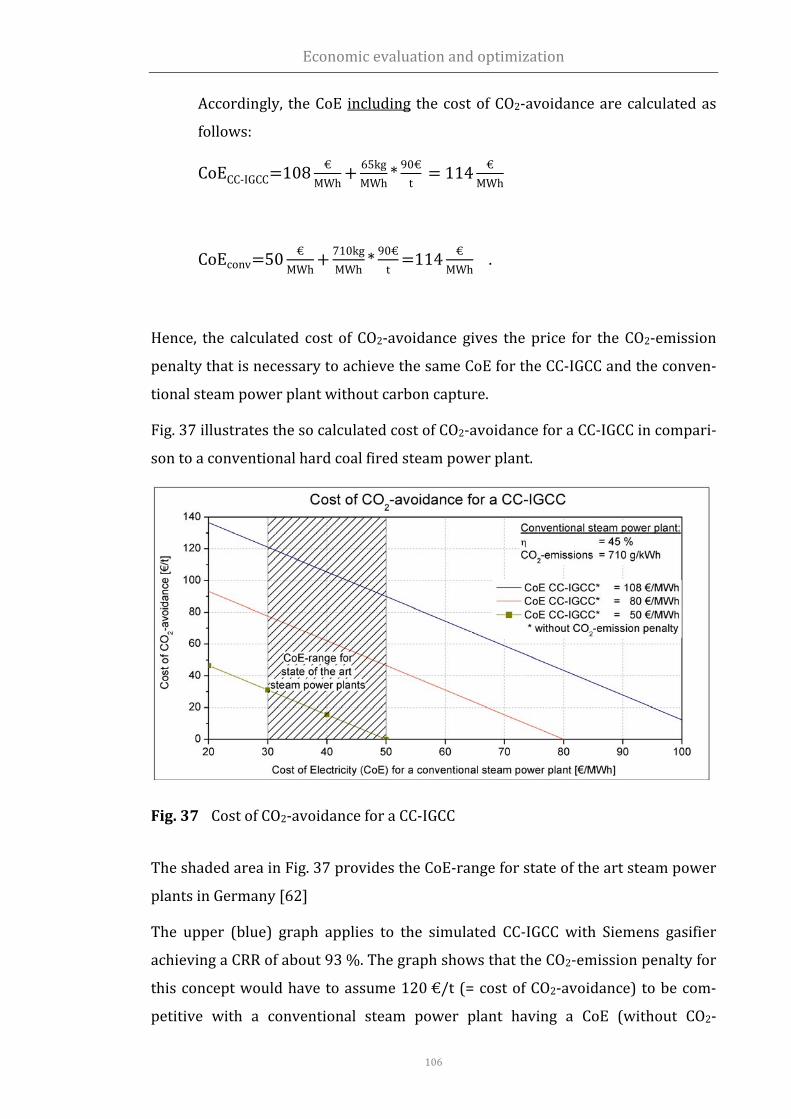
Fig. 37 Cost of CO2‐avoidance for a CC‐IGCC .................................................................. 106
List of tables
VIII
List of tables
Table 1 Major differences between some selected studies ............................................ 4
Table 2 Literature summary for the cost of electricity of CC‐IGCC ............................. 6
Table 3 Coal analysis (retrieved from [37]) ....................................................................... 29
Table 4 Specific parameters for the coal preparation and feeding process ......... 30
Table 5 Boundary conditions for simulation of the coal gasification process ..... 31
Table 6 Cold gas efficiency for the different gasification processes ........................ 35
Table 7 Significant process parameters for raw gas shift catalysts ......................... 44
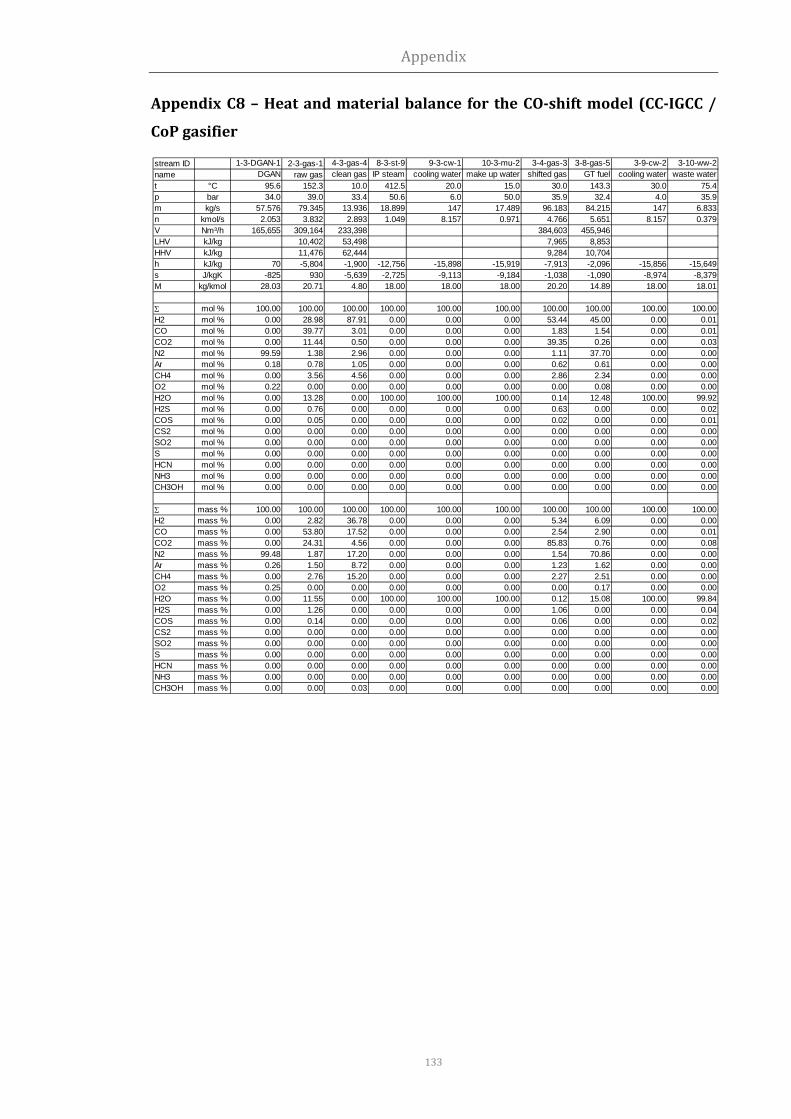
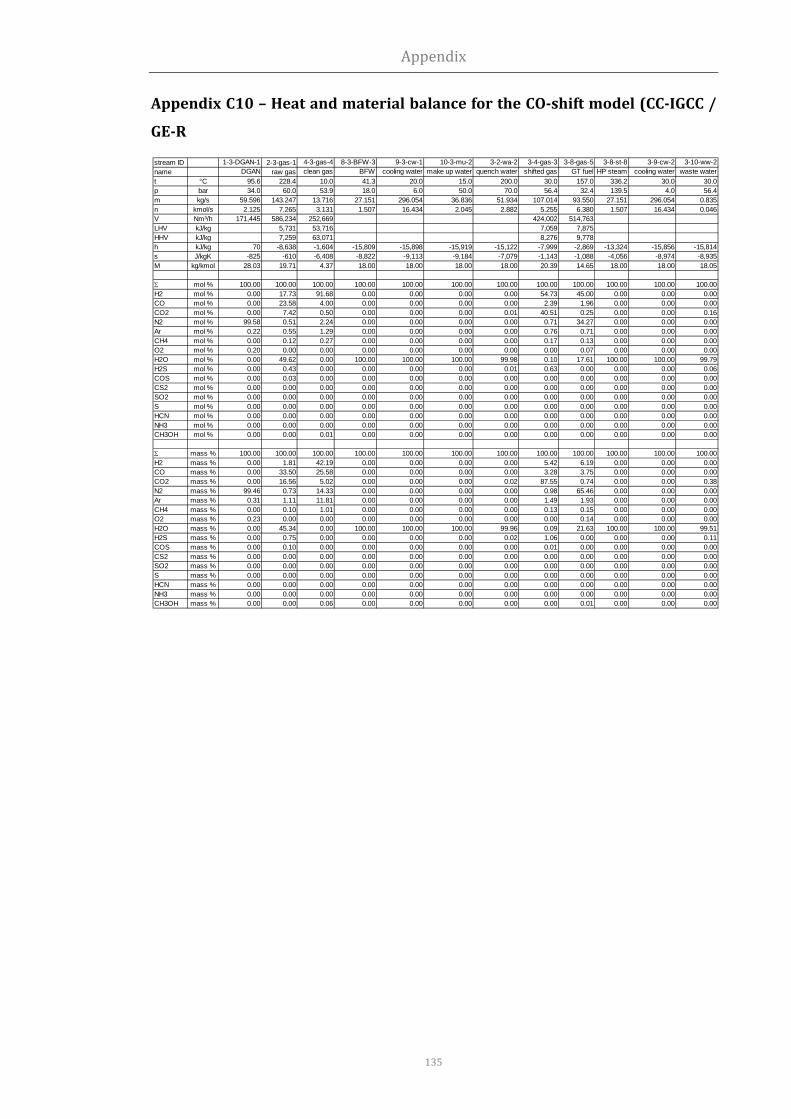
Table 8 Gas composition after the CO‐shift cycle ............................................................. 46
Table 9 Boundary conditions for AGR process simulation .......................................... 54
Table 10 Parameter adjustment for AGR process simulation ....................................... 54
Table 11 AGR calculation results for different feed gases .............................................. 57
Table 12 Gas turbine calculation results for different fuel gases ................................ 66
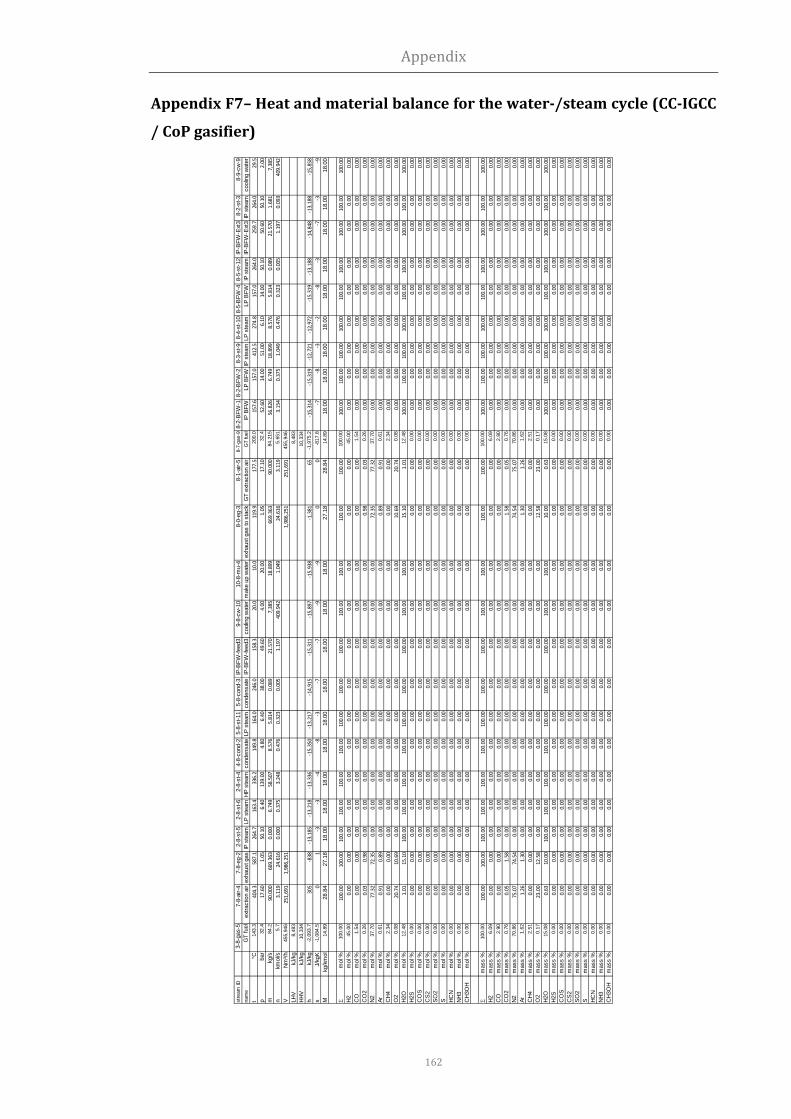
Table 13 Performance results of water‐/steam cycle simulation ............................... 72
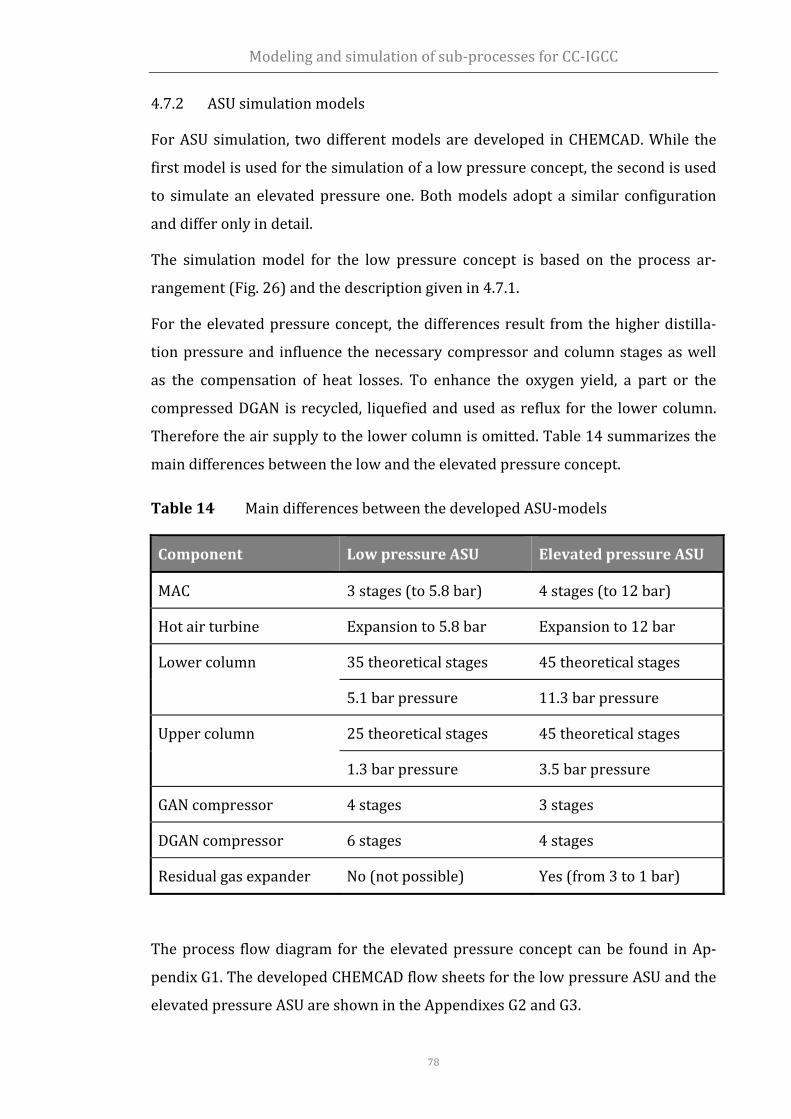
Table 14 Main differences between the developed ASU‐models ................................. 78
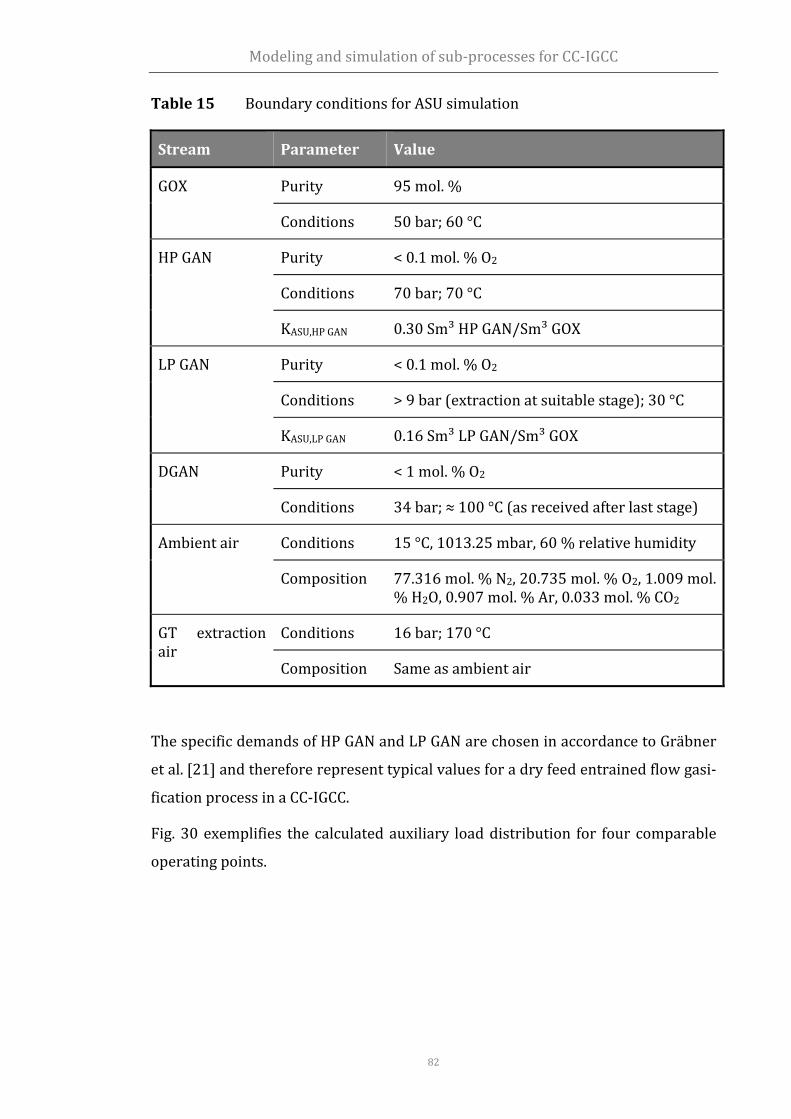
Table 15 Boundary conditions for ASU simulation ............................................................ 82
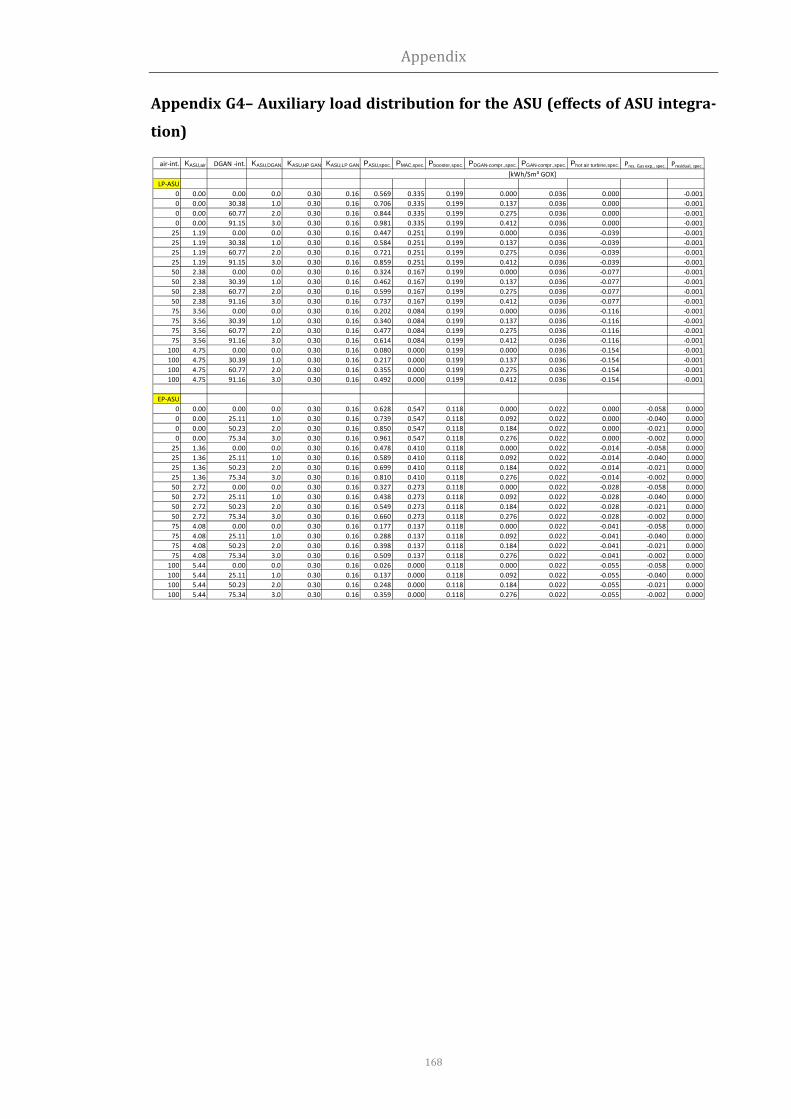
Table 16 Coefficients for calculation of the specific ASU auxiliary load ................... 85
Table 17 ASU simulation results for the CC‐IGCC based on different gasifiers ..... 86
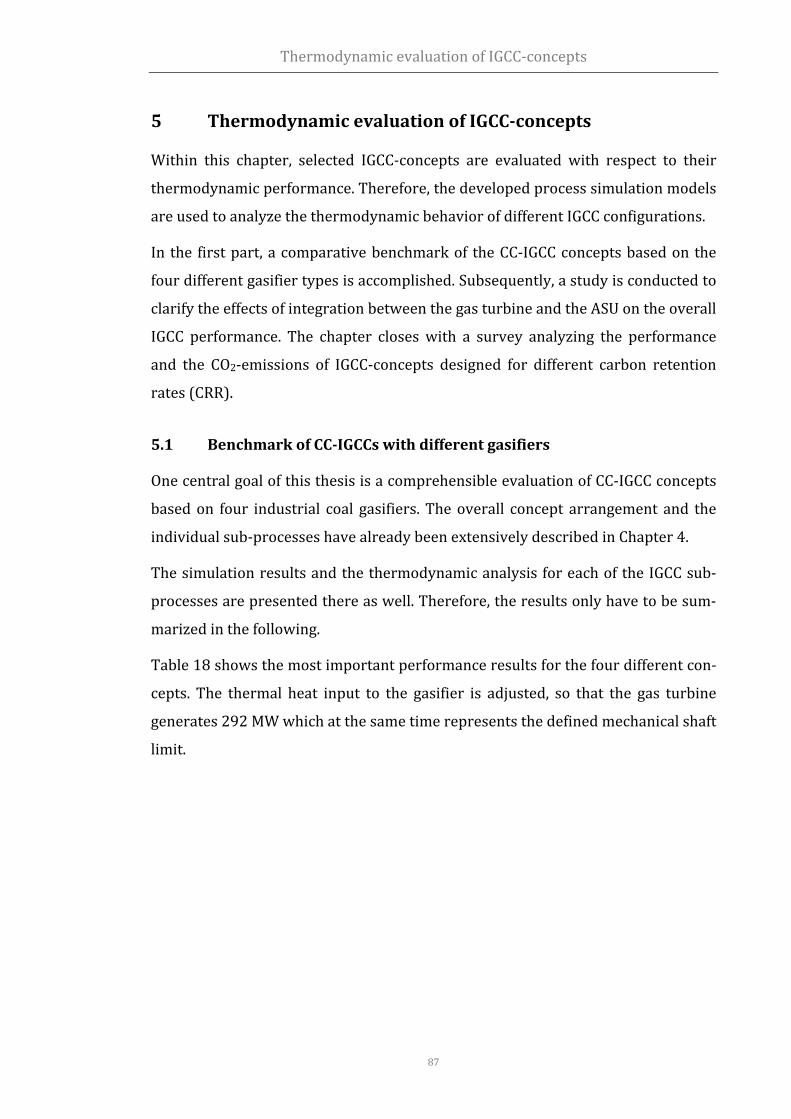
Table 18 Performance summary for CC‐IGCC concepts ................................................... 88
Table 19 Exergy losses related to the exergy input to the CC‐IGCC ............................ 91
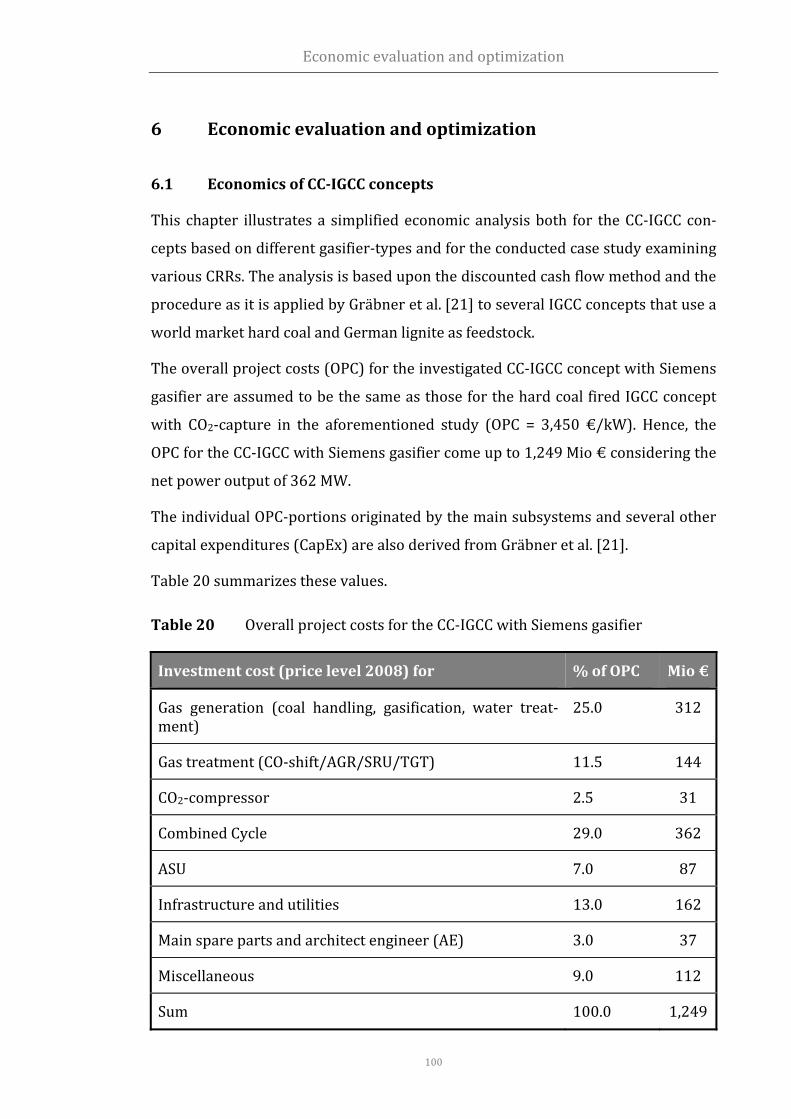
Table 20 Overall project costs for the CC‐IGCC with Siemens gasifier ................... 100
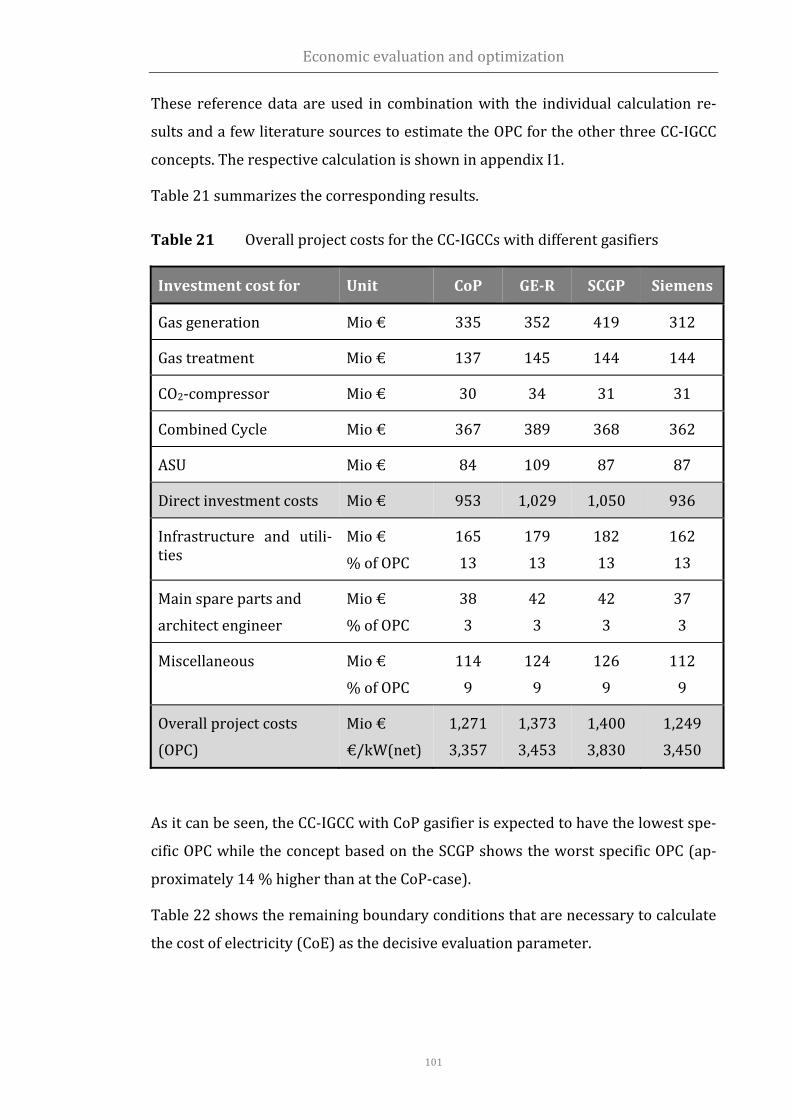
Table 21 Overall project costs for the CC‐IGCCs with different gasifiers .............. 101
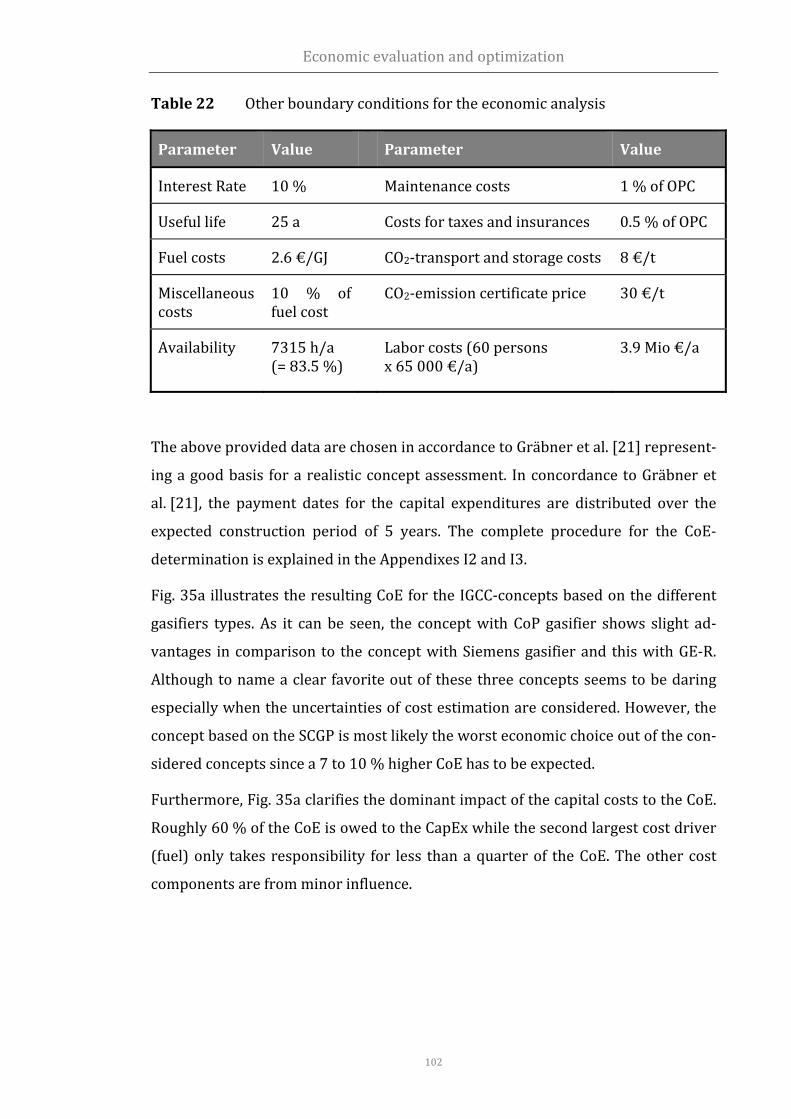
Table 22 Other boundary conditions for the economic analysis .............................. 102
Table 23 Capital costs of a CC‐IGCC assigned to the main sub‐systems ................ 108
Table 24 Performance comparison between IGCC and GCC ....................................... 109
Table 25 Cost of electricity (CoE) for a GCC concept ...................................................... 110
List of abbreviations
IX
List of abbreviations
AGR Acid gas removal
Aheating surface Heat transfer area of the HRSG heating surfaces
ASU Air separation unit
BFW Boiler feed water
C Carbon content (ultimate analysis)
CapEx Capital expenditures
CC‐IGCC IGCC with Carbon Capture
CCPP Combined cycle power plant
CCR Carbon conversion ratio
Cl Chlorine content (ultimate analysis)
CO Carbon monoxide
CO2 Carbon dioxide
CoE Cost of electricity
CoECC‐IGCC Cost of electricity for a CC‐IGCC (including the costs of
CO2‐avoidance)
CoEconv Cost of electricity for a conventional steam power plant
(including the costs of CO2‐avoidance)
COORIVA Project name for the federal funded German research
project investigating CO2‐reduction through integrated
gasification and capture
CoP ConocoPhillips
COP Coefficient of performance for the refrigeration plant at
the AGR
COS Carbonyl sulfide
CO‐shift Carbon monoxide conversion
cp Specific heat capacity
List of abbreviations
X
CPRH Condensate preheater
CRR Carbon retention rate
CSC Convective syngas cooler
DGAN Diluent gaseous nitrogen
Δ H °C Standard enthalpy of reaction
Δpcomb Pressure loss due to the gas turbines combustion
chamber
Δpcomb Pressure loss due to the gas turbines combustion
chamber at reference (design) conditions
Δtm Mean logarithmic temperature difference
Eco Economizer
EPRI Electric Power Research Institute
eH O Specific exergy flow of the wet gas
E Chemical exergy flow
E Exergy flow the coal
e Specific exergy flow of the dry gas
E Overall exergy flow
E Thermomechanical exergy flow
GAN Gaseous nitrogen
GE General Electric
GE‐Q GE gasifier with full water quench
GE‐R GE gasifier with radiant cooler and water quench
GE‐RC GE gasifier with radiant cooler and convective syngas
cooler
GOX Gaseous oxygen
GSP Gaskombinat Schwarze Pumpe
H Hydrogen content (ultimate analysis)
List of abbreviations
XI
h Specific enthalpy
h0 Specific enthalpy at reference state
H2 Hydrogen
H2S Hydrogen sulfide
HCL Hydrogen chloride
HCN Hydrogen cyanide
HHV Higher heating value
HP GAN High pressure gaseous nitrogen
HP High pressure
HP‐BFW High pressure boiler feed water
HPC High pressure column
HP‐steam High pressure steam
HRSG Heat recovery steam generator
η Electrical efficiency (net)
ηex,gasifier Exergetic efficiency of the coal gasifier
IEA International Energy Agency
IGCC Integrated Gasification Combined Cycle
IP‐ BFW Intermediate pressure boiler feed water
IP Intermediate pressure
IP‐steam Intermediate pressure steam
k Heat transfer coefficient
KASU, Specific air integration
KASU,DGAN Specific DGAN demand
KASU,HP GAN Specific HP GAN demand
KASU,LP GAN Specific LP GAN demand
Lair,int Level of air integration
List of abbreviations
XII
LHV Lower heating value
LHV Lower heating value of coal
LP‐ BFW Low pressure boiler feed water
LP GAN Low pressure gaseous nitrogen
LP Low pressure
LPC Low pressure column
LP‐steam Low pressure steam
MAC Main air compressor (of the ASU)
MeOH Methanol
MHE Main heat exchanger
MIT Massachusetts Institute of Technology
m Mass flow rate
mH O Mass flow rate of the wet gas
m Mass flow rate of coal
m , . Compressor mass flow at reference (design) conditions
m Compressor mass flow
N Nitrogen content (ultimate analysis)
N2 Nitrogen
NETL National Energy Technology Laboratory
NH3 Ammonia
NOx Nitrogen oxides
n Molar flow rate
nH Molar flow of H2 in the raw gas at the interface be‐
tween gasifier and CO‐shift
nH O Molar flow of H2O in the raw gas at the interface be‐
tween gasifier and CO‐shift
List of abbreviations
XIII
n , Molar flow rate of carbon (coal input)
n , Molar flow rate of unconverted carbon (gasifier out‐
put)
nCO, Molar flow rate of carbon monoxide in the converted
gas (downstream CO‐shift)
nCO, Molar flow rate of carbon monoxide in the raw gas (up‐
stream CO‐shift)
nCO Molar flow of CO in the raw gas at the interface be‐
tween gasifier and CO‐shift
n Molar flow rate of the dry gas
O Oxygen content (ultimate analysis)
OPC Overall project costs
OpEx Operational expenditures
p Pressure
p0 Pressure at reference state
Pel,aux Electrical auxiliary load
PASU, Electrical auxiliary load for the ASU
PASU, Specific electrical auxiliary load for the ASU
P ,AGR/SRU/TGT Total electrical auxiliary load for the AGR, the SRU and
the TGT process
P ,CO Electrical auxiliary load for the CO2‐compressor
P , Electrical auxiliary load for the refrigeration plant
(AGR)
P , . Gas turbine power output (gross) at reference (design)
conditions
P Gas turbine power output (gross)
preactor Pressure in the gasification reactor
List of abbreviations
XIV
PRENFLO Pressurized entrained flow
πturb Pressure ratio of the gas turbines turbine section
πturb,ref Pressure ratio of the gas turbines turbine section at
reference (design) conditions
Q Heat flow
Qcooling screen Heat flow through the gasifiers cooling screen
Q ,LHV Heat flow of coal based on the LHV
Q , Heat flow at the evaporator of the refrigeration plant
(AGR)
R Universal gas constant
RC Radiant cooler
s Specific entropy
S Sulfur
s0 Specific entropy at reference state
SCGP Shell Coal Gasification Process
SlurryH2O frac Water faction within the coal/water slurry
SO2 Sulfur dioxide
SRU Sulfur recovery unit
Σ E Sum of exergy efforts
Σ E Sum of exergy losses
t Temperature
t0 Temperature at reference state
t , . Blade (surface) temperature at reference (design) con‐
ditions
t Blade (surface) temperature
TGT Tail gas treatment
List of abbreviations
XV
t , . Hot gas temperature before cooling air admixture at
reference (design) conditions
t Hot gas temperature before cooling air admixture
TIT Turbine inlet temperature
TIT . Turbine inlet temperature at reference (design) condi‐
tions
treactor Temperature in the gasification reactor
Vexhaust gas Volumetric flow of exhaust gas that is not fed to the
gasification reactor
VHP GAN Volumetric flow of HP GAN
VLP GAN Volumetric flow of LP GAN
VH CO Volumetric flow of H2 and CO
V ,ASU Air demand (volumetric flow) of the ASU
VDGAN Demand of DGAN (volumetric flow)
VGOX Volumetric flow of GOX
VGOX Volumetric flow of GOX produced by the ASU
VGT . Volumetric flow of extraction air from the gas turbine
VHP GAN Demand of HP GAN (volumetric flow)
VLP GAN Demand of LP GAN (volumetric flow)
Motivation and objective
1
1 Motivation and objective
Integrated Gasification Combined Cycle (IGCC) power plants with CO2‐capture are
widely expected as the silver bullet towards CO2‐lean power generation and the
combined chemical and energetic utilization of fossil fuels [24; 34; 52].
Despite of often published thermodynamic benefits (higher efficiency than conven‐
tional pulverized coal fired power plants) and technological advantages (almost
zero‐emission of carbon dioxide, particles and mercury‐, sulfur‐, chlorine‐ or bro‐
mine compounds, etc.) IGCC could not yet be established on the power generation
market.
Nevertheless, IGCC power plants with Carbon Capture (CC‐IGCC) offer a promising
alternative for a considerable reduction of greenhouse gas emissions.
The complex correlations within and between the individual sub‐processes and
their impact on plant operation, performance and economics are so far inadequate‐
ly described and partially misunderstood or even underestimated.
A lot of international studies do not show more than an assembly of calculation
results with a superficial description of individual sub‐processes and for the most
part an overall concept optimization is missing.
The objective of this thesis is an extensive description of the correlations in some
of the most crucial sub‐processes for hard coal fired CC‐IGCC and their influence on
overall plant operation, performance and economics.
The development and description of simulation models for CC‐IGCC sub‐processes
will clarify the most important coherences. The generated findings point out ther‐
modynamic and economic potentials as well as operational limits and therefore
provide the basis for future concept optimization and engineering development
directions.
The derived conclusions and evaluations are helpful and necessary both for engi‐
neering companies and electric utilities either for technological and operational
purposes or for investment and strategy decisions.
Literature survey
2
2 Literature survey
Fossil fuels and especially coals are broadly anticipated to play a dominant role
within the future power generation market worldwide [3; 30]. CO2‐emmissions
that are inherently connected with conventional coal usage and their potential in‐
fluence on the global climate are the key factor for the development of coal based
CO2‐lean power generation concepts. In this context CC‐IGCC power plants are
considered to be a promising alternative.
A great number of international studies investigated the expected IGCC‐
performance and IGCC‐economics. The objective of the present literature survey is
the analysis and assessment of study results for CC‐IGCC.
2.1 Plant performance and economics of CCIGCC
Performance data for CC‐IGCC concepts are extracted from Holt (2000) [24],
Holt (2002) [25], Chen and Rubin [6], Chiesa et al. [7], Cormos [8], Descamps et
al. [9], Gräbner et al. [20], Huang et al. [29], IEA [31], Katzer [34], Klara and
Plunkett [36], Kunze and Spliethoff [39], Martelli et al. [43] and NETL (2002‐
2010) [45‐47].
Fig. 1 shows the efficiency of the investigated IGCC‐concepts allocated to four in‐
dustrial coal gasifier types as there are:
- The Shell Coal Gasification Process (SCGP),
- The Siemens gasifier,
- The ConocoPillips (CoP) gasifier and
- The General Electric (GE) gasifier.
The latter type is commercially available in three configurations:
- With full water quench (GE‐Q),
- With radiant cooler and convective syngas cooler (GE‐RC) and
- With radiant cooler and water quench (GE‐R).
Referring to this, distinctions are also made in the figure.
Literature survey
3
Moreover, Fig. 1 provides some information about the coal‐feedstock for which the
different IGCC‐concepts have been developed. These coals can all be classified as
bituminous. The coal moisture content varies between 5 and 13 % and the lower
heating value between 25 and 30 MJ/kg. Therefore the concepts are comparable.
Fig. 1 Literature summary for the net efficiency of IGCC‐power plant concepts
with CO2‐capture
As it can be seen in Fig. 1 there is a high fluctuation for the expected net efficiency
even for IGCC‐concepts with the same gasifier type.
For a few selected studies, Table 1 provides some explanation where the observed
performance differences arise from.
Literature survey
4
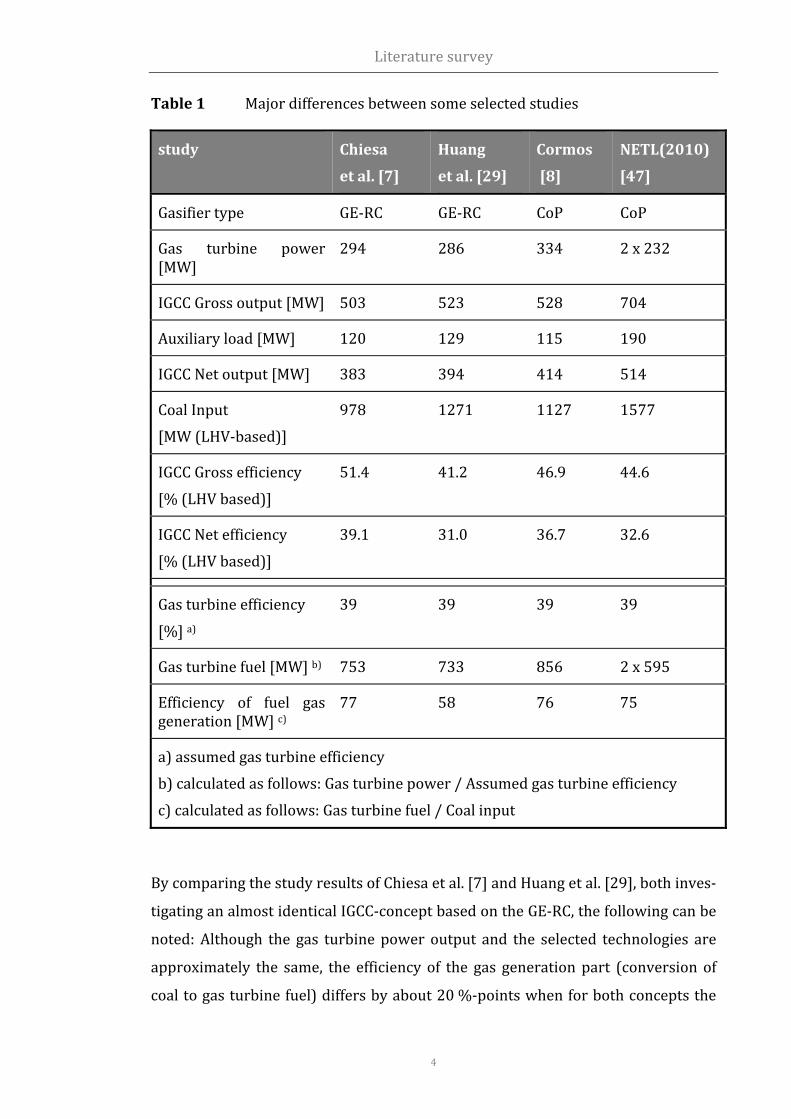
Table 1 Major differences between some selected studies
study Chiesa
et al. [7]
Huang
et al. [29]
Cormos
[8]
NETL(2010)
[47]
Gasifier type GE‐RC GE‐RC CoP CoP
Gas turbine power [MW]
294 286 334 2 x 232
IGCC Gross output [MW] 503 523 528 704
Auxiliary load [MW] 120 129 115 190
IGCC Net output [MW] 383 394 414 514
Coal Input [MW (LHV‐based)]
978 1271 1127 1577
IGCC Gross efficiency [% (LHV based)]
51.4 41.2 46.9 44.6
IGCC Net efficiency [% (LHV based)]
39.1 31.0 36.7 32.6
Gas turbine efficiency [%] a)
39 39 39 39
Gas turbine fuel [MW] b) 753 733 856 2 x 595
Efficiency of fuel gas generation [MW] c)
77 58 76 75
a) assumed gas turbine efficiency b) calculated as follows: Gas turbine power / Assumed gas turbine efficiency c) calculated as follows: Gas turbine fuel / Coal input
By comparing the study results of Chiesa et al. [7] and Huang et al. [29], both inves‐
tigating an almost identical IGCC‐concept based on the GE‐RC, the following can be
noted: Although the gas turbine power output and the selected technologies are
approximately the same, the efficiency of the gas generation part (conversion of
coal to gas turbine fuel) differs by about 20 %‐points when for both concepts the
Literature survey
5
same gas turbine efficiency is assumed. This fact indicates that both studies use
greatly different modeling assumptions for the gas generation part.
In contrast, the studies conducted by Cormos [8] and NETL (2010) [47], both in‐
vestigating an IGCC‐concept based on the CoP gasifier, seem to use almost the
same modeling assumptions for it (as there is no big difference at the efficiency of
the gas generation part). However, the net‐performance difference of about 4 %‐
points is due to disparities at the auxiliary load calculation and at the chosen gas
turbine class (F‐class and G‐class).
With respect to a comparison of all four major gasifier types, only the study con‐
ducted by Cormos [8] can be considered. Therein CC‐IGCC concepts are investigat‐
ed for all mentioned gasifiers on a common basis, so that a realistic technology
comparison can be conducted. According to this study, the highest net efficiency
can be achieved using the SCGP followed by the CoP gasifier: However, a fairly high
difference to the absolute performance data provided by the engineering based
studies as for instance IEA [31], Gräbner et al. [20] or the NETL‐studies [45‐47] is
noted. Moreover, the mentioned NETL‐studies identify an IGCC‐concept based on
the GE‐R as superior to a concept with CoP gasifier or SCGP.
Literature survey
6
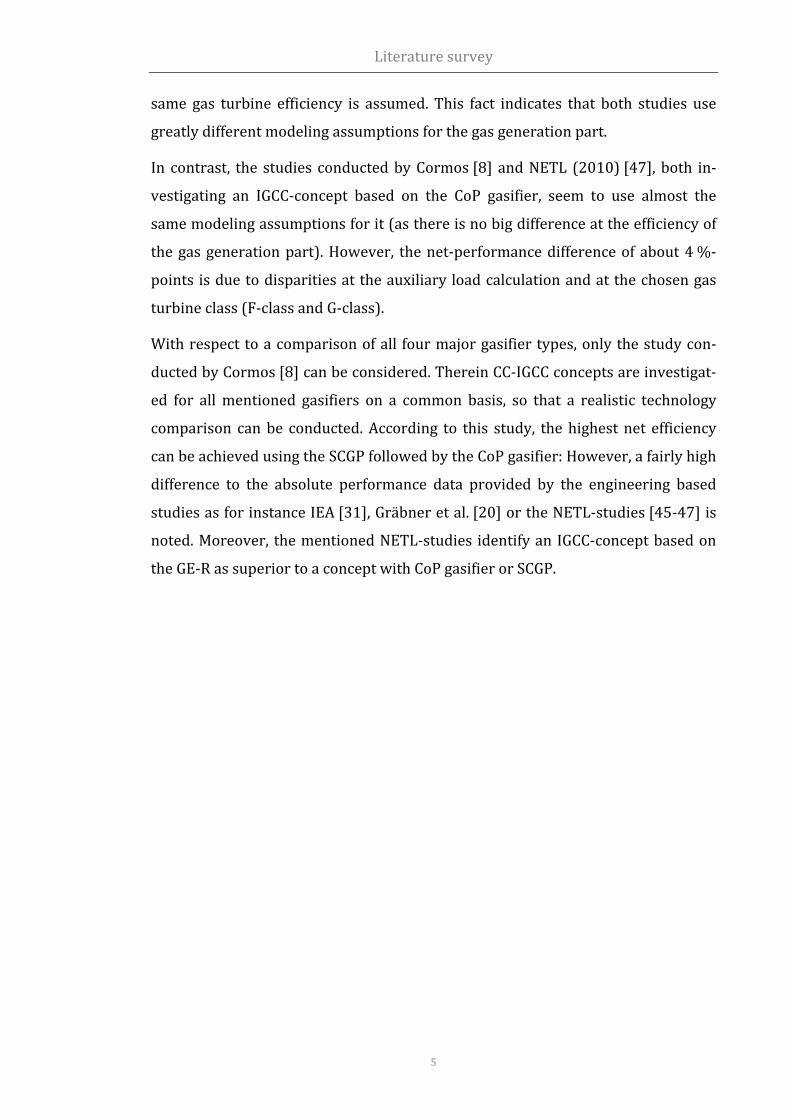
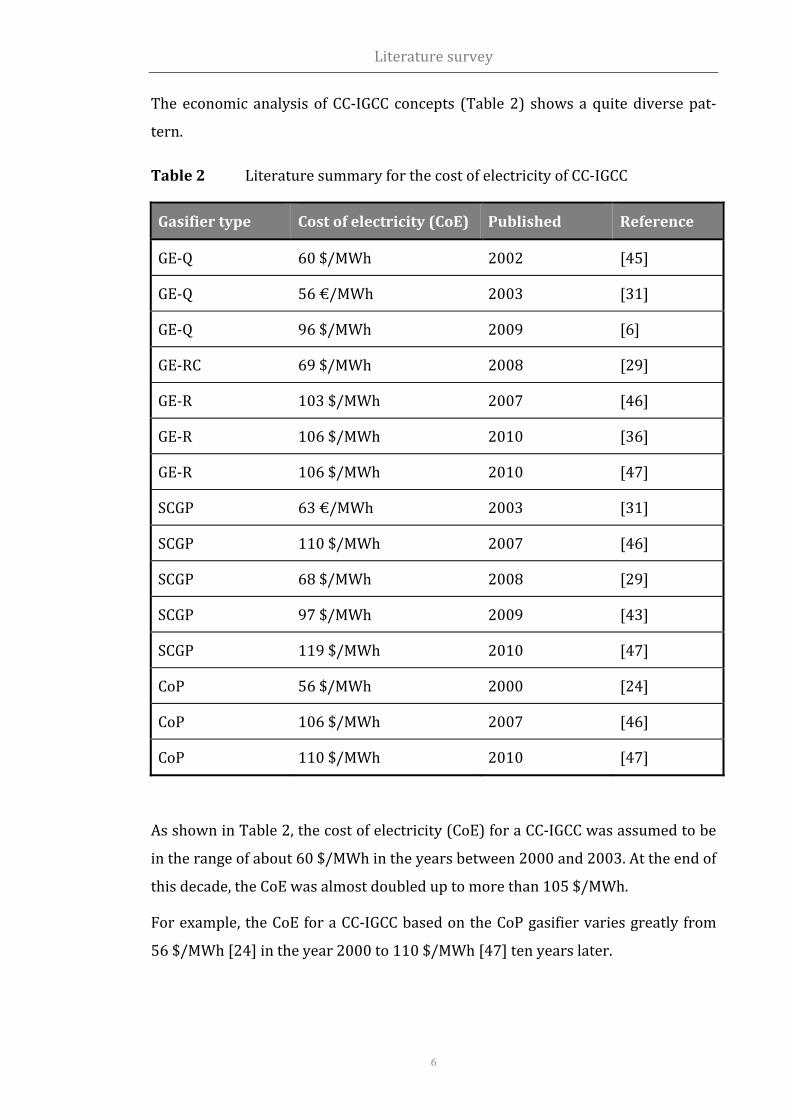
The economic analysis of CC‐IGCC concepts (Table 2) shows a quite diverse pat‐
tern.
Table 2 Literature summary for the cost of electricity of CC‐IGCC
Gasifier type Cost of electricity (CoE) Published Reference
GE‐Q 60 $/MWh 2002 [45]
GE‐Q 56 €/MWh 2003 [31]
GE‐Q 96 $/MWh 2009 [6]
GE‐RC 69 $/MWh 2008 [29]
GE‐R 103 $/MWh 2007 [46]
GE‐R 106 $/MWh 2010 [36]
GE‐R 106 $/MWh 2010 [47]
SCGP 63 €/MWh 2003 [31]
SCGP 110 $/MWh 2007 [46]
SCGP 68 $/MWh 2008 [29]
SCGP 97 $/MWh 2009 [43]
SCGP 119 $/MWh 2010 [47]
CoP 56 $/MWh 2000 [24]
CoP 106 $/MWh 2007 [46]
CoP 110 $/MWh 2010 [47]
As shown in Table 2, the cost of electricity (CoE) for a CC‐IGCC was assumed to be
in the range of about 60 $/MWh in the years between 2000 and 2003. At the end of
this decade, the CoE was almost doubled up to more than 105 $/MWh.
For example, the CoE for a CC‐IGCC based on the CoP gasifier varies greatly from
56 $/MWh [24] in the year 2000 to 110 $/MWh [47] ten years later.
Literature survey
7
This increase is mainly caused by three facts, which can be illustrated by a compar‐
ison of the two last‐mentioned studies (in each case for the IGCC based on the CoP
gasifier):
1. The tremendous rise of capital costs of more than 140 %
2. The increase of fuel cost by about 30 %
3. The reduction of the expected net efficiency by about 8 %‐points
2.2 Optimization approaches for IGCC
Most of the optimization approaches for IGCC‐concepts were focused on the inves‐
tigation of the integration influence between the gas turbine and the air separation
unit (ASU). The technological need for ASU‐integration is described in detail by
Smith [57] or Farina and Bressan [13].
In general, it has to be distinguished between air‐ and nitrogen integration. The
level of air integration stands for the amount of gas turbine extraction air in rela‐
tion to the air demand of the ASU. A level of 50 % means that half of the ASUs air
demand is extracted as compressed air out of the gas turbine. The remaining 50 %
have to be compressed by the main air compressor (MAC) of the ASU. The nitrogen
that is generated at the ASU can be admixed to the hydrogen rich gas for the pur‐
pose of NOx‐reduction and to stabilize combustion. Hence, the amount of admixed
nitrogen in relation to the produced nitrogen flow is expressed by the level of ni‐
trogen integration.
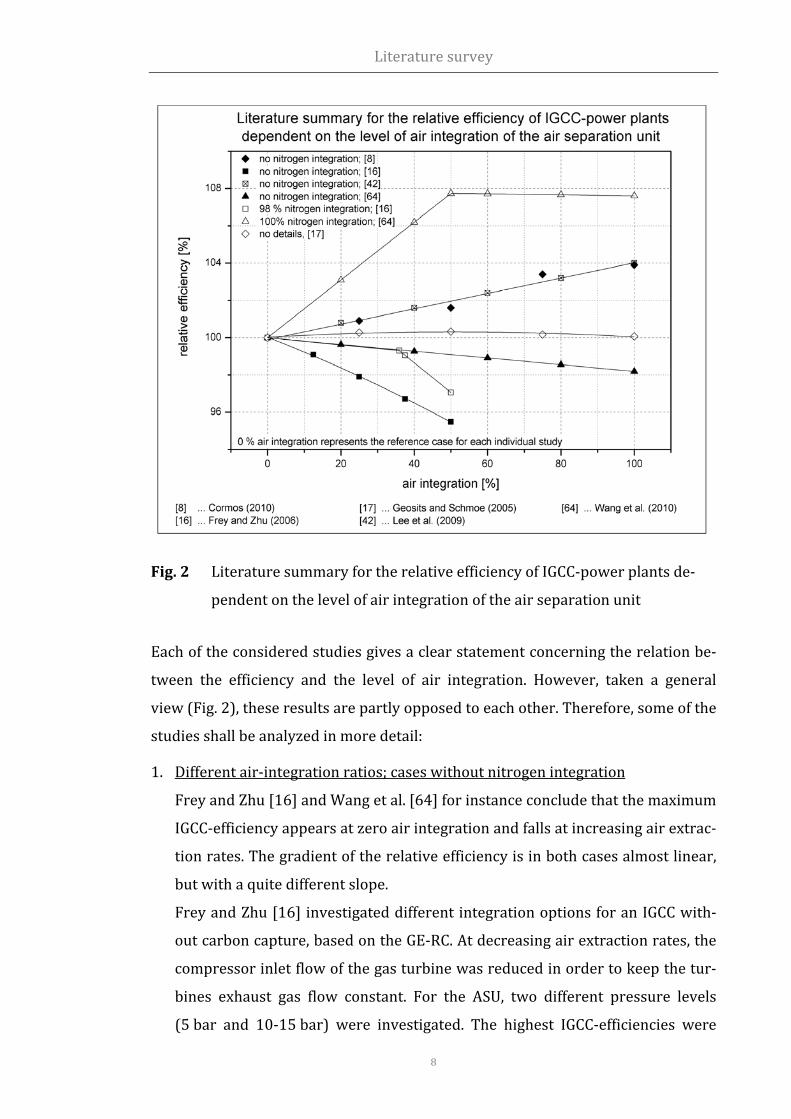
Fig. 2 summarizes the relative efficiency for IGCC‐concepts dependent on the level
of air integration for different nitrogen integration rates.
Literature survey
8
Fig. 2 Literature summary for the relative efficiency of IGCC‐power plants de‐
pendent on the level of air integration of the air separation unit
Each of the considered studies gives a clear statement concerning the relation be‐
tween the efficiency and the level of air integration. However, taken a general
view (Fig. 2), these results are partly opposed to each other. Therefore, some of the
studies shall be analyzed in more detail:
1. Different air‐integration ratios; cases without nitrogen integration
Frey and Zhu [16] and Wang et al. [64] for instance conclude that the maximum
IGCC‐efficiency appears at zero air integration and falls at increasing air extrac‐
tion rates. The gradient of the relative efficiency is in both cases almost linear,
but with a quite different slope.
Frey and Zhu [16] investigated different integration options for an IGCC with‐
out carbon capture, based on the GE‐RC. At decreasing air extraction rates, the
compressor inlet flow of the gas turbine was reduced in order to keep the tur‐
bines exhaust gas flow constant. For the ASU, two different pressure levels
(5 bar and 10‐15 bar) were investigated. The highest IGCC‐efficiencies were
Literature survey
9
always achieved with the low pressure ASU. It was found that air compression
in the MAC is more efficient than in the gas turbines compressor since the latter
requires air expansion down to the ASUs operating pressure.
The study conducted by Wang et al. [64] almost used the same approach, but
only a low‐pressure ASU and not a high‐pressure ASU was considered. External
air compression in the MAC was also found more efficient than in the gas tur‐
bine compressor; however the differences between full and zero air integration
were not as broad as found by Frey and Zhu [16].
In contrast to the above summarized articles, Cormos [8] for example pub‐
lished directly opposed characteristics. The author investigated different air in‐
tegration levels for an IGCC with carbon capture, based on the Siemens gasifier.
Within this study, it was found that the IGCC‐efficiency reaches its maximum at
100 % air integration and falls almost linear with decreasing air integration ra‐
tios. The quite low auxiliary load of the ASU indicates that excess nitrogen was
not admixed to the hydrogen rich fuel before combustion in the gas turbine.
As expected, the gas turbine power output increases at falling air integration
levels. But surprisingly, the steam turbine power output falls at an increasing
gas turbine output. This is not typical for combined cycle processes – an expla‐
nation for this behavior would have been helpful, but was not provided by the
author. Moreover, it is not clear, why the power output of the air expander
(which expands the gas turbine extraction air to the required ASU operating
pressure) keeps at a constant value at different air extraction rates.
2. Different air‐integration ratios; cases with full nitrogen integration
Frey and Zhu [16] and Wang et al. [64] also investigated the impact of air inte‐
gration to the IGCC efficiency at full nitrogen integration levels.
Frey and Zhu [16] came to the result that the highest IGCC‐efficiency again can
be achieved at zero air integration. In contrast to the analysis without nitrogen
integration, the concepts with a high pressure ASU are always found superior
to those with a low‐pressure ASU. This is a consequence of the higher product
(essentially nitrogen) pressure which can be achieved at ASUs that operate at
an elevated pressure. The higher product pressure reduces the pressure ratio
for nitrogen compression and therefore the specific work for compression.
Literature survey
10
Wang et al. [64] identifies a slight efficiency maximum at a level of 50 % air in‐
tegration upon a sharp efficiency increase between zero and 50 % air‐side in‐
tegration. Unfortunately, this study only presents the results – an explanation is
missing, so that one can only speculate about the reasons of this behavior: The
gas turbine power output has a clear maximum at 50 % air integration and de‐
creases with almost the same slope to both sides of this value. The decrease of
gas turbine power in the range between 50 and 100 % air integration is due to
the decreasing flow through the turbine. The reason for power decrease be‐
neath 50 % air integration is not clear. If the gas turbine would have reached its
maximum flow or mechanical limit, a constant power output from 50 % down
to zero air integration would have been expected.
Fig. 3 Literature summary for the relative efficiency of IGCC power plants de‐
pendent on the level of nitrogen integration of the air separation unit
Literature survey
11
3. Different nitrogen‐integration ratios; cases without air integration
Again Frey and Zhu [16] and Wang et al. [64] investigated these scenarios and
got to opposed results: The former study claims that the highest efficiency can
be expected at full nitrogen integration. Due to the application of two different
ASU pressure‐concepts, the following could be observed:
Elevated‐pressure ASUs are superior to conventional low‐pressure ASUs when
the level of nitrogen integration exceeds the 50 % line. The change of the ASU
pressure‐concept is indicated by the discontinuity of the respective graph in
Fig. 3.
In contrast, Wang et al. [64] reports an almost constant efficiency between zero
and 30 % nitrogen integration. From there on a sharp efficiency decrease with
a steady slope is shown for increasing nitrogen integration rates. The used gas
turbine has its power maximum at 30 % nitrogen integration. Again, the gas
turbine power output decreases with almost the same slope to both sides of the
maximum. Same as mentioned above, the missing background information for
the gas turbines operating behavior complicates the confirmability of the re‐
sults.
4. Different nitrogen‐integration ratios; cases with full air integration
The publications of Lee et al. [42] and Wang et al. [64] present contradictory
results.
Wang et al. [64] reports a slight maximum at zero nitrogen integration and a
small efficiency decrease with a rising nitrogen integration rate. The gas tur‐
bine power output increases continuously over the complete range. So it is as‐
sumed, that the gas turbine does not reach its full capacity with the given
100 % air integration.
The analysis presented by Lee et al. [42] stands out due to the sophisticated
modeling of the gas turbines operating behavior. Amongst others, this is
achieved by using a compressor map and the consideration of the compressor
surge margin as well as the firing temperature. So the authors came to the re‐
sult that the IGCC‐power output increases more rapidly than the fuel consump‐
tion at increasing nitrogen integration rates. Consequently, the IGCC‐efficiency
increases in this direction, too.
Literature survey
12
A few studies investigate the CO2‐capture rate as an optimization parameter. Chen
and Rubin [6] report that a CO2‐capture rate of 90 % yields to the lowest costs of
CO2‐avoidance. Descamps et al. [9] vary the CO2‐capture rate for a CC‐IGCC be‐
tween 80 and 98 % and identify the highest efficiency at 80 % CO2‐capture, which
is reported to be 7.5 % higher than the efficiency at 98 % CO2‐capture.
An IGCC concept with 60 % CO2‐capture is compared to an IGCC‐concept with 80 %
CO2‐capture by Ordorica‐Garcia et al. [49], where an efficiency advantage of about
4.5 % and an advantage for the CoE of about 6.5 % are found for the IGCC with
60 % CO2‐capture.
Future technologies as processes with ion transport membranes, hot gas clean up,
advanced gas turbines, advanced gasifiers and others that are not defined as prov‐
en technology are disregarded in the literature survey, since the state of the art
technology will most likely provide the basis for the first of its kind CC‐IGCC appli‐
cation.
2.3 Critical review
As the literature data presented in Chapter 2.1 and 2.2 show either high fluctuation
(efficiency, CoE) or even contrary behavior (air and nitrogen integration) a con‐
cluding assessment of CC‐IGCC concepts and optimization approaches seems not
possible yet.
Moreover, for some study results a high level of uncertainty is assumed since the
evolutionary history of them cannot be reconstructed [4; 6; 29; 64].
The extensive studies conducted by the International Energy Agency (IEA) [31],
the Electric Power Research Institute (EPRI) [24; 25] and the National Energy
Technology Laboratory (NETL) [45; 46] have room for improvement as process
modeling is inadequately described. Consequently, the calculation results are hard
to reconstruct. For this reason the cause determination for the observed data fluc‐
tuation is hindered or even not possible. Also for Bohm et al. [2], Chen et al. [6],
Gräbner et al. [20], Kim et al. [35], Lee et al. [41] and Martelli et al. [43] results as‐
sessment and concept comparison suffer from the low level of modeling details
provided.
Literature survey
13
The study “The future of coal” [34] prepared by the well‐known Massachusetts
Institute of Technology (MIT) reports a fairly big lack of knowledge with regard to
process modeling tools and defines this as a major problem for a reliable assess‐
ment of complex power generation cycles as CC‐IGCC. Furthermore, therein an
“urgent need to develop modeling and simulation capability and tools” (ibid, p.
103) is stated, as the basis for secure concept comparison.
The literature review for IGCC optimization scenarios reveals a very diverse pic‐
ture. In the following some shortcomings and doubts about the investigated stud‐
ies concerning the ASU‐integration aspect are pointed out:
- According to Smith [57], the maximum hydrogen content within the gas turbine
fuel can be realized at 45‐50 vol. % which means that fuel gas dilution below
this value is not required. As a consequence the investigations conducted by
Frey and Zhu [16], Farina and Bressan [13], Lee et al. [42] and Maurstad [44]
concerning the effect of nitrogen dilution have become obsolete.
- Spliethoff [58] claims that air “integration of 100 % will always yield the maxi‐
mum efficiency” (ibid, p. 612) since the “better compression efficiency of the gas
turbine helps to reduce the energy demand for the compression as a whole”
(ibid, p. 611). In contrast to the gas turbine compressor, the main air compres‐
sor (MAC) of the ASU operates with intercooling and pressurizes the air only to
the necessary pressure level. Hence, the compression efficiency within the MAC
should be superior to the gas turbine compression.
- Within the summary of the federal funded German COORIVA‐project, Gräbner et
al. [20] mentioned that the maximum IGCC‐efficiency is reached at full air and
nitrogen integration. Unfortunately, modeling and simulation details which
could have been used to prove this statement are not published.
- Incomprehensible conclusions are found in Emun et al. [10] as there is stated
that increasing nitrogen dilution, yields to growth of thermal efficiency, ”due to
a decrease in the slurry (coal) requirement, as more N2 is used to drive the tur‐
bine” (ibid, p. 335).
- Wang et al. [64] also presents only calculation results. Explanations of the es‐
sential gas turbine characteristics as well as information about modeling details
Literature survey
14
fail to appear. Consequently, the reader is forced to speculate about the reasons
for the presented results.
- In accordance with Geosits and Schmoe [17] the maximum IGCC‐efficiency can
be reached at 50 % air integration. However, no details and boundary condi‐
tions are presented to prove this statement, but it is mentioned that the gener‐
ated findings are “likely to change with improving gasification plant, ASU and
gas turbine performance and, therefore, should be evaluated for each project.”
(ibid, p. 3).
At this point it has to be mentioned that the publications of Frey and Zhu [16] and
Lee et al. [42] present some good approaches that are taken into consideration
within this thesis. In detail, these approaches are the investigation of different
ASU‐ pressure levels and the sophisticated modeling of the gas turbines operating
behavior.
Literature reviewed in terms of the optimum CO2‐capture rate showed the follow‐
ing weak points:
- The carbon monoxide conversion rate (CO‐conversion rate) within the carbon
monoxide shift (CO‐shift) cycle is varied in Descamps et al. [9] by a change of in‐
termediate pressure (IP) steam supply to the CO‐shift in order to investigate dif‐
ferent CO2‐capture rates. The mentioned approach is not realistic, as the reduc‐
tion of IP‐steam supply primarily causes the catalyst to overheat.
- There are reasonable doubts about the results found by Ordorica‐Garcia et
al. [49] as the calculated auxiliary load share of the acid gas removal (AGR) sys‐
tem differs greatly from the AGR auxiliary load share presented within the ex‐
tensive engineering‐based studies as [20] or [31].
To sum it up, it can be stated that proper process description, modeling and simu‐
lation are often missing within the reviewed literature. Very diverse results have
been found so that clear tendencies could not be derived.
Thesis outline
15
3 Thesis outline
As a consequence of the literature review, the development and proper description
of sophisticated process modeling tools for the major CC‐IGCC sub‐processes are
defined as one of the main tasks of this thesis.
More precisely, simulation models for the gasification process, the ASU, the carbon
monoxide conversion (CO‐shift) cycle, the AGR unit with CO2‐compression, the sul‐
fur recovery unit (SRU), the tail gas treatment (TGT) process, the gas turbine and
the water steam cycle of the combined cycle power plant (CCPP) are developed.
Special emphasis is laid on the substantial description of global coherences in or‐
der to clarify the correlations within and between the individual sub‐processes. So,
the simulation models are used for instance to investigate the influence of integra‐
tion between the gas turbine and the ASU for a CC‐IGCC.
Furthermore, CC‐IGCC concept routes for four types of industrial coal
gasifiers (CoP gasifier, GE‐R, SCGP and Siemens gasifier) are designed and simulat‐
ed using the developed process calculation models, so that a comprehensible tech‐
nology and concept assessment can be conducted. The results of the thermody‐
namic calculations provide the basis for an economic evaluation and the analysis of
critical points.
The generated findings represent the starting point for CC‐IGCC concept optimiza‐
tion. Thereby different optimization scenarios are investigated so that amongst
others the thermodynamic and economic influence of the CO2‐capture rate is clari‐
fied.
Finally, the generated knowledge yields to the development of an advanced gasifi‐
cation based power plant configuration which improves the economic results.
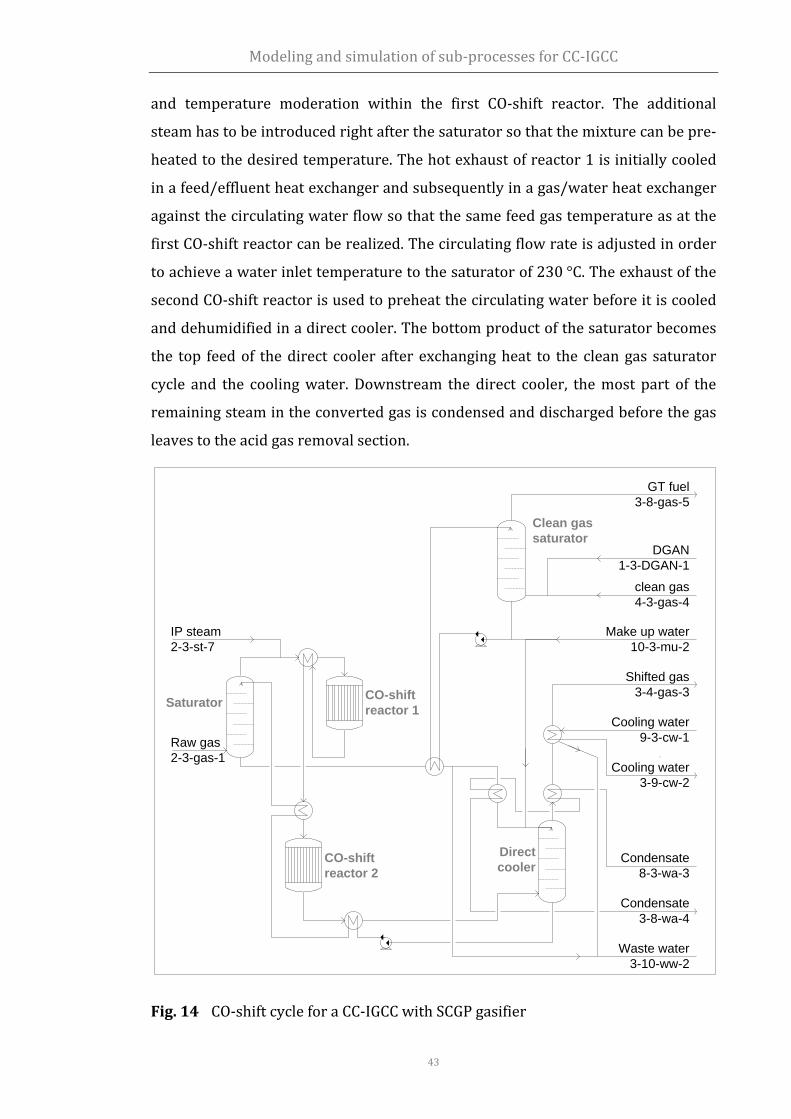
Modeling and simulation of sub‐processes for CC‐IGCC
16
4 Modeling and Simulation of sub processes for CCIGCC
In this chapter the main sub‐processes of CC‐IGCC power plants are investigated in
detail. For a given overall CC‐IGCC configuration, the individual processes are de‐
scribed and the thermodynamic and technical correlations are clarified extensive‐
ly. Sophisticated process simulation models are developed and implemented for
the simulation of selected scenarios. The generated results are in turn the basis for
a performance assessment and an illustration of the operating behavior.
4.1 Basis CCIGCC configuration
The basis configuration for the investigated CC‐IGCC concepts includes the typical
components which are necessary to achieve approximately 90 % CO2‐capture by
using a hard coal fed gasification process.
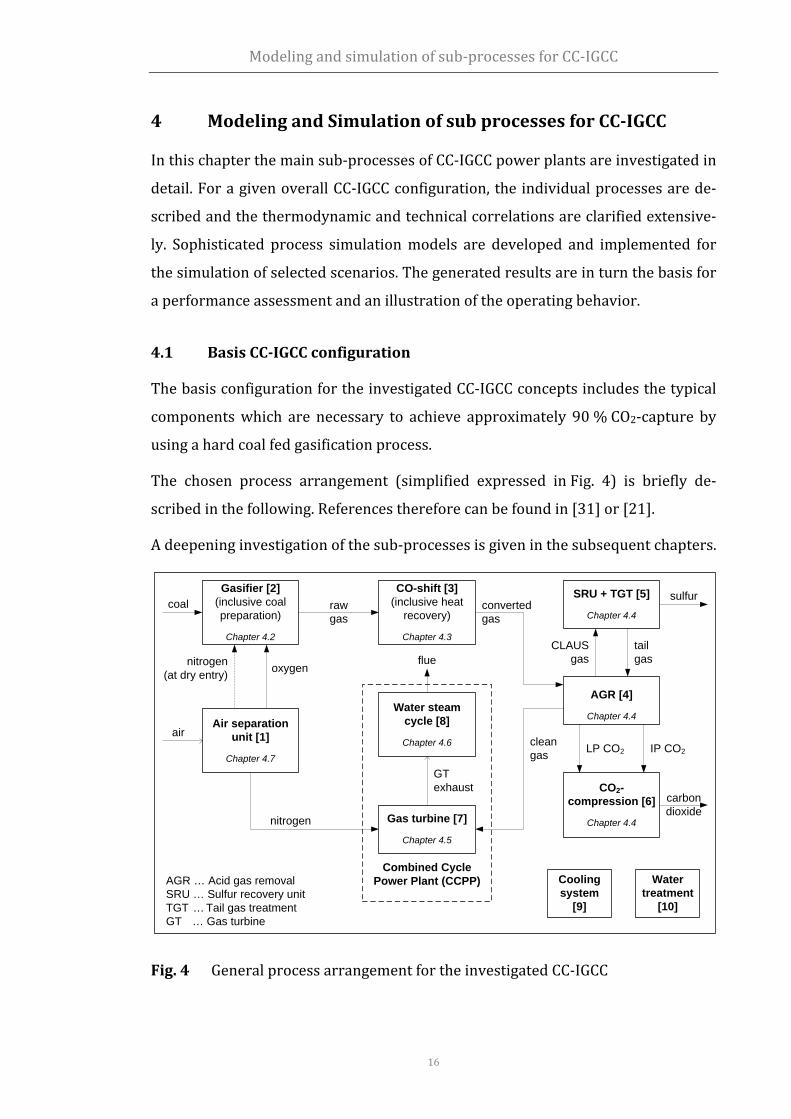
The chosen process arrangement (simplified expressed in Fig. 4) is briefly de‐
scribed in the following. References therefore can be found in [31] or [21].
A deepening investigation of the sub‐processes is given in the subsequent chapters.
Fig. 4 General process arrangement for the investigated CC‐IGCC
Gasifier [2](inclusive coal preparation)
Chapter 4.2
Air separation unit [1]
Chapter 4.7
coal
air
oxygen
rawgas
convertedgas
CO-shift [3](inclusive heat
recovery)
Chapter 4.3
sulfur
carbondioxide
AGR [4]
Chapter 4.4
nitrogen (at dry entry)
SRU + TGT [5]
Chapter 4.4
CLAUSgas
tailgas
cleangas
nitrogen
GTexhaust
flue
AGR … Acid gas removalSRU … Sulfur recovery unitTGT … Tail gas treatmentGT … Gas turbine
Cooling system
[9]
Water treatment
[10]
CO2-compression [6]
Chapter 4.4
LP CO2 IP CO2
Combined Cycle Power Plant (CCPP)
Water steam cycle [8]
Chapter 4.6
Gas turbine [7]
Chapter 4.5
Modeling and simulation of sub‐processes for CC‐IGCC
17
The individual concepts for the four different types of gasifiers somewhat differ
however the general layout displays a lot of similarities.
For the gasification processes with a dry entry system (SCGP and Siemens gasifier)
the coal feedstock is first grinded, dried and pneumatically pressurized while for
the remaining (GE‐R and CoP gasifier) a coal/water slurry is prepared and pressur‐
ized after coal pulverization. The individual coal gasification processes mainly dif‐
fer in matters of reactor cooling and raw gas cooling.
Downstream gasification, the generated raw gas enters the two stage (sour gas)
CO‐shift unit where the main part of the carbon monoxide is catalytic converted
with steam to carbon dioxide and hydrogen. As the concept with sour gas shift has
been found advantageous compared to the sweet shift concept [31], the former has
been chosen. A good portion of the released reaction heat is recovered for internal
use as for instance steam generation, quench water preheating or clean gas satura‐
tion. The CO‐shift cycles also vary depending on the gasification process as the
generated raw gases contain different amounts of steam.
Leaving the CO‐shift cycle, the converted gas enters the AGR which is a physical
absorption unit using methanol as solvent. Hence, the selected AGR‐system should
show similar characteristics as the industrial Rectisol® process. While the separat‐
ed CO2 is compressed to the desired pressure, the sulfur containing components
(mostly H2S and COS) are converted to elementary sulfur within the SRU. For sul‐
fur recovery the CLAUS‐process running on oxygen‐enriched air has been chosen.
The remaining tail gas is treated in the TGT‐unit and recycled back to the AGR.
The clean, dry and hydrogen‐rich gas escaping the AGR is then diluted with excess
nitrogen from the ASU and saturated with steam using low temperature heat from
the CO‐shift cycle. Nitrogen and steam dilution are necessary operational measures
in order to realize secure combustion in the gas turbine with low emissions of ni‐
trogen oxides (NOx).
Finally, the conditioned fuel gas is preheated within the water steam cycle of the
CCPP and burned in the gas turbine for electricity generation purposes. The gas
turbine exhaust is used for steam generation in the heat recovery steam generator
(HRSG) of the water steam cycle before it is discharged to the ambient. The gener‐
ated steam is used in a steam turbine for additional electricity production. Moreo‐
Modeling and simulation of sub‐processes for CC‐IGCC
18
ver, the water steam cycle of the CCPP usually features a couple of interfaces to
other sub‐processes as it operates for instance as heat source (e.g. for solvent re‐
generation within the AGR) or as a supplier of process streams (e.g. gasification
agent for the gasifier).
The ASU acts not directly within the process chain but supplies necessary process
media as gaseous oxygen (GOX) to the gasification process and to the SRU. Fur‐
thermore, it also delivers high pressure gaseous nitrogen (HP GAN) and low pres‐
sure gaseous nitrogen (LP GAN) for the pneumatic coal feeding system as well as
diluent gaseous nitrogen (DGAN) for dilution of the hydrogen rich fuel gas.
The cooling system and the water treatment section are not investigated in detail
but are considered for the sake of completeness.
According to Fig. 4 each subsystem has been numbered in order to advance clarity
for the interface configuration.
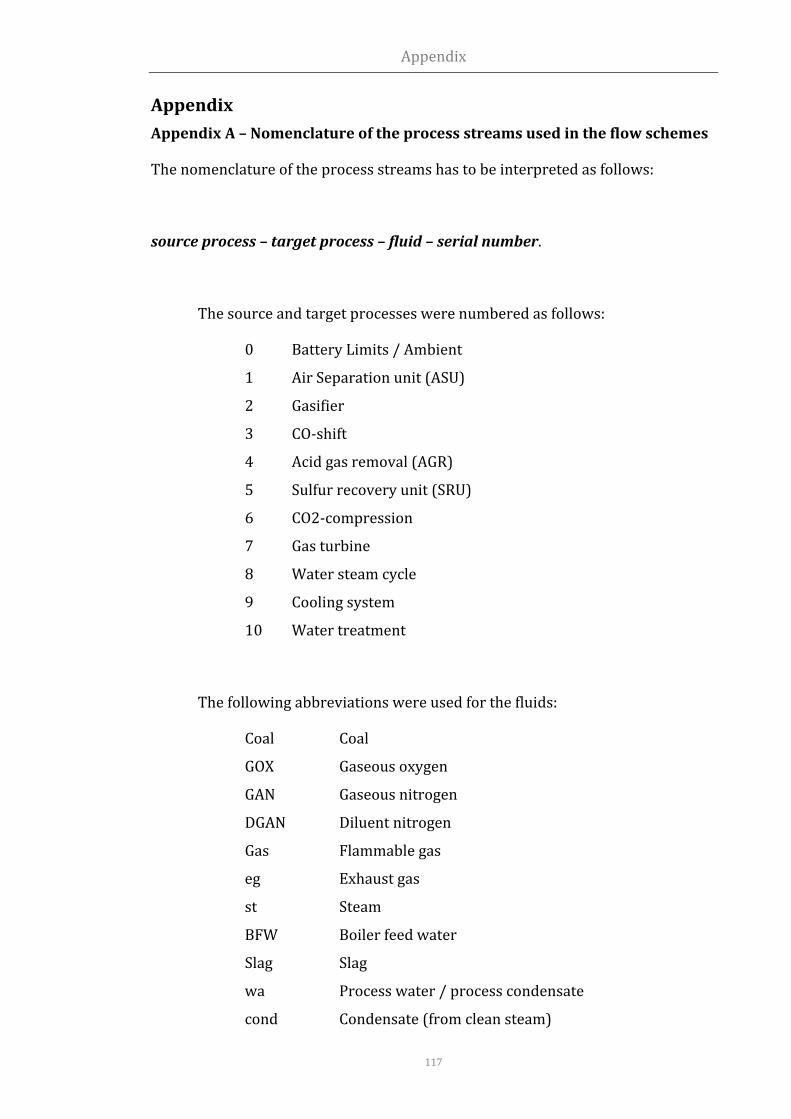
In anticipation of the flow schemes presented in the following chapters, the no‐
menclature for the process streams between the individual sub‐processes is ex‐
plained in Appendix A.
4.2 Coal gasification system
In the following, four types of industrial coal gasifiers (GE‐R, CoP gasifier, SCGP,
and Siemens gasifier) are investigated in detail. Simulation models for the individ‐
ual gasification processes are developed based on fundamental system descrip‐
tions. It should be mentioned that the presented process schemes and models do
not exactly reflect the industrial processes. A couple of assumptions and simplifica‐
tions have been defined in order to realize a comparative study.
More detailed information concerning the gasification systems can be found in [19;
22; 54] where especially the boundary conditions for process modeling and simu‐
lation are taken from.
Modeling and simulation of sub‐processes for CC‐IGCC
19
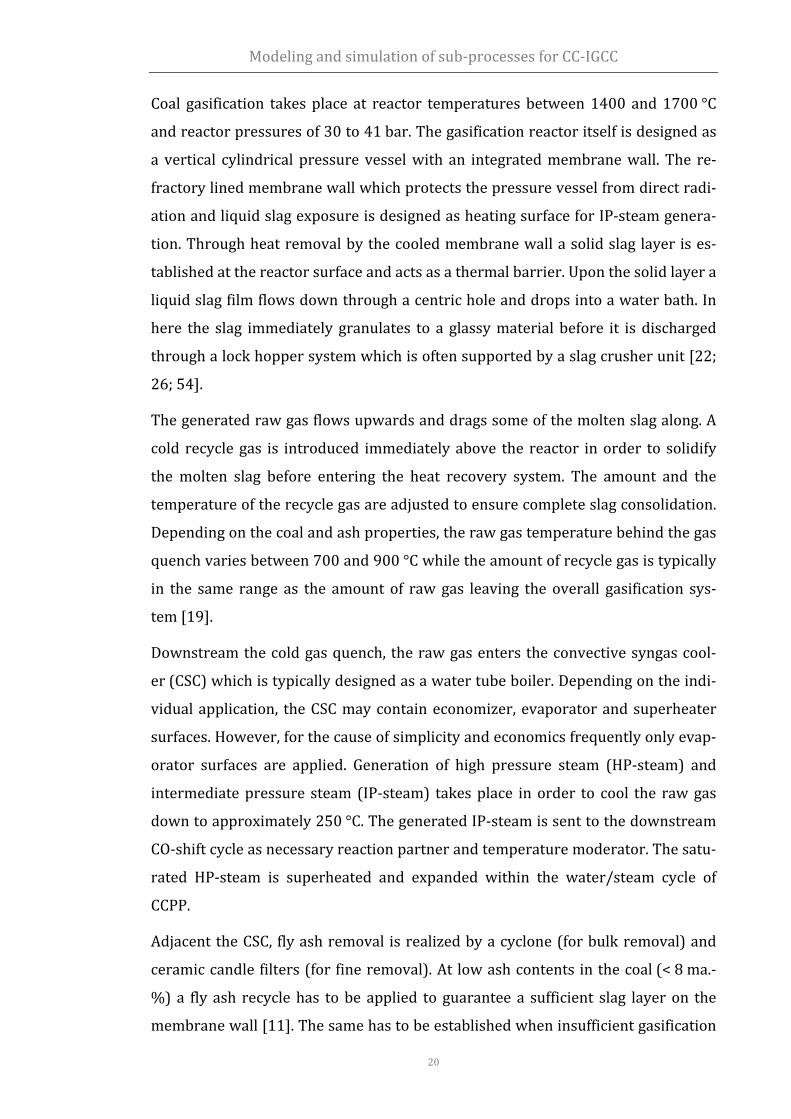
4.2.1 The Shell Coal Gasification Process
The Shell Coal Gasification Process (SCGP) and the very similar PRENFLO (Pressur‐
ized Entrained Flow) process are oxygen blown entrained flow gasification pro‐
cesses with a dry entry system. Between 2002 and 2008 both processes were joint‐
ly merchandized by Shell and Uhde as SCGP. At the moment, both processes are
again competing on the market [26].
As illustrated in Fig. 5 the SCGP can be described as follows: Raw coal is grinded
and dried before pressurization (typically with nitrogen) in a lock hopper system.
The gasification agents (GOX and steam) are introduced to the pressurized coal
close to the burner entry in the reactor. Usually four burners are applied in an op‐
posite arrangement in order to realize steady fuel supply and ignition as well as an
enhanced particle residence time through recirculation within the reactor [19].
Fig. 5 Process flow scheme of the SCGP according to [19; 22]
Modeling and simulation of sub‐processes for CC‐IGCC
20
Coal gasification takes place at reactor temperatures between 1400 and 1700 °C
and reactor pressures of 30 to 41 bar. The gasification reactor itself is designed as
a vertical cylindrical pressure vessel with an integrated membrane wall. The re‐
fractory lined membrane wall which protects the pressure vessel from direct radi‐
ation and liquid slag exposure is designed as heating surface for IP‐steam genera‐
tion. Through heat removal by the cooled membrane wall a solid slag layer is es‐
tablished at the reactor surface and acts as a thermal barrier. Upon the solid layer a
liquid slag film flows down through a centric hole and drops into a water bath. In
here the slag immediately granulates to a glassy material before it is discharged
through a lock hopper system which is often supported by a slag crusher unit [22;
26; 54].
The generated raw gas flows upwards and drags some of the molten slag along. A
cold recycle gas is introduced immediately above the reactor in order to solidify
the molten slag before entering the heat recovery system. The amount and the
temperature of the recycle gas are adjusted to ensure complete slag consolidation.
Depending on the coal and ash properties, the raw gas temperature behind the gas
quench varies between 700 and 900 °C while the amount of recycle gas is typically
in the same range as the amount of raw gas leaving the overall gasification sys‐
tem [19].
Downstream the cold gas quench, the raw gas enters the convective syngas cool‐
er (CSC) which is typically designed as a water tube boiler. Depending on the indi‐
vidual application, the CSC may contain economizer, evaporator and superheater
surfaces. However, for the cause of simplicity and economics frequently only evap‐
orator surfaces are applied. Generation of high pressure steam (HP‐steam) and
intermediate pressure steam (IP‐steam) takes place in order to cool the raw gas
down to approximately 250 °C. The generated IP‐steam is sent to the downstream
CO‐shift cycle as necessary reaction partner and temperature moderator. The satu‐
rated HP‐steam is superheated and expanded within the water/steam cycle of
CCPP.
Adjacent the CSC, fly ash removal is realized by a cyclone (for bulk removal) and
ceramic candle filters (for fine removal). At low ash contents in the coal (< 8 ma.‐
%) a fly ash recycle has to be applied to guarantee a sufficient slag layer on the
membrane wall [11]. The same has to be established when insufficient gasification
Modeling and simulation of sub‐processes for CC‐IGCC
21
enlarges the carbon content within the fly ash. Downstream fly ash removal, the
recycle gas for the gas quench is extracted and recompressed in the quench gas
fan. Final removal of soluble trace compounds as NH3, HCN or HCl is realized by a
water wash unit.
The produced raw gas normally consists mainly of carbon monoxide
(about 60 mol. %) and hydrogen (about 30 mol. %) and is virtually free of higher
hydrocarbons [22]. Typical for the SCGP are carbon conversion ratios of more than
98 % and cold gas efficiencies between 80 and 83 % whereby the two parameters
are defined as follows:
Carbon Conversion Ratio CCR 1 ‐ ncarbon,unconvertedncarbon, coal (1)
Cold Gas Efficiency m raw gas LHVraw gasm coal LHVcoal
(2)
The overall thermal efficiency which considers the chemical as well as the recov‐
ered thermal energy is specified to about 95 % where the appeared losses accord‐
ing to [54] are made up as follows:
- 0.8 to 2 % heat loss due to reactor wall losses and slag discharge,
- 0.2 to 1 % due to unconverted carbon,
- 2 % heat loss at the heat recovery steam generators.
Modeling and simulation of sub‐processes for CC‐IGCC
22
4.2.2 The Siemens gasifier
The Siemens gasifier was originally designed for salty brown coal under the name
GSP (Gaskombinat Schwarze Pumpe) process in East Germany in the 1980s. The
developed flow scheme for the subsequent process description is shown in Fig. 6.
Fig. 6 Process flow scheme of the Siemens gasifier according to [19; 54]
Such as the SCGP, the Siemens gasifier also features a dry coal entry system with a
milling and drying section and a pneumatic feeding system. In contrast to the SCGP,
the burners are placed at the top of the reactor so that the direction of flow is in‐
verted. Up to a thermal input of 500 MW one centrally arranged burner that com‐
bines the ignition and pilot flame with the coal dust nozzles is applied. At higher
thermal input rates a four‐burner‐design will be applied so that a central pilot and
ignition burner is surrounded by three coal dust nozzles arranged in a 120 ° offset
pattern [54].
LockHopper
Bunker
Feedervessel
LP GAN1-2-GAN-2
HP GAN1-2-GAN-1
Fuel gas4-2-gas-2
Raw coal0-2-coal-1
Coal milling and drying
Air0-2-air-1
Exhaust gas2-0-eg-1
Gaseous oxygen (GOX)1-2-GOX-1
IP steam 8-2-st-1
IP steam2-8-st-5
Gasifier
GOX Pre-heater
quench
Slag2-0-slag-1
Quench water3-2-wa-2
IP BFW8-2-BFW-1
Coolingscreen
Scrubber 1
Scrubber 2
Partialcondenser
Waste water2-10-ww-1
Make up water10-2-mu-1
LP BFW8-2-BFW-2
LP steam2-8-st-6
Raw gas2-3-gas-1
Modeling and simulation of sub‐processes for CC‐IGCC
23
The reactor itself is offered in two different designs: The reactor design with cool‐
ing screen similar to the membrane wall of the SCGP is applied for coals that con‐
tain a sufficient amount of mineral matter so that an adequate slag layer can be
established as thermal barrier at the cooling screen. In contrast, a refractory lined
reactor design is applied for feedstock with low mineral contents. The design with
a cooling screen is preferred whenever possible since it has demonstrated long
term successful operation at high availability rates [54]. Therefore, the refractory
design is not considered in the following since the observed feedstock contains a
sufficient amount of mineral matter.
Caused by the original design feedstock (salty brown coal) the application of a
convective syngas cooler was a priori excluded since salt deposits on the heating
surfaces would occur. Different water quench designs were investigated. Of these,
one configuration has proved reliable operation where the quench water nozzles
are annularly placed in one single or multiple levels. The quench area is completely
free of installed equipment in order to avoid fine slag disposal. The granulated slag
is discharged by a lock hopper system similar the SCGP [54]. The quench water is
supplied at a temperature of about 200 °C [21] in order to increase the steam con‐
tent within the quenched raw gas. The high steam content in turn is advantageous
since it avoids or reduces the steam demand for the downstream CO‐shift.
The saturated raw gas which leaves the quench section at temperatures between
170 and 240 °C is routed to a series of two Venturi scrubbers where soluble trace
compounds and fine particles are removed. Downstream the scrubbers a partial
condenser cools the raw gas by a few centigrade. Thereby the volatile salt particles
will be enclosed in the condensed vapor droplets before the raw gas leaves to the
downstream processes [54].
The operating conditions within the reaction chamber and the raw gas composi‐
tion at the outlet of the gasification zone are very similar to the SCGP. It has to be
mentioned, that the reaction chamber can be operated at approximately 50 K low‐
er temperature than at the SCGP (at the same boundary conditions). This differ‐
ence is due to the concurrent flow direction of gas and slag which compensates a
part of the heat losses.
Modeling and simulation of sub‐processes for CC‐IGCC
24
Due to the water quench a partial conversion of carbon monoxide and water to
hydrogen and carbon dioxide is reported by Schingnitz and Görz [53] so that the
final raw gas composition should be slightly different compared to the SCGP.
4.2.3 The ConocoPhillips gasifier
The ConocoPhillips (CoP) process is a two‐stage entrained flow gasifier where the
feedstock is introduced to the reactor as coal/water slurry. So far, the CoP technol‐
ogy has been realized only once in the Wabash River IGCC power plant (Indi‐
ana/USA). Compared to a dry entry system, the slurry feed is on the one hand
mainly beneficial through its less complexity (no lock hoppers and coal dryers) and
the unproblematic feedstock pressurization up to 80 bar [22; 54]. On the other
hand a higher oxygen demand has to be accepted compared to a dry entry system,
since the additional slurry water fraction has to be evaporated and heated up to
reactor temperature.
According to Fig. 7 the process can be described as follows: The raw coal is grinded
by the addition of water to the same particle size as necessary for pulverized coal
combustion power plants. The coal/water suspension features a coal fraction of
about 50 to 70 ma. %. In any case the lowest possible water content has to be as‐
pired in order to minimize the heat load necessary for water evaporation within
the reactor [54]. A slurry composition of about 65 ma. % coal and 35 ma. % water
counts as typical for the CoP gasifier. Originally a slurry split of 70 % to the first
stage and 30 % to the second stage was envisioned [19].
Modeling and simulation of sub‐processes for CC‐IGCC
25
Fig. 7 Process flow scheme of the CoP gasifier according to [22; 26; 63]
After pressurization by the slurry pump the suspension is indirectly preheated
with steam and fed together with oxygen to the first stage of the reactor. Here, the
partial oxidization takes place at temperatures between 1320 and 1500 °C consid‐
ering the ash melting behavior of the individual coal. The two burners are placed
within the horizontal cylindrical vessels in an opposite arrangement. The chosen
layout of the first stage enables efficient mixing of the reaction partners so that a
high carbon conversion can be realized [19; 26; 63].
The reactor itself is completely refractory lined and can be operated at pressures
up to 41 bar. The coal ash accumulates as liquid slag at the reactor wall of the first
stage and is continuously discharged (lock hopper free) after granulation in a wa‐
ter bath. Carbon particles which are discharged through the water bath are fed
back to the slurry preparation after sedimentation [26; 63].
At the second stage of the reactor the remaining coal/water slurry (without oxy‐
gen) is brought into the upwards flowing hot raw gas. Through water evaporation
and endothermic reactions the raw gas cools down to about 1000 to 1050 °C. The
second stage therefore acts as a so called chemical quench which is a unique fea‐
ture of the CoP gasifier. Due to the chemical quench the generated raw gas contains
unconverted carbon and ash. The amount of unconverted carbon increases with a
Modeling and simulation of sub‐processes for CC‐IGCC
26
decreasing coal reactivity. Therefore the actual slurry split ratio of 70/30 % has
been changed to 80/20 % since the CoP gasifier at the Wabash River IGCC is oper‐
ated on low reactive petrol coke. A higher feed ratio to the second stage would in
fact require an additional cyclone in front of the convective syngas cooler
(CSC) [19].
To ensure the desired quench effect the raw gas passes a residence vessel down‐
stream the reactor [19]. Thereafter the particle loaded gas is cooled down to about
350 to 400 °C in the CSC which is designed as a vertical fire tube boiler. The gener‐
ated saturated HP‐steam is sent to the CCPP for steam superheating and expansion.
Downstream the CSC, final dust removal takes place in cyclone and candle filters
achieving separation ratios of 99.9. The separated carbon and fly ash is pneumati‐
cally recycled (with nitrogen or syngas) to the first stage slurry [22; 26; 63]. The
almost dust free raw gas is further cooled down in a low temperature heat recov‐
ery section for low pressure steam (LP‐steam) generation. The generated LP‐steam
is also routed to the CCPP for superheating and expansion. Downstream the LP‐
CSC approximately 20 % of the raw gas are recycled back to the second stage of the
gasification reactor to adjust the desired temperature. The remaining raw gas is
finally directed to a water wash for removal of soluble trace compounds [46].
Due to the slurry entry and the chemical quench the raw gas might contain consid‐
erable amounts of the undesirable components carbon dioxide (about 16 mol. %)
and methane (about 4.5 mol. %), respectively [46]. On the other hand, these disad‐
vantages are partly compensated by an improved oxygen consumption and cold
gas efficiency. In fact, the cold gas efficiency is specified to values between 70 and
80 %. Further enhancement can be achieved through an increased slurry feed ratio
to the second stage as described and analyzed by Gräbner [19].
Modeling and simulation of sub‐processes for CC‐IGCC
27
4.2.4 The General Electric coal gasifier
The General Electric coal gasification process is characterized by a completely re‐
fractory lined entrained flow reactor where the feedstock is handled as coal/water
slurry. In general, GE offers three technologies which mainly differ in methods of
raw gas cooling:
- The GE gasifier with a full water quench (GE‐Q)
- The GE gasifier with a radiant and a convective syngas cooler (GE‐RC)
- The GE gasifier with a radiant cooler and a water quench (GE‐R)
The latter one combines the reliable water quench with a highly efficient heat re‐
covery so that an acceptable performance penalty and a superior availability
(compared to the GE‐RC layout) shall be achieved. Therewith it is expected to
overcome the problems with fly ash deposits in the convective coolers as observed
at the GE‐RC in the Tampa Electric Polk Power Station IGCC [28].
In fact, the GE‐R is the chosen technology for the Edwardsport IGCC which was
supposed to start commercial operation in 2012 [66]. For this reason, the technol‐
ogy with radiant cooler and water quench is exclusively pursued within this thesis
for process description as well as for modeling and simulation of the GE gasifier.
According to Fig. 8 the GE‐R technology can be described as follows:
The slurry preparation proceeds in an analog manner as at the CoP technology
with a specified solid fraction of about 65 to 74 % [54].
Modeling and simulation of sub‐processes for CC‐IGCC
28
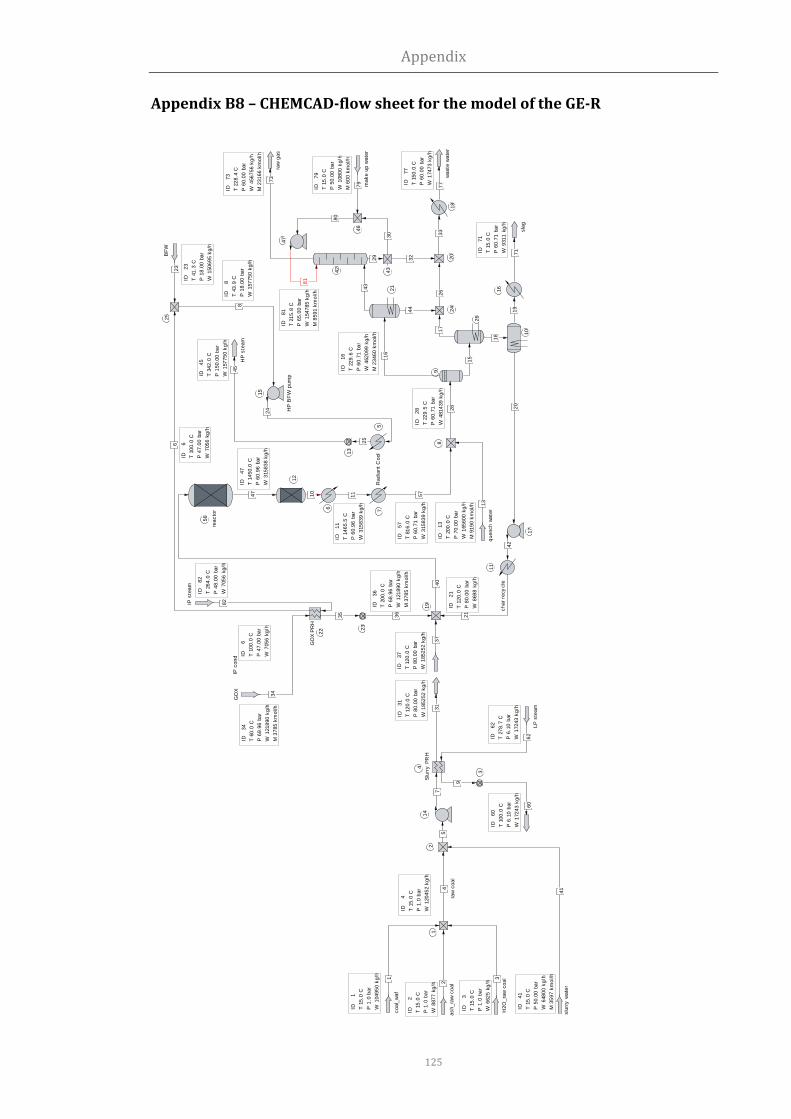
Fig. 8 Process flow scheme of the GE‐R according to [22; 26; 54]
After preheating, the slurry suspension and gaseous oxygen are introduced at the
top of the reactor so that a downward flow direction is set up. The molten slag ac‐
cumulates at the reactor wall and drops down in a water bath which is placed un‐
derneath the radiant cooler (RC). The duct between the reactor and the RC is de‐
signed in a way that a contact between molten slag and the heating surfaces of the
RC is avoided.
As the hot raw gas still contains sticky and corrosive slag droplets it has to be
cooled down in the RC to a temperature at which the slag loses its adhesive charac‐
ter [54]. Intermediate pressure boiler feed water (BFW) extracted from the CCPP is
pressurized and fed to the RC where saturated HP‐steam is generated through heat
exchange with the hot raw gas. Downstream the RC the raw gas is quenched until
complete saturation using preheated quench water.
Slurrytank
Raw coal0-2-coal-1
Gaseous oxygen (GOX)1-2-GOX-1
Gasifier
Slag2-0-slag-1
Quench water3-2-wa-2
HP steam2-8-st-4
Scrubber
Make up water10-2-mu-1
Raw gas2-3-gas-1
Coal milling andslurry preparation
Slurry water10-2-wa-1
Slurrypreheater
LP steam8-2-st-2
Condensate2-8-cond-1
Radiantcooler
quench
Lockhopper
Slagscreen
Clarifier
Waste water2-10-ww-1
Solids recycle
GOX Pre-heater
IP steam8-2-st-3
BFWpump
BFW8-2-BFW-5
Refractory
Modeling and simulation of sub‐processes for CC‐IGCC
29
As reported by Gräbner [19] only partial carbon conversion of about 90 % per cy‐
cle can be achieved at the given boundary conditions. Therefore the unconverted
carbon has to be separated from the granulated slag and then fed back to the slurry
tank. Thus, an overall carbon conversion ratio similar to the other discussed gasifi‐
cation processes can be achieved.
Finally, the raw gas is routed to a scrubber unit for the removal of soluble trace
components and fine particles before it leaves the gasification unit to the CO‐shift.
Due to the slurry entry the generated raw gas contains considerable amounts of
carbon dioxide. This fact and the low carbon conversion are the reasons for a rela‐
tively low cold gas efficiency which is expected in the lower 70 % area [19].
4.2.5 Modeling and Simulation of the gasification processes
A typical world market coal was selected as feedstock for the comparative investi‐
gation. Table 3 shows the appropriate coal analysis.
Table 3 Coal analysis (retrieved from [37])
Parameter Unit Value Parameter Unit Value
Proximate analysis
Fixed carbon ma. % 50.15 Moisture ma. % 5.50
Volatile mat‐ter
ma. % 36.98 Ash ma. % 7.37
Ultimate analysis
C ma. % 72.35 Cl ma. % 0.05
H ma. % 4.97 S ma. % 2.84
O ma. % 5.56 Moisture ma. % 5.50
N ma. % 1.36 Ash ma. % 7.37
Heating value (according to DULONG)
LHV MJ/kg 29.888 HHV MJ/kg 31.107
Modeling and simulation of sub‐processes for CC‐IGCC
30
The process simulation models were developed according to the above discussed
process schemes and descriptions.
The characteristic parameters for the coal preparation and feeding process as well
as the electrical auxiliary load strongly depend on the properties of the individual
feed stock and the chosen systems and machineries. Since this approach demands
a lot of manufacturer know‐how and experiences, it was decided to use literature
data in order to receive the same basis for the process evaluation. Table 4 shows
the corresponding parameters and their related literature sources.
Table 4 Specific parameters for the coal preparation and feeding process
Modeling and simulation of sub‐processes for CC‐IGCC
55
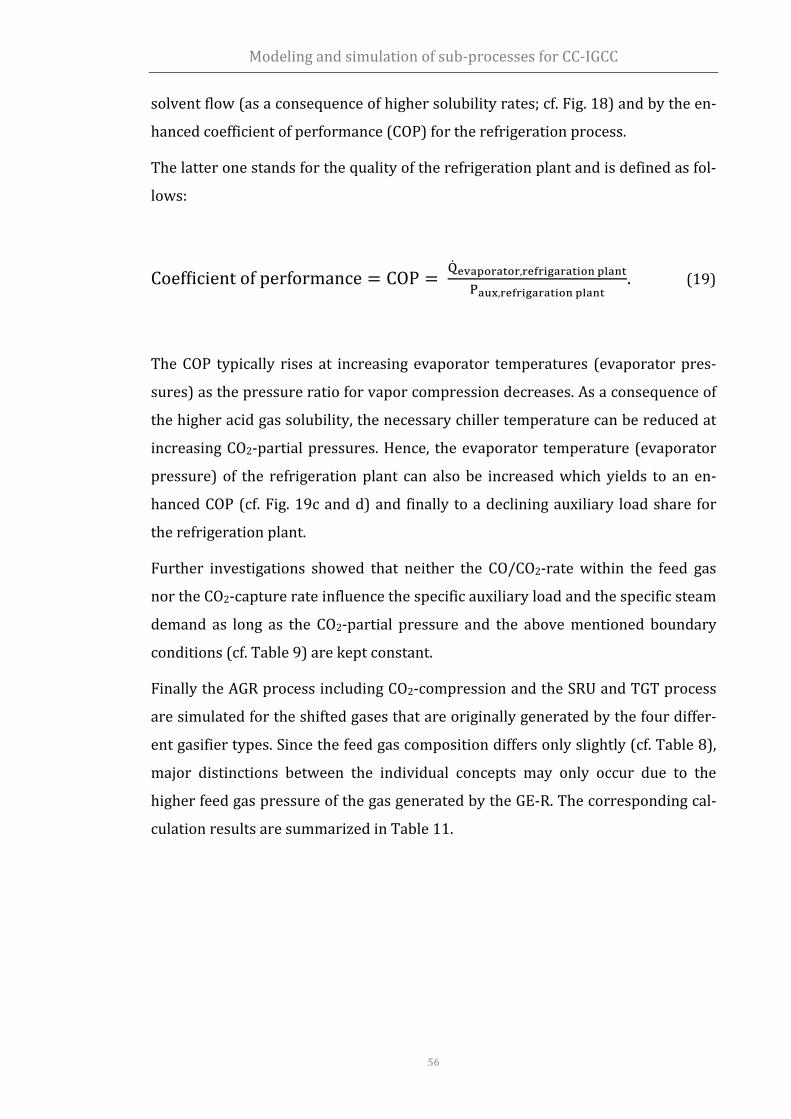
The calculation results for the partial pressure study visualized in Fig. 19a and b
show an increase of the specific auxiliary load consumption and the specific steam
demand at falling CO2‐partial pressures in the feed gas.
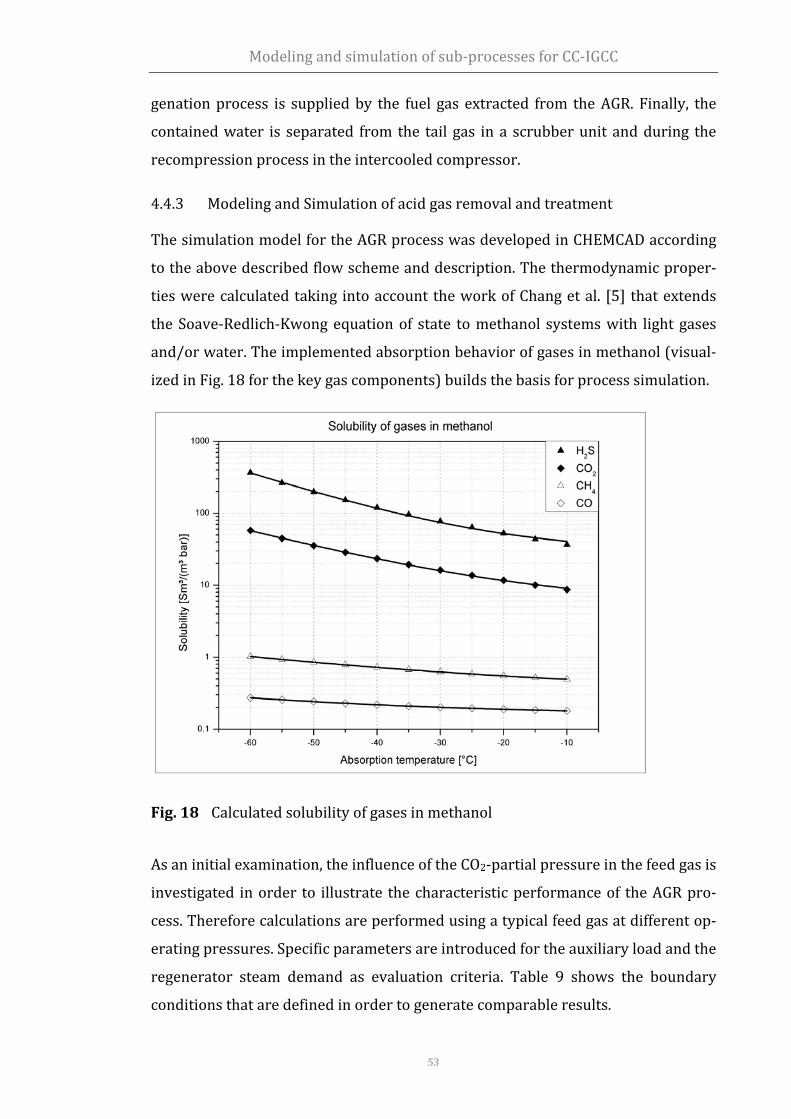
Fig. 19 Characteristics of the acid gas removal unit
The curve progression for these parameters can be well expressed by a power
function so that the results are in good agreement with the information provided
by Prelipceanu et al. [51] for an industrial Rectisol® process.
In addition, Fig. 19a shows that the auxiliary load fraction caused by the refrigera‐
tion plant decreases at higher CO2‐partial pressures. This is caused by a reduced
Modeling and simulation of sub‐processes for CC‐IGCC
56
solvent flow (as a consequence of higher solubility rates; cf. Fig. 18) and by the en‐
hanced coefficient of performance (COP) for the refrigeration process.
The latter one stands for the quality of the refrigeration plant and is defined as fol‐
lows:
Coefficient of performance COP Q ,
P , . (19)
The COP typically rises at increasing evaporator temperatures (evaporator pres‐
sures) as the pressure ratio for vapor compression decreases. As a consequence of
the higher acid gas solubility, the necessary chiller temperature can be reduced at
increasing CO2‐partial pressures. Hence, the evaporator temperature (evaporator
pressure) of the refrigeration plant can also be increased which yields to an en‐
hanced COP (cf. Fig. 19c and d) and finally to a declining auxiliary load share for
the refrigeration plant.
Further investigations showed that neither the CO/CO2‐rate within the feed gas
nor the CO2‐capture rate influence the specific auxiliary load and the specific steam
demand as long as the CO2‐partial pressure and the above mentioned boundary
conditions (cf. Table 9) are kept constant.
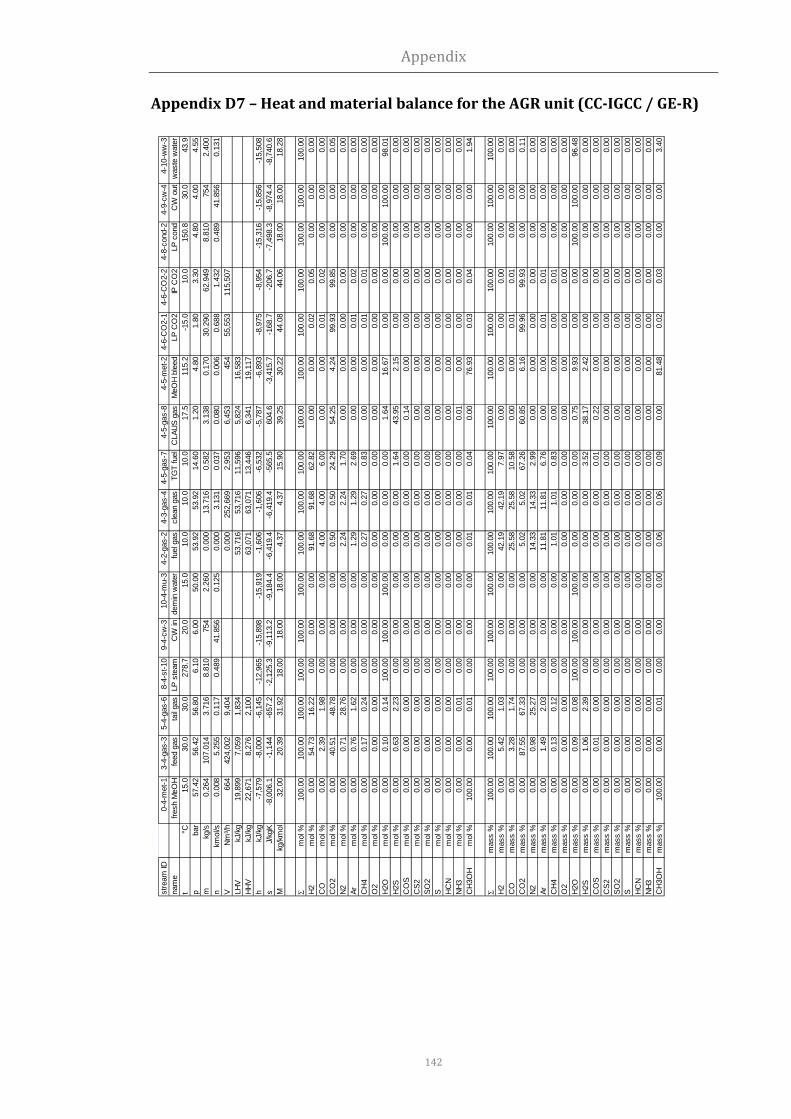
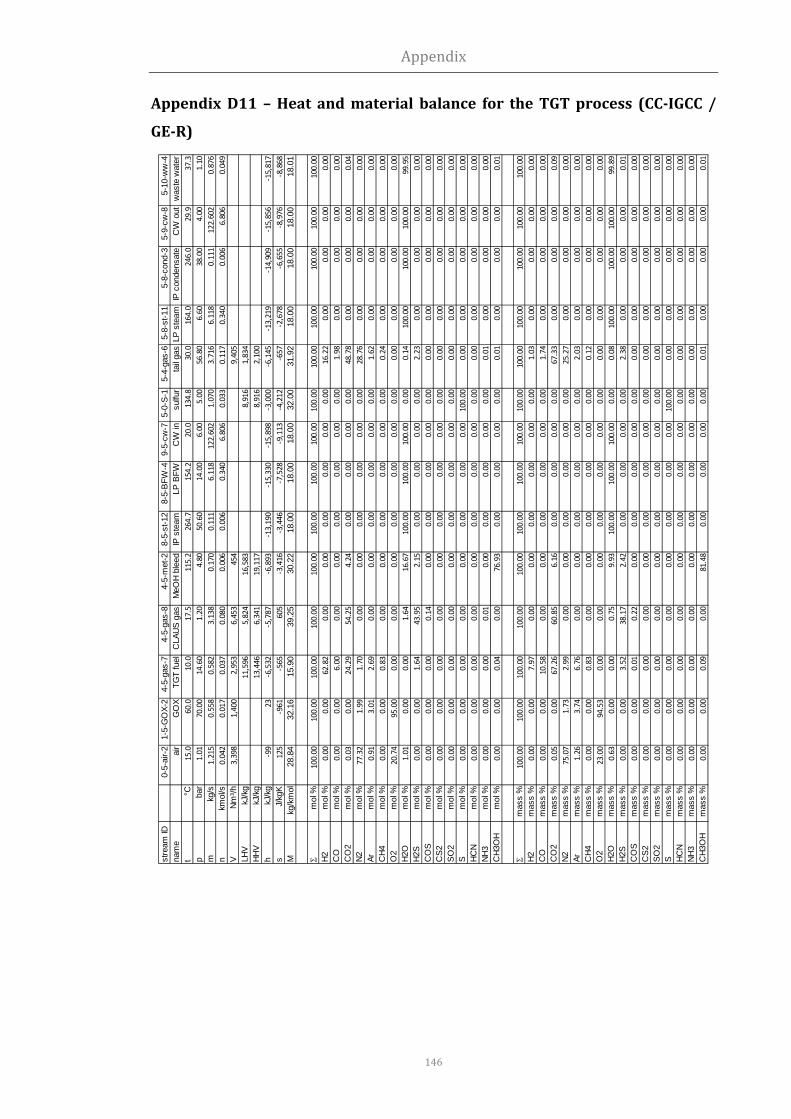
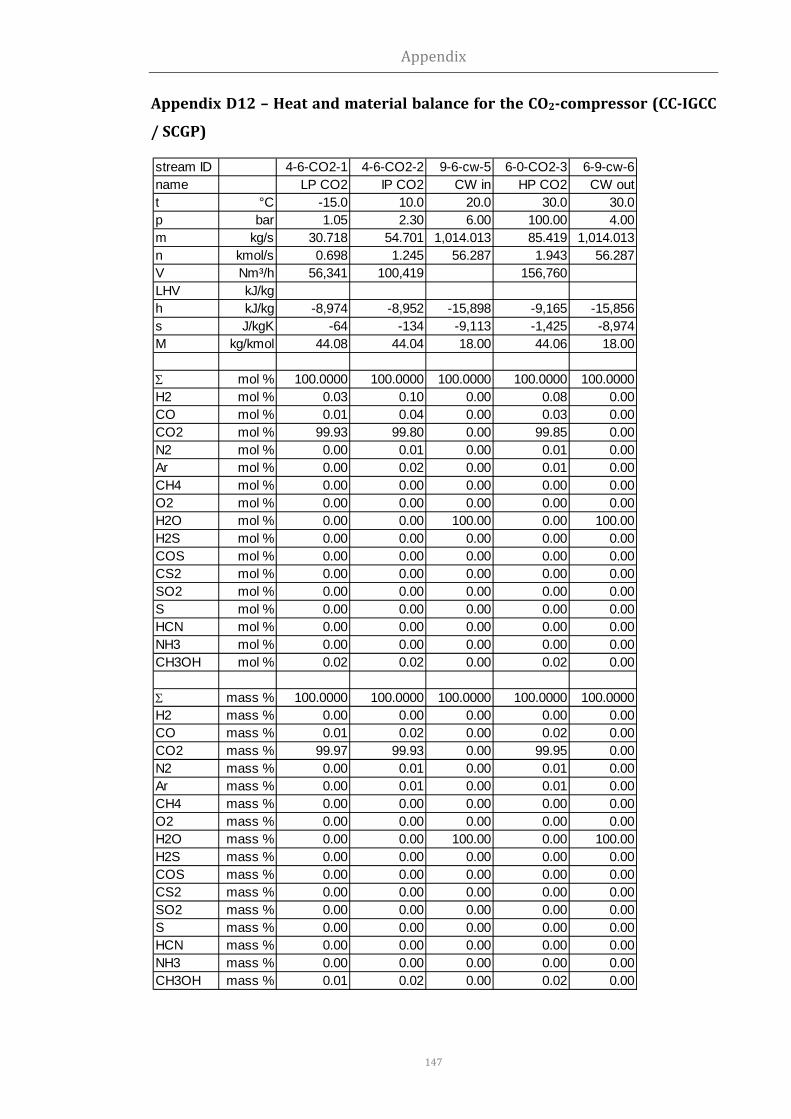
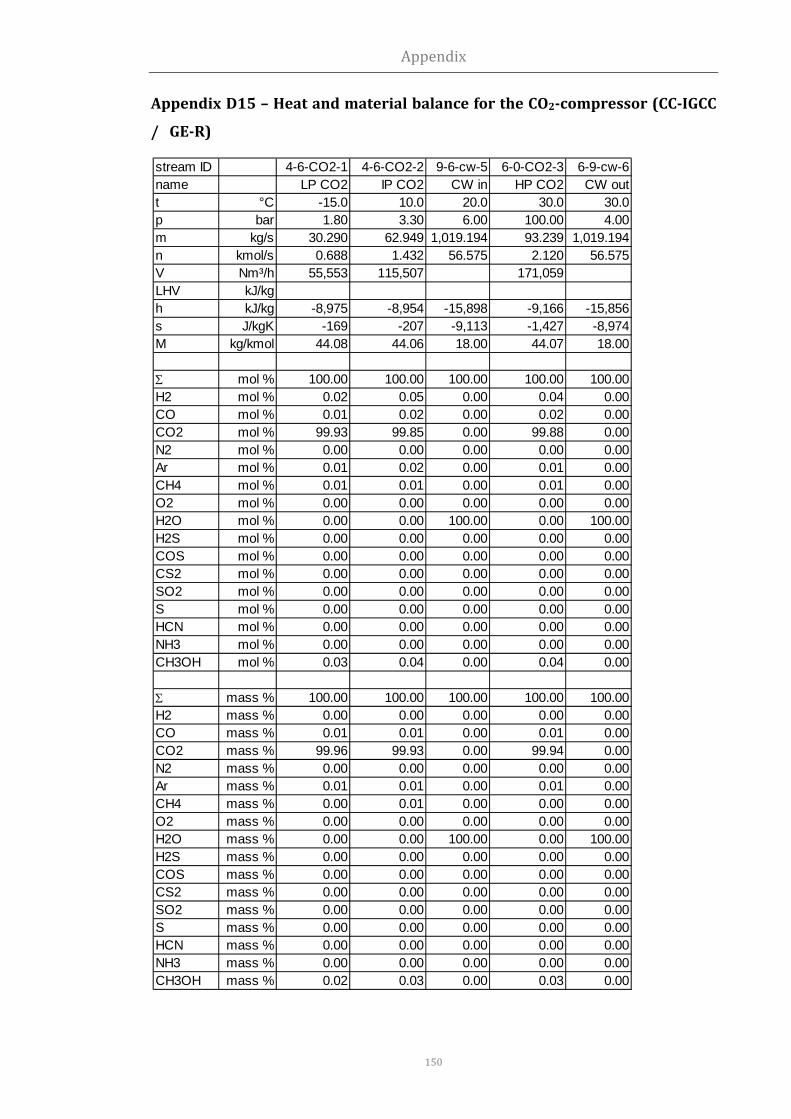
Finally the AGR process including CO2‐compression and the SRU and TGT process
are simulated for the shifted gases that are originally generated by the four differ‐
ent gasifier types. Since the feed gas composition differs only slightly (cf. Table 8),
major distinctions between the individual concepts may only occur due to the
higher feed gas pressure of the gas generated by the GE‐R. The corresponding cal‐
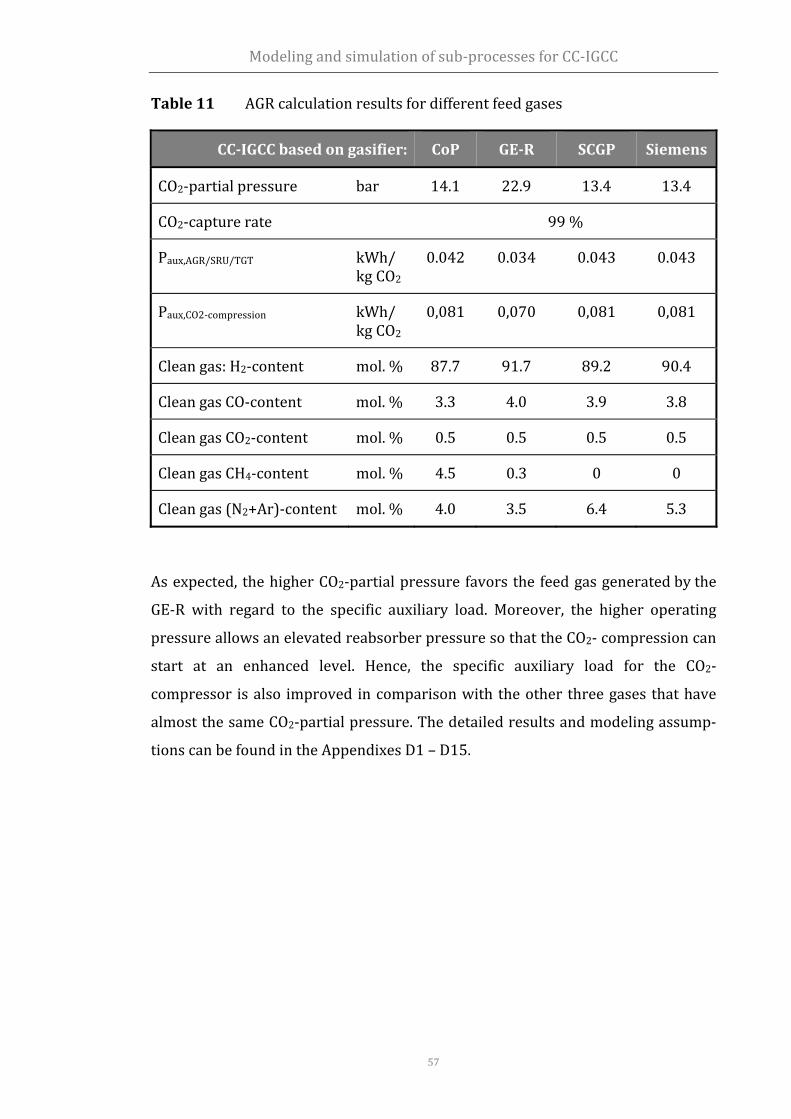
culation results are summarized in Table 11.
Modeling and simulation of sub‐processes for CC‐IGCC
57
Table 11 AGR calculation results for different feed gases
CCIGCC based on gasifier: CoP GER SCGP Siemens
CO2‐partial pressure bar 14.1 22.9 13.4 13.4
CO2‐capture rate 99 %
Paux,AGR/SRU/TGT kWh/ kg CO2
0.042 0.034 0.043 0.043
Paux,CO2‐compression kWh/ kg CO2
0,081 0,070 0,081 0,081
Clean gas: H2‐content mol. % 87.7 91.7 89.2 90.4
Clean gas CO‐content mol. % 3.3 4.0 3.9 3.8
Clean gas CO2‐content mol. % 0.5 0.5 0.5 0.5
Clean gas CH4‐content mol. % 4.5 0.3 0 0
Clean gas (N2+Ar)‐content mol. % 4.0 3.5 6.4 5.3
As expected, the higher CO2‐partial pressure favors the feed gas generated by the
GE‐R with regard to the specific auxiliary load. Moreover, the higher operating
pressure allows an elevated reabsorber pressure so that the CO2‐ compression can
start at an enhanced level. Hence, the specific auxiliary load for the CO2‐
compressor is also improved in comparison with the other three gases that have
almost the same CO2‐partial pressure. The detailed results and modeling assump‐
tions can be found in the Appendixes D1 – D15.
Modeling and simulation of sub‐processes for CC‐IGCC
58
4.5 Gas turbine
The lion’s share of electric power production in a CC‐IGCC is realized by the gas
turbine as part of the combined cycle power plant. The gas turbine process itself
can be expressed by the Joule‐ or Brayton‐cycle. The thermodynamic fundamentals
are commonly known and described (e.g. [40]) so that they are not reiterated here‐
in.
A hydrogen‐rich gas as it is generated in a CC‐IGCC has a much smaller volumetric
calorific value and a much lower density than natural gas for which power plant
gas turbines are designed for. Therefore, the combustion is characterized by signif‐
icantly higher stoichiometric flame temperatures and a much higher risk of pre‐
ignition and flashback. Hence, the NOx emissions will exceed the natural gas values
and the increased volumetric fuel flow rate will require modifications at the gas
turbine fuel handling system. Operational measures as fuel gas dilution (with
steam and/or nitrogen from the ASU) reduce the adiabatic flame temperature (and
hence the NOx emissions) as well as the flame speed and consequently also the risk
of pre‐ignition and flashback [57].
On the other hand, fuel gas dilution yields to a mass flow mismatch between the
compressor and the turbine section. Consequently, the gas turbine power output
will increase (and may reach the mechanical limit) and compressor surge prob‐
lems can occur (caused by the enlarged pressure ratio). As a result, compressor
mass flow reduction realized by the variable inlet guide vanes and/or air extrac‐
tion for the ASU may avoid these problems [57].
The presented investigations focus on the challenges that arise when a common
power plant gas turbine is fired with hydrogen‐rich fuel instead of natural gas.
Therefore, a generic gas turbine simulation model was developed and used to
study the influence of different boundary conditions to gas turbine performance
and operation.
Modeling and simulation of sub‐processes for CC‐IGCC
59
4.5.1 Modeling of the gas turbine process
Reliable gas turbine performance calculations require the consideration of turbine
and combustion chamber cooling as well as the limitations that are caused by this.
The generic gas turbine program is based on a turbine cooling model presented by
Horlock et al. [27] and developed in CHEMCAD. The thermodynamic properties are
calculated using the Soave‐Redlich‐Kwong equation of state.
As indicated in Fig. 20, gas turbine cooling is considered so that the required cool‐
ing air flow is completely extracted after the last compressor stage and introduced
to the hot gas in front of the first turbine vane. This simplification is commonly
accepted and yields to the standardized turbine inlet temperature (TIT; T9 in Fig.
20) [32] which is the decisive factor for the gas turbines level of technology.
Fig. 20 Flow scheme for the gas turbine in a CC‐IGCC
Modeling and simulation of sub‐processes for CC‐IGCC
60
The applied cooling model uses a semi‐empirical formula for an estimation of the
required cooling air fraction to avoid turbine material overheating. The derivation
of this equation is extensively described by Horlock et al. [27].Therein two essen‐
tial effects of turbine cooling are carried out:
- The reduction of gas stagnation temperature at the entry to the first turbine row
and
- A pressure loss resulting from mixing the cooling air to the hot gas.
The aerodynamic losses that are expressed by the latter one yield to a degradation
of the polytropic expansion efficiency in contrast to a not cooled turbine.
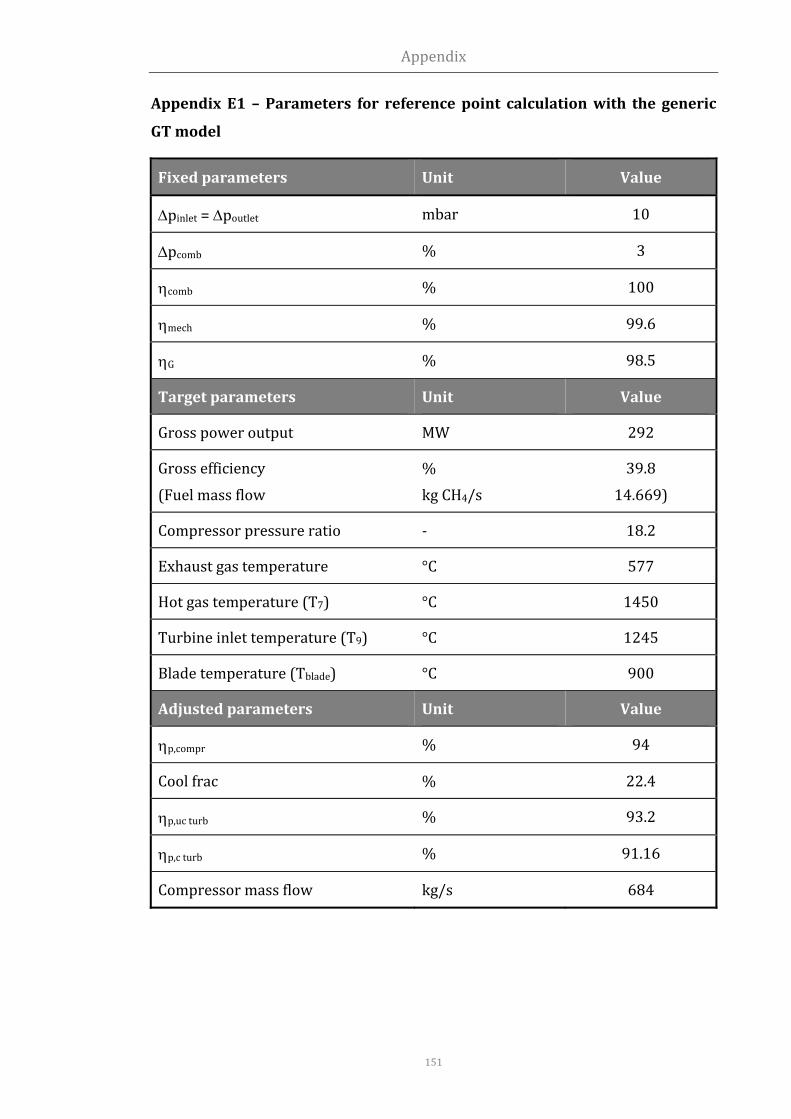
Jonsson et al. [33] presented an application of the mentioned cooling model to a
commercially available gas turbine for the purpose of performance predictions for
novel cycles. The developed generic model is based on the therein described ap‐
proach. Specific modeling parameters have been adjusted so that the calculated gas
turbine performance matches with published performance data [56] for the Sie‐
mens gas turbine SGT5‐4000F. Detailed information for this reference point calcu‐
lation with natural gas fuel can be found in Appendix E1.
In contrast to Jonsson et al. [33], the gas turbine model shall not be used for design
point calculations but for off‐design calculations with hydrogen‐rich fuel. There‐
fore the model has to be extended so that the turbines swallowing capacity, which
affects the inlet pressure to the turbine section at non‐design conditions, can be
reproduced. According to Traupel [59], the turbine inlet pressure for a fixed gas
turbine only depends on the particular turbine mass flow and the turbine inlet
temperature so that the following equation can be applied:
p9 m9m9,ref
T9T9,ref
1‐πturb,ref2
1‐πturb2 p9,ref (20)
The reference parameters correspond to the natural gas reference case discussed
above. They are summarized in Appendix E2.
Modeling and simulation of sub‐processes for CC‐IGCC
61
The available cooling air flow is fixed by the turbine design (reference). Hence, the
cooling air fraction only depends on the compressor end pressure and the losses in
the cooling air ducts. Pardemann [50] therefore suggests and verifies a simplified
method to estimate the cooling air flow for off design calculations as follows:
m8 ∆pcomb∆pcomb,ref
m8,ref (21)
Implementing these correlations qualifies the generic model for off‐design perfor‐
mance calculations and for blade temperature predictions.
4.5.2 Gas turbine process simulation
As mentioned above, fuel gas dilution and compressor air extraction are most like‐
ly necessary in a CC‐IGCC because of the difficulties of hydrogen combustion.
Hence, the generic model is used in a first step to investigate the principle behavior
of some crucial gas turbine parameters at different fuel gas dilution and compres‐
sor air extraction rates. In this context, the blade temperature, the gas turbine
power output and the compressor pressure ratio have been calculated at different
turbine inlet temperatures.
Fig. 21 shows the relative deviation of these parameters from the reference values
at natural gas operation for four different compressor air extraction rates. The
compressor inlet flow has been kept constant at the reference value to suppose full
load operation. The calculations are performed with the purified fuel gas originally
generated by the Siemens gasifier (cf. Table 8) assuming steam (maximum
10 mol. %) and nitrogen dilution in order to adjust a fuel gas hydrogen content
between 45 and 90 mol. %.
Modeling and simulation of sub‐processes for CC‐IGCC
62
Fig. 21 Influence of fuel gas dilution and air extraction on gas turbine operation
at constant compressor flow
Considering the results presented in Fig. 21 the following can be noticed: - For a constant TIT, the blade temperature, the compressor pressure ratio and
the gas turbine power output increase at rising fuel gas dilution rates (decreas‐
ing fuel gas hydrogen content).
- Without compressor air extraction and TIT‐reduction, the aforementioned gas
turbine parameters are significantly higher than at reference conditions (natu‐
ral gas fuel).
Modeling and simulation of sub‐processes for CC‐IGCC
63
- Without compressor air extraction, the TIT has to be drastically reduced in or‐
der not to exceed the reference values. For clarification refer to Fig. 21a – as‐
suming a possible fuel gas hydrogen content of 67 mol. %:
o The TIT has to be reduced by about 18 K in order not to exceed the refer‐
ence blade temperature (point A),
o the TIT has to be reduced by about 39 K in order not to exceed the reference
compressor pressure ratio (point B),
o the TIT has to be reduced by about 90 K in order not to exceed the reference
gas turbine power output (point C),
- Compressor air extraction reduces the necessary TIT‐reduction to reach the
same values for compressor pressure ratio, power output and blade tempera‐
ture as at reference conditions.
The observed behavior is a consequence of the increased hot gas flow through the
turbine section in comparison to the natural gas reference case. The enlarged hot
gas flow yields to an increase of the compressor pressure ratio, the gas turbine
power output and the blade temperature. The increase of the blade temperature is
a consequence of the almost unchanged cooling air flow in relation to the design
(reference) value. As mentioned above, the cooling air flow is limited through the
turbine design. An increased hot gas flow and an unchanged cooling air flow inevi‐
tably involve an increase of the blade temperature.
Concluding it can be stated that the IGCC‐performance would suffer from the tre‐
mendous TIT‐reduction that is necessary when the gas turbine is operated accord‐
ing to the assumed principle.
For this reason, compressor mass flow reduction is identified as an additional op‐
erational measure. In this way, the hot gas flow through the turbine section is re‐
duced so that the crucial gas turbine parameters can be kept at an acceptable level.
As indicated above, compressor flow control can be technically realized by the var‐
iable inlet guide vane at the entry of the compressor.
Assuming the same boundary conditions, the influence of fuel gas dilution and air
extraction on gas turbine operation is investigated again but now considering the
compressor part load, too. The compressor mass flow is chosen to control the gas
turbine power output so that the reference value may not be exceeded. The hot gas
temperature (T7 in Fig. 20) that can be adjusted via the individual fuel mass flow
Modeling and simulation of sub‐processes for CC‐IGCC
64
also acts as a variable but for blade temperature control and TIT control. For all
three temperatures the maximum is defined at the reference value (natural gas).
Fig. 22 illustrates the corresponding results.
Fig. 22 Influence of fuel gas dilution and air extraction on gas turbine operation
at controlled compressor flow
Modeling and simulation of sub‐processes for CC‐IGCC
65
As shown, the compressor has to be operated in part load for the complete possi‐
ble fuel gas hydrogen range when air extraction is not applied and the gas turbine
power output must not exceed the reference value. Due to the reduced hot gas
flow, the blade temperature and the TIT are always below the reference value alt‐
hough the hot gas temperature is kept at the maximum.
In the case of 84 000 Sm³ extraction air, the compressor mass flow has to be re‐
duced for power output control at fuel gas hydrogen contents below 79 mol. %.
Additionally, the hot gas temperature has to be derated at this corner point to
avoid a higher blade temperature as at reference conditions. Below this hydrogen
content, the hot gas temperature can be kept at the maximum as the blade temper‐
ature and the TIT stay below the reference. This behavior is also caused by the de‐
creasing hot gas flow.
The behavior at the other two air extraction rates is similar to the latter one with
the difference that the compressor flow has to be reduced only at fuel gas hydro‐
gen contents below 62 mol. % (at 168 000 Sm³/h extraction air) and 51 mol. % (at
252 000 Sm³/h extraction air), respectively. For both cases, the hot gas tempera‐
ture has to be derated at the individual corner point by about 6 K in order to keep
the blade temperature within the limit. Furthermore, a slight hot gas temperature
reduction is necessary within the corner point area to avoid a higher TIT as at ref‐
erence conditions.
In general it can be noticed, that the highest blade temperature is achieved at that
fuel gas hydrogen content where the gas turbines mechanical limit is reached and
its compressor is barely operated at full load flow. The highest TIT is also obtained
within the area of this corner point and its maximum shifts with decreasing air
extraction rates to higher hydrogen contents. The gas turbine efficiency is not illus‐
trated as it makes only sense to consider it in one context with the ASU auxiliary
load. Nevertheless, the range where a high TIT is achieved indicates an optimal gas
turbine performance. The influence to the overall IGCC performance will be clari‐
fied in one of the subsequent chapters.
In a continuative investigation, the gas turbine model and the generated findings
are used to carry on the comparison of the IGCC cycles that are based on the four
different gasifier types.
Modeling and simulation of sub‐processes for CC‐IGCC
66
Therefore the individual gases are conditioned so that a fuel gas hydrogen content
of 45 mol. % is adjusted (described in previous chapters). Nowadays this value
represents the upper limit for the fuel gas hydrogen content of advanced power
plant gas turbines (cf. Gräbner [21] and Smith [57]).
Gas turbine operation is simulated considering compressor air extraction of
252 000 Sm³/h for all cases.
Same as above, the compressor mass flow and the hot gas temperature are used to
control the power output and the TIT, respectively so that the reference values are
reached (power output) or not exceeded (temperatures).
Table 12 summarizes some calculation results.
The complete heat and material balances as well as the CHEMCAD flow schemes
can be found in Appendixes E3 to E7.
Table 12 Gas turbine calculation results for different fuel gases
Parameter Unit CoP GER SCGP Siemens
Δmcompressor % 99 94 94 94
ΔThot gas K ‐3 0 0 0
ΔTIT K 0 0 ‐1 ‐1
ΔTblade K 0 ‐3 ‐4 ‐4
As it can be seen, gas turbine operation is very similar for all of the investigated
concepts. The sole noticeable difference is observed at the CoP case where the
compressor mass flow has to be derated only by about one percent compared to
the reference value (instead of 6 % at the other cases). This is caused by the fact
that the fuel gas generated by the CoP gasifier contains a considerable amount of
methane which in turn involves a higher LHV than at the other three cases. As a
consequence the necessary fuel gas mass flow decreases so that the compressor
inlet mass flow can be enlarged to reach the reference power output of 292 MW.
The higher blade temperature at the CoP case is again caused by the augmented
hot gas flow.
Modeling and simulation of sub‐processes for CC‐IGCC
67
4.6 The water/steam cycle
The water‐/steam cycle of the CCPP represents the final major sub process within
the direct IGCC process chain. It is powered by the gas turbine exhaust gas and
connected to all of the upstream processes.
Fig. 23 shows the developed flow scheme for the water‐/steam cycle of the CC‐
IGCC. The mayor elements are the heat recovery steam generator (HRSG) and the
steam turbine with condenser. Cooling water heat removal is realized by a conven‐
tional wet cooling tower which however is not part of the further investigation.
The HRSG has three different pressure levels (HP, IP, LP) with one reheat stage and
represents therefore the state of the art design for CCPPs driven by advanced F‐
class gas turbines [21]. Consequently, the steam turbine is characterized by a high
pressure section, an intermediate pressure section and a low pressure section.
Fig. 23 Flow scheme for the water‐/steam cycle in a CC‐IGCC
The arrangement of the HRSG heating surfaces is a result of thermodynamic simu‐
lations aiming at exergy loss minimization. Each pressure level contains economiz‐
er, evaporator and superheater segments which are individually placed so that
they fit optimally to the temperature range of the exhaust gas.
HPEco 3
IP ST
IPRHHP SH
Cooling water8-9-cw-9
IP EvapCPRH
LP EvapLP SHExhaust gas7-8-eg-2
HP steam3-8-st-8
Exhaust gas to stack8-0-eg-3
G
HP Evap
IP-steam8-2-st-1
Make up water10-8-mu-4
LP steam8-2-st-2
LP BFW8-2-BFW-2
Cooling water9-8-cw-10
GT fuel3-8-gas-5
Fuelpreheater
HP ST
HPEco 2
LP steam2-8-st-6
IP steam8-2-st-3
Condensate2-8-cond-1
Condensate4-8-cond-2
Condensate5-8-cond-3
BFW8-3-BFW-3
LP BFW8-5-BFW-4
LP steam5-8-st-11
IP steam8-5-st-12
LP-steam8-4-st-10
GT fuel8-7-gas-9
Heat recovery steam generator (HRSG)
IP SH
HP steam2-8-st-4
IP BFW8-2-BFW-1
HP/IPEco 1
IP steam2-8-st-5
IP-steam8-3-st-9
Extraction air7-8-air-4
Extraction air8-1-air-5 Air cooler
(LP-evaporator)
LP ST
Condensate (to external CPRH)8-3-wa-3
Condensate (from external CPRH)8-3-wa-4
Modeling and simulation of sub‐processes for CC‐IGCC
68
As indicated above, the water‐/steam cycle serves the heat demand of the up‐
stream processes via numerous interfaces. At the same time, it also acts as the
supplier of boiler feed water and superheater for saturated steam which is gener‐
ated for instance at the raw gas cooling section. Furthermore, fuel gas preheating
and cooling of the air that is extracted from the gas turbines compressor are real‐
ized within the cycle.
4.6.1 Modeling and simulation of the water‐/steam cycle
A process simulation model is developed in CHEMCAD according to the above giv‐
en flow sheet. The thermodynamic properties for all gaseous process streams are
calculated by the use of the Soave‐Redlich‐Kwong equation of state. Water and
steam properties are considered corresponding to international standards.
Water‐/steam cycle simulations for CCPPs are common practice in the power plant
business. The ambitious part is always the design of the HRSG. This in turn is pro‐
foundly affected by the chosen temperature differences at the individual pinch
points and approach points. These temperature definitions and the basics of HRSG
design are perfectly described by Lechner [40].
The Q,t ‐ diagram of the HRSG is predestinated to explain the process of boiler de‐
sign. Fig. 24a shows one of a HRSG in a conventional, natural gas fired CCPP.
For a given exhaust gas flow and a chosen HP evaporator pressure, boiler design
takes place as follows:
- First, the temperature difference at the pinch point of the HP evaporator and the
temperature difference between the gas turbines exhaust gas and the tempera‐
ture of live steam and reheat steam have to be chosen.
- Once this is done, the amount of heat available for HP evaporation, superheating
and reheating is fixed.
- Then, heat balance calculations give the HP steam flow as soon as the grade of
sub cooling at the HP evaporator inlet is chosen. The necessary HP feed water is
preheated in staged heating surfaces so that it enters the steam drum just slight‐
ly sub cooled.
- The producible amounts of IP and LP steam are achieved in the same way.
Modeling and simulation of sub‐processes for CC‐IGCC
69
As it can be seen in Fig. 24a, the HP path consumes the lion’s share of the exhaust
gas energy. The other two pressure levels are subordinated and preserve only that
heat which is not required at the HP level. Nevertheless, they are necessary in or‐
der to minimize the exhaust gas losses. The quantity of IP steam and LP steam is
directly influenced by the temperature difference at the HP pinch point. It can only
be augmented by an increase of the HP pinch point which however goes at the ex‐
pense of efficiency.
Fig. 24 Q,t – diagram of the heat recovery steam generator
Although HRSG design for a CC‐IGCC follows the same principles, the Q,t – diagram
looks somewhat different. Fig. 24b shows the diagram for the concept based on the
SCGP. As it can be seen, the superheater and the IP reheater consume about 30 %
Modeling and simulation of sub‐processes for CC‐IGCC
70
more exhaust gas energy as at the conventional HRSG. At the same time, the heat
flow to the HP evaporator is reduced by this amount. This is caused by the addi‐
tional steam flow received from the CSC which has to be superheated in the HRSG.
Consequently, less energy remains for the HP evaporator and the therein generat‐
ed steam flow decreases. Hence, the heat demand of the HP economizers 2 and 3
also drops, which in turn shifts more exhaust gas energy to the IP evaporator. This
process yields to an increased flow of IP steam and feed water so that the HP/IP
economizer and the LP evaporator consume about the same exhaust gas energy as
at the conventional case. Since the boiler feed water for the CSC is warmed within
the condensate preheater (CPRH), the overall condensate flow is markedly in‐
creased in comparison to the conventional HRSG. A part of the condensate is ex‐
ternally preheated within the CO‐shift cycle as shown in Fig. 14.
With regard to the temperature differences, especially the IP reheater and the
CPRH show considerably lower values in comparison to the conventional HRSG.
This again is a result of the mass flow mismatch caused by the strong integration of
the water‐/steam cycle with the upstream processes.
As the temperature differences and the transferred heat strongly affect the heating
surface area, a comparison of the four CC‐IGCC concepts is conducted. Therefore,
the individual water‐/steam cycles are simulated considering all interfaces to the
other processes. The heating surface areas are calculated according to the follow‐
ing:
A Q ∆
(22)
where k represents the heat transfer coefficient and Δtm the mean logarithmic
temperature difference. In accordance to VDI‐Wärmeatlas [61] a value of
50 W/m²K seems to be a good approximation for the heat transfer coefficient. For
the purpose of concept comparison, this k‐value is kept constant for all heating
surfaces and all compared concepts.
Fig. 25 shows the calculated heating surface areas for the different CC‐IGCC con‐
cepts in comparison to a conventional HRSG. As supposed, the HP superheater and
Modeling and simulation of sub‐processes for CC‐IGCC
71
the IP reheater are significantly larger and the HP evaporator and HP economizer
considerably smaller than at the reference boiler. As a result, the IP evaporator and
IP economizer surfaces are sized larger. The heating surface areas for the IP su‐
perheater, the LP evaporator and the CPRH just slightly differ from the reference.
All in all, the GE‐R case shows the highest deviations as the water‐/steam cycle has
to handle the largest amount of saturated HP steam (generated at the RSC and at
the CO‐shift as well).
Fig. 25 Heat surface area for the HRSG in a CC‐IGCC
The overall results are helpful, especially when CCPP operation on back up fuel
(natural gas) has to be considered. For natural gas operation, the heating surfaces
are either too small (e.g. the HP evaporator) or too large (e.g. the IP reheater)
which in fact entails efficiency penalties, caused for instance by a required water
injection to the superheated steam. A detailed economic analysis based on the
planned operating regime (expected operating hours on coal and natural gas as
well as the corresponding fuel prices) is necessary to optimize the HRSG‐design. As
a result the design of the individual heating surfaces might be adjusted. However,
this analysis goes beyond the scope of the presented investigation.
Modeling and simulation of sub‐processes for CC‐IGCC
72
At the end, the performance results of the water‐/steam cycle simulations are
summarized in Table 13. In accordance to [21], the auxiliary load of the combined
cycle process is estimated to be 2.2 % of the CCPPs gross power output. The
boundary conditions, the CHEMCAD flow schemes and the heat and material bal‐
ances for the individual cycles can be found in the Appendixes F1 to F9.
Table 13 Performance results of water‐/steam cycle simulation
Parameter Unit CoP GER SCGP Siemens
Psteam turbine, gross MW 175.1 200.7 176.7 169.4
PCCPP, aux MW 10.3 10.8 10.3 10.2
4.7 Air separation unit
Since the air separation unit is the by far biggest auxiliary load consumer of a CC‐
IGCC, special interest is laid on its process description as well as on modeling and
simulation in order to detect optimization potential. As already mentioned, the
ASU not only supplies oxygen to the gasifier and the SRU but also nitrogen to the
pneumatic coal feeding system (only for the SCGP and Siemens gasifiers) and for
fuel gas dilution purposes. The considerable amounts of the diluent nitrogen as
well as the need for gas turbine air integration are responsible for special bounda‐
ry conditions compared to a conventional ASU for chemical processes. Conven‐
tional units usually are designed for quite low operating pressures (approximate‐
ly 5‐6 bar). For CC‐IGCC, an elevated pressure concept might be superior.
Modeling and simulation of sub‐processes for CC‐IGCC
73
In the following the cryogenic air separation process is described based on a com‐
mon ASU flow sheet applying the classical double‐column arrangement. Building
on that, a process simulation model is developed and used for simulation of a wide
range of operating scenarios. The specific auxiliary load consumption is calculated
and illustrated dependent on the level of air and nitrogen integration. Based on
that, a decision can be made if a low or an elevated pressure ASU should be ap‐
plied.
The sophisticated three‐column distillation ASU which is supposed to be energeti‐
cally advantageous at operating pressures higher than 12 bar [21] is not consid‐
ered, since there is only one reference unit operating worldwide (AVESTA, Fin‐
land). Therefore, this technology does not represent the state of the art. Moreover,
this configuration is much more complex and inflexible to load changes (ibid, page
77‐78 in AP2001) so that it is rather not qualified for nowadays electricity grid
requirements.
4.7.1 Fundamentals of air separation and process description
The subsequently described process represents one out of a multiplicity of possi‐
ble configurations [21]. It is used to clarify the fundamental coherences while it is
not claimed that the chosen process represents the optimum configuration for
each CC‐IGCC.
Referring to Fig. 26 a conventional cryogenic air separation process can be de‐
scribed as follows: First, the ambient air is compressed in the Main Air Compressor
(MAC) and then cooled and purified from dust, water, carbon dioxide, and other
unwanted impurities.
Modeling and simulation of sub‐processes for CC‐IGCC
74
Fig. 26 Process flow diagram of the low pressure air separation unit
In case of gas turbine air integration a part or all of the required air is extracted
from the gas turbine. As air extraction takes place downstream the gas turbine
compressor, the extracted air needs to be expanded (due to the higher pressure
level of common gas turbines) in the hot air turbine to the required operating
pressure of the ASU.
Thereafter, one part of the air is cooled down close to its condensing temperature
(ca. 1 K superheated) within the main heat exchanger (MHE) before it is fed to the
last stage of the high pressure distillation column (lower column). The remaining
part of the air is compressed up to approximately 70 bar in a booster unit with in‐
tercoolers, then liquefied within the MHE and depressurized in the liquid air tur‐
bine for energy recovery and concurrent sub cooling. Subsequently, the liquid air is
split so that one part is throttled (by taking advantage of the Joule‐Thomson‐effect)
and fed to the lower column. The remaining liquid is sub cooled, throttled and fed
to the low pressure distillation column (upper column).
Modeling and simulation of sub‐processes for CC‐IGCC
75
The split‐distribution of gaseous and liquid air as well as the specific feed and ex‐
traction stages are optimization parameters that are individually found in order to
compensate the heat losses and fulfill the energy balance.
Within the high pressure column the pre‐separation of air takes place. Due to the
fact that the evaporation temperature of nitrogen is lower than that of oxygen (ar‐
gon is in between), an oxygen‐enriched liquid (about 35 mol. %) accumulates at
the bottom while a nitrogen‐rich vapor rises to the top of the column. After lique‐
faction within the condenser of the high pressure column, one part of the nitrogen‐
rich stream can be extracted as an ultraclean product. Another part is used as re‐
flux for the lower column while the remaining is sub cooled and fed as reflux to the
upper column.
The oxygen‐enriched stream leaving the high pressure column is sub cooled, throt‐
tled and fed to the low pressure column where the final separation takes place. So,
the oxygen product with its desired purity is distilled at the bottom of the upper
column and subsequently pumped to the required pressure before it is evaporated
in the MHE.
At the top of the upper column diluent gaseous nitrogen (DGAN) and a few stages
below a residual gas can be taken off. The individual amount of the latter one af‐
fects the DGAN‐purity and is therefore used for DGAN purity‐adjustment, especial‐
ly at higher operating pressures of the ASU.
Pure liquid nitrogen is extracted at the top of the lower column before it is evapo‐
rated in the MHE. After compression to the required pressure levels it is used as
gaseous nitrogen (GAN) for the coal preparation and feeding process.
Inside the distillation column an intensive contact between liquid and vapor is re‐
alized where both intend to reach the equilibrium state. To achieve this, the rising
vapor needs to lower its oxygen content which is realized by partial condensation
of oxygen. The released condensing enthalpy yields to an evaporation of nitrogen
out of the liquid phase so that the liquid also approaches its equilibrium condition.
Fig. 27 shows the equilibrium composition of boiling oxygen‐nitrogen mixtures at
different pressure levels. The equilibrium data are an integral part of the database
implemented in CHEMCAD. As it can be seen, the dew point curve and the bubble
point curve approach each other at rising operating pressures. Hence, air separa‐
Modeling and simulation of sub‐processes for CC‐IGCC
76
tion at higher pressures is hampered and requires a higher number of separation
stages as well as a higher reflux ratio.
Fig. 27 Equilibrium composition of boiling oxygen‐nitrogen mixtures
The pressure difference between the upper and the lower distillation column is a
fundamental factor which significantly influences the operating conditions of the
ASU. is the pressure level is determined so that the nitrogen vapor at the top of the
lower column condensates at a slightly higher temperature (2 … 3 K) as the tem‐
perature of boiling oxygen at the bottom of the upper column. In doing so, the re‐
leased condensing enthalpy can be transferred to the upper column and realize the
heat supply for evaporation. As a consequence, the upper and the lower column
are thermally coupled which means that the condenser of the lower column acts as
the reboiler of the upper one. The determination of pressure levels for the high and
low pressure column is visualized for two different examples in Fig. 28.
Modeling and simulation of sub‐processes for CC‐IGCC
77
Fig. 28 Pressure‐dependent boiling temperatures for nitrogen and oxygen and
determination of pressure levels for the distillation column of the ASU
As it can be seen the evaporation temperatures of oxygen and nitrogen depart
from each other with rising pressures. Therefore the necessary pressure difference
(pressure loss) between upper and lower column increases at higher operating
pressures. Fig. 28 illustrates an increase of pressure loss from roughly 4 bar to ap‐
proximately 8 bar when the operating pressure in the lower column is increased
from 5 to 11 bar. Consequently the compression energy for the MAC increases at
higher column pressures. Nevertheless an elevated pressure ASU might be superi‐
or (especially at high DGAN‐demands) since the pressure ratio for DGAN‐
compression is considerable reduced compared to a conventional low pressure
concept.
Modeling and simulation of sub‐processes for CC‐IGCC
78
4.7.2 ASU simulation models
For ASU simulation, two different models are developed in CHEMCAD. While the
first model is used for the simulation of a low pressure concept, the second is used
to simulate an elevated pressure one. Both models adopt a similar configuration
and differ only in detail.
The simulation model for the low pressure concept is based on the process ar‐
rangement (Fig. 26) and the description given in 4.7.1.
For the elevated pressure concept, the differences result from the higher distilla‐
tion pressure and influence the necessary compressor and column stages as well
as the compensation of heat losses. To enhance the oxygen yield, a part or the
compressed DGAN is recycled, liquefied and used as reflux for the lower column.
Therefore the air supply to the lower column is omitted. Table 14 summarizes the
main differences between the low and the elevated pressure concept.
Table 14 Main differences between the developed ASU‐models
Component Low pressure ASU Elevated pressure ASU
MAC 3 stages (to 5.8 bar) 4 stages (to 12 bar)
Hot air turbine Expansion to 5.8 bar Expansion to 12 bar
Lower column
35 theoretical stages 45 theoretical stages
5.1 bar pressure 11.3 bar pressure
Upper column
25 theoretical stages 45 theoretical stages
1.3 bar pressure 3.5 bar pressure
GAN compressor 4 stages 3 stages
DGAN compressor 6 stages 4 stages
Residual gas expander No (not possible) Yes (from 3 to 1 bar)
The process flow diagram for the elevated pressure concept can be found in Ap‐
pendix G1. The developed CHEMCAD flow sheets for the low pressure ASU and the
elevated pressure ASU are shown in the Appendixes G2 and G3.
Modeling and simulation of sub‐processes for CC‐IGCC
79
The developed process models simulate an interconnection of turbo machineries,
heat exchangers and distillation columns. The first two elements are simply speci‐
fied by setting the efficiency and the pressure ratio and the temperature differ‐
ences respectively. The distillation columns are calculated using the principle of
equilibrium stage. That is to say, that the equilibrium state for each component (air
can be considered as a mixture of nitrogen, oxygen and argon) at each stage is cal‐
culated by solving the so called MESH‐equations (MESH: Material balance, Equilib‐
rium condition, Summation condition, Heat balance) [18]. The equilibrium stage is
also known as the theoretical stage since the practical necessary number of stages
is achieved by considering the stage efficiency. Cubic equations are proved for cal‐
culation of vapor‐liquid equilibriums. Out of these equations, the Peng‐Robinson
equation of state delivers reliable data especially at very low temperatures and is
therefore preferred for the calculation of cryogenic processes. Hence, it has been
chosen for the calculation of thermodynamic properties. Special care has to be tak‐
en for the placement of the feed and extraction stages of the distillation columns. A
steady curve progression for the vapor and liquid composition indicates the cor‐
rect position of the feed streams, as the compositions of the feed streams have to
coincide with the vapor or liquid composition at the corresponding column stage.
In Fig. 29 the vapor and liquid compositions inside the upper column are illustrat‐
ed for the low pressure concept as an example. The steady curve progression indi‐
cates the correct placement of the feed streams.
Modeling and simulation of sub‐processes for CC‐IGCC
80
Fig. 29 Vapor and liquid composition inside the low pressure column of the ASU
4.7.3 Simulation of ASU operating scenarios
The auxiliary load for an ASU within a CC‐IGCC mainly depends on the level of air
integration and the DGAN demand for fuel gas dilution. Therefore, the developed
ASU models are used for simulations covering a widespread operating area for
these two factors. The following parameters are defined for process assessment:
Specific auxiliary load: PASU, PASU,VGOX
WS GOX
(23)
Level of air integration: VGT . V ,ASU
% (24)
Specific air integration: KASU, VGT . VGOX
S .S GOX
(25)
Modeling and simulation of sub‐processes for CC‐IGCC
81
Specific DGAN demand: KASU,DGANVDGANVGOX
S ³ DGANS ³ GOX
(26)
Specific HP GAN demand: KASU,HP GANVHP GANVGOX
S ³ HP GANS ³ GOX
(27)
Specific LP GAN demand: KASU,LP GANVLP GANVGOX
S ³ LP GANS ³ GOX
(28)
The air demand for the separation process and the available amount of DGAN
slightly vary for the different ASU operating pressures. Hence, the levels of air and
nitrogen integration are ambiguous parameters when comparing air separation
units since they stand for different absolute amounts of extraction air and DGAN.
Therefore, the aforementioned parameters KASU,air and KASU,DGAN are introduced as
alternative expressions.
For ASU processes that have to supply GAN for the coal preparation and feeding
process, the GOX‐specific HP and LP GAN demand have to be considered as well.
The GAN and DGAN demands are not physically influenced by the amount of GOX.
They are only referred to the amount of GOX in order to simplify concept assess‐
ment.
A series of simulations have been conducted for various air integration levels and
specific DGAN demands, both for the low pressure and the elevated pressure con‐
cept as well. The calculations were carried out for an ASU that produces oxygen
and nitrogen for a dry feed entrained flow gasification process in a CC‐IGCC power
plant. The underlying boundary conditions are summarized in Table 15.
Modeling and simulation of sub‐processes for CC‐IGCC
82
Table 15 Boundary conditions for ASU simulation
Stream Parameter Value
GOX
Purity 95 mol. %
Conditions 50 bar; 60 °C
HP GAN
Purity < 0.1 mol. % O2
Conditions 70 bar; 70 °C
KASU,HP GAN 0.30 Sm³ HP GAN/Sm³ GOX
LP GAN Purity < 0.1 mol. % O2
Conditions > 9 bar (extraction at suitable stage); 30 °C
KASU,LP GAN 0.16 Sm³ LP GAN/Sm³ GOX
DGAN
Purity < 1 mol. % O2
Conditions 34 bar; ≈ 100 °C (as received after last stage)
Ambient air Conditions 15 °C, 1013.25 mbar, 60 % relative humidity
I Specialized Equipment 109.719.000 126.177.000 EUR II Other Equipment 7.286.000 8.379.000 EUR III Civil 15.301.000 22.019.000 EUR IV Mechanical 16.788.000 25.450.000 EUR V Electrical Assembly & Wiring 3.240.000 4.904.000 EUR VI Buildings & Structures 5.924.000 8.605.000 EUR VII Engineering & Plant Startup 11.062.000 11.138.000 EUR
Gasification Plant NA NA
Desalination Plant NA NA
CO2 Capture Plant NA NA
Subtotal -Contractor's Internal Cost 169.320.000 206.672.000 EUR VIII Contractor's Soft & Miscellaneous Costs 35.690.000 47.795.000 EUR Contractor's Price 205.010.000 254.467.000 EUR IX Owner's Soft & Miscellaneous Costs 18.451.000 22.902.000 EUR Total -Owner's Cost (0,7 EUR per US Dollar) 223.461.000 277.369.000 EUR
Nameplate Net Plant Output 405 405 MW Cost per kW -Contractor's 505,7 627,7 EUR per kW Cost per kW -Owner's 551,2 684,2 EUR per kW * Cost estimates as of February 2012.** Land cost, utility connection cost, and spare parts costs are zero. The user may want to edit those inputs for better cost estimates.
Appendix
181
1
2
34
5
1
2
3
4 6 7
8
8
10
12
reac
tor 1
reac
tor 2
12
HE
2
HE
1
9
16
17
18
21
19 HE
4
11
20
23
13
25
20
22
24
27
2341
25
26 HE
5
HE
6
29
44
HE
7
28
31
33
38
37
HE
9
27
2846
22
18
19
47
45
48
raw
gas
mod
erat
or s
team
satu
rate
d ga
shift
ed g
as
cond
. dis
char
ge
2930
4951
50cw
out
cw in
mak
e up
H2O32
76
77
78
79
80
98
9910
0
117
116 24
clea
n ga
s
DG
AN
115
34
15
96
35
26
39
42
10
30
9
16
17
7273
satu
rate
d ga
ID
1 T
214
.5 C
P 3
9.0
bar
W 4
7681
4 kg
/h M
250
05 k
mol
/h
ID
2 T
264
.7 C
P 5
0.6
bar
W 0
kg/
h M
0 k
mol
/h
ID
3 T
214
.5 C
P 3
9.0
bar
W 4
7681
4 kg
/h M
250
05 k
mol
/h
ID
4 T
280
.0 C
P 3
8.9
bar
W 4
7681
4 kg
/h M
250
05 k
mol
/h
ID
6 T
492
.9 C
P 3
7.8
bar
W 4
7681
9 kg
/h M
250
05 k
mol
/h
ID
8 T
280
.1 C
P 3
7.5
bar
W 4
7681
9 kg
/h M
250
05 k
mol
/h
ID
12 T
264
.3 C
P 5
4.5
bar
W 5
9412
kg/
h M
329
8 km
ol/h
ID
15 T
264
.3 C
P 5
4.5
bar
W 5
9412
kg/
h M
329
8 km
ol/h
ID
9 T
321
.8 C
P 3
6.4
bar
W 4
7681
9 kg
/h M
250
05 k
mol
/h
ID
23 T
114
.3 C
P 3
5.8
bar
W 4
4742
6 kg
/h M
233
73 k
mol
/h
ID
20 T
171
.8 C
P 3
5.9
bar
W 4
4742
6 kg
/h M
233
73 k
mol
/h
ID
21 T
171
.8 C
P 3
5.9
bar
W 2
7024
kg/
h M
150
0 km
ol/h
ID
27 T
114
.3 C
P 3
5.8
bar
W 3
6547
3 kg
/h M
188
25 k
mol
/h
ID
31 T
81.
9 C
P 3
5.7
bar
W 3
6547
3 kg
/h M
188
25 k
mol
/h
ID
33 T
81.
9 C
P 3
5.7
bar
W 1
1252
kg/
h M
625
km
ol/h
ID
29 T
112
.3 C
P 3
3.7
bar
W 2
4963
3 kg
/h M
138
56 k
mol
/h
ID
44 T
171
.8 C
P 3
5.9
bar
W 4
7445
0 kg
/h M
248
73 k
mol
/h
ID
28 T
114
.3 C
P 3
5.8
bar
W 8
1953
kg/
h M
454
9 km
ol/h
ID
38 T
99.
5 C
P 3
3.7
bar
W 1
4065
5 kg
/h M
780
8 km
ol/h
ID
37 T
20.
4 C
P 3
5.7
bar
W 1
4065
5 kg
/h M
780
8 km
ol/h
ID
41 T
30.
0 C
P 3
5.5
bar
W 3
4966
1 kg
/h M
179
48 k
mol
/h
ID
43 T
30.
0 C
P 3
5.5
bar
W 3
5422
0 kg
/h M
182
00 k
mol
/h
ID
48 T
169
.1 C
P 3
1.7
bar
W 2
5200
2 kg
/h M
139
88 k
mol
/h
ID
46 T
179
.8 C
P 3
6.0
bar
W 2
369
kg/h
M 1
32 k
mol
/h
ID
45 T
169
.0 C
P 3
1.7
bar
W 2
4963
3 kg
/h M
138
56 k
mol
/h
ID
47 T
179
.8 C
P 3
6.0
bar
W 4
7445
0 kg
/h M
248
73 k
mol
/h
ID
42 T
30.
0 C
P 3
5.5
bar
W 4
559
kg/h
M 2
53 k
mol
/h
ID
22 T
169
.0 C
P 1
6.0
bar
W 5
9412
kg/
h M
329
8 km
ol/h
ID
18 T
170
.3 C
P 5
6.5
bar
W 5
9412
kg/
h M
329
8 km
ol/h
ID
19 T
179
.8 C
P 3
6.0
bar
W 4
7681
9 kg
/h M
250
05 k
mol
/h
ID
51 T
30.
0 C
P 4
.0 b
ar W
105
3057
kg/
h M
584
54 k
mol
/h
ID
49 T
20.
0 C
P 6
.0 b
ar W
105
3057
kg/
h M
584
54 k
mol
/h
ID
98 T
110
.5 C
P 3
2.4
bar
W 8
3387
8 kg
/h M
462
90 k
mol
/h
ID
99 T
10.
0 C
P 5
.0 b
ar W
617
08 k
g/h
M 3
425
kmol
/h
ID 1
00 T
11.
0 C
P 3
8.0
bar
W 6
1708
kg/
h M
342
5 km
ol/h
ID 1
17 T
46.
1 C
P 3
3.0
bar
W 2
6978
4 kg
/h M
188
40 k
mol
/h
ID 1
16 T
95.
6 C
P 3
4.0
bar
W 2
1755
5 kg
/h M
775
0 km
ol/h
ID
97 T
162
.3 C
P 3
6.0
bar
W 8
9557
0 kg
/h M
497
15 k
mol
/h
ID
24 T
10.
0 C
P 3
3.0
bar
W 5
2228
kg/
h M
110
90 k
mol
/h
ID 1
15 T
103
.9 C
P 3
8.0
bar
W 8
9558
6 kg
/h M
497
16 k
mol
/h
ID
35 T
103
.7 C
P 3
2.4
bar
W 8
9558
6 kg
/h M
497
16 k
mol
/h
ID
34 T
103
.9 C
P 3
8.0
bar
W 8
9557
0 kg
/h M
497
15 k
mol
/h
ID
11 T
157
.1 C
P 1
8.0
bar
W 5
9412
kg/
h M
329
8 km
ol/h
ID
32 T
81.
9 C
P 3
5.7
bar
W 3
5422
0 kg
/h M
182
00 k
mol
/h
ID
26 T
151
.8 C
P 3
2.4
bar
W 3
3147
5 kg
/h M
222
65 k
mol
/h
ID
16 T
200
.0 C
P 4
8.0
bar
W 2
5200
2 kg
/h
ID
73 T
200
.0 C
P 3
2.3
bar
W 3
3147
6 kg
/h
ID
72 T
151
.8 C
P 3
2.4
bar
W 3
3147
6 kg
/h
ID
17 T
180
.7 C
P 3
6.2
bar
W 4
7681
9 kg
/h
ID
39 T
15.
0 C
P 5
0.0
bar
W 1
2940
3 kg
/h M
718
3 km
ol/h
ID
14 T
468
.3 C
P 4
9.1
bar
W 6
6361
kg/
h M
368
4 km
ol/h
ID
10 T
250
.3 C
P 3
6.3
bar
W 4
7681
9 kg
/h M
250
05 k
mol
/h
ID
30 T
169
.7 C
P 5
0.0
bar
W 2
5200
2 kg
/h M
139
88 k
mol
/h
qu w
ater
GT
fuel
43
97
46
49
from
gas
ifier
from
gas
ifie
ID
83 T
264
.7 C
P 5
0.6
bar
W 2
6361
kg/
h
5
6 715
13
14
83
71
90
50
80
to g
asifi
er
ID
7 T
308
.7 C
P 3
7.6
bar
W 4
7681
9 kg
/h M
250
05 k
mol
/h
ID
80 T
468
.5 C
P 4
9.6
bar
W 8
5773
kg/
h
ID
75 T
468
.5 C
P 4
9.6
bar
W 1
9116
kg/
h
87
ID
76 T
468
.5 C
P 4
9.6
bar
W 2
96 k
g/hto S
RU
/TG
T
7675
44
74
77
78
to A
GR
84
45
79
81
from
SR
U/T
GT
ID
78 T
202
.1 C
P 6
.1 b
ar W
332
35 k
g/h
ID
81 T
193
.0 C
P 6
.1 b
ar W
425
33 k
g/h
ID
79 T
164
.0 C
P 6
.6 b
ar W
203
06 k
g/h
ID
82 T
182
.8 C
P 6
.1 b
ar W
628
40 k
g/h
ID
77 T
202
.1 C
P 6
.1 b
ar W
331
27 k
g/h
ID
84 T
163
.4 C
P 6
.6 b
ar W
929
9 kg
/h
47
48
51
52
53
8291
92
54
85
43
42
93
ID
91 T
182
.8 C
P 6
.1 b
ar W
457
40 k
g/h
ID
89 T
156
.8 C
P 6
.0 b
ar W
115
378
kg/h ID
92
T 1
82.8
C P
6.1
bar
W 1
7099
kg/
h
ID
93 T
32.
3 C
P 0
.050
bar
W 4
5740
kg/
h88
55
56
57
9410
2
5810
1
104
103
ID 1
03 T
157
.0 C
P 1
4.0
bar
W 2
0306
kg/
h
ID 1
04 T
157
.0 C
P 1
4.0
bar
W 9
299
kg/h
ID 1
02 T
158
.0 C
P 5
2.0
bar
W 2
6361
kg/
h
to S
RU
/TG
T
to g
asifi
er
to g
asifi
er
59
6086
108
107
109
ID 1
09 T
246
.0 C
P 3
8.0
bar
W 2
96 k
g/h
ID 1
07 T
150
.8 C
P 6
.0 b
ar W
331
27 k
g/h
from
SR
U/T
GT
from
AG
R
106
110
mak
e up
ID 1
10 T
10.
0 C
P 6
.0 b
ar W
191
16 k
g/h
11
89
95
6110
5
111
ID 1
11 T
157
.1 C
P 1
8.0
bar
W 5
9412
kg/
h
ID 1
08 T
69.
0 C
P 6
.0 b
ar W
982
79 k
g/h
Appendix I6 – CHEMCAD flow sheet for the CO‐shift for a GCC concept with Sie‐
mens gasifier
References
182
References [1] BAEHR, H., KABELAC, S. (2009). Thermodynamik. Grundlagen und technische
Anwendungen. Springer. Berlin, Heidelberg. ISBN/DOI: 3642005551. [2] BOHMN, M., HERZOG, H., PARSONS, J., SEKAR, R. (2007). Capture‐ready coal
plants—Options, technologies and economics. International Journal of Greenhouse Gas Control, 1, 1, 113–120.
[3] BP (2011). BP Energy Outlokk 2030. http://www.bp.com/liveassets/bp_internet/globalbp/globalbp_uk_english/reports_and_publications/statistical_energy_review_2008/STAGING/local_assets/2010_downloads/2030_energy_outlook_booklet.pdf. last checked: 2011‐04‐04.
[4] CARBO, M., JANSEN, D., DIJKSTRA, J., VAN BUIJTENEN, J., VERKOOIJEN, A. (2009). Pre‐combustion decarbonisation in IGCC: Gas turbine operating window at variable carbon capture ratios. Energy Procedia, 1, 1, 669–673.
[5] CHANG; ROUSSEAU; FERRELL (1987). Vapor/Liquid Equilibria of Constitu‐ents from Coal Gasification in Refrigerated Methanol.
[6] CHEN, C., RUBIN, E. (2009). CO2 control technology effects on IGCC plant per‐formance and cost. Energy Policy, 37, 915–924.
[7] CHIESA, P., CONSONNI, S., KREUTZ, T. (2005). Co‐production of hydrogen, electricity and CO from coal with commercially ready technology. Part A: Per‐formance and emissions. International Journal of Hydrogen Energy, 30, 7, 747–767.
[8] CORMOS, C.‐C. (2010). Evaluation of energy integration aspects for IGCC‐based hydrogen and electricity co‐production with carbon capture and stor‐age. International Journal of Hydrogen Energy, 35, 14, 7485–7497.
[9] DESCAMPS, C., BOUALLOU, C., KANNICHE, M. (2008). Efficiency of an Inte‐grated Gasification Combined Cycle (IGCC) power plant including CO2 re‐moval. Energy, 33, 6, 874–881.
[10] EMUN, F., GADALLA, M., MAJOZI, T., BOER, D. (2010). Integrated gasification combined cycle (IGCC) process simulation and optimization☆. Computers & Chemical Engineering, 34, 3, 331–338.
[11] EURLINGS, J., PLOEG, J. (1999). Process Performance of the SCGP at Buggenum IGCC. Gasification Technologies Conference. San Francisco.
[12] EUROPEAN ENERGY EXCHANGE (2012). EU Emission Allowances. http://www.eex.com/de/Downloads/Marktdaten/Emissionsberechtigungen%20‐%20EEX. last checked: 2012‐05‐14.
[13] FARINA, G., BRESSAN, L. (1999). Optimizing IGCC design. Foster Wheeler Re‐view, no volume, 17–21.
[14] FRANK, P. (2003). Sulphur Tolerant Shift Catalyst ‐ Sulphur Tolerant Shift Catalyst ‐ Dealing with the Bottom of the Barrel Problem Problem.
[15] FRATZSCHER, W., MICHALEK, K., BRODJANSKIJ, V. (1986). Exergie: Theorie und Anwendung. VEB Deutscher Verlag für Grundstoffindustrie. Leipzig. ISBN/DOI: 3‐342‐00091‐0.
References
183
[16] FREY, H., ZHU, Y. (2006). Improved System Integration for Integrated Gasifi‐cation Combined Cycle (IGCC) Systems. Environmental Science & Technology, 40, 5, 1693–1699.
[17] GEOSITS, R., SCHMOE, L. (2005). IGCC ‐ The challanges of integration. ASME Turbo Expo 2005: Power for Land, Sea and Air. Reno‐Tahoe, Nevada, USA.
[18] GMEHLING, J., BREHM, A. (1996). Lehrbuch der technischen Chemie. Grundoperationen. Wiley‐Vch Verlag Gmbh. ISBN/DOI: 3‐527‐30851‐2.
[19] GRÄBNER, M. (2012). Modeling‐based evaluation of coal gasification pro‐cesses for high‐ash coal. Dissertation. TU Bergakademie Freiberg. Freiberg.
[20] GRÄBNER, M., MORSTEIN, O. von, RAPPOLD, D., GÜNSTER, W., BEYSEL, G., MEYER, B. (2010). Constructability study on a German reference IGCC power plant with and without CO2‐capture for hard coal and lignite. Energy Conver‐sion and Management, 51, 11, 2179–2187.
[21] GRÄBNER, M.; OGRISECK, S.; OGRISECK, K.; KUSKE, E.; ABRAHAM, R.; GÜNSTER, W.; METZ, T.; KOSS, U.; JENSEN, S.; RIEGER, M.; WOLF, K.‐J.; RENZENBRINK, W.; RAINER, H.; FOLKE, C.; KOROBOV, D.; BEYSEL, G.; ALEXEEV, A.; HANNEMANN, F.; KARKOWSKI, G.; HIGMAN, C.; VON MORSTEIN, O.; RAPPOLD, D.; GRAEBER, C.; RIEDL, K.; KITTEL, J.; HEIL, S.; ROST, M.; BRUNNHUBER, C.; ULBRICHT, I.; WORLITZ, F.; ROTTENBACH, T.; RAUCHFUß, H.; ROCHNER, I.; BAUERSFELD, D.; TROMPELT, M.; GUHL, S.; BRENNER, S.; MEYER, B. (2008). Schlussbericht "Verbundvorhaben COORIVA: Baubarkeitsuntersuchungen für ein IGCC‐Referenzkraftwerk ab 2015 für Braun‐ und Steinkohle mit CO2‐Rückhaltung". http://edok01.tib.uni‐hannover.de/edoks/e01fb09/60863980X.pdf. last checked: 2011‐04‐29.
[22] HIGMAN, C., VAN DER BURGT, M. (2003). Gasification. Elsevier/Gulf Profes‐sional Pub. Boston, Mass. ISBN/DOI: 0‐7506‐7707‐4.
[23] HOCHGESANG, G. (1970). Rectisol and Purisol ‐ Efficient Acid Gas Removal for High Pressure Hydrogen and Syngas Production. European and Japanes Chemical Industries Symposium, Vol. 62, No. 7.
[24] HOLT, N. (2000). Evaluation of Innovative Fossil Fuel Power Plants with CO2 Removal. EPRI, Palo Alto, CA, U. S. Department of Energy — Office of Fossil Energy, Germantown, MD and U. S. Departmentof Energy/NETL, Pittsburgh, PA: 2000. 1000316.
[25] HOLT, N. (2002). Updated Cost and Performance Estimates for Fossil Fuel Power Plants with CO2‐Removal. Electric Power Research Institute, Interim Report.
[26] HOLT, N. (2006). Gasification Technology Status. EPRI, Report ID: 1012224. [27] HORLOCK, J., WATSON, D., JONES, T. (2001). Limitations on Gas Turbine Per‐
formance Imposed by Large Turbine Cooling Flows. Journal of Engineering for Gas Turbines and Power, 123, 3, 487.
References
184
[28] HORNICK, M., MCDANIEL, J. (2002). Tampa Electric Polk Power Station Inte‐grated Gasification Combined Cycle Project – Final technical report. Work performed under cooperative agreement DE‐FC‐21‐91MC27363 for the U.S. Department of Energy, Office of Fossil Energy, National Energy Technology Laboratory, Morgantown, West Virginia.
[29] HUANG, Y., REZVANI, S., MCILVEEN‐WRIGHT, D., MINCHENER, A. (2008). Techno‐economic study of CO2 capture and storage in coal fired oxygen fed entrained flow IGCC power plants. Fuel Processing Technology, 89.
[30] IEA (2010). World Energy Outlook 2010. http://www.worldenergyoutlook.org/docs/weo2010/weo2010_london_nov9.pdf. last checked: 2011‐04‐04.
[31] IEA GREENHOUSE GAS R&D PROGRAMME (2003). Potential for improve‐ment in gasification combined cycle power generation with CO2 capture.
[32] INTERNATIONAL ORGANIZATION FOR STANDARDIZATION (2009). Gas Turbines ‐ Acceptance Tests, 2314:2009.
[33] JONSSON, M.; BOLLAND, O.; BÜCKER, D.; ROST, M. (2005). Gas turbine cool‐ing model for evaluation of novel cycles.
[34] KATZER, J. (2007). The future of coal‐Options for a carbon‐constrained world. Massachusetts Institute of Technology. Boston, MA. ISBN/DOI: 978‐0‐615‐14092‐6.
[35] KIM, Y., LEE, J., KIM, T., SOHN, J., JOO, Y. (2010). Performance analysis of a syngas‐fed gas turbine considering the operating limitations of its compo‐nents. Applied Energy, 87, 5, 1602–1611.
[36] KLARA, J., PLUNKETT, J. (2010). The potential of advanced technologies to reduce carbon capture costs in future IGCC power plants. International Jour‐nal of Greenhouse Gas Control, 4, 2, 112–118.
[37] KLOSTER, R. (1999). Thermodynamische Analyse und Optimierung von Gas‐/Dampfturbinen‐Kombi‐Kraftwerken mit integrierter Kohlevergasung. VDI. Düsseldorf. ISBN/DOI: 3‐18‐340906‐2.
[38] KOHL, A., NIELSEN, R. (1997). Gas purification. Gulf Pub. Houston, Tex. ISBN/DOI: 0884152200.
[39] KUNZE, C., SPLIETHOFF, H. (2010). Modelling of an IGCC plant with carbon capture for 2020. Fuel Processing Technology, 91, 8, 934–941.
[41] LEE, C., LEE, S., YUN, Y. (2007). Effect of air separation unit integration on integrated gasification combined cycle performance and NOx emission char‐acteristics. Korean Journal of Chemical Engineering, 24, No. 2, 368–373.
[42] LEE, J., KIM, Y., CHA, K., KIM, T., SOHN, J., JOO, Y. (2009). Influence of system integration options on the performance of an integrated gasification com‐bined cycle power plant. Applied Energy, 86, 9, 1788–1796.
[43] MARTELLI, E., KREUTZ, T., CONSONNI, S. (2009). Comparison of coal IGCC with and without CO2 capture and storage: Shell gasification with standard vs. partial water quench. Energy Procedia, 1, 1, 607–614.
References
185
[44] MAURSTAD, O. (2005). An Overview of Coal based Integrated Gasification Combined Cycle (IGCC) Technology. http://lfee.mit.edu/publications, Publi‐cation No. LFEE 2005‐002 WP.
[45] NATIONAL ENERGY TECHNOLOGY LABORATORY (NETL) (2002). Evaluation of Fossil Fuel Power Plants with CO2 Recovery. Contract No. DE‐AM26‐99FT40465 between the National Energy Technology Center (NETL) and Concurrent Technologies Corporation (CTC).
[46] NATIONAL ENERGY TECHNOLOGY LABORATORY (NETL) (2007). Cost and Performance Baseline for Fossil Energy Plants, Volume 1: Bituminous Coal and Natural Gas to Electricity, Final Report. DOE/NETL‐2007/1281.
[47] NATIONAL ENERGY TECHNOLOGY LABORATORY (NETL) (2010). Cost and performance baseline for fossil energy plants. Volume 1: Bituminous coal and natural gas to electricity.
[48] NEWMAN, S. (1985). Acid and sour gas treating processes. Latest data and methods for designing and operating today's gas treating facilities. Gulf Pub. Co. Houston. ISBN/DOI: 0872018393.
[49] ORDORICA‐GARCIA, G., DOUGLAS, P., CROISET, E., ZHENG, L. (2006). Technoeconomic evaluation of IGCC power plants for CO2 avoidance. Energy Conversion and Management, 47, 15‐16, 2250–2259.
[50] PARDEMANN, R. (2006). Modellierung des Betriebsverhaltens von fort‐schrittlichen Gasturbinen für IGCC‐ und Polygeneration‐Kraftwerksanwendungen. Diplomarbeit. TU Bergakademie Freiberg.
[51] PRELIPCEANU, A.; KABALLO, H.‐P.; KERESTECIOGLU, U. (2007). Linde Rectisol Wash Process. 2nd International Freiberg Conference on IGCC & XtL Technologies.
[52] RUBIN, E., CHEN, C., RAO, A. (2007). Cost and performance of fossil fuel pow‐er plants with CO2 capture and storage. Energy Policy, 35, 9, 4444–4454.
[53] SCHINGNITZ, M.; GÖRZ, J. (1998). Die Einstellung thermodynamischer Gleichgewichte bei der Vergasung von Rest‐ und Abfallstoffen durch die Noell‐Flugstromvergasungstechnologie. DECHEMA Jahrestagung, 27.05.1998.
[54] SCHMALFELD, J. (2008). Die Veredlung und Umwandlung von Kohle. Techno‐logien und Projekte 1970 bis 2000 in Deutschland. DGMK. Hamburg. ISBN/DOI: 978‐3‐936418‐88‐0.
[55] SCHREINER, B. Der Claus‐Prozess. Chemie in unserer Zeit, 2008, 42, 378–392. [56] SIEMENS AG. Siemens Gas Turbine SGT5‐4000F.
http://www.energy.siemens.com/hq/pool/hq/power‐generation/gas‐turbines/SGT5‐4000F/downloads/SGT5‐4000F_Brochure_2008.pdf. last checked: 2012‐01‐04.
[57] SMITH, I. (2009). Gas turbine technology for syngas/hydrogen in coal‐based IGCC. IEA Clean Coal Centre. London. ISBN/DOI: 978‐92‐9029‐475‐7.
[58] SPLIETHOFF, H. (2010). Power generation from solid fuels. page 611‐612. Springer. Heidelberg, New York. ISBN/DOI: 978‐3‐642‐02855‐7.
[59] TRAUPEL, W. (2001). Thermische Turbomaschinen. Springer. Berlin [u.a.]. ISBN/DOI: 3‐540‐67377‐6.
References
186
[60] ULLMANN. Ullmann's encyclopedia of industrial chemistry. Gas Production (2003). Wiley‐VCH. Weinheim, Germany. ISBN/DOI: 978‐3‐527‐30673‐2.
[61] VDI (2006). VDI‐Wärmeatlas. Springer. Berlin ;, Heidelberg, New York. ISBN/DOI: 978‐3‐540‐25504‐8.
[62] VOß, A.; WISSEL, S.; RATH‐NAGEL, S.; BLESL, M.; FAHL, U. (2008). Stromer‐zeugungskosten im Vergleich. http://www.ier.uni‐stuttgart.de/publikationen/arbeitsberichte/Arbeitsbericht_04.pdf. last checked: 2012‐05‐25.
[63] WABASH. Wabash River Coal Gasification Repowering Project ‐ Final tech‐nical report. Work performed under cooperative agreement DE‐FC‐21‐92MC29210 for the U.S. Department of Energy, Office of Fossil Energy, Na‐tional Energy Technology Laboratory, Morgantown, West Virginia (2000).
[64] WANG, Y., QIU, P., WU, S., LI, Z. (2010). Performance of an Integrated Gasifica‐tion Combined Cycle System with Different System Integration Options. Energy & Fuels, 24, 3, 1925–1930.
[65] WEIß, S., MILITZER, K.‐E., GRAMLICH, K. (2001). Thermische Verfahrens‐technik. Mit 54 Tabellen. [Wiley‐VCH]. [Weinheim]. ISBN/DOI: 3‐342‐00664‐1.
[66] ZUIKER, J. GE Gasification Technology Update. http://www.gasification.org/uploads/downloads/Conferences/2010/35ZUIKER.pdf. last checked: 2012‐05‐25.