346


Advanced PlacementE C O N O M I C SMacroeconomics: Student Activities
3rd edition
John S. Morton
Rae Jean B. Goodman
This publication was made possible through funding by
Authors
John S. Morton is Vice President for Program Development at the National Council on EconomicEducation. Previously, he was a high school economics teacher, director of the Governors StateUniversity Center for Economic Education and president of the Arizona Council on EconomicEducation.
Rae Jean B. Goodman, Director of Teaching and Learning and Professor of Economics, has had morethan 30 years of teaching and administrative experience at the U.S. Naval Academy. She served as atable leader and the Chief Faculty Consultant for the Advanced Placement Economics Examinationsfrom 1989 until 1997.
Editor
Melinda Patterson Grenier was a reporter, deputy bureau chief and bureau chief at the print andonline Wall Street Journal. A former teacher, she was also the founding editor and publisher ofThe Wall Street Journal Classroom Edition, an award-winning educational program for high schooleconomics teachers and students.
Artist
Susan A. Mills received her bachelor of fine arts degree in art from the University of Connecticut.She is employed as a Test Publishing Coordinator at Educational Testing Service in Princeton, N.J.
Project Director
Claire Melican is Vice President for Program Administration at the National Council on EconomicEducation. In addition to teaching economics at the college level, Claire has worked at the EducationalTesting Service where she was instrumental in the development and implementation of the AdvancedPlacement Examinations in Economics until 2000.
Production
Book design and composition by World Composition Services, Inc., Sterling, Virginia.Printed by PMR Printing, Inc., Sterling, Virginia
Authors
Copyright © 2003, National Council on Economic Education, 1140 Avenue of the Americas, New York, N.Y.10036. All rights reserved. Some material in this publication was previously published in Advanced PlacementEconomics, © 1996 by the National Council on Economic Education. No part of this book may be kept in aninformation storage or retrieval system, transmitted or reproduced in any form or by any means withoutpermission in writing from the publisher. Printed in the United States of America.
ISBN: 1-56183-567-6
Advanced Placement Economics Macroeconomics: Student Activities © National Council on Economic Education, New York, N.Y. iii
Unit 1 Basic Economic ConceptsKey Ideas 3
Activity 1 Scarcity, Opportunity Cost and Production Possibilities Curves 5
Activity 2 Opportunity Cost and Comparative Advantage 9
Activity 3 Demand Curves, Movements Along Demand Curves and Shifts in Demand Curves 15
Activity 4 Reasons for Changes in Demand 19
Activity 5 Supply Curves, Movements Along Supply Curves and Shifts in Supply Curves 21
Activity 6 Reasons for Changes in Supply 25
Activity 7 Equilibrium Price and Equilibrium Quantity 27
Activity 8 Elasticity: An Introduction 33
Sample Multiple-Choice Questions 39
Sample Short Free-Response Questions 47
Sample Long Free-Response Questions 51
Unit 2 Measuring Economic PerformanceKey Ideas 59
Activity 9 Test of Macroeconomic Thinking 61
Activity 10 Understanding the Circular Flow of the Macroeconomy 63
Activity 11 Measuring Broad Economic Goals 65
Activity 12 All About GDP 71
Activity 13 Price Indexes 75
Activity 14 Inflation Game: Royalty for a Day 77
Activity 15 Who Is Hurt and Who Is Helped by Unanticipated Inflation? 81
Activity 16 Types of Unemployment 85
Activity 17 The Business Cycle 87
Activity 18 Test Your Understanding of Macroeconomic Indicators 93
Sample Multiple-Choice Questions 95
Sample Short Free-Response Questions 99
Sample Long Free-Response Questions 103
Unit 3 Aggregate Demand and Aggregate Supply:Fluctuations in Outputs and PricesKey Ideas 107
Activity 19 Keynesian Equilibrium 109
aMacroeconomics | ContentsMacroeconomics | Contents❖
Activity 20 Practice with APC, APS, MPC and MPS 111
Activity 21 The Magic of the Multiplier 113
Activity 22 Investment Demand 119
Activity 23 An Introduction to Aggregate Demand 123
Activity 24 An Introduction to Short-Run Aggregate Supply 127
Activity 25 Short-Run Equilibrium Price Level and Output 131
Activity 26 Reconciling the Keynesian Aggregate Expenditure Model with the AggregateDemand and Aggregate Supply Model 135
Activity 27 Manipulating the AD and AS Model: Exogenous Demand and Supply Shocks 137
Activity 28 The Macroeconomic Model: Short Run to Long Run 143
Activity 29 Long-Run Aggregate Supply (LRAS) and the Production Possibilities Curve (PPC) 147
Activity 30 The Tools of Fiscal Policy 151
Activity 31 Discretionary and Automatic Fiscal Policy 155
Activity 32 Two Ways to Analyze Fiscal Policy 157
Activity 33 Analyzing the Macroeconomy 159
Sample Multiple-Choice Questions 163
Sample Short Free-Response Questions 169
Sample Long Free-Response Questions 173
Unit 4 Money, Monetary Policy and Economic StabilityKey Ideas 181
Activity 34 Money 183
Activity 35 What’s All This About the Ms? 187
Activity 36 The Monetary Equation of Exchange 191
Activity 37 The Multiple Expansion of Checkable Deposits 195
Activity 38 The Federal Reserve: The Mechanics of Monetary Policy 199
Activity 39 The Money Market 205
Activity 40 The Federal Reserve: Monetary Policy and Macroeconomics 209
Activity 41 Real Interest Rates and Nominal Interest Rates 213
Activity 42 Monetary Policy 219
Sample Multiple-Choice Questions 223
Sample Short Free-Response Questions 227
Sample Long Free-Response Questions 231
iv Advanced Placement Economics Macroeconomics: Student Activities © National Council on Economic Education, New York, N.Y.
aMacroeconomics | ContentsMacroeconomics | Contents❖
Unit 5 Monetary and Fiscal Policy Combinations: Stabilization Policy in the Real WorldKey Ideas 237
Activity 43 Monetary and Fiscal Policy 239
Activity 44 Crowding-Out: A Graphical Representation 241
Activity 45 Graphing Monetary and Fiscal Policy Interactions 245
Activity 46 Short-Run Phillips Curve 249
Activity 47 Economic Growth and the Determinants of Productive Capacity 255
Activity 48 Why Economists Disagree 261
Sample Multiple-Choice Questions 267
Sample Short Free-Response Questions 271
Sample Long Free-Response Questions 275
Unit 6 International EconomicsKey Ideas 283
Activity 49 Determining Comparative Advantage 285
Activity 50 Economic Efficiency and Gains from Trade 289
Activity 51 Barriers to Trade 293
Activity 52 Imbalance of Payments 301
Activity 53 Exchange Rates 305
Activity 54 How Monetary and Fiscal Policies Affect Exchange Rates 309
Activity 55 The International Way of Thinking 315
Sample Multiple-Choice Questions 321
Sample Short Free-Response Questions 325
Sample Long Free-Response Questions 331
Advanced Placement Economics Macroeconomics: Student Activities © National Council on Economic Education, New York, N.Y. v
aMacroeconomics | ContentsMacroeconomics | Contents❖


Macroeconomics | Unit 1Macroeconomics | Unit 1
Basic Economic Concepts


Advanced Placement Economics Macroeconomics: Student Activities © National Council on Economic Education, New York, N.Y. 3
1 Macroeconomics KEY IDEASUNIT
■ Scarcity exists because we have limitedresources and unlimited wants. No societyhas ever had enough resources to produce allthe goods and services its members wanted.
■ Because of scarcity, all decisions involvecosts.
■ Opportunity cost is the forgone benefit ofthe next best alternative when resources areused for one purpose rather than another.
■ A production possibilities curve graphicallyillustrates scarcity, choices and opportunitycosts.
■ The slope of a production possibilities curveshows the opportunity cost of producingone more unit of one good in terms of theamount of the other good that must begiven up.
■ The law of comparative advantage showshow everyone can gain through trade byspecializing in producing the good or servicewith the lowest opportunity cost.
■ In a market system, resources are allocatedin response to relative prices.
■ A demand curve shows all the prices andquantities at which consumers are willingand able to purchase a good or service. Thelaw of demand states that consumers willwant to buy more at a lower price and less ata higher price.
■ There is a difference between a change indemand and a change in quantity demand-ed. A change in quantity demanded is amovement along the demand curve and canbe caused only by a change in the price ofthe good or service. At a lower price, a largerquantity is demanded. A change in demandis a shift in the curve whereby more or less isdemanded at every price. Changes in prefer-
ences, incomes, expectations, population, orthe prices of complementary or substitutegoods will cause a change in demand.
■ A supply curve shows all the prices andquantities at which producers are willingand able to sell a good or service. Producerswant to sell more at a higher price and less ata lower price.
■ There is a difference between a change insupply and a change in quantity supplied. Achange in quantity supplied is a movementalong the supply curve and can be causedonly by a change in the price of the good orservice. At a lower price, a smaller quantity issupplied. A change in supply is a shift of thecurve whereby more or less is supplied atevery price. A change in technology, in pro-duction costs or in the number of sellers(firms) will cause a change in supply.
■ In competitive markets, supply and demandschedules are the sum of many individualdecisions to sell and to buy. The interactionof supply and demand determines the priceand quantity that will clear the market. Theprice where the quantity supplied and quan-tity demanded are equal is called the equilib-rium or market-clearing price.
■ Equilibrium prices and quantities are deter-mined as follows: At a price higher thanequilibrium, there is a surplus and pressureon sellers to lower their prices. At a pricelower than equilibrium, there is a shortageand pressure on buyers to offer higherprices.
■ In a market economy, prices provide informa-tion, allocate resources and act as rationingdevices. It is important to know how to illus-trate a wide range of situations with supplyand demand graphs.

1 Macroeconomics KEY IDEAS UNIT
■ Price elasticity of demand refers to how muchthe quantity demanded changes in relation toa given change in price. If the percentagechange in quantity demanded is greater thanthe percentage change in price, the demandfor the good is considered elastic. If the per-
centage change in quantity demanded is lessthan the percentage change in price, thedemand for the good is considered inelastic. Ifthe percentage change in price is equal to thepercentage change in quantity demanded, thedemand for the good is considered unit elastic.
4 Advanced Placement Economics Macroeconomics: Student Activities © National Council on Economic Education, New York, N.Y.
1 Macroeconomics LESSON 1 ■ ACTIVITY 1UNIT
Advanced Placement Economics Macroeconomics: Student Activities © National Council on Economic Education, New York, N.Y. 5
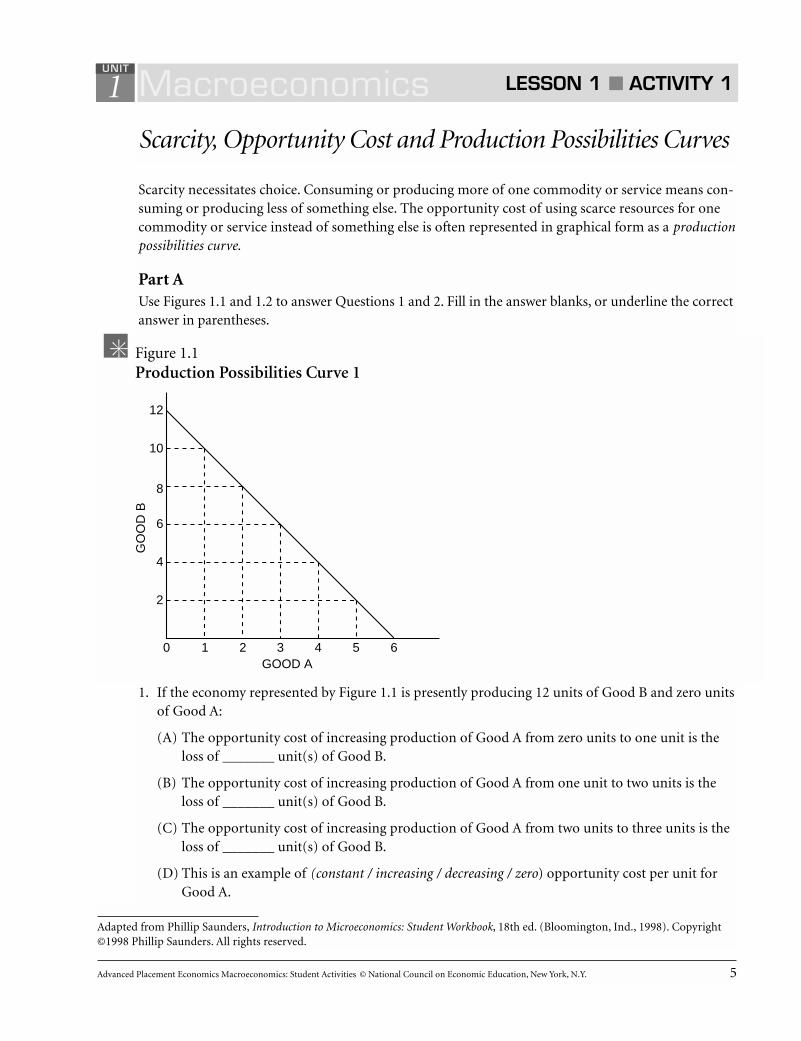
Scarcity necessitates choice. Consuming or producing more of one commodity or service means con-suming or producing less of something else. The opportunity cost of using scarce resources for onecommodity or service instead of something else is often represented in graphical form as a productionpossibilities curve.
Part AUse Figures 1.1 and 1.2 to answer Questions 1 and 2. Fill in the answer blanks, or underline the correctanswer in parentheses.
1. If the economy represented by Figure 1.1 is presently producing 12 units of Good B and zero unitsof Good A:
(A) The opportunity cost of increasing production of Good A from zero units to one unit is theloss of _______ unit(s) of Good B.
(B) The opportunity cost of increasing production of Good A from one unit to two units is theloss of _______ unit(s) of Good B.
(C) The opportunity cost of increasing production of Good A from two units to three units is theloss of _______ unit(s) of Good B.
(D) This is an example of (constant / increasing / decreasing / zero) opportunity cost per unit forGood A.
Scarcity, Opportunity Cost and Production Possibilities Curves
Adapted from Phillip Saunders, Introduction to Microeconomics: Student Workbook, 18th ed. (Bloomington, Ind., 1998). Copyright©1998 Phillip Saunders. All rights reserved.
10
12
210 3GOOD A
GO
OD
B
4 5 6
6
8
2
4
Figure 1.1Production Possibilities Curve 1

6 Advanced Placement Economics Macroeconomics: Student Activities © National Council on Economic Education, New York, N.Y.
1
2. If the economy represented in Figure 1.2 is presently producing 12 units of Good B and zero unitsof Good A:
(A) The opportunity cost of increasing production of Good A from zero units to one unit is theloss of _______ unit(s) of Good B.
(B) The opportunity cost of increasing production of Good A from one unit to two units is theloss of _______ unit(s) of Good B.
(C) The opportunity cost of increasing production of Good A from two units to three units is theloss of ________ unit(s) of Good B.
(D) This is an example of (constant / increasing / decreasing / zero) opportunity cost per unit forGood A.
Macroeconomics LESSON 1 ■ ACTIVITY 1 (continued)
UNIT
10
12
10GOOD A
GO
OD
B
2 3
6
8
2
4
Figure 1.2Production Possibilities Curve 2

Advanced Placement Economics Macroeconomics: Student Activities © National Council on Economic Education, New York, N.Y. 7
1Part BUse the axes in Figures 1.3 and 1.4 to draw the type of curve that illustrates the label above each axis.
Macroeconomics LESSON 1 ■ ACTIVITY 1 (continued)
UNIT
GOOD A
Increasing opportunity cost per unit of Good B
GO
OD
B
Figure 1.3Production Possibilities Curve 3
GOOD A
Constant opportunity cost per unit of Good B
GO
OD
B
Figure 1.4Production Possibilities Curve 4

8 Advanced Placement Economics Macroeconomics: Student Activities © National Council on Economic Education, New York, N.Y.
1Part CUse Figure 1.5 to answer the next five questions. Each question starts with Curve BB' as a country’sproduction possibilities curve.
3. Suppose there is a major technological breakthrough in the consumer-goods industry, and thenew technology is widely adopted. Which curve in the diagram would represent the new produc-tion possibilities curve? (Indicate the curve you choose with two letters.) __________
4. Suppose a new government comes into power and imposes a significant tax on the use of auto-mated machinery and modern production techniques in all industries. Which curve in the diagramwould represent the new production possibilities curve? (Indicate the curve you choose with twoletters.) __________
5. Suppose massive new sources of oil and coal are found within the economy, and there are majortechnological innovations in both industries. Which curve in the diagram would represent thenew production possibilities curve? (Indicate the curve you choose with two letters.) __________
6. If BB' represents a country’s current production possibilities curve, what can you say about a pointlike X? (Write a brief statement.)
7. If BB' represents a country’s current production possibilities curve, what can you say about a pointlike Y? (Write a brief statement.)
Macroeconomics LESSON 1 ■ ACTIVITY 1 (continued)
UNIT
B
C
A´CONSUMER GOODS
CA
PIT
AL
GO
OD
S
B´ D´ C´
A
Y
X
Figure 1.5Production Possibilities Curve: Capital Goods and Consumer Goods

Advanced Placement Economics Macroeconomics: Student Activities © National Council on Economic Education, New York, N.Y. 9
1 Macroeconomics LESSON 1 ■ ACTIVITY 2UNIT
People who don’t know much about economics often dismiss economics as being little more thancost/benefit analysis. While it is true that this is a very important concept, economics is not that sim-ple. In fact, one of the most difficult concepts in economics is understanding the opportunity cost ofchoosing a particular action.
We have seen that economic entities such as countries often face increasing opportunity costs as they tryto increase production. For instance, when a country finds itself at war and needs to increase its pro-duction of armaments, at first it finds that increasing military production comes at a relatively low oppor-tunity cost, as the first factories converted to military use are generally well-suited for such an event.
As the war goes on, however, we see factories that are not at all well-suited to producing weaponsbeing converted to military use, at a very high opportunity cost. Little is added to the output of arma-ments, and a great deal is sacrificed in terms of consumer goods.
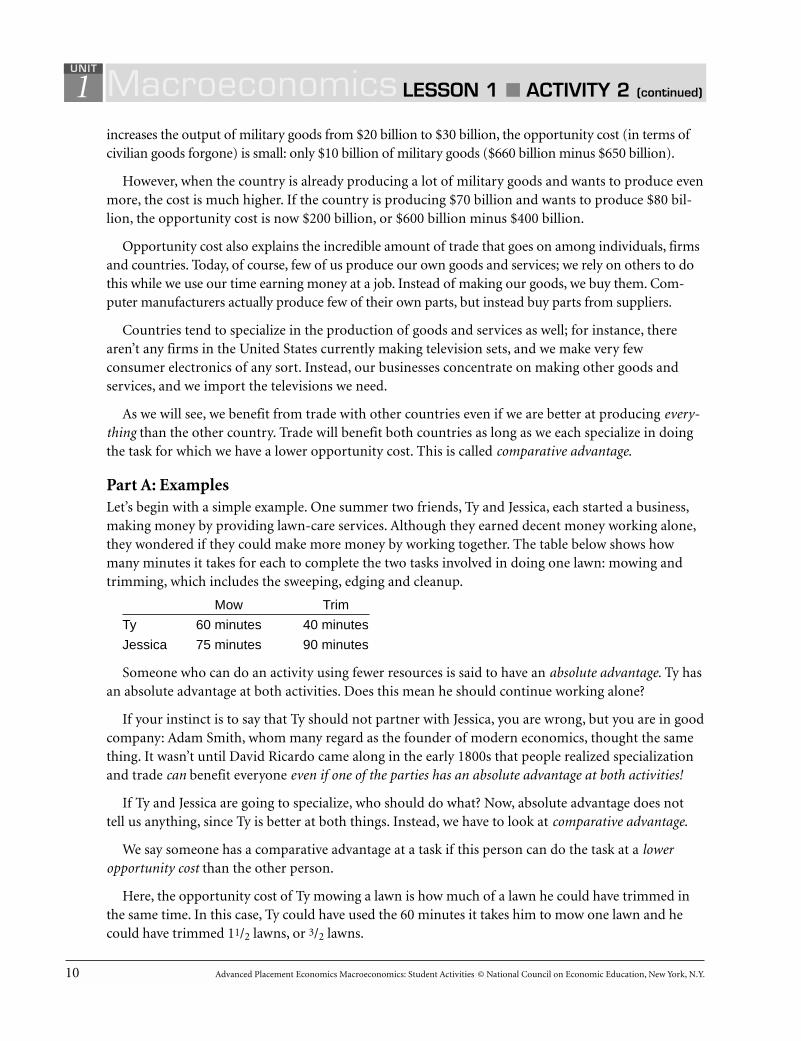
The notion of increasing opportunity costs is manifested in a production possibilities curve that isconcave towards the origin. In Figure 2.1, we can see that as we increase the production of military goods,each additional unit of output costs more in terms of civilian goods. When the government initially
Opportunity Cost and Comparative Advantage
CIVILIAN GOODS IN BILLIONS OF DOLLARS
MIL
ITA
RY
GO
OD
S IN
BIL
LIO
NS
OF
DO
LLA
RS
450
500
550
600500
100
150
200
250
300
350
400
650
700
660
20
10
30
40
50
60
70
80
90
Figure 2.1Production Possibilities Curve: Military and Civilian Goods
Activity written by Ike Brannon, Joint Economic Committee, U.S. Senate, Washington, D.C.
10 Advanced Placement Economics Macroeconomics: Student Activities © National Council on Economic Education, New York, N.Y.
1 Macroeconomics LESSON 1 ■ ACTIVITY 2 (continued)
UNIT
increases the output of military goods from $20 billion to $30 billion, the opportunity cost (in terms ofcivilian goods forgone) is small: only $10 billion of military goods ($660 billion minus $650 billion).
However, when the country is already producing a lot of military goods and wants to produce evenmore, the cost is much higher. If the country is producing $70 billion and wants to produce $80 bil-lion, the opportunity cost is now $200 billion, or $600 billion minus $400 billion.
Opportunity cost also explains the incredible amount of trade that goes on among individuals, firmsand countries. Today, of course, few of us produce our own goods and services; we rely on others to dothis while we use our time earning money at a job. Instead of making our goods, we buy them. Com-puter manufacturers actually produce few of their own parts, but instead buy parts from suppliers.
Countries tend to specialize in the production of goods and services as well; for instance, therearen’t any firms in the United States currently making television sets, and we make very fewconsumer electronics of any sort. Instead, our businesses concentrate on making other goods andservices, and we import the televisions we need.
As we will see, we benefit from trade with other countries even if we are better at producing every-thing than the other country. Trade will benefit both countries as long as we each specialize in doingthe task for which we have a lower opportunity cost. This is called comparative advantage.
Part A: ExamplesLet’s begin with a simple example. One summer two friends, Ty and Jessica, each started a business,making money by providing lawn-care services. Although they earned decent money working alone,they wondered if they could make more money by working together. The table below shows howmany minutes it takes for each to complete the two tasks involved in doing one lawn: mowing andtrimming, which includes the sweeping, edging and cleanup.
Mow Trim
Ty 60 minutes 40 minutes
Jessica 75 minutes 90 minutes
Someone who can do an activity using fewer resources is said to have an absolute advantage. Ty hasan absolute advantage at both activities. Does this mean he should continue working alone?
If your instinct is to say that Ty should not partner with Jessica, you are wrong, but you are in goodcompany: Adam Smith, whom many regard as the founder of modern economics, thought the samething. It wasn’t until David Ricardo came along in the early 1800s that people realized specializationand trade can benefit everyone even if one of the parties has an absolute advantage at both activities!
If Ty and Jessica are going to specialize, who should do what? Now, absolute advantage does nottell us anything, since Ty is better at both things. Instead, we have to look at comparative advantage.
We say someone has a comparative advantage at a task if this person can do the task at a loweropportunity cost than the other person.
Here, the opportunity cost of Ty mowing a lawn is how much of a lawn he could have trimmed inthe same time. In this case, Ty could have used the 60 minutes it takes him to mow one lawn and hecould have trimmed 11/2 lawns, or 3/2 lawns.

Advanced Placement Economics Macroeconomics: Student Activities © National Council on Economic Education, New York, N.Y. 11
1 Macroeconomics LESSON 1 ■ ACTIVITY 2 (continued)
UNITUNIT
For Jessica, the opportunity cost of mowing one lawn is what she could have trimmed during the 75minutes she needed to mow that lawn. Jessica could have trimmed only 5/6 (or 75/90) of a lawn. Thus, wecan see that Jessica has a comparative advantage in mowing lawns because Jessica’s opportunity cost ofmowing a lawn is lower than Ty’s: Five-sixths of a lawn trimmed is less than 3/2 lawns trimmed.
Now, we can calculate their opportunity cost to trim lawns. It takes Ty 40 minutes to trim onelawn, and with these 40 minutes he could instead have mowed 2/3 of a lawn (or 40/60). For Jessica,instead of using 90 minutes to trim one lawn, she could have spent these 90 minutes mowing onelawn and 1/5 of another lawn (90/75). Thus, Ty has a comparative advantage in trimming lawns. Thetable below shows the relative opportunity costs.
Opportunity cost of Opportunity cost ofmowing one lawn trimming one lawn
Ty 3/2 lawn trimmed 2/3 lawn mowed
Jessica 5/6 lawn trimmed 6/5 lawn mowed
Notice two things about our calculation of opportunity cost: First, Ty’s opportunity cost of mowingone lawn (3/2 lawns trimmed) is the reciprocal of his opportunity cost of trimming one lawn (2/3). Thiswill always be true, so in this example we did twice as much math as we would normally have to.
Second, notice that each person has a comparative advantage in precisely one activity. Unless aperson is equally able at both activities, this will always be true as well.
Next, let’s see whether this specialization actually increases their productivity. Before specializing, itwould take Jessica 165 minutes (90 + 75) to mow and trim one lawn and Ty 100 minutes (60 + 40) tomow and trim one lawn, for a total of 265 minutes. If Jessica mows two lawns and Ty trims two lawns,then the total time needed to do two lawns would be 150 (75 x 2) + 80 (40 x 2) minutes or 230 minutes.
Thus, they save 35 minutes, or 13 percent of the total time necessary to do the lawns without specializing.Together, they can do more lawns in a week, and they can split the additional income so both are richer.
Let’s look at one more example. Here, we will express the relative productivity of each person not in thenumber of minutes they need to do the activity but instead in how many activities they can do in an hour.
A few years ago Mark and Doreen were earning extra money installing car stereos for a local elec-tronics store when they decided to go into business for themselves. After they rented a garage, theyhad to decide who should do what activity. The table below describes their productivity in the num-ber of stereos and speakers installed per hour.
Mark Doreen
Radios installed 6 10
Speakers installed 2 5
The table below contains the breakdown of the opportunity cost for each person to do each activity.
Mark Doreen
Installing 1 radio 1/3 speaker 1/2 speaker
Installing 1 speaker 3 radios 2 radios
Mark has the comparative advantage in installing radios, and Doreen has the comparative advan-tage in installing speakers. By specializing, their total output increases.

12 Advanced Placement Economics Macroeconomics: Student Activities © National Council on Economic Education, New York, N.Y.
1 Macroeconomics LESSON 1 ■ ACTIVITY 2 (continued)
UNIT
Part B: Questions1. What is the difference between comparative advantage and absolute advantage?
2. You’re given the following information about a newlywed couple and the time it takes each ofthem to do two different chores: vacuuming a room or washing a load of dishes.
Mike Debbie
Vacuum a room 60 minutes 45 minutes
Wash a load of dishes 30 minutes 45 minutes
(A) What is Mike’s opportunity cost of vacuuming in terms of washing dishes?
(B) What is Mike’s opportunity cost of washing dishes in terms of vacuuming?
(C) What is Debbie’s opportunity cost of vacuuming in terms of washing dishes?
(D) What is Debbie’s opportunity cost of washing dishes in terms of vacuuming?
(E) Who has the absolute advantage in vacuuming? ___________________________
(F) Who has the absolute advantage in washing dishes? ________________________
(G) Who has the comparative advantage in vacuuming? _______________________
(H) Who has the comparative advantage in washing dishes? ____________________
(I) Who should do which chore and why? Base your answer only on the information above andon comparative advantage considerations.
Advanced Placement Economics Macroeconomics: Student Activities © National Council on Economic Education, New York, N.Y. 13
1 Macroeconomics LESSON 1 ■ ACTIVITY 2 (continued)
UNIT
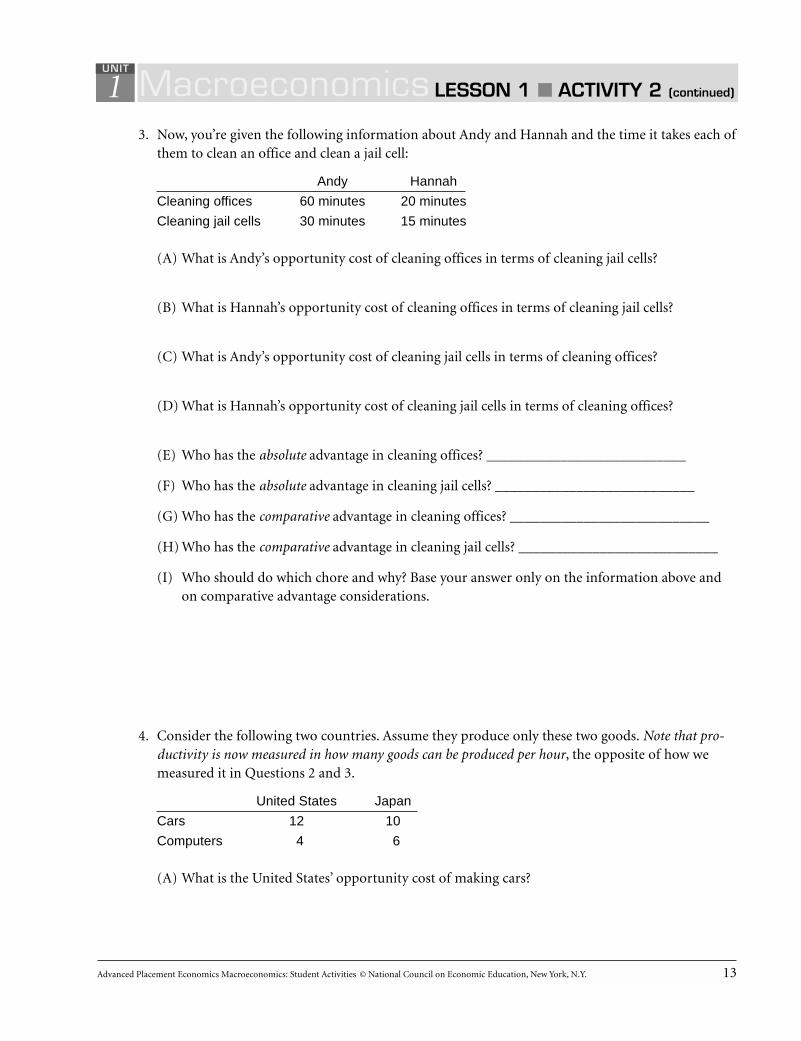
3. Now, you’re given the following information about Andy and Hannah and the time it takes each ofthem to clean an office and clean a jail cell:
Andy Hannah
Cleaning offices 60 minutes 20 minutes
Cleaning jail cells 30 minutes 15 minutes
(A) What is Andy’s opportunity cost of cleaning offices in terms of cleaning jail cells?
(B) What is Hannah’s opportunity cost of cleaning offices in terms of cleaning jail cells?
(C) What is Andy’s opportunity cost of cleaning jail cells in terms of cleaning offices?
(D) What is Hannah’s opportunity cost of cleaning jail cells in terms of cleaning offices?
(E) Who has the absolute advantage in cleaning offices? ___________________________
(F) Who has the absolute advantage in cleaning jail cells? ___________________________
(G) Who has the comparative advantage in cleaning offices? ___________________________
(H) Who has the comparative advantage in cleaning jail cells? ___________________________
(I) Who should do which chore and why? Base your answer only on the information above andon comparative advantage considerations.
4. Consider the following two countries. Assume they produce only these two goods. Note that pro-ductivity is now measured in how many goods can be produced per hour, the opposite of how wemeasured it in Questions 2 and 3.
United States Japan
Cars 12 10
Computers 4 6
(A) What is the United States’ opportunity cost of making cars?

14 Advanced Placement Economics Macroeconomics: Student Activities © National Council on Economic Education, New York, N.Y.
1 Macroeconomics LESSON 1 ■ ACTIVITY 2 (continued)
UNIT
(B) What is Japan’s opportunity cost of making cars?
(C) What is the United States’ opportunity cost of making computers?
(D) What is Japan’s opportunity cost of making computers?
(E) Which country has the absolute advantage in cars? __________________________
(F) Which country has the absolute advantage in computers? __________________________
(G) Which country has the comparative advantage in cars? __________________________
(H) Which country has the comparative advantage in computers? __________________________
(I) Which country should produce which good and why? Base your answer only on the informa-tion above and on comparative advantage considerations.
5. Use the law of comparative advantage to explain why self-sufficiency leads to a lower standard ofliving.

Advanced Placement Economics Macroeconomics: Student Activities © National Council on Economic Education, New York, N.Y. 15
1 Macroeconomics LESSON 2 ■ ACTIVITY 3UNIT
Demand Curves, Movements Along Demand Curves andShifts in Demand CurvesPart AFigure 3.1 shows the market demand for a hypothetical product: Greebes. Study the data, and plot thedemand for Greebes on the axes in Figure 3.2. Label the demand curve D, and answer the questions thatfollow. Write the correct answer in the answer blanks or underline the correct words in parentheses.
1. The data for demand curve D indicate that at a price of $0.30 per Greebe, buyers would be willingto buy _________ million Greebes. Other things constant, if the price of Greebes increased to$0.40 per Greebe, buyers would be willing to buy _________ million Greebes. Such a changewould be a decrease in (demand / quantity demanded). Other things constant, if the price ofGreebes decreased to $0.20, buyers would be willing to buy _________ million Greebes. Such achange would be called an increase in (demand / quantity demanded).
Figure 3.1Demand for Greebes
Price Quantity Demanded($ per Greebe) (millions of Greebes)$.10 350.15 300.20 250.25 200.30 150.35 100.40 50
Figure 3.2Demand for Greebes
.050
.10
.15
.20
.25
.30
.35
.40
.45
.50
.55
QUANTITY (millions of Greebes)
PR
ICE
PE
R G
RE
EB
E
50 100 150 200 250 300 350 400
Adapted from Phillip Saunders, Introduction to Microeconomics: Student Workbook, 18th ed. (Bloomington, Ind., 1998). Copyright©1998 Phillip Saunders. All rights reserved.
16 Advanced Placement Economics Macroeconomics: Student Activities © National Council on Economic Education, New York, N.Y.
1 Macroeconomics LESSON 2 ■ ACTIVITY 3 (continued)
UNIT
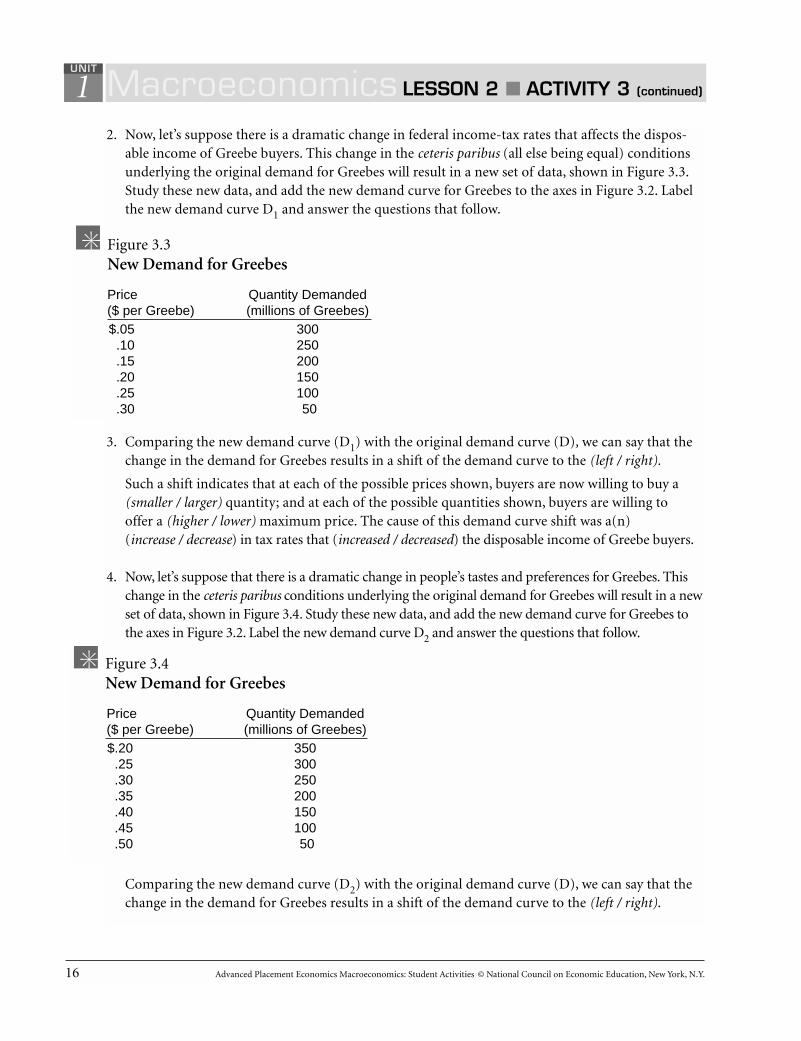
2. Now, let’s suppose there is a dramatic change in federal income-tax rates that affects the dispos-able income of Greebe buyers. This change in the ceteris paribus (all else being equal) conditionsunderlying the original demand for Greebes will result in a new set of data, shown in Figure 3.3.Study these new data, and add the new demand curve for Greebes to the axes in Figure 3.2. Labelthe new demand curve D1 and answer the questions that follow.
3. Comparing the new demand curve (D1) with the original demand curve (D), we can say that thechange in the demand for Greebes results in a shift of the demand curve to the (left / right).
Such a shift indicates that at each of the possible prices shown, buyers are now willing to buy a(smaller / larger) quantity; and at each of the possible quantities shown, buyers are willing to offer a (higher / lower) maximum price. The cause of this demand curve shift was a(n) (increase / decrease) in tax rates that (increased / decreased) the disposable income of Greebe buyers.
4. Now, let’s suppose that there is a dramatic change in people’s tastes and preferences for Greebes. Thischange in the ceteris paribus conditions underlying the original demand for Greebes will result in a newset of data, shown in Figure 3.4. Study these new data, and add the new demand curve for Greebes tothe axes in Figure 3.2. Label the new demand curve D2 and answer the questions that follow.
Comparing the new demand curve (D2) with the original demand curve (D), we can say that thechange in the demand for Greebes results in a shift of the demand curve to the (left / right).
Figure 3.3New Demand for Greebes
Price Quantity Demanded($ per Greebe) (millions of Greebes)$.05 300.10 250.15 200.20 150.25 100.30 50
Figure 3.4New Demand for Greebes
Price Quantity Demanded($ per Greebe) (millions of Greebes)$.20 350.25 300.30 250.35 200.40 150.45 100.50 50
Advanced Placement Economics Macroeconomics: Student Activities © National Council on Economic Education, New York, N.Y. 17
1 Macroeconomics LESSON 2 ■ ACTIVITY 3 (continued)
UNIT
Such a shift indicates that at each of the possible prices shown, buyers are now willing to buy a (smaller / larger) quantity; and at each of the possible quantities shown, buyers are willing to offer a (lower / higher) maximum price. The cause of this shift in the demand curve was a(n)(increase / decrease) in people’s tastes and preferences for Greebes.
Part BNow, to test your understanding, underline the answer you think is the one best alternative in each ofthe following multiple-choice questions.
5. Other things constant, which of the following would not cause a change in the demand (shift inthe demand curve) for mopeds?
(A) A decrease in consumer incomes
(B) A decrease in the price of mopeds
(C) An increase in the price of bicycles, a substitute for mopeds
(D) An increase in people’s tastes and preferences for mopeds
6. “Rising oil prices have caused a sharp decrease in the demand for oil.” Speaking precisely, and usingterms as they are defined by economists, choose the statement that best describes this quotation.
(A) The quotation is correct: An increase in price always causes a decrease in demand.
(B) The quotation is incorrect: An increase in price always causes an increase in demand, not adecrease in demand.
(C) The quotation is incorrect: An increase in price causes a decrease in the quantity demanded,not a decrease in demand.
(D) The quotation is incorrect: An increase in price causes an increase in the quantity demanded,not a decrease in demand.
7. “As the price of domestic automobiles has inched upward, customers have found foreign autos tobe a better bargain. Consequently, domestic auto sales have been decreasing, and foreign auto saleshave been increasing.” Using only the information in this quotation and assuming everything elseconstant, which of the following best describes this statement?
(A) A shift in the demand curves for both domestic and foreign automobiles
(B) A movement along the demand curves for both foreign and domestic automobiles
(C) A movement along the demand curve for domestic autos, and a shift in the demand curve forforeign autos
(D) A shift in the demand curve for domestic autos, and a movement along the demand curve forforeign autos

8. You hear a fellow student say: “Economic markets are like a perpetual see-saw. If demand rises, theprice rises; if price rises, then demand will fall. If demand falls, price will fall; if price falls, demandwill rise and so on forever.” Dispel your friend’s obvious confusion in no more than one shortparagraph below.
1 Macroeconomics LESSON 2 ■ ACTIVITY 3 (continued)
UNIT
18 Advanced Placement Economics Macroeconomics: Student Activities © National Council on Economic Education, New York, N.Y.

Advanced Placement Economics Macroeconomics: Student Activities © National Council on Economic Education, New York, N.Y. 19
1 Macroeconomics LESSON 2 ■ ACTIVITY 4UNIT
Reasons for Changes in DemandPart ARead the eight newspaper headlines in Figure 4.2, and use the table to record the impact, if any, ofeach event on the demand for beef. Use the first column to the right of the headline to show whetherthe event causes a change in demand. Use the next column to record whether the change is an increaseor a decrease in demand. In the third column, decide whether the demand curve shifts left or right.Finally, write the letter for the new demand curve. Use Figure 4.1 to help you. Always start at curve B,and move only one curve at a time. One headline implies that the demand for beef does not change.
Demand If Demand Curve Shifts NewHeadline Shift? (Y / N) Shifts, Inc / Dec Left / Right Curve
1. Price of Beef to Rise in June
2. Millions of Immigrants Swell U.S. Population
3. Pork Prices Drop
4. Surgeon General Warns That Eating Beef Is Hazardous to Health
5. Beef Prices Fall; Consumers Buy More
6. Real Income for U.S. Drops for Third Month
7. Charcoal Shortage Threatens Memorial Day Cookouts
8. Nationwide Fad: The Disco-Burger
Figure 4.1Beef Consumption in May
QUANTITY
PR
ICE
CA B
Figure 4.2
Based on an activity from Master Curriculum Guide in Economics: Teaching Strategies for High School Economics Courses (New York:National Council on Economic Education, 1985), p. 68.

20 Advanced Placement Economics Macroeconomics: Student Activities © National Council on Economic Education, New York, N.Y.
1 Macroeconomics LESSON 2 ■ ACTIVITY 4 (continued)
UNIT
Part BCategorize each change in demand in Part A according to the reason why demand changed. A givendemand curve assumes that consumer expectations, consumer tastes and preferences, the number ofconsumers in the market, the income of consumers, and the prices of substitutes and complementsare unchanged. In the table below, place an X next to the reason that the event described in the head-line caused a change in demand. One headline will have no answer because it is a change in quantitydemanded.
↓ Reason Headline Number → 1 2 3 4 5 6 7 8
A change in consumer expectations
A change in consumer tastes
A change in the number of consumers in the market
A change in income
A change in the price of a substitute good
A change in the price of a complementary good
Figure 4.3

Advanced Placement Economics Macroeconomics: Student Activities © National Council on Economic Education, New York, N.Y. 21
1
Supply Curves, Movements Along Supply Curves and Shifts in Supply CurvesIn this activity and those that follow, we will assume that the long-run supply curve of Greebes is typ-ically upward sloping.
Part AStudy the data in Figure 5.1 and plot the supply of Greebes on the axes in Figure 5.2. Label the supplycurve S and answer the questions that follow. Write the correct answer on the answer blank, or under-line the correct answer in parentheses.
1. The data for supply curve S indicate that at a price of $0.25 per Greebe, suppliers would be willingto offer ___________ million Greebes. Other things constant, if the price of Greebes increased to$0.30 per Greebe, suppliers would be willing to offer ______________ million Greebes. Such achange would be an increase in (supply / quantity supplied).
Macroeconomics LESSON 3 ■ ACTIVITY 5UNIT
Figure 5.1Supply of Greebes
Price Quantity Supplied($ per Greebe) (millions of Greebes)$.15 100.20 150.25 200.30 250.35 300
Figure 5.2Supply of Greebes
.050
.10
.15
.20
.25
.30
.35
.40
.45
.50
.55
QUANTITY (millions of Greebes)
PR
ICE
PE
R G
RE
EB
E
50 100 150 200 250 300 350 400
Adapted from Phillip Saunders, Introduction to Microeconomics: Student Workbook, 18th ed. (Bloomington, Ind., 1998).Copyright © 1998 Phillip Saunders. All rights reserved. Modifications made by Helen Roberts, University of Illinois, Chicago, Ill.

22 Advanced Placement Economics Macroeconomics: Student Activities © National Council on Economic Education, New York, N.Y.
1Other things constant, if the price of Greebes decreased to $0.20 per Greebe, suppliers would be willing to offer _____________ million Greebes. Such a change would be called a decrease in (supply / quantity supplied).
2. Now, let’s suppose that there is a dramatic change in the price of several of the raw materials used inmaking Greebes. This change in the ceteris paribus conditions underlying the original supply ofGreebes will result in a new set of data, such as that shown in Figure 5.3. Study the data, and plot thissupply of Greebes on the axes in Figure 5.2. Label the new supply curve S1 and answer the questionsthat follow.
3. Comparing the new supply curve (S1) with the original supply curve (S), we can say that a changein the supply of Greebes results in a shift of the supply curve to the (left / right). Such a shift indi-cates that at each of the possible prices shown, suppliers are now willing to offer a (smaller / larger)quantity; and at each of the possible quantities shown, suppliers are willing to accept a (higher / lower) minimum price. The cause of this supply curve shift was a(n) (increase / decrease)in prices of several of the raw materials used in making Greebes.
4. Now, let’s suppose that there is a dramatic change in the price of Silopanna, a resource used in theproduction of Greebes. This change in the ceteris paribus conditions underlying the original supply ofGreebes will result in a new set of data shown in Figure 5.4. Study the data, and plot this supply ofGreebes on the axes in Figure 5.2. Label the new supply curve S2 and answer the questions that follow.
Comparing the new supply curve (S2) with the original supply curve (S), we can say that the changein the supply of Greebes results in a shift of the supply curve to the (left / right). Such a shift indi-
Macroeconomics LESSON 3 ■ ACTIVITY 5 (continued)
UNIT
Figure 5.3New Supply of Greebes
Price Quantity Supplied($ per Greebe) (millions of Greebes)$.20 50.25 100.30 150.35 200.40 250
Figure 5.4New Supply of Greebes
Price Quantity Supplied($ per Greebe) (millions of Greebes)$.10 150.15 200.20 250.25 300.30 350

Advanced Placement Economics Macroeconomics: Student Activities © National Council on Economic Education, New York, N.Y. 23
1cates that at each of the possible prices shown, suppliers are now willing to offer a (smaller / larger)quantity; and at each of the possible quantities shown, suppliers are willing to accept a (lower / higher) minimum price. The cause of this supply curve shift is a(n) (increase / decrease)in the price of Silopanna, a resource used in the production of Greebes.
Part BNow, to check your understanding, underline the answer you think is the one best alternative in eachof the following multiple-choice questions.
5. Other things constant, which of the following would not cause a change in the long-run supply ofbeef?
(A) A decrease in the price of beef
(B) A decrease in the price of cattle feed
(C) An increase in the price of cattle feed
(D) An increase in the cost of transporting cattle to market
6. “Falling oil prices have caused a sharp decrease in the supply of oil.” Speaking precisely, and usingterms as they are defined by economists, choose the statement that best describes this quotation.
(A) The quotation is correct: A decrease in price always causes a decrease in supply.
(B) The quotation is incorrect: A decrease in price always causes an increase in supply, not adecrease in supply.
(C) The quotation is incorrect: A decrease in price causes an increase in the quantity supplied,not a decrease in supply.
(D) The quotation is incorrect: A decrease in price causes a decrease in the quantity supplied,not a decrease in supply.
7. A multiyear drought in Florida has dried the land so that rampant wildfires have destroyed manyorange groves. Florida oranges supply much of the nation’s orange juice. Which statement belowis correct?
(A) The price of orange juice will rise because of a movement up the supply curve.
(B) The price of orange juice will rise because the supply curve will shift to the left.
(C) The price of orange juice will fall because of a movement down the supply curve.
(D) The price of orange juice will fall because the supply curve will shift to the right.
8. A popular movie star wears a certain style of sunglasses. If her fans want to copy her look,
(A) the price of the movie star’s brand of sunglasses will rise because of a movement up thesupply curve.
(B) the price of the movie star’s brand of sunglasses will rise because the supply curve will shift tothe left.
(C) the price of the movie star’s brand of sunglasses will fall because of a movement down thesupply curve.
(D) the price of the movie star’s brand of sunglasses will fall because the supply curve will shift tothe right.
Macroeconomics LESSON 3 ■ ACTIVITY 5 (continued)
UNIT


Advanced Placement Economics Macroeconomics: Student Activities © National Council on Economic Education, New York, N.Y. 25
1
Reasons for Changes in SupplyPart ARead the eight newspaper headlines in Figure 6.2, and record the impact, if any, of each event on the supply of cars. Use the first column to the right of the headline to show whether the event willcause a change in supply. Use the next column to record whether the change is an increase or adecrease in supply. In the third column, decide whether the supply curve shifts left or right. Finally,write the letter for the new supply curve. Use Figure 6.1 to help you. Always start at curve B, andmove only one curve at a time. Two headlines imply that the supply of cars does not change.
Supply If Supply Curve Shifts NewHeadline Shift? (Y / N) Shifts, Inc / Dec Left / Right Curve
1. Auto Workers’ Union Agrees to Wage Cuts
2. New Robot Technology Increases Efficiency
3. Nationwide Auto Strike Began at Midnight
4. New Import Quotas Reduce Foreign Car Imports
5. Cost of Steel Rises
6. Auto Producer Goes Bankrupt; Closes Operation
7. Buyers Reject New Models
8. National Income Rises 2%
Macroeconomics LESSON 3 ■ ACTIVITY 6UNIT
Figure 6.1Supply of Foreign and Domestic Cars
QUANTITY
PR
ICE
CA B
Figure 6.2
From Master Curriculum Guide in Economics: Teaching Strategies for High School Economics Courses (New York: National Council onEconomic Education, 1985), p. 69

26 Advanced Placement Economics Macroeconomics: Student Activities © National Council on Economic Education, New York, N.Y.
1Part BCategorize each change in supply in Part A according to the reason why supply changed. In Figure 6.3,place an X next to the reason that the event described in the headline caused a change in supply. Insome cases, more than one headline could be matched to a reason. Two headlines do not indicate ashift in supply.
↓ Reason Headline Number → 1 2 3 4 5 6 7 8
A change in costs of inputs to production process
A change in technology
A change in the number of producers in the market
Government policies
Macroeconomics LESSON 3 ■ ACTIVITY 6 (continued)
UNIT
Figure 6.3
Advanced Placement Economics Macroeconomics: Student Activities © National Council on Economic Education, New York, N.Y. 27
1
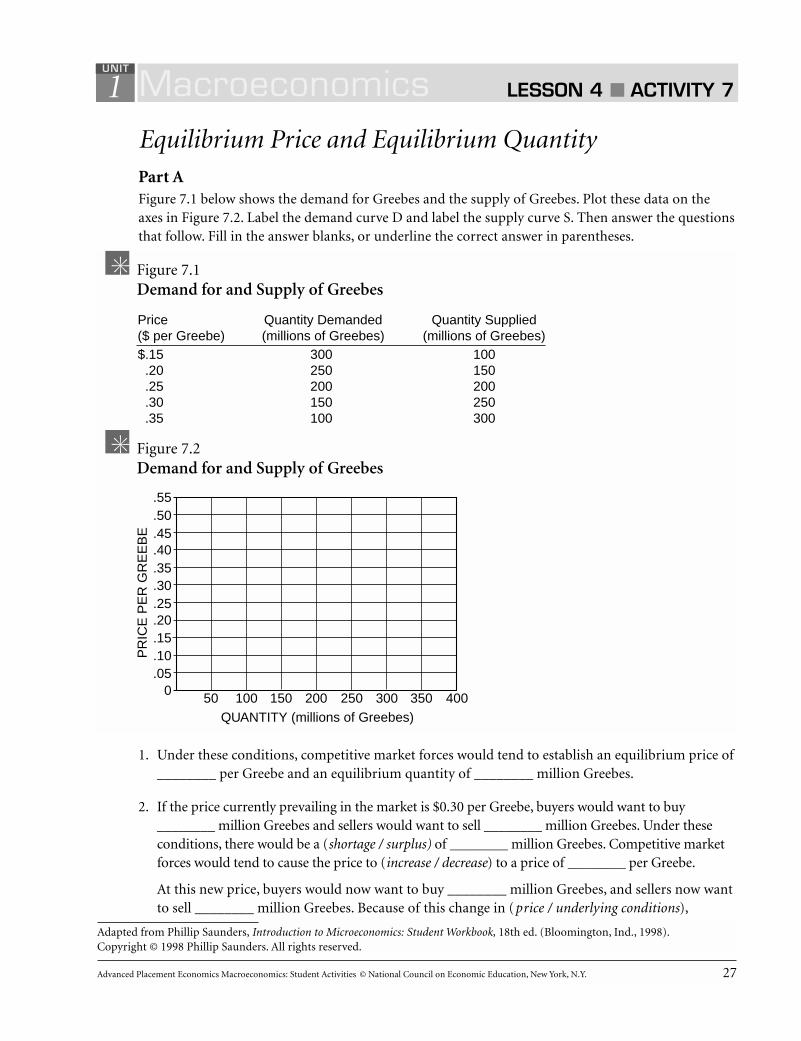
Equilibrium Price and Equilibrium QuantityPart AFigure 7.1 below shows the demand for Greebes and the supply of Greebes. Plot these data on theaxes in Figure 7.2. Label the demand curve D and label the supply curve S. Then answer the questionsthat follow. Fill in the answer blanks, or underline the correct answer in parentheses.
1. Under these conditions, competitive market forces would tend to establish an equilibrium price of________ per Greebe and an equilibrium quantity of ________ million Greebes.
2. If the price currently prevailing in the market is $0.30 per Greebe, buyers would want to buy________ million Greebes and sellers would want to sell ________ million Greebes. Under theseconditions, there would be a (shortage / surplus) of ________ million Greebes. Competitive marketforces would tend to cause the price to (increase / decrease) to a price of ________ per Greebe.
At this new price, buyers would now want to buy ________ million Greebes, and sellers now wantto sell ________ million Greebes. Because of this change in (price / underlying conditions),
Macroeconomics LESSON 4 ■ ACTIVITY 7UNIT
Figure 7.1Demand for and Supply of Greebes
Price Quantity Demanded Quantity Supplied($ per Greebe) (millions of Greebes) (millions of Greebes)$.15 300 100.20 250 150.25 200 200.30 150 250.35 100 300
Figure 7.2Demand for and Supply of Greebes
.050
.10
.15
.20
.25
.30
.35
.40
.45
.50
.55
QUANTITY (millions of Greebes)
PR
ICE
PE
R G
RE
EB
E
50 100 150 200 250 300 350 400
Adapted from Phillip Saunders, Introduction to Microeconomics: Student Workbook, 18th ed. (Bloomington, Ind., 1998).Copyright © 1998 Phillip Saunders. All rights reserved.

28 Advanced Placement Economics Macroeconomics: Student Activities © National Council on Economic Education, New York, N.Y.
1the (demand / quantity demanded) changed by ________ million Greebes, and the (supply / quantity supplied) changed by ________ million Greebes.
3. If the price currently prevailing in the market is $0.20 per Greebe, buyers would want to buy________ million Greebes, and sellers would want to sell ________ million Greebes. Under theseconditions, there would be a (shortage / surplus) of ________ million Greebes. Competitive marketforces would tend to cause the price to (increase / decrease) to a price of ________ per Greebe.At this new price, buyers would now want to buy ________ million Greebes, and sellers now want to sell ________ million Greebes. Because of this change in (price / underlying conditions),the (demand / quantity demanded) changed by ________ million Greebes, and the (supply / quantity supplied) changed by ________ million Greebes.
4. Now, suppose a mysterious blight causes the supply schedule for Greebes to change to the following:
Plot the new supply schedule on the axes in Figure 7.2 and label it S1. Label the new equilibriumE1. Under these conditions, competitive market forces would tend to establish an equilibrium price of________ per Greebe and an equilibrium quantity of ________ million Greebes.
Compared with the equilibrium price in Question 1, we say that because of this change in (price / underlying conditions), the (supply / quantity supplied) changed; and both the equilibriumprice and the equilibrium quantity changed. The equilibrium price (increased / decreased), and theequilibrium quantity (increased / decreased).
5. Now, with the supply schedule at S1, suppose further that a sharp drop in people’s incomes as theresult of a prolonged recession causes the demand schedule to change to the following:
Macroeconomics LESSON 4 ■ ACTIVITY 7 (continued)
UNIT
Figure 7.3New Supply of Greebes
Price Quantity Supplied($ per Greebe) (millions of Greebes)$.20 50.25 100.30 150.35 200
Figure 7.4New Demand for Greebes
Price Quantity Demanded($ per Greebe) (millions of Greebes)$.15 200.20 150.25 100.30 50

Advanced Placement Economics Macroeconomics: Student Activities © National Council on Economic Education, New York, N.Y. 29
1Plot the new demand schedule on the axes in Figure 7.2 and label it D1. Label the new equilibrium
E2. Under these conditions, with the supply schedule at S1 , competitive market forces would tend toestablish an equilibrium price of ____________ per Greebe and an equilibrium quantity of________ million Greebes. Compared with the equilibrium price in Question 4, because of thischange in (price / underlying conditions), the (demand / quantity demanded) changed. Theequilibrium price (increased / decreased), and the equilibrium quantity (increased / decreased).
6. The movement from the first equilibrium price and quantity to the new equilibrium price andquantity is the result of a (price / nonprice) effect.
Part BThe following questions refer to a group of related markets in the United States during a given timeperiod. Assume that the markets are perfectly competitive and that the supply and demand model iscompletely applicable. The figures show the supply and demand in each market before the assumedchange occurs. Trace through the effects of the assumed change, other things constant. Work your wayfrom left to right. Shift only one curve in each market. For each market, draw whatever new supply ordemand curves are needed, labeling each new curve S1 or D1. Then circle the correct symbol undereach diagram (↑ for increase, — for unchanged, and ↓ for decrease). Remember to shift only onecurve in each market.
7. Assume that a new fertilizer dramatically increases the amount of wheat that can be harvestedwith no additional labor or machinery. Also assume that this fertilizer does not affect potato farm-ing and that people are satisfied to eat either bread made from wheat flour or potatoes.
Macroeconomics LESSON 4 ■ ACTIVITY 7 (continued)
UNIT
Figure 7.5Effects of a New Fertilizer
QUANTITY
Wheat
QUANTITY
Bread
PR
ICE
S
D
Demand:
Supply:
Equilibriumprice:
Equilibrium quantity:
S
D
S
D
QUANTITY
Potatoes
PR
ICE
QUANTITY
Wheat HarvestingMachinery
PR
ICE
PR
ICE
S
D

30 Advanced Placement Economics Macroeconomics: Student Activities © National Council on Economic Education, New York, N.Y.
18. Assume that a heavy frost destroys half the world’s coffee crop and that people use more cream in
coffee than they do in tea.
Macroeconomics LESSON 4 ■ ACTIVITY 7 (continued)
UNIT
Figure 7.6Effects of a Loss of Coffee Crop
QUANTITY
Coffee
QUANTITY
Tea
Demand:
Supply:
Equilibrium price:
Equilibrium quantity:
QUANTITY
Cream
QUANTITY
Automatic CoffeeMakers
PR
ICE
S
D
PR
ICE
S
D
PR
ICE
S
D
PR
ICE
S
D
Advanced Placement Economics Macroeconomics: Student Activities © National Council on Economic Education, New York, N.Y. 31
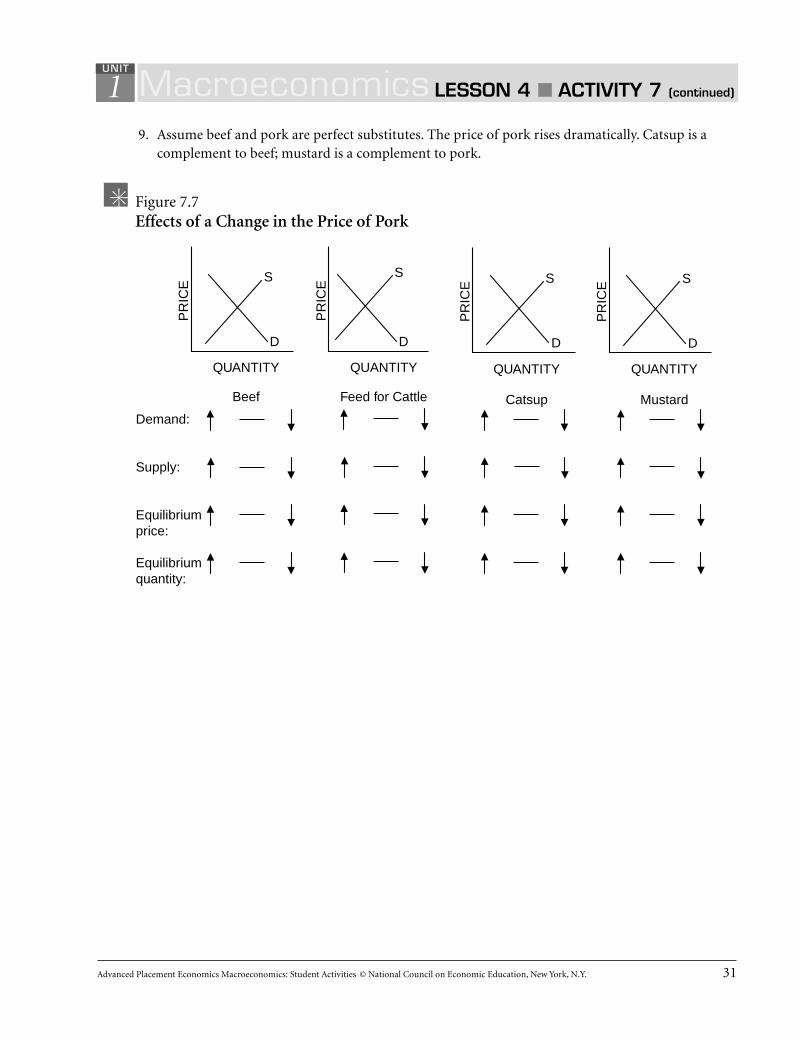
19. Assume beef and pork are perfect substitutes. The price of pork rises dramatically. Catsup is a
complement to beef; mustard is a complement to pork.
Macroeconomics LESSON 4 ■ ACTIVITY 7 (continued)
UNIT
Figure 7.7Effects of a Change in the Price of Pork
QUANTITY
Beef
PR
ICE
S
QUANTITY
Feed for Cattle
PR
ICE
QUANTITY
Catsup
PR
ICE
QUANTITY
Mustard
S
D
S
DD
PR
ICE S
D
Demand:
Supply:
Equilibrium price:
Equilibrium quantity:


Advanced Placement Economics Macroeconomics: Student Activities © National Council on Economic Education, New York, N.Y. 33
1
Elasticity: An IntroductionIn many circumstances, it is not enough for an economist, policymaker, firm or consumer to simplyknow the direction in which a variable will be moving. For example, if I am a producer, the law ofdemand tells me that if I increase the price of my good, the quantity demanded by consumers willdecrease. The law of demand doesn’t tell me what will happen to my total revenue (the price of thegood times the number of units sold), however. Whether total revenue increases or decreases dependson how responsive the quantity demanded is to the price change. Will it decrease a little? A lot?Throughout the discipline of economics, in fact, the responsiveness of one variable to changes inanother variable is an important piece of information. In general, elasticity is a measurement of howresponsive one variable is to a change in another variable — that is, how elastic one variable is given achange in the other, ceteris paribus (that is, holding all other variables constant).
Because elasticity measures responsiveness, changes in the variables are measured relative to somebase or starting point. Consider the following elasticity measurements:
The price elasticity of demand, εd:percentage change in quantity demandedεd = ___________________________________________
percentage change in price
The income elasticity of demand, εd:percentage change in quantity demandedεd = ___________________________________________
percentage change in income
The price elasticity of supply, εs:percentage change in quantity suppliedεs = _________________________________________
percentage change in price
The wage elasticity of labor supply, εls:percentage change in quantity of labor suppliedεls = __________________________________________________
percentage change in wage
Macroeconomics LESSON 5 ■ ACTIVITY 8UNIT
Activity written by Kelly A. Chaston, Davidson College, Davidson, N.C.
34 Advanced Placement Economics Macroeconomics: Student Activities © National Council on Economic Education, New York, N.Y.
1Part AProblems Involving Extra Credit1. Now, suppose that your economics teacher currently allows you to earn extra credit by submitting
answers to the end-of-the-chapter questions in your textbook. The number of questions you’rewilling to submit depends on the amount of extra credit for each question. How responsive youare to a change in the extra-credit points the teacher gives can be represented as an elasticity. Writethe formula for the elasticity of extra-credit problems submitted:
εps = ___________________________
2. Now, consider that your teacher’s goal is to get you to submit twice as many questions:a 100-percent increase. Underline the correct answer in parentheses.
(A) If the number of chapter-end questions you submit is very responsive to a change in extra-credit points, then a given increase in extra credit elicits a large increase in questions submitted. In this case, your teacher will need to increase the extra-credit points by (more than / less than / exactly) 100 percent.
(B) If the number of chapter-end questions you submit is not very responsive to a change inextra-credit points, then a given increase in extra credit elicits a small increase in questions submitted. In this case, your teacher will need to increase the extra-credit points by (more than / less than / exactly) 100 percent.
Macroeconomics LESSON 5 ■ ACTIVITY 8 (continued)
UNIT
Advanced Placement Economics Macroeconomics: Student Activities © National Council on Economic Education, New York, N.Y. 35
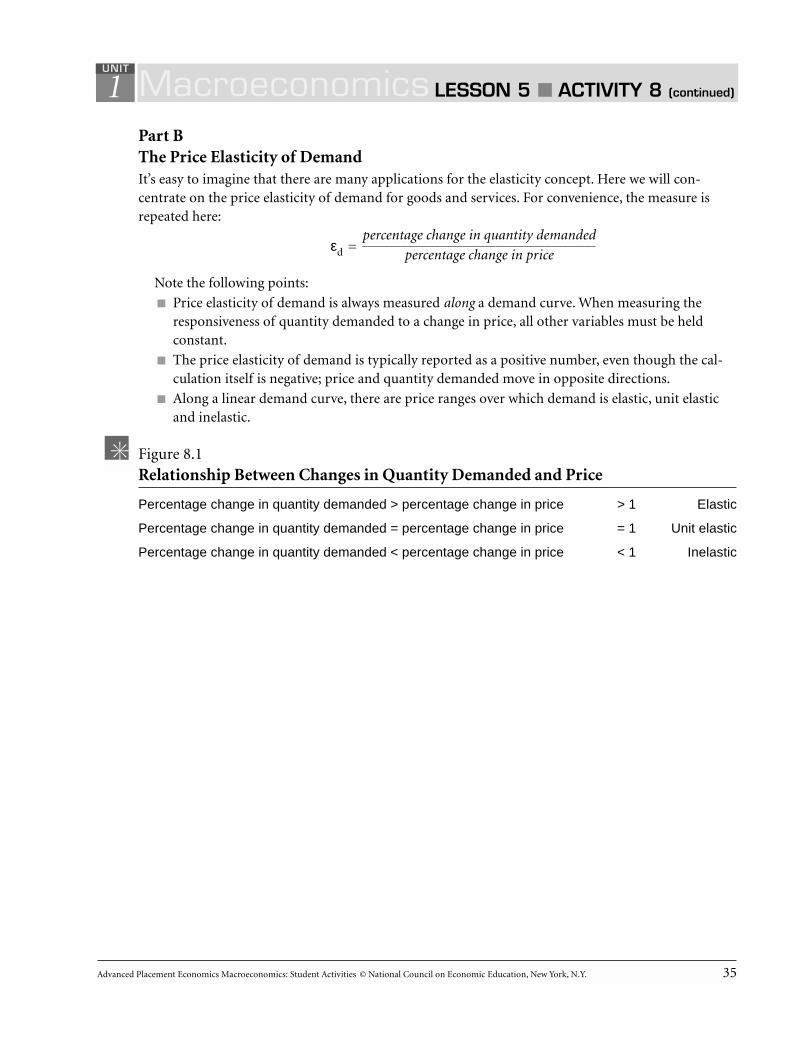
1Part BThe Price Elasticity of DemandIt’s easy to imagine that there are many applications for the elasticity concept. Here we will con-centrate on the price elasticity of demand for goods and services. For convenience, the measure isrepeated here:
percentage change in quantity demandedεd =
__________________________________________percentage change in price
Note the following points:
■ Price elasticity of demand is always measured along a demand curve. When measuring theresponsiveness of quantity demanded to a change in price, all other variables must be heldconstant.
■ The price elasticity of demand is typically reported as a positive number, even though the cal-culation itself is negative; price and quantity demanded move in opposite directions.
■ Along a linear demand curve, there are price ranges over which demand is elastic, unit elasticand inelastic.
Figure 8.1
Relationship Between Changes in Quantity Demanded and Price
Percentage change in quantity demanded > percentage change in price > 1 Elastic
Percentage change in quantity demanded = percentage change in price = 1 Unit elastic
Percentage change in quantity demanded < percentage change in price < 1 Inelastic
Macroeconomics LESSON 5 ■ ACTIVITY 8 (continued)
UNIT

36 Advanced Placement Economics Macroeconomics: Student Activities © National Council on Economic Education, New York, N.Y.
1Part CCalculating the Arc Elasticity CoefficientThe arc elasticity calculation method is obtained when the midpoint or average price and quantityare used in the calculation. This is reflected in the formula below.
Q – Q1 ∆Q__________ __________percentage change in quantity demanded (Q + Q1 ) / 2 (Q + Q1 ) / 2εd = __________________________________________ = _________________ = __________________
percentage change in price P – P1 ∆P__________ __________(P + P1 ) / 2 (P + P1 ) / 2
If we have the consumer or market demand curves, we can precisely calculate the arc elasticityvalue, or coefficient. Suppose that price is increased (decreased) from P to P1 and so quantitydemanded decreases (increases) from Q to Q1.
By making all numbers positive, we’ve in effect taken the absolute values of these changes, and sothe elasticity coefficient will be positive. Note that we have used the average of the two prices and thetwo quantities. We have done this so that the elasticity measured will be the same whether we aremoving from Q to Q1 or the other way around.
Macroeconomics LESSON 5 ■ ACTIVITY 8 (continued)
UNIT
Q1Q
D
P
P1
QUANTITY
PR
ICE
Figure 8.2Calculating the Arc Elasticity Coefficient

Advanced Placement Economics Macroeconomics: Student Activities © National Council on Economic Education, New York, N.Y. 37
1Part DProblems Involving CoffeeSuppose Moonbucks, a national coffee-house franchise, finally moves into the little town of Middle-ofnowhere. Moonbucks is the only supplier of coffee in town and faces the following demand sched-ule each week. Write the correct answer on the answer blanks, or underline the correct answer inparentheses.
3. What is the arc price elasticity of demand when the price changes from $1 to $2? _____
∆Q___________ ________(Q + Q1 ) / 2
εd = _________________ = ________________ = _______________
∆P___________ ________(P + P1 ) / 2
So, over this range of prices, demand is (elastic / unit elastic / inelastic).
4. What is the arc price elasticity of demand when the price changes from $5 to $6? _____
∆Q___________ ________(Q + Q1 ) / 2
εd = _________________ = ________________ = _______________
∆P___________ ________(P + P1 ) / 2
So, over this range of prices, demand is (elastic / unit elastic / inelastic).
Note: Because the relationship between quantity demanded and price is inverse, price elasticity ofdemand would always be negative. Economists believe using negative numbers is confusing whenreferring to “large” or “small” elasticities of demand. Therefore, they use absolute or positive numbers,changing the sign on the negative numbers.
Macroeconomics LESSON 5 ■ ACTIVITY 8 (continued)
UNIT
Figure 8.3Cups of Coffee Demanded per Week
Price Quantity(per cup) Demanded
$6 805 1004 1203 1402 1601 1800 200

38 Advanced Placement Economics Macroeconomics: Student Activities © National Council on Economic Education, New York, N.Y.
1Part ENow, consider Figure 8.4, which graphs the demand schedule given in Figure 8.3.Recall the slope of a line is measured by the rise over the run: slope = rise / run = ∆P / ∆Q.
5. Using your calculations of ∆P and ∆Q from Question 3, calculate the slope of the demand curve._________
6. Using your calculations of ∆P and ∆Q from Question 4, calculate the slope of the demand curve._________
7. The law of demand tells us that an increase in price results in a decrease in the quantity demand-ed. Questions 5 and 6 remind us that the slope of a straight line is constant everywhere along theline. Along this demand curve, a change in price of $1 generates a change in quantity demanded of20 cups of coffee a week.
You’ve now shown mathematically that while the slope of the demand curve is related to elas-ticity, the two concepts are not the same thing. Briefly discuss the relationship between where youare along the demand curve and the elasticity of demand. How does this tie into the notion ofresponsiveness?
Macroeconomics LESSON 5 ■ ACTIVITY 8 (continued)
UNIT
8020 40 60
0
100
120
140
160
180
Demand
QUANTITY
PR
ICE
200
678
109
234
1
5
Figure 8.4Elasticity of Demand for Coffee
Sample Multiple-Choice Questions
Advanced Placement Economics Macroeconomics: Student Activities © National Council on Economic Education, New York, N.Y. 39
Circle the letter of each correct answer.
1. The crucial problem of economics is
(A) establishing a fair tax system.
(B) providing social goods and services.
(C) developing a price mechanism that reflectsthe relative scarcities of products andresources.
(D) allocating scarce productive resources tosatisfy wants.
(E) enacting a set of laws that protectsresources from overuse.
2. When one decision is made, the next best alter-native not selected is called
(A) economic resource.
(B) opportunity cost.
(C) scarcity.
(D) comparative disadvantage.
(E) production.
3. Which of the following is true if the produc-tion possibilities curve is a curved line concaveto the origin?
(A) Resources are perfectly substitutablebetween the production of the two goods.
(B) It is possible to produce more of bothproducts.
(C) Both products are equally capable of satis-fying consumer wants.
(D) The prices of the two products are the same.
(E) As more of one good is produced, more andmore of the other good must be given up.
4. Which of the following is true of the conceptof increasing opportunity cost?
(A) It is unimportant in command economiesbecause of central planning.
(B) It suggests that the use of resources to pro-duce a set of goods and services means thatas more of one is produced, some of theother must be sacrificed.
(C) It is irrelevant if the production possibili-ties curve is convex to the origin.
(D) It suggests that unlimited wants can be ful-filled.
(E) It means that resources are plentiful andopportunities to produce greater amounts ofgoods and services are unlimited.
5. To be considered scarce, an economic resourcemust be which of the following?I. LimitedII. FreeIII. Desirable
(A) I only
(B) I and II only
(C) II and III only
(D) I and III only
(E) I, II and III
6. The basic economic problem is reflected inwhich of the following concepts?I. Opportunity cost II. Production possibilitiesIII. The fallacy of compositionIV. Ceteris paribus
(A) I only
(B) IV only
(C) I and II only
(D) II and III only
(E) II, III and IV only
1 Macroeconomics SAMPLE QUESTIONS MULTIPLE-CHOICE
UNIT

40 Advanced Placement Economics Macroeconomics: Student Activities © National Council on Economic Education, New York, N.Y.
7. Which of the following goods would be con-sidered scarce?I. Education II. Gold III. Time
(A) I only
(B) II only
(C) III only
(D) I and II only
(E) I, II and III
8. The value of the best alternative forgone whena decision is made defines
(A) economic good.
(B) opportunity cost.
(C) scarcity.
(D) trade-off.
(E) comparative advantage.
9. Which of the following problems do alleconomic systems face?I. How to allocate scarce resources among
unlimited wantsII. How to distribute income equally among
all the citizensIII. How to decentralize marketsIV. How to decide what to produce, how to
produce and for whom to produce
(A) I only
(B) I and IV only
(C) II and III only
(D) I, II and III only
(E) I, II, III and IV
10. The opportunity cost of building a new highschool is
(A) the expense of hiring more teachers for thenew high school.
(B) the expense of new desks, chalkboards andbooks for the the new high school.
(C) other goods and services, which must nowbe sacrificed to build the new high school.
(D) overcrowded classrooms.
(E) the bond levy needed to build the new highschool.
11. In which way does a straight line productionpossibilities curve differ from a concave pro-duction possibilities curve?
(A) A straight line production possibilitiescurve has a decreasing opportunity cost.
(B) A straight line production possibilitiescurve has a constant opportunity cost.
(C) A straight line production possibilitiescurve has an increasing opportunity cost.
(D) A straight line production possibilitiescurve does not show opportunity cost.
(E) There is no difference between the twoproduction possibilities curves.
12. The law of increasing opportunity cost isreflected in the shape of the
(A) production possibilities curve concave tothe origin.
(B) production possibilities curve convex tothe origin.
(C) horizontal production possibilities curve.
(D) straight-line production possibilities curve.
(E) upward-sloping production possibilitiescurve.
1 Macroeconomics SAMPLE QUESTIONS MULTIPLE-CHOICE
UNIT
(continued)
Advanced Placement Economics Macroeconomics: Student Activities © National Council on Economic Education, New York, N.Y. 41
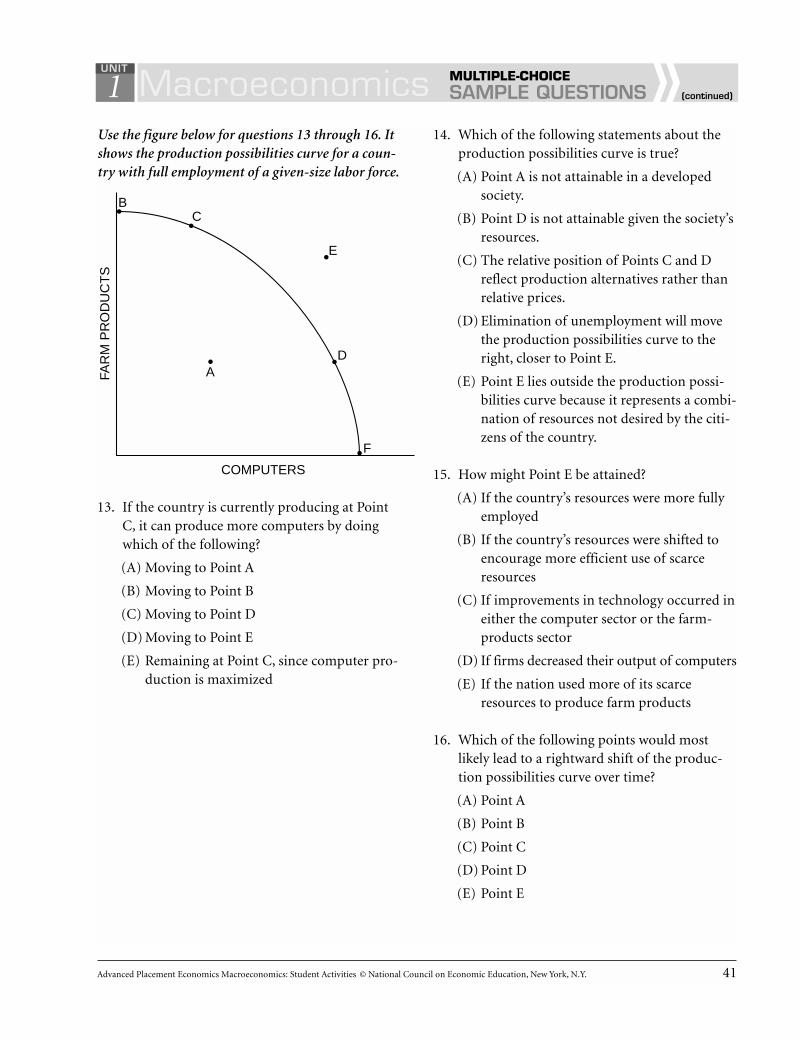
Use the figure below for questions 13 through 16. Itshows the production possibilities curve for a coun-try with full employment of a given-size labor force.
13. If the country is currently producing at PointC, it can produce more computers by doingwhich of the following?
(A) Moving to Point A
(B) Moving to Point B
(C) Moving to Point D
(D) Moving to Point E
(E) Remaining at Point C, since computer pro-duction is maximized
14. Which of the following statements about theproduction possibilities curve is true?
(A) Point A is not attainable in a developedsociety.
(B) Point D is not attainable given the society’sresources.
(C) The relative position of Points C and Dreflect production alternatives rather thanrelative prices.
(D) Elimination of unemployment will movethe production possibilities curve to theright, closer to Point E.
(E) Point E lies outside the production possi-bilities curve because it represents a combi-nation of resources not desired by the citi-zens of the country.
15. How might Point E be attained?
(A) If the country’s resources were more fullyemployed
(B) If the country’s resources were shifted toencourage more efficient use of scarceresources
(C) If improvements in technology occurred ineither the computer sector or the farm-products sector
(D) If firms decreased their output of computers
(E) If the nation used more of its scarceresources to produce farm products
16. Which of the following points would mostlikely lead to a rightward shift of the produc-tion possibilities curve over time?
(A) Point A
(B) Point B
(C) Point C
(D) Point D
(E) Point E
COMPUTERS
FAR
M P
RO
DU
CT
S
BC
E
AD
F
1 Macroeconomics SAMPLE QUESTIONS MULTIPLE-CHOICE
UNIT
(continued)

42 Advanced Placement Economics Macroeconomics: Student Activities © National Council on Economic Education, New York, N.Y.
17. The opportunity cost of producing anadditional unit of product A is
(A) all of the human and capital resources usedto produce product A.
(B) the retail price paid for product A.
(C) the wholesale price of product A.
(D) the amount of product B that cannot nowbe produced because of product A.
(E) the profit that was earned from producingproduct A.
18. Which of the following would cause a leftwardshift of the production possibilities curve?
(A) An increase in unemployment
(B) An increase in inflation
(C) An increase in capital equipment
(D) A decrease in consumer demand
(E) A decrease in working-age population
19. Which of the following would cause anoutward or rightward shift in the productionpossibilities curve?
(A) An increase in unemployment
(B) An increase in inflation
(C) An increase in capital equipment
(D) A decrease in natural resources
(E) A decrease in the number of workers
Use the following table for questions 20, 21 and 22.
Mars Venus_______________ _______________Food Clothing Food Clothing
0* 30 0* 40*2* 24* 4* 32*4* 18* 8* 24*5* 12* 12* 16*8* 6* 16* 8*
10* 0* 20* 0*
Two nations, Mars and Venus, each producefood and clothing. The table above gives pointson each nation’s production possibilities curve.The asterisks indicate their current point ofproduction.
20. In Mars, the opportunity cost of obtaining thefirst two units of food is how many units ofclothing?
(A) 2 (B) 3
(C) 6 (D) 8
(E) 12
21. In Venus, the opportunity cost of the first unit of
(A) food is two units of clothing.
(B) food is eight units of clothing.
(C) clothing is two units of food.
(D) clothing is four units of food.
(E) clothing is eight units of food.
22. Which of the following statements is correct basedon the concept of comparative advantage?
(A) Mars and Venus should continue producingthe quantities indicated by the asterisks.
(B) Mars should specialize in the production offood.
(C) Mars should specialize in the production ofclothing.
(D) Venus has the comparative advantage inclothing.
(E) Mars has an absolute advantage in the pro-duction of food.
1 Macroeconomics SAMPLE QUESTIONS MULTIPLE-CHOICE
UNIT
(continued)

Advanced Placement Economics Macroeconomics: Student Activities © National Council on Economic Education, New York, N.Y. 43
23. The table below shows the number of hoursneeded to produce one bushel of soybeans andone bushel of rice in each of two countries.
One bushel One bushelCountry of soybeans of rice
U.S. 5 hours 7 hoursJapan 15 hours 10 hours
Which of the following statements must betrue?I. The United States has an absolute advan-
tage in producing soybeans.II. Japan has an absolute advantage in
producing rice.III. Japan has a comparative advantage in pro-
ducing soybeans.IV. The United States should specialize in the
production of soybeans and Japan shouldspecialize in the production of rice.
(A) I only
(B) III only
(C) I and IV only
(D) II and IV only
(E) I, II, III and IV
24. If there is an increase in demand for a good,what will most likely happen to the price andquantity of the good exchanged?
Price Quantity
(A) Increase Increase
(B) Increase Decrease
(C) Decrease Decrease
(D) Decrease Increase
(E) No change No change
25. If the demand for a good or service decreases,the equilibrium price and quantity are mostlikely to change in which of the following ways?
Price Quantity
(A) Increase Increase
(B) Increase Decrease
(C) Decrease Decrease
(D) Decrease Increase
(E) No change No change
26. A decrease in the price of silicon chips andincreased production of user-friendly softwarewill affect the price and quantity of computersin which of the following ways?
Price Quantity
(A) Increase Increase
(B) Increase Decrease
(C) Decrease Decrease
(D) Decrease May increase,decrease or remainthe same
(E) May increase, Increasedecrease or re-main the same
27. An improvement in the technology used in theproduction of automobiles and an increase in theneed for automobile transportation will mostlikely cause the price and quantity of automobilesto change in which of the following ways?
Price Quantity
(A) Increase Increase
(B) Increase Decrease
(C) May increase, Increase decrease, or stay the same
(D) Decrease May increase,decrease or remainthe same
(E) Decrease Increase
1 Macroeconomics SAMPLE QUESTIONS MULTIPLE-CHOICE
UNIT
(continued)

44 Advanced Placement Economics Macroeconomics: Student Activities © National Council on Economic Education, New York, N.Y.
28. An increase in the price of peanut butter willcause the demand curve for jelly to shift inwhich of the following directions?
(A) To the right, because peanut butter is a prod-uct that the government says is good for you
(B) To the right, if jelly is purchased by peoplewith lower incomes and peanut butter is aluxury good for them
(C) To the right, if peanut butter and jelly arecomplementary goods
(D) To the left, if peanut butter and jelly arecomplementary goods
(E) To the left, if peanut butter and jelly aresubstitute goods
29. According to the theory of comparative advan-tage, a good should be produced at the pointwhere
(A) its explicit costs are least.
(B) its opportunity costs are least.
(C) the cost of real resources used is least.
(D) production can occur with the greatestincrease in employment.
(E) production can occur with the lowestincrease in employment.
30. An increase in the price of gasoline will mostlikely cause the demand curve for tires tochange in which direction?
(A) To the left, because gasoline and tires aresubstitutes
(B) To the left, because gasoline and tires arecomplements
(C) To the right, because gasoline and tires aresubstitutes
(D) To the right, because gasoline and tires arecomplements
(E) To the right, because an increase in the priceof gasoline makes consumers poorer andthus not willing to pay as much for tires
31. All of the following might reasonably be ex-pected to shift the demand curve for beef to anew position except
(A) a decrease in the price of beef.
(B) a change in people’s tastes with respect tobeef.
(C) an increase in the money incomes of beefconsumers.
(D) a widespread advertising campaign by theproducers of a product competitive withbeef, such as pork.
(E) expectations that beef prices will fall in thefuture.
32. Specialization and trade will not take place inwhich of the following cases?
I. The opportunity costs of making twogoods are the same in both countries.
II. Wartime emergencies completely cut offtrade routes.
III. Tariff barriers increase the delivered cost ofordinary imported goods.
(A) I only
(B) II only
(C) III only
(D) I and II only
(E) I, II and III
1 Macroeconomics SAMPLE QUESTIONS MULTIPLE-CHOICE
UNIT
(continued)
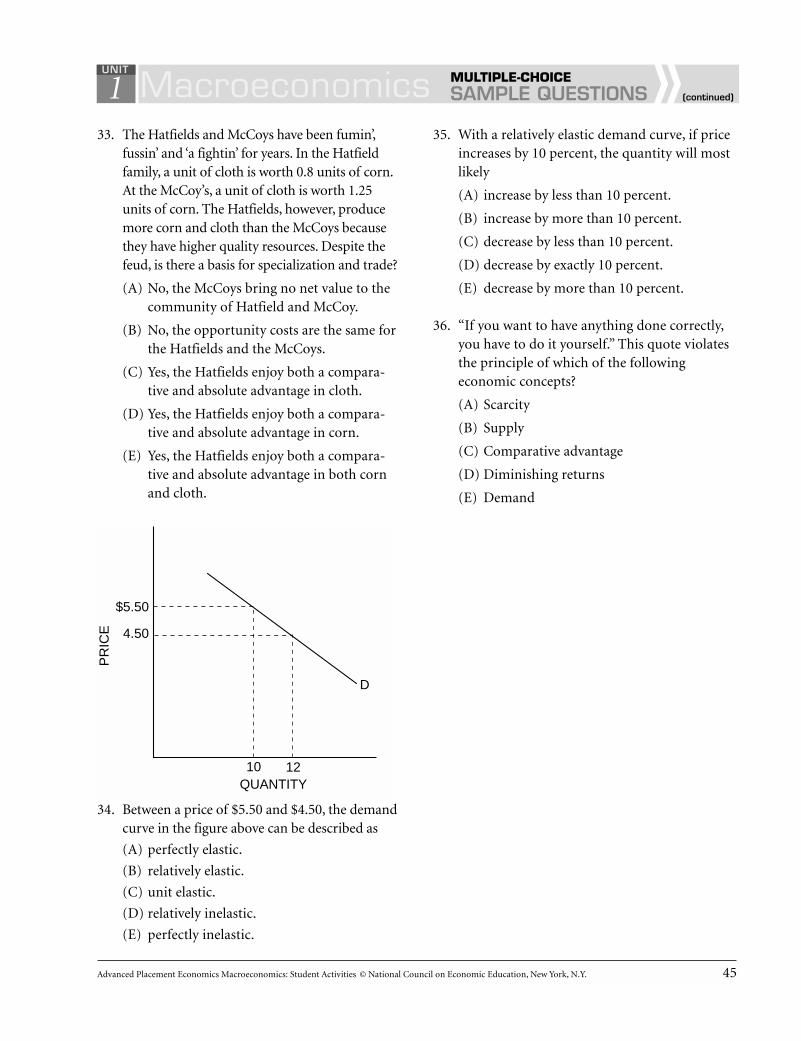
Advanced Placement Economics Macroeconomics: Student Activities © National Council on Economic Education, New York, N.Y. 45
33. The Hatfields and McCoys have been fumin’,fussin’ and ‘a fightin’ for years. In the Hatfieldfamily, a unit of cloth is worth 0.8 units of corn.At the McCoy’s, a unit of cloth is worth 1.25units of corn. The Hatfields, however, producemore corn and cloth than the McCoys becausethey have higher quality resources. Despite thefeud, is there a basis for specialization and trade?
(A) No, the McCoys bring no net value to thecommunity of Hatfield and McCoy.
(B) No, the opportunity costs are the same forthe Hatfields and the McCoys.
(C) Yes, the Hatfields enjoy both a compara-tive and absolute advantage in cloth.
(D) Yes, the Hatfields enjoy both a compara-tive and absolute advantage in corn.
(E) Yes, the Hatfields enjoy both a compara-tive and absolute advantage in both cornand cloth.
34. Between a price of $5.50 and $4.50, the demandcurve in the figure above can be described as
(A) perfectly elastic.
(B) relatively elastic.
(C) unit elastic.
(D) relatively inelastic.
(E) perfectly inelastic.
35. With a relatively elastic demand curve, if priceincreases by 10 percent, the quantity will mostlikely
(A) increase by less than 10 percent.
(B) increase by more than 10 percent.
(C) decrease by less than 10 percent.
(D) decrease by exactly 10 percent.
(E) decrease by more than 10 percent.
36. “If you want to have anything done correctly,you have to do it yourself.” This quote violatesthe principle of which of the followingeconomic concepts?
(A) Scarcity
(B) Supply
(C) Comparative advantage
(D) Diminishing returns
(E) Demand
1 Macroeconomics SAMPLE QUESTIONS MULTIPLE-CHOICE
UNIT
(continued)
D
$4.50
$5.50
QUANTITY
PR
ICE
1210


Advanced Placement Economics Macroeconomics: Student Activities © National Council on Economic Education, New York, N.Y. 47
Sample Short Free-Response Questions1. True, false or uncertain, and explain why? “The economic concept of scarcity is not relevant to the
study of a modern economy such as that of the United States because the existence of unsold stocksof goods (books, cars, homes) is vivid evidence that we are surrounded by plenty, not scarcity.”
2. A newspaper headline says, “The Coldest Winter in 20 Years Brings Record Prices for Heating Oil.”
(A) Using a graph of home heating oil, show and explain how price changed.
(B) What other factors could cause the price of heating oil to increase?
1 Macroeconomics SAMPLE QUESTIONS SHORT FREE-RESPONSE
UNIT

48 Advanced Placement Economics Macroeconomics: Student Activities © National Council on Economic Education, New York, N.Y.
3. In a recent year, the price of wheat fell. For each of the following, draw a supply and demand graphshowing a decrease in prices with the stated impact on quantity.
(A) The quantity of wheat decreasing
(B) The quantity of wheat increasing
(C) The quantity of wheat staying the same
1 Macroeconomics SAMPLE QUESTIONS SHORT FREE-RESPONSE
UNIT
(continued)

Advanced Placement Economics Macroeconomics: Student Activities © National Council on Economic Education, New York, N.Y. 49
4. True, false or uncertain, and explain why? “If you won $1 million in the lottery, you wouldn’t havethe economic problem of scarcity.”
5. Explain what would have to be true in each case for the production possibilities curves to beshaped as they are in Graphs I, II and III.
1 Macroeconomics SAMPLE QUESTIONS SHORT FREE-RESPONSE
UNIT
(continued)
BUTTER
PLA
NE
S
BUTTER
PLA
NE
S
BUTTER
Graph I Graph II Graph III
PLA
NE
S
A AB
BC
CD
D
E
A
B
C
DEE

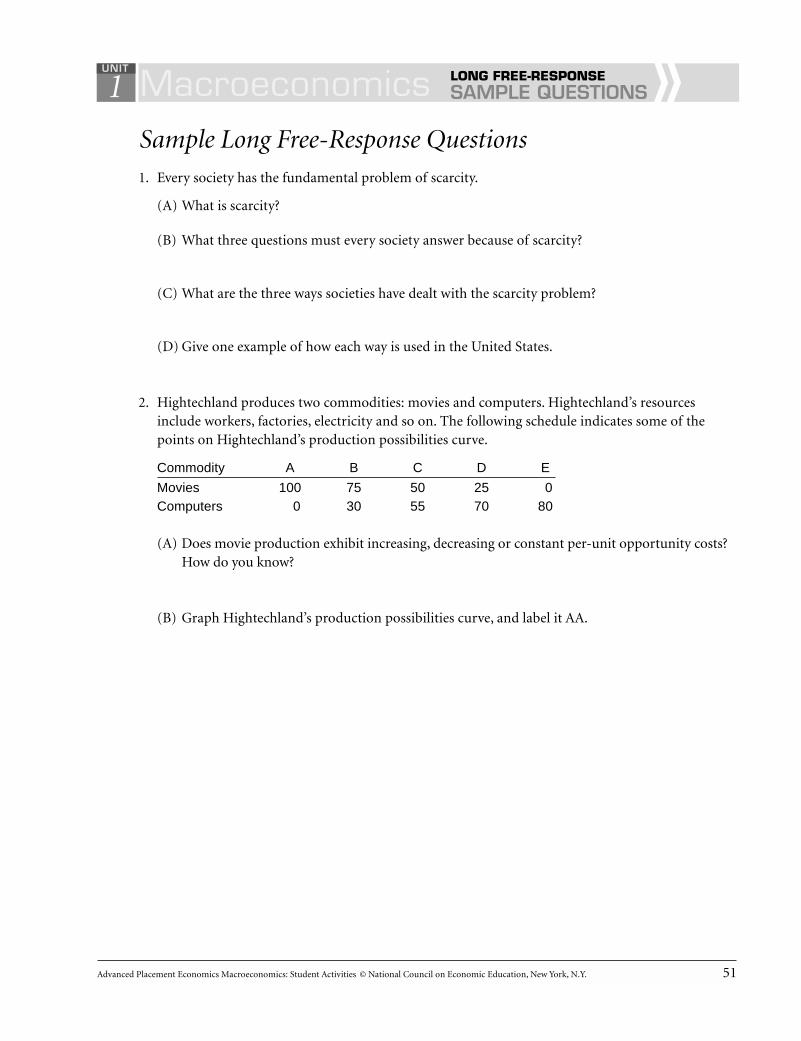
Advanced Placement Economics Macroeconomics: Student Activities © National Council on Economic Education, New York, N.Y. 51
Sample Long Free-Response Questions1. Every society has the fundamental problem of scarcity.
(A) What is scarcity?
(B) What three questions must every society answer because of scarcity?
(C) What are the three ways societies have dealt with the scarcity problem?
(D) Give one example of how each way is used in the United States.
2. Hightechland produces two commodities: movies and computers. Hightechland’s resourcesinclude workers, factories, electricity and so on. The following schedule indicates some of thepoints on Hightechland’s production possibilities curve.
Commodity A B C D E
Movies 100 75 50 25 0Computers 0 30 55 70 80
(A) Does movie production exhibit increasing, decreasing or constant per-unit opportunity costs?How do you know?
(B) Graph Hightechland’s production possibilities curve, and label it AA.
1 Macroeconomics SAMPLE QUESTIONS LONG FREE-RESPONSE
UNIT
52 Advanced Placement Economics Macroeconomics: Student Activities © National Council on Economic Education, New York, N.Y.
(C) Suppose Hightechland is operating at Point C but would like to alter production to Point D.What would be the per-unit opportunity cost of producing more computers?
(D) Suppose Hightechland is operating at Point C but would like to alter production to Point B.What would be the per-unit opportunity cost of producing more movies?
(E) What will happen to Hightechland’s production possibilities curve if many of its movie setsare destroyed by fire? (Assume that the sets are not used in the production of computers.)Using the same graph you drew for Question 2(B), draw Hightechland’s new production pos-sibilities curve and label it BB.
(F) What will happen to Hightechland’s production possibilities curve if all the country’sresources are reduced (perhaps by natural disaster or war)? Using the same graph as inQuestion 2(B), draw Hightechland’s new production possibilities curve and label it CC.
(G) What will happen to Hightechland’s production possibilities curve if technology improvesboth the production of movies and the production of computers? Using the same graph as inQuestion 2(B), draw Hightechland’s new production possibilities curve and label it DD.
1 Macroeconomics SAMPLE QUESTIONS LONG FREE-RESPONSE
UNIT
(continued)

Advanced Placement Economics Macroeconomics: Student Activities © National Council on Economic Education, New York, N.Y. 53
3. The market for many commodities is seasonal in nature. Their sales (equilibrium quantity)increase dramatically during certain times of the year. Christmas cards and fresh strawberries, atleast in the North, are two examples. Christmas card sales increase during the last three months ofthe year, and the sales of fresh strawberries in the North increase during the summer months. Butthe (equilibrium) price movement of these two commodities is quite different during their peaksales season: Christmas cards increase in price during the last three months of the year, whereasstrawberries decrease in price during the summer.
(A) Show on the graph below how there can be an increase in the equilibrium quantity and anincrease in the equilibrium price of Christmas cards during the last three months of the year,and briefly explain what has happened.
(B) Change the graph for fresh strawberries in the North to show how there can be an increase inthe equilibrium quantity and a decrease in the equilibrium price of strawberries in the sum-mer, and briefly explain what has happened.
1 Macroeconomics SAMPLE QUESTIONS LONG FREE-RESPONSE
UNIT
(continued)
Q
S
D
P
QUANTITY
PR
ICE
Christmas Card Market
Q
S
D
P
QUANTITY
PR
ICE
Strawberry Market in the North
54 Advanced Placement Economics Macroeconomics: Student Activities © National Council on Economic Education, New York, N.Y.
4. Explain how each of the following may affect the production possibilities curve of the UnitedStates or the point at which the economy is operating. Draw a production possibilities curve; put“Capital Goods” on the vertical axis and “Consumer Goods” on the horizontal axis. Now, add aPPC curve or point to the graph to illustrate the scenario.
(A) The Congress and the president decide to provide more funding for higher education with more studentsattending college and graduating.
(B) New advances in medicine allow for a healthier lifestyle.
(C) The United States agrees to be a part of a world-trade agreement that will foster international trade.
1 Macroeconomics SAMPLE QUESTIONS LONG FREE-RESPONSE
UNIT
(continued)

Advanced Placement Economics Macroeconomics: Student Activities © National Council on Economic Education, New York, N.Y. 55
(D) The unemployment rate increases inthe economy from 4.2 percent to 5.1percent of the labor force.
(E) Computer viruses are out of control,and efficiency and output in theeconomy fall.
1 Macroeconomics SAMPLE QUESTIONS LONG FREE-RESPONSE
UNIT
(continued)


Macroeconomics | Unit 2Macroeconomics | Unit 2
Measuring Economic Performance


Advanced Placement Economics Macroeconomics: Student Activities © National Council on Economic Education, New York, N.Y. 59
2 Macroeconomics KEY IDEASUNIT
■ Macroeconomics is the study of the econo-my as a whole; microeconomics is the studyof individual parts of the economy such asbusinesses, households and prices. Macro-economics looks at the forest; microeco-nomics looks at the trees.
■ A circular flow diagram illustrates the majorflows of goods and services, resources andincome in an economy. It shows how changesin these flows can alter the level of goods andservices, employment and income.
■ Gross domestic product (GDP) is the mar-ket value of all final goods and services pro-duced in a nation in one year. It is the mostimportant measurement of production andoutput.
■ GDP counts only final goods and services;it does not count intermediate goods andservices.
■ GDP also does not count secondhand goods;the buying and selling of stocks and bonds;and transfer payments such as Social Securi-ty benefits, unemployment compensationand certain interest payments.
■ GDP includes profits earned by foreign-owned businesses and income earned by for-eigners in the United States, but it excludesprofits earned by U.S.-owned companiesoverseas and income earned by U.S. citizenswho work abroad.
■ GDP may be calculated in two ways:
1. Add all the consumption, investmentand government expenditures plus netexports or
2. Add all the incomes received by ownersof productive resources in the economy.
■ Price indexes measure price changes in theeconomy. They are used to compare theprices of a given bundle or market basket of
goods and services in one year with theprices of the same bundle or market basketin another year.
■ A price index has a base year, and the pricelevel in that year is given an index number of 100. The price level in all other years isexpressed in relation to the price level in thebase year.
weighted cost ofbase-period items in
Price current-year pricesindex = _________________ x 100number weighted cost of
base-period items inbase-year prices
■ The most frequently used price indexes arethe GDP price deflator, the consumer priceindex (CPI) and the producer price index(PPI).
■ Real GDP is adjusted for price changes;nominal GDP is not adjusted for pricechanges.
■ Inflation is a general increase in the overallprice level.
■ Savers, lenders and people on fixed incomesgenerally are hurt by unanticipated infla-tion; borrowers gain from unanticipatedinflation.
■ Unemployment occurs when people who arewilling and able to work cannot find jobs atsatisfactory wage rates.
■ Unemployment is classified into three cate-gories: frictional, cyclical and structural.
■ The unemployment rate represents peoplewho are not working but who are activelylooking for a job.
■ Full employment is not defined as zerounemployment because frictional and struc-tural unemployment exist even with zerocyclical unemployment.

60 Advanced Placement Economics Macroeconomics: Student Activities © National Council on Economic Education, New York, N.Y.
■ The unemployment rate at full employmentis called the natural rate of unemployment.
■ The labor force is defined as people whohave a job (employed) and people who areactively looking for a job (unemployed). Thelabor force participation rate is the percent-age of the population over the age of 16 thatis in the labor force.
■ A business cycle describes the ups and downsof economic activity over a period of years.
■ The phases of the business cycle are expan-sion (recovery), peak, contraction(recession) and trough.
2 Macroeconomics KEY IDEASUNIT

Advanced Placement Economics Macroeconomics: Student Activities © National Council on Economic Education, New York, N.Y. 61
2
Test of Macroeconomic ThinkingCircle T for true or F for false in the statements that follow.
T F 1. If a country could maintain a high economic growth rate, the country would eventu-ally be able to satisfy everyone’s wants for goods and services.
T F 2. If all the nations of the world disarmed, the international economy would collapseinto a long depression and unemployment would increase.
T F 3. Money is an important economic resource.
T F 4. The higher the GDP, the better off all the people of the country are.
T F 5. Full employment means zero unemployment.
T F 6. The United States has had an inflation rate of at least 3 percent for each of the last 50years.
T F 7. Unanticipated inflation hurts almost everyone.
T F 8. Money consists mainly of currency and coins and is created by government printingpresses and mints.
T F 9. The value of the dollar is determined by the fact that it is backed by gold.
T F 10. Most economists believe the only purpose of taxes is to provide money forgovernment.
T F 11. The chief task of the Federal Reserve System is to insure the deposits of bankcustomers.
T F 12. Tariffs are needed to protect our standard of living from competition from cheap for-eign labor.
Macroeconomics LESSON 1 ■ ACTIVITY 9UNIT
Activity written by John Morton, National Council on Economic Education, New York, N.Y.


Advanced Placement Economics Macroeconomics: Student Activities © National Council on Economic Education, New York, N.Y. 63
2
Understanding the Circular Flow of the MacroeconomyFirms provide goods and services to households through the product markets. Households pay forthese goods and services with money. Households supply firms with productive resources: labor,land, capital and entrepreneurial skills. Firms pay money income to households. The value of incomefirms pay to households, including the profits that business owners receive, equals the dollar value ofoutput. Firms and households decide how much to buy or sell in the markets for goods andresources. For example, Tran spends $10.00 on school supplies at the market, buying goods and pay-ing with money. The market owner uses the $10.00 to pay part of the salary of Mariko, the cashier.The firm is buying resources and paying for them with money. The $10.00 is now ready to be spent inanother round. Firms and households pay taxes and user fees to the government, which providesthem with some goods and services, such as police protection and national defense.
Macroeconomics LESSON 1 ■ ACTIVITY 10UNIT
Activity written by Helen Roberts, University of Illinois, Chicago, Ill.
Figure 10.1The Circular Flow of Resources, Goods, Services and Money Payments
(4) Money Payments (sales dollars)
THE PRODUCT MARKET
(3) Goods & Services
(2) Productive Resources
THE FACTOR MARKET
(1) Money-Income Payments (wages, rents, interest, profit)
HOUSEHOLDS(RESOURCE
OWNERS)
BUSINESS
FIRMSGOVERNMENT
(5) Taxes
(6) Goods & Services
(7) Taxes
(8) Goods & Services

64 Advanced Placement Economics Macroeconomics: Student Activities © National Council on Economic Education, New York, N.Y.
2 MacroeconomicsLESSON 1 ■ ACTIVITY 10 (continued)
UNIT
Part AEach of the flows in the circular flow diagram in Figure 10.1 is numbered. Identify which numbermatches the transaction described in the statements below. Consider only the first transaction — notthe return flow.
1. David buys a CD at the local store for $9.99. ______________
2. Emily earns $6.50 per hour entering data at the music conservatory. ______________
3. Maria pays her federal income tax. ______________
4. Jagdish receives $15,000 in profits from his half-ownership of a coffee shop. ______________
5. Keisha makes decorative pillows that she sells for $30.00. ______________
6. Mammoth Toys Inc. hires 100 new employees. ______________
7. The National Park Service opens two new campgrounds in Yellowstone National Park.______________
Part BWrite T if the statement is true and F if the statement is false.
8. Money flows are clockwise. ______________
9. Goods and services flows are clockwise. ______________
10. The resource market determines the price per acre of farmland. ______________
11. The product market determines the price of a computer. ______________
12. Firms sell resources in the resource markets. _______________
13. Government buys resources and households sell resources. ______________
14. Government buys products, and firms sell products. ______________
15. The product market determines the salary of the C.E.O. of a firm. ______________
16. The resource market determines the price of soda. ______________
17. The resource market determines the price of soda-bottling equipment. ______________

Advanced Placement Economics Macroeconomics: Student Activities © National Council on Economic Education, New York, N.Y. 65
2
Measuring Broad Economic GoalsOverviewThe 1930s were marked by periods of chronically high unemployment in the United States. AfterWorld War II, Congress passed the Employment Act of 1946, which stated that it was the policy andresponsibility of the federal government to use all practical means to promote maximum employ-ment, production and purchasing power. The Employment Act of 1946 established three importantgoals for the economy:
1. Full employment (also called the natural level of employment) exists when most individuals whoare willing to work at the prevailing wages in the economy are employed and the average price level isstable. Even under conditions of full employment, there will be some temporary unemployment asworkers change jobs and as new workers seek their first jobs (frictional unemployment). In addition,there will be some structural unemployment. Structural unemployment exists because there is a mis-match between the skills of the people seeking jobs and the skills required for available jobs.
2. Price stability exists when the average level of prices in the economy is neither increasing nordecreasing. The goal of price stability does not imply that prices of individual items should notchange — only that the average level of prices should not. A sustained rise in the average level ofprices is called inflation; a sustained decline is called deflation.
3. Economic growth exists when the economy produces increasing amounts of goods and servicesover the long term. If the increase is greater than the increase in population, the amount of goods andservices available per person will rise, and thus the nation’s standard of living will improve.
In 1978, Congress passed the Full Employment and Balanced Growth (Humphrey-Hawkins) Actestablishing two additional goals: an unemployment rate of 4 percent with a zero-percent inflation rate.
Measuring the Achievement of Economic GoalsTo determine how well we are achieving the economic goals, we must measure the levels of employ-ment, prices and economic growth. We look at how such measurements are commonly made.
Part AMeasuring EmploymentThe civilian unemployment rate measures how well we are achieving the goal of full employment.The unemployment rate is derived from a national survey of about 60,000 households. Each monththe federal government asks these households about the employment status of household membersaged 16 and older (adult population). The survey puts each person in one of three categories:employed, unemployed or not in the labor force. People who are at work (the employed) plus thosewho are actively looking for work (the unemployed) make up the labor force. The labor force is muchsmaller than the total adult population because many individuals are too old to work, some peopleare unable to work and some choose not to work.
Macroeconomics LESSON 2 ■ ACTIVITY 11UNIT
Adapted from Master Curriculum Guide in Economics: Teaching Strategies for High School Economics Courses (New York: NationalCouncil on Economic Education, 1985), p. 126.
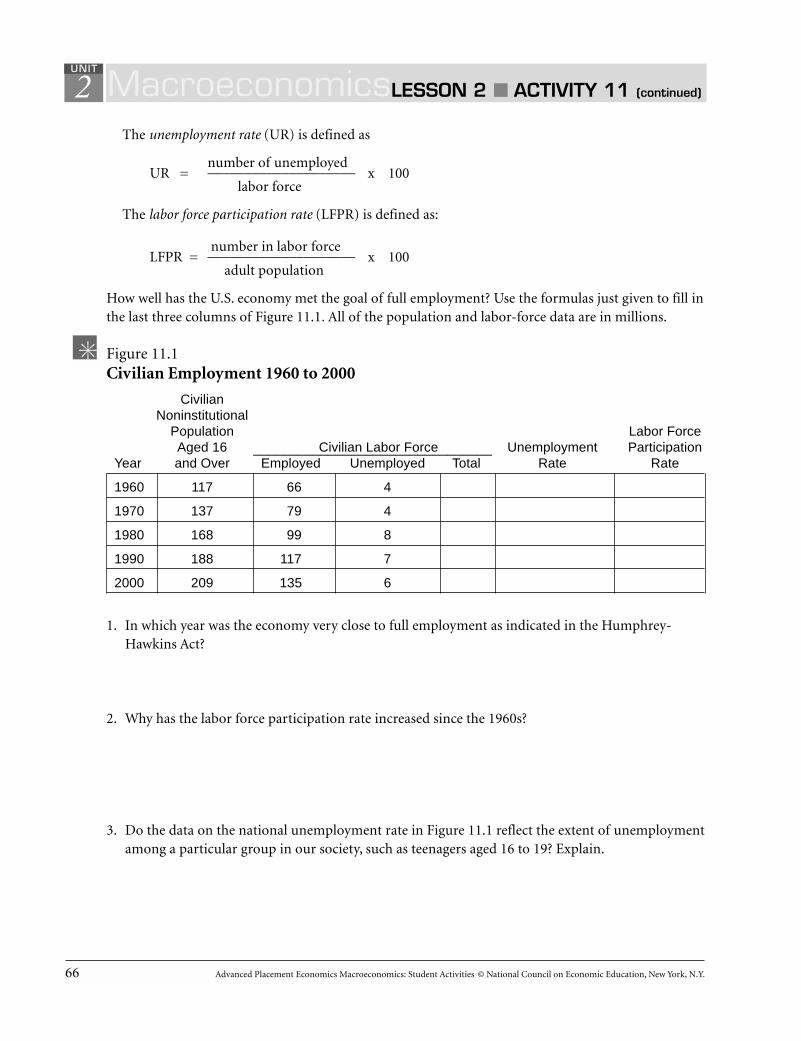
66 Advanced Placement Economics Macroeconomics: Student Activities © National Council on Economic Education, New York, N.Y.
2 MacroeconomicsLESSON 2 ■ ACTIVITY 11 (continued)
UNIT
The unemployment rate (UR) is defined as
number of unemployedUR = ____________________ x 100
labor force
The labor force participation rate (LFPR) is defined as:
number in labor forceLFPR = ____________________ x 100
adult population
How well has the U.S. economy met the goal of full employment? Use the formulas just given to fill inthe last three columns of Figure 11.1. All of the population and labor-force data are in millions.
Figure 11.1Civilian Employment 1960 to 2000
CivilianNoninstitutional
Population Labor ForceAged 16 Civilian Labor Forceeei Unemployment Participation________________________________
Year and Over Employed Unemployed Total Rate Rate
1960 117 66 4
1970 137 79 4
1980 168 99 8
1990 188 117 7
2000 209 135 6
1. In which year was the economy very close to full employment as indicated in the Humphrey-Hawkins Act?
2. Why has the labor force participation rate increased since the 1960s?
3. Do the data on the national unemployment rate in Figure 11.1 reflect the extent of unemploymentamong a particular group in our society, such as teenagers aged 16 to 19? Explain.

Advanced Placement Economics Macroeconomics: Student Activities © National Council on Economic Education, New York, N.Y. 67
2 MacroeconomicsLESSON 2 ■ ACTIVITY 11 (continued)
UNIT
Part BMeasuring Price ChangesPrice indexes measure price changes in the economy. By using a price index, you can combine theprices of a number of goods and/or services and express in one number the average change for all theprices. The consumer price index, or CPI, is the measure of price changes that is probably most famil-iar to people. It measures changes in the prices of goods and services commonly bought byconsumers. Items on which the average consumer spends a great deal of money — such as food —are given more weight (importance) in computing the index than items such as newspapers, maga-zines and books, on which the average consumer spends comparatively less.
The index itself is based on a market basket of approximately 400 goods and services weightedaccording to how much the average consumer spent in the base year. Other price indexes used in theUnited States include
■ the producer price index, which measures changes in the prices of consumer goods before theyreach the retail level, as well as the prices of supplies and equipment businesses buy, and
■ the gross domestic product price deflator, or GDP price deflator, which is the most inclusiveindex available because it takes into account all goods and services produced.
To construct any price index, economists select a previous period, usually one year, to serve as thebase period. The prices of any subsequent period are expressed as a percentage of the base period. Forconvenience, the base period of almost all indexes is set at 100.
For the consumer price index, the formula used to measure price change from the base period is
weighted cost of base-period items in current-year pricesConsumer price index = _______________________________________________ x 100
weighted cost of base-period items in base-year prices
We multiply by 100 to express the index relative to the figure of 100 for the base period.
To keep things simple, let’s say an average consumer in our economy buys only three items, asdescribed in Figure 11.2. First compute the cost of buying all the items in the base year:
30 x $5.00 = $15040 x $6.00 = 24060 x $1.50 = 90TOTAL = $480
To compute the consumer price index for Year 1 in Figure 11.2, find the cost of buying these sameitems in Year 1. Try this yourself. Your answer should be $530: the sum of (30 x $7) + (40 x $5) + (60x $2). The consumer price index for Year 1 is then equal to ($530 / $480) x 100, which equals 110.4.This means that what we could have bought for $100 in the base year costs $110.40 in Year 1.
If we subtract the base year index of 100.0 from 110.4, we get the percentage change in prices fromthe base year. In this example, prices rose 10.4% from the base year to Year 1.
Remember that the weights used for the consumer price index are determined by what consumersbought in the base year; in the example we used base-year quantities to figure the expenditures in
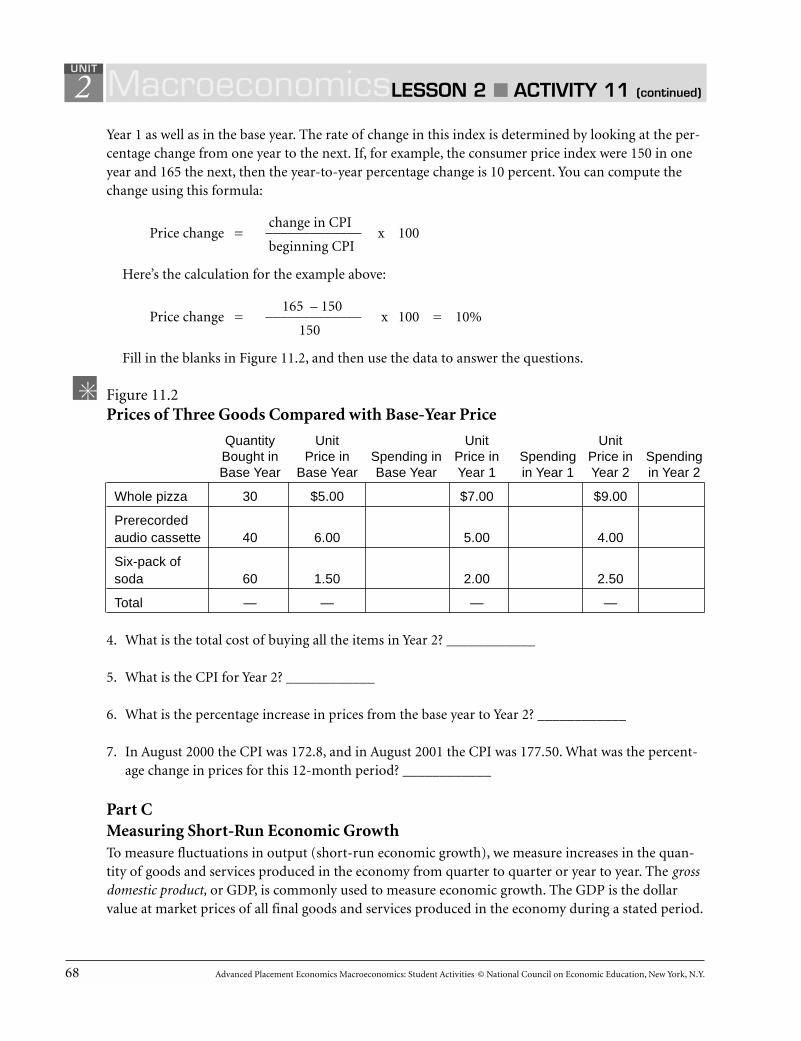
68 Advanced Placement Economics Macroeconomics: Student Activities © National Council on Economic Education, New York, N.Y.
2 MacroeconomicsLESSON 2 ■ ACTIVITY 11 (continued)
UNIT
Year 1 as well as in the base year. The rate of change in this index is determined by looking at the per-centage change from one year to the next. If, for example, the consumer price index were 150 in oneyear and 165 the next, then the year-to-year percentage change is 10 percent. You can compute thechange using this formula:
change in CPIPrice change = _____________ x 100
beginning CPI
Here’s the calculation for the example above:
165 – 150Price change = _____________ x 100 = 10%
150
Fill in the blanks in Figure 11.2, and then use the data to answer the questions.
Figure 11.2Prices of Three Goods Compared with Base-Year Price
Quantity Unit Unit UnitBought in Price in Spending in Price in Spending Price in SpendingBase Year Base Year Base Year Year 1 in Year 1 Year 2 in Year 2
Whole pizza 30 $5.00 $7.00 $9.00
Prerecordedaudio cassette 40 6.00 5.00 4.00
Six-pack ofsoda 60 1.50 2.00 2.50
Total — — — —
4. What is the total cost of buying all the items in Year 2? ____________
5. What is the CPI for Year 2? ____________
6. What is the percentage increase in prices from the base year to Year 2? ____________
7. In August 2000 the CPI was 172.8, and in August 2001 the CPI was 177.50. What was the percent-age change in prices for this 12-month period? ____________
Part CMeasuring Short-Run Economic GrowthTo measure fluctuations in output (short-run economic growth), we measure increases in the quan-tity of goods and services produced in the economy from quarter to quarter or year to year. The grossdomestic product, or GDP, is commonly used to measure economic growth. The GDP is the dollarvalue at market prices of all final goods and services produced in the economy during a stated period.

Advanced Placement Economics Macroeconomics: Student Activities © National Council on Economic Education, New York, N.Y. 69
2 MacroeconomicsLESSON 2 ■ ACTIVITY 11 (continued)
UNIT
Final goods are goods intended for the final user. For example, gasoline is a final good; but crudeoil, from which gasoline and other products are derived, is not.
Before using GDP to measure output growth, we must first adjust GDP for price changes. Let’s sayGDP in Year 1 is $1,000 and in Year 2 it is $1,100. Does this mean the economy has grown 10 percentbetween Year 1 and Year 2? Not necessarily. If prices have risen, part of the increase in GDP in Year 2will merely represent the increase in prices. We call GDP that has been adjusted for price changes realGDP. If it isn’t adjusted for price changes, we call it nominal GDP.
To compute real GDP in a given year, use the following formula:
Real GDP in Year 1 = (nominal GDP x 100 ) / price index
To compute real output growth in GDP from one year to another, subtract real GDP for Year 2from real GDP in Year 1. Divide the answer (the change in real GDP from the previous year) by realGDP in Year 1. The result, multiplied by 100, is the percentage growth in real GDP from Year 1 to Year2. (If real GDP declines from Year 1 to Year 2, the answer will be a negative percentage.) Here’s theformula:
(real GDP in Year 2 – real GDP in Year 1)Output growth = __________________________________ x 100
real GDP in Year 1
For example, if real GDP in Year 1 = $1,000 and in Year 2 = $1,028, then the output growth ratefrom Year 1 to Year 2 is 2.8%: (1,028 – 1,000) / 1,000 = .028, which we multiply by 100 in order toexpress the result as a percentage.
To understand the impact of output changes, we usually look at real GDP per capita. To do so, wedivide the real GDP of any period by a country’s average population during the same period. Thisprocedure enables us to determine how much of the output growth of a country simply went to sup-ply the increase in population and how much of the growth represented improvements in the stan-dard of living of the entire population. In our example, let’s say the population in Year 1 was 100 andin Year 2 it was 110. What was real GDP per capita in Years 1 and 2?
Year 1
Year 1 real GDP $1,000Real GDP per capita = _________________ = ______ = $10
population in Year 1 100
Year 2
$1,028Real GDP per capita = ______ = $9.30
110
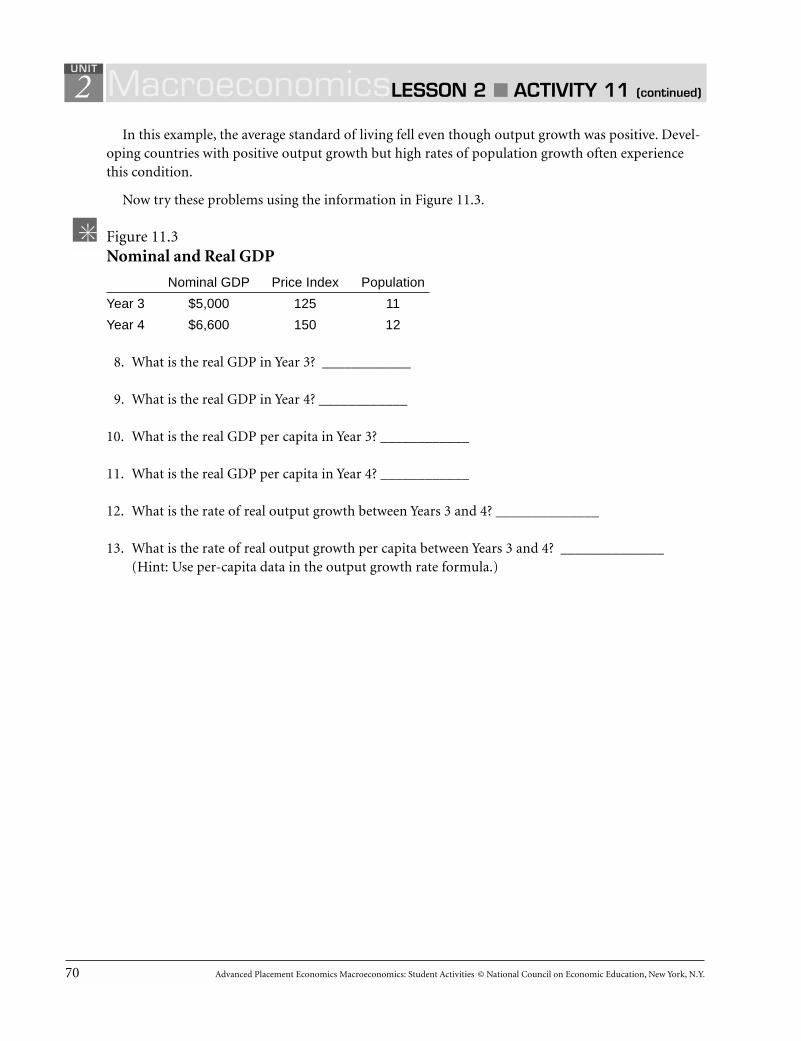
70 Advanced Placement Economics Macroeconomics: Student Activities © National Council on Economic Education, New York, N.Y.
2 MacroeconomicsLESSON 2 ■ ACTIVITY 11 (continued)
UNIT
In this example, the average standard of living fell even though output growth was positive. Devel-oping countries with positive output growth but high rates of population growth often experiencethis condition.
Now try these problems using the information in Figure 11.3.
Figure 11.3Nominal and Real GDP
Nominal GDP Price Index Population
Year 3 $5,000 125 11
Year 4 $6,600 150 12
8. What is the real GDP in Year 3? ____________
9. What is the real GDP in Year 4? ____________
10. What is the real GDP per capita in Year 3? ____________
11. What is the real GDP per capita in Year 4? ____________
12. What is the rate of real output growth between Years 3 and 4? ______________
13. What is the rate of real output growth per capita between Years 3 and 4? ______________(Hint: Use per-capita data in the output growth rate formula.)
Advanced Placement Economics Macroeconomics: Student Activities © National Council on Economic Education, New York, N.Y. 71
2
All About GDP
Part AIs This Counted as Part of GDP?Which of the following are included and which are excluded in calculating GDP? Explain your decisions.
1. A monthly check received by an economics student who has been granted a government scholarship
2. A farmer’s purchase of a new tractor
3. A plumber’s purchase of a two-year-old used truck
4. Cashing a U.S. government bond
5. The services of a mechanic in fixing the radiator on his own car
6. A Social Security check from the government to a retired store clerk
7. An increase in business inventories
8. The government’s purchase of a new submarine for the Navy
9. A barber’s income from cutting hair
10. Income received from the sale of Nike stock
Macroeconomics LESSON 2 ■ ACTIVITY 12UNIT
Part A adapted from William B. Walstad, Michael W. Watts, Robert F. Smith and Campbell R. McConnell, Instructor’s Manual toAccompany Economics, 10th ed. (New York: McGraw-Hill Book Co., 1987), p. 33. Parts B and C written by John Morton, NationalCouncil on Economic Education, New York, N.Y.

72 Advanced Placement Economics Macroeconomics: Student Activities © National Council on Economic Education, New York, N.Y.
2 MacroeconomicsLESSON 2 ■ ACTIVITY 12 (continued)
UNIT
Part BGDP: Is It Counted and Where?For each of the following items, write one of the following in the space provided:
C if the item is counted as consumption spending.
I if the item is counted as investment spending.
G if the item is counted as government spending.
NX if the item is counted as net exports.
NC if the item is not counted in GDP.
___ 11. You spend $7.00 to attend a movie.
___ 12. A family pays a contractor $100,000 for a house he built for them this year.
___ 13. A family pays $75,000 for a house built three years ago.
___ 14. An accountant pays a tailor $175 to sew a suit for her.
___ 15. The government increases its defense expenditures by $1,000,000,000.
___ 16. The government makes a $300 Social Security payment to a retired person.
___ 17. You buy General Motors Corp. stock for $1,000 in the stock market.
___ 18. At the end of a year, a flour-milling firm finds that its inventories of grain and flour are$10,000 above the amounts of its inventories at the beginning of the year.
___ 19. A homemaker works hard caring for her spouse and two children.
___ 20. Ford Motor Co. buys new auto-making robots.
___ 21. You pay $300 a month to rent an apartment.
___ 22. Apple Computer Co. builds a new factory in the United States.
___ 23. R.J. Reynolds Co. buys control of Nabisco.
___ 24. You buy a new Toyota that was made in Japan.
___ 25. You pay tuition to attend college.
Advanced Placement Economics Macroeconomics: Student Activities © National Council on Economic Education, New York, N.Y. 73
2 MacroeconomicsLESSON 2 ■ ACTIVITY 12 (continued)
UNIT
Part CWhy Are Items Counted or Not Counted in GDP?
26. We count only the final retail price of a new good or service in GDP. Why?
27. A purely financial transaction will not be counted in GDP. Why?
28. When a homeowner does home-improvement work, the value of the labor is not counted inGDP. Why?


Advanced Placement Economics Macroeconomics: Student Activities © National Council on Economic Education, New York, N.Y. 75
2
Price IndexesThere is more than one method for constructing a price index. The easiest to understand is probablythe weighted-average method explained in this activity. This method compares the total cost of a fixedmarket basket of goods in different years. The total cost is weighted by multiplying the price of eachitem in the basket by the number of units of the item in the basket and then adding up all the prices.The cost of the basic market basket in the current year is then expressed as a percentage of the cost ofthe basic market basket in the base year using this formula:
current-year costindex number = _________________ x 100
base-year cost
Multiplying by 100 converts the number so it is comparable to the base-year number. The baseyear always has an index number of 100 since the current-year cost and the base-year cost of themarket basket are the same in the base year.
Part AConstructing a Price IndexUsing this information, let us now construct a price index. Fill in the blanks in Figure 13.1.
Figure 13.1Constructing a Price Index
Year 1 Year 2 Year 3
Basic Price Cost of Price Cost of Price Cost ofMarket Basket No. of Per Market Per Market Per MarketItem Units Unit Basket Unit Basket Unit Basket
Cheese 2 lbs. $1.75 $3.50 $1.50 $3.00 $1.50 $3.00
Blue Jeans 2 pair 12.00 24.00 15.50 20.00 40.00
Gasoline 10 gals. 1.25 12.50 1.60 16.00 2.70
Total Expenditure — — $40.00 — $50.00 —
1. We now have the information needed to construct a price index. The first step is to pick a baseyear and apply the formula. If Year 1 is selected as the base year, the index number for Year 1 is($40 / $40) x 100 = 100. The index number for Year 2 is ($50 / $40) x 100 = 125 and the indexnumber for Year 3 is (_________ / $40) x 100 = ____________.
2. These index numbers indicate that there was a 25 percent increase in prices between Year 1 and Year 2.
(A) What is the percentage increase between Year 1 and Year 3? ____________.
(B) What is the percentage increase between Year 2 and Year 3? ____________.
Macroeconomics LESSON 3 ■ ACTIVITY 13UNIT
Adapted from Phillip Saunders, Introduction to Macroeconomics: Student Workbook, 18th ed. (Bloomington, Ind., 1998). Copyright1998 Phillip Saunders. All rights reserved.
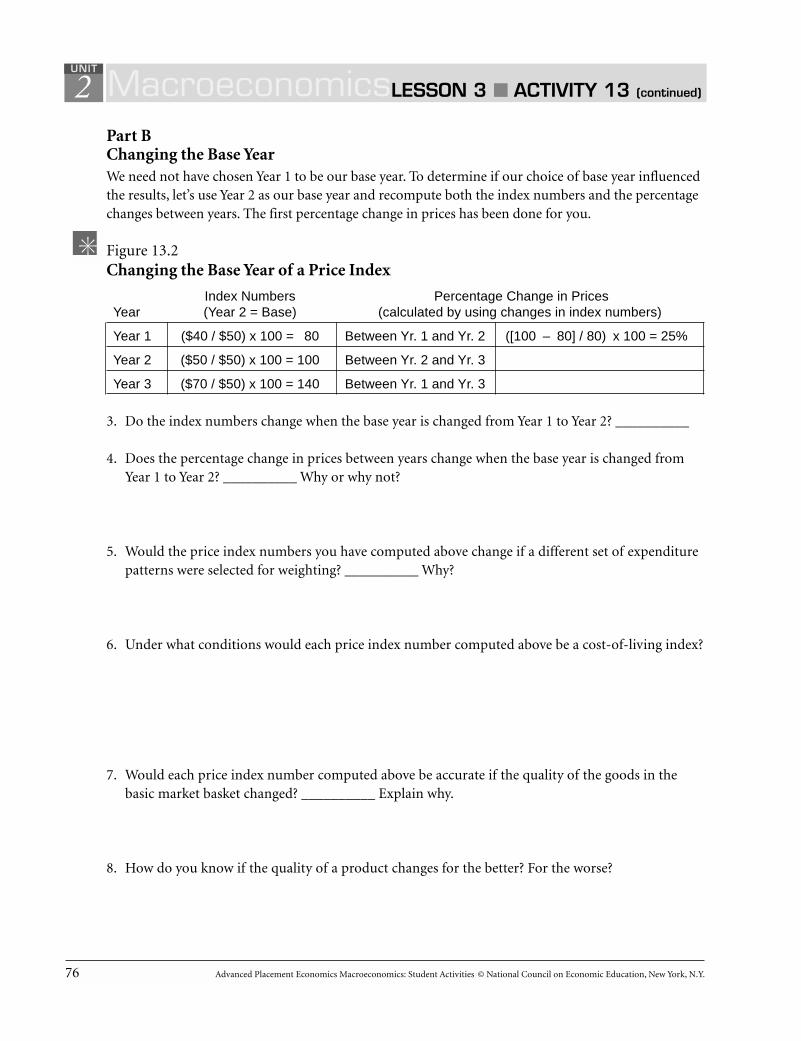
76 Advanced Placement Economics Macroeconomics: Student Activities © National Council on Economic Education, New York, N.Y.
2 MacroeconomicsLESSON 3 ■ ACTIVITY 13 (continued)
UNIT
Part BChanging the Base YearWe need not have chosen Year 1 to be our base year. To determine if our choice of base year influencedthe results, let’s use Year 2 as our base year and recompute both the index numbers and the percentagechanges between years. The first percentage change in prices has been done for you.
Figure 13.2Changing the Base Year of a Price Index
Index Numbers Percentage Change in PricesYear (Year 2 = Base) (calculated by using changes in index numbers)
Year 1 ($40 / $50) x 100 = 80 Between Yr. 1 and Yr. 2 ([100 – 80] / 80) x 100 = 25%
Year 2 ($50 / $50) x 100 = 100 Between Yr. 2 and Yr. 3
Year 3 ($70 / $50) x 100 = 140 Between Yr. 1 and Yr. 3 (
3. Do the index numbers change when the base year is changed from Year 1 to Year 2? __________
4. Does the percentage change in prices between years change when the base year is changed fromYear 1 to Year 2? __________ Why or why not?
5. Would the price index numbers you have computed above change if a different set of expenditurepatterns were selected for weighting? __________ Why?
6. Under what conditions would each price index number computed above be a cost-of-living index?
7. Would each price index number computed above be accurate if the quality of the goods in thebasic market basket changed? __________ Explain why.
8. How do you know if the quality of a product changes for the better? For the worse?

Advanced Placement Economics Macroeconomics: Student Activities © National Council on Economic Education, New York, N.Y. 77
2 Macroeconomics LESSON 3 ■ ACTIVITY 14UNITUNIT
Inflation Game: Royalty for a DayIntroductionPrices usually rise over a period of time. The same items you bought a few years ago may cost morenow. For example, a restaurant menu lists its finest steak entrée at $22; however, two years ago the samesteak was only $20. Inflation is the term used to describe an increase in the overall level of prices. It’s animportant concept to understand because it’s discussed so frequently in the media: Price indexes andinflation measurements are reported almost daily in the financial pages, politicians constantly announceprograms to control inflation and economists endlessly debate inflation’s effects on economic growth.
In general, people don’t like inflation because higher prices mean they can purchase less for thesame income. However, inflation does not affect everyone in the same way. While many people arehurt by inflation, especially when it is unexpected, others may actually benefit.
This activity is designed to teach you the effects of inflation on different segments of the popula-tion: Who is hurt by unanticipated inflation and who benefits?
Overview of the GameThis activity is modeled after an ancient (1950s) television game show called “Queen for a Day,” inwhich (women) contestants took turns describing their lives of tragedy, hardship and sorrow. After allhad shared their misery, the sympathetic audience voted for the most deserving by applauding. An“applause meter” measured the sound. The winner was crowned “Queen for a Day” and presentedwith a robe, crown and many prizes. In this modern version, male and female economics studentscompete for the honor of “Royalty for a Day” by convincing the audience how much they are suffer-ing because of inflation. Your teacher will provide additional information.
Part AAudience ScorecardUsing the scorecard on the next page, indicate who is hurt or helped by inflation and give the reasonwhy you think so.
Activity written by Joanne Benjamin, Los Gatos High School, Los Gatos, Calif.

78 Advanced Placement Economics Macroeconomics: Student Activities © National Council on Economic Education, New York, N.Y.
2 MacroeconomicsLESSON 3 ■ ACTIVITY 14 (continued)
UNIT
Audience Scorecard
Gain or HurtContestant by Inflation? Reasoning
PriscillaHomeowner / Worker
MayorGovernment official
PeterStore owner
TheresaAuto worker / Union member
Jerry Real-estate developer / Speculator
ElmerRetiree
Mr. Sad ClassTeacher
LucyHigh school senior
BernieBank president
HelgaRetiree
JeromePotential homeowner / Borrower
LawrenceBritishbusinessowner

Advanced Placement Economics Macroeconomics: Student Activities © National Council on Economic Education, New York, N.Y. 79
2 MacroeconomicsLESSON 3 ■ ACTIVITY 14 (continued)
UNIT
Part BSpectrum Technique for Analyzing ContestantsDistribute the contestants along the spectrum, and explain why you think each should be locatedwhere you put him or her.
Figure 14.1Spectrum Technique for Analyzing Contestants
Suffers most from inflation
Neutral(neither suffers nor benefits)
Benefits mostfrom inflation


Advanced Placement Economics Macroeconomics: Student Activities © National Council on Economic Education, New York, N.Y. 81
2
Who Is Hurt and Who Is Helped by Unanticipated Inflation?In Questions 1 through 15 decide which people or groups are hurt by unanticipated inflation andwhich benefit from unanticipated inflation. Circle the correct response, and explain why youanswered as you did.
H means the person or group is hurt by unanticipated inflation.G means the person or group gains from unanticipated inflation.U means it is uncertain if the person or group is affected by unanticipated inflation or if the
effects are unclear.
1. Banks extend many fixed-rate loans.
H G U
Explain:
2. A farmer buys machinery with a fixed-rate loan to be repaid over a 10-year period.
H G U
Explain:
3. Your family buys a new home with an adjustable-rate mortgage.
H G U
Explain:
4. Your savings from your summer job are in a savings account paying a fixed rate of interest.
H G U
Explain:
5. A widow lives entirely on income from fixed-rate corporate bonds.
H G U
Explain:
Macroeconomics LESSON 3 ■ ACTIVITY 15UNIT
Activity written by Betty Shackelford, Maconaquah High School, Bunker Hill, Ind., and Kathleen Whitsett, Princeton High School,Cincinnati, Ohio.
82 Advanced Placement Economics Macroeconomics: Student Activities © National Council on Economic Education, New York, N.Y.
2 MacroeconomicsLESSON 3 ■ ACTIVITY 15 (continued)
UNIT
6. A retired couple lives entirely on income from a pension the woman receives from her formeremployer.
H G U
Explain:
7. A retired man lives entirely on income from Social Security.
H G U
Explain:
8. A retired bank official lives entirely on income from stock dividends.
H G U
Explain:
9. The federal government has a $5,000,000,000 debt.
H G U
Explain:
10. A firm signs a contract to provide maintenance services at a fixed rate for the next five years.
H G U
Explain:
11. A state government receives revenue mainly from a progressive income tax.
H G U
Explain:
Advanced Placement Economics Macroeconomics: Student Activities © National Council on Economic Education, New York, N.Y. 83
2 MacroeconomicsLESSON 3 ■ ACTIVITY 15 (continued)
UNIT
12. A local government receives revenue mainly from fixed-rate license fees charged to businesses.
H G U
Explain:
13. Your friend rents an apartment with a three-year lease.
H G U
Explain:
14. A bank has loaned millions of dollars for home mortgages at a fixed rate of interest.
H G U
Explain:
15. Parents are putting savings for their child’s college education in a bank savings account.
H G U
Explain:
16. What conclusions can you draw about who is helped and who is hurt by unanticipated inflation?
17. If you were certain that the inflation rate would be 10 percent a year for the next 10 years, howmight your behavior change? Does your answer depend on who you are? Student? Worker?

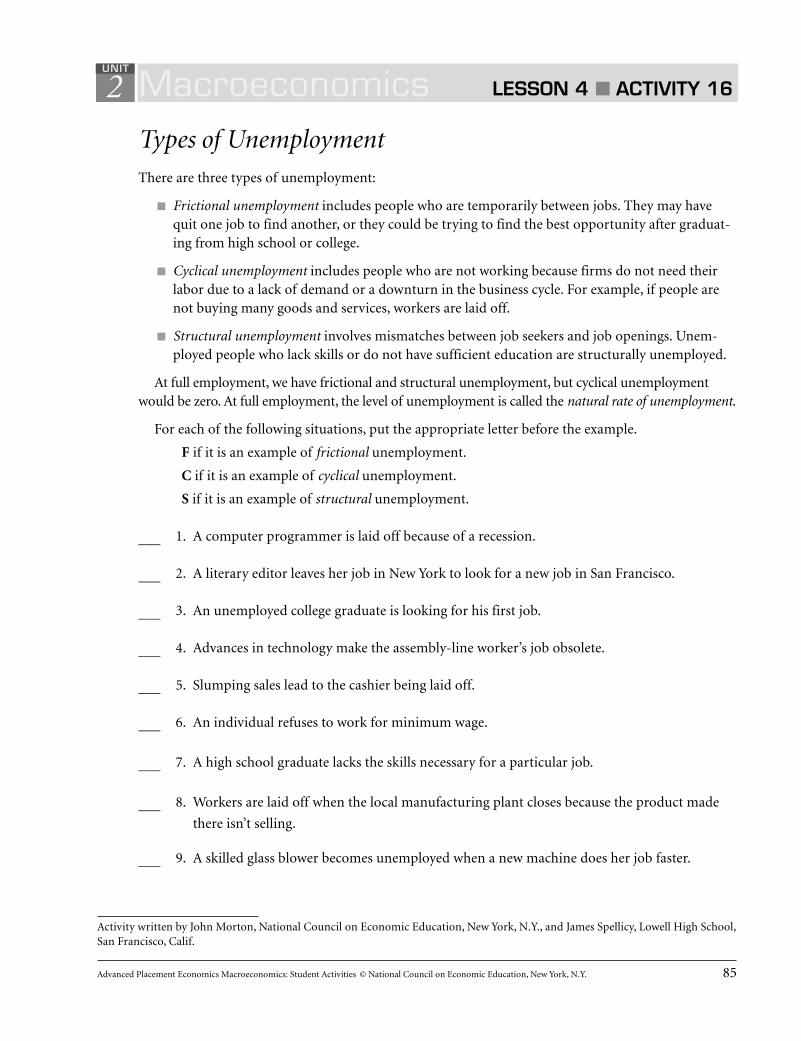
Advanced Placement Economics Macroeconomics: Student Activities © National Council on Economic Education, New York, N.Y. 85
2
Types of UnemploymentThere are three types of unemployment:
■ Frictional unemployment includes people who are temporarily between jobs. They may havequit one job to find another, or they could be trying to find the best opportunity after graduat-ing from high school or college.
■ Cyclical unemployment includes people who are not working because firms do not need theirlabor due to a lack of demand or a downturn in the business cycle. For example, if people arenot buying many goods and services, workers are laid off.
■ Structural unemployment involves mismatches between job seekers and job openings. Unem-ployed people who lack skills or do not have sufficient education are structurally unemployed.
At full employment, we have frictional and structural unemployment, but cyclical unemploymentwould be zero. At full employment, the level of unemployment is called the natural rate of unemployment.
For each of the following situations, put the appropriate letter before the example.
F if it is an example of frictional unemployment.
C if it is an example of cyclical unemployment.
S if it is an example of structural unemployment.
1. A computer programmer is laid off because of a recession.___
2. A literary editor leaves her job in New York to look for a new job in San Francisco.___
3. An unemployed college graduate is looking for his first job.___
4. Advances in technology make the assembly-line worker’s job obsolete.___
5. Slumping sales lead to the cashier being laid off.___
6. An individual refuses to work for minimum wage.___
7. A high school graduate lacks the skills necessary for a particular job.___
8. Workers are laid off when the local manufacturing plant closes because the product made___ there isn’t selling.
9. A skilled glass blower becomes unemployed when a new machine does her job faster.___
Macroeconomics LESSON 4 ■ ACTIVITY 16UNIT
Activity written by John Morton, National Council on Economic Education, New York, N.Y., and James Spellicy, Lowell High School,San Francisco, Calif.


Advanced Placement Economics Macroeconomics: Student Activities © National Council on Economic Education, New York, N.Y. 87
2
The Business Cycle
The curved line on Figure 17.1 shows a sample business cycle for an economy. The straight line repre-sents the long-run trend of real GDP.
The business cycle can conveniently be divided into four phases:
1. Expansionary or recovery phase. Real output in the economy is increasing and the unemploy-ment rate is declining. As the economic expansion continues, inflation may begin to accelerate.
2. Peak. Real output, GDP, is at its highest point of the business cycle.
3. Contractionary or recession phase. Real output in the economy is decreasing, and the unem-ployment rate is rising. As the contraction continues, inflationary pressures subside. If the re-cession continues long enough, prices may actually start to fall, a situation known as deflation.
4. Trough. The lowest point of real GDP reached during the business cycle is known as thetrough. If the trough is particularly deep, it may be called a depression. A depression is an eco-nomic situation where the level of output falls to especially low levels and unemploymentclimbs to very high levels relative to the historical average. There is no precise decline in out-
Macroeconomics LESSON 5 ■ ACTIVITY 17UNIT
Activity written by David Nelson, Western Washington University, Bellingham, Wash., with revision by Rae Jean B. Goodman, U.S.Naval Academy, Annapolis, Md.
PERIODS OF TIME
Figure 17.1The Business Cycle
Expansionary/Recovery
Expansionary/Recovery
Peak
Contractionary/Recession
Trough
Long-run tre
nd of real G
DP

88 Advanced Placement Economics Macroeconomics: Student Activities © National Council on Economic Education, New York, N.Y.
2 MacroeconomicsLESSON 5 ■ ACTIVITY 17 (continued)
UNIT
put at which a serious recession becomes a depression. However, most business cycles do notend in a depression. The most recent depression the United States experienced was during the1930s.
1. Figure 17.2 contains information for the U.S. economy from 1980 through 2001. For each quar-ter, first identify whether the economy was in an expansionary (E) or a contractionary (C) phase.Go back and pick out the quarters that correspond with a business cycle peak, and mark themwith a P. Then find the quarters that correspond with a trough, and mark them with a T. Some ofthe answers have been provided for you.
Using your answers from Question 1, answer the following questions.
2. How many business cycles did the U.S. economy have between 1980 and 2001? ________
3. In how many quarters was output expanding? ________
4. In how many quarters was output contracting? ________
5. Which expansion looks best to you? Explain.
6. Which contraction looks worst to you? Explain.
7. During quarters in which real GDP fell, what happened to the unemployment rate comparedwith the previous quarter? Why?
8. Look at the unemployment rate in quarters corresponding to a business cycle peak. Why do youthink there was still some unemployment in these quarters?
9. Look at the unemployment rate in quarters corresponding to recoveries. Why do you think theunemployment rate remained high?
10. Based on the years 1980 to 2001, how does the rate of inflation correspond with the business cycle?
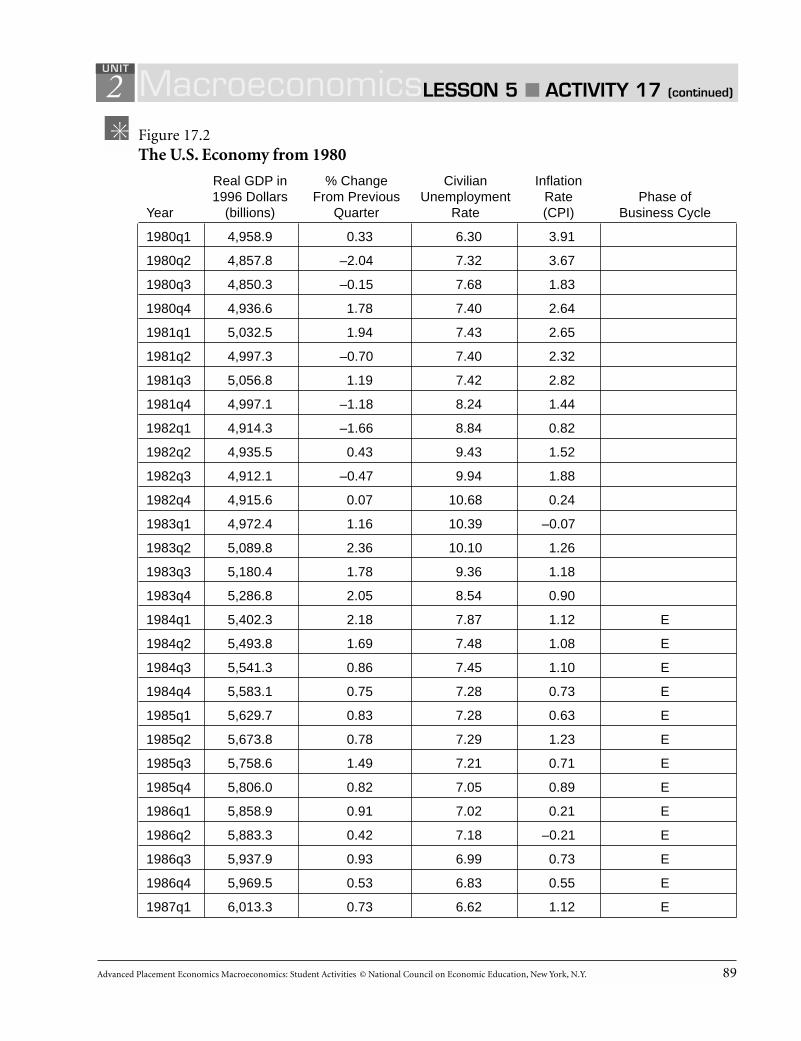
Advanced Placement Economics Macroeconomics: Student Activities © National Council on Economic Education, New York, N.Y. 89
2 MacroeconomicsLESSON 5 ■ ACTIVITY 17 (continued)
UNIT
Figure 17.2The U.S. Economy from 1980
Real GDP in % Change Civilian Inflation1996 Dollars From Previous Unemployment Rate Phase of
Year (billions) Quarter Rate (CPI) Business Cycle
1980q1 4,958.9 0.33 6.30 3.91
1980q2 4,857.8 –2.04 7.32 3.67
1980q3 4,850.3 –0.15 7.68 1.83
1980q4 4,936.6 1.78 7.40 2.64
1981q1 5,032.5 1.94 7.43 2.65
1981q2 4,997.3 –0.70 7.40 2.32
1981q3 5,056.8 1.19 7.42 2.82
1981q4 4,997.1 –1.18 8.24 1.44
1982q1 4,914.3 –1.66 8.84 0.82
1982q2 4,935.5 0.43 9.43 1.52
1982q3 4,912.1 –0.47 9.94 1.88
1982q4 4,915.6 0.07 10.68 0.24
1983q1 4,972.4 1.16 10.39 –0.07
1983q2 5,089.8 2.36 10.10 1.26
1983q3 5,180.4 1.78 9.36 1.18
1983q4 5,286.8 2.05 8.54 0.90
1984q1 5,402.3 2.18 7.87 1.12 E
1984q2 5,493.8 1.69 7.48 1.08 E
1984q3 5,541.3 0.86 7.45 1.10 E
1984q4 5,583.1 0.75 7.28 0.73 E
1985q1 5,629.7 0.83 7.28 0.63 E
1985q2 5,673.8 0.78 7.29 1.23 E
1985q3 5,758.6 1.49 7.21 0.71 E
1985q4 5,806.0 0.82 7.05 0.89 E
1986q1 5,858.9 0.91 7.02 0.21 E
1986q2 5,883.3 0.42 7.18 –0.21 E
1986q3 5,937.9 0.93 6.99 0.73 E
1986q4 5,969.5 0.53 6.83 0.55 E
1987q1 6,013.3 0.73 6.62 1.12 E
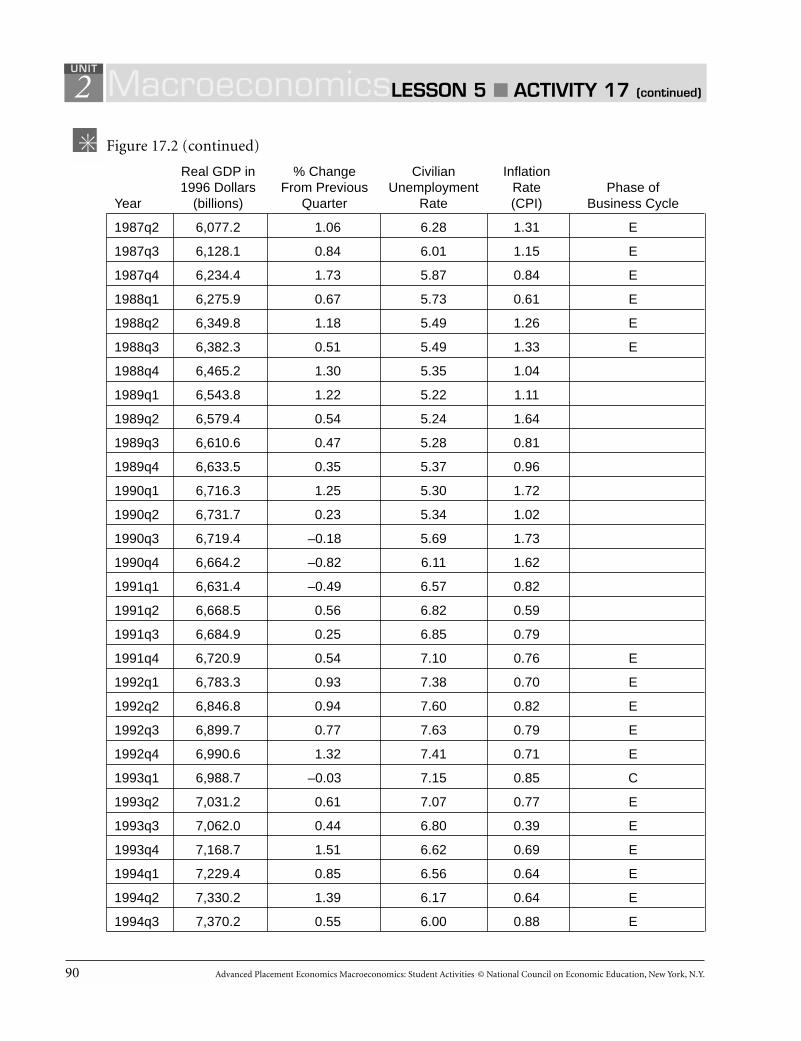
90 Advanced Placement Economics Macroeconomics: Student Activities © National Council on Economic Education, New York, N.Y.
2 MacroeconomicsLESSON 5 ■ ACTIVITY 17 (continued)
UNIT
Figure 17.2 (continued)
Real GDP in % Change Civilian Inflation1996 Dollars From Previous Unemployment Rate Phase of
Year (billions) Quarter Rate (CPI) Business Cycle
1987q2 6,077.2 1.06 6.28 1.31 E
1987q3 6,128.1 0.84 6.01 1.15 E
1987q4 6,234.4 1.73 5.87 0.84 E
1988q1 6,275.9 0.67 5.73 0.61 E
1988q2 6,349.8 1.18 5.49 1.26 E
1988q3 6,382.3 0.51 5.49 1.33 E
1988q4 6,465.2 1.30 5.35 1.04
1989q1 6,543.8 1.22 5.22 1.11
1989q2 6,579.4 0.54 5.24 1.64
1989q3 6,610.6 0.47 5.28 0.81
1989q4 6,633.5 0.35 5.37 0.96
1990q1 6,716.3 1.25 5.30 1.72
1990q2 6,731.7 0.23 5.34 1.02
1990q3 6,719.4 –0.18 5.69 1.73
1990q4 6,664.2 –0.82 6.11 1.62
1991q1 6,631.4 –0.49 6.57 0.82
1991q2 6,668.5 0.56 6.82 0.59
1991q3 6,684.9 0.25 6.85 0.79
1991q4 6,720.9 0.54 7.10 0.76 E
1992q1 6,783.3 0.93 7.38 0.70 E
1992q2 6,846.8 0.94 7.60 0.82 E
1992q3 6,899.7 0.77 7.63 0.79 E
1992q4 6,990.6 1.32 7.41 0.71 E
1993q1 6,988.7 –0.03 7.15 0.85 C
1993q2 7,031.2 0.61 7.07 0.77 E
1993q3 7,062.0 0.44 6.80 0.39 E
1993q4 7,168.7 1.51 6.62 0.69 E
1994q1 7,229.4 0.85 6.56 0.64 E
1994q2 7,330.2 1.39 6.17 0.64 E
1994q3 7,370.2 0.55 6.00 0.88 E
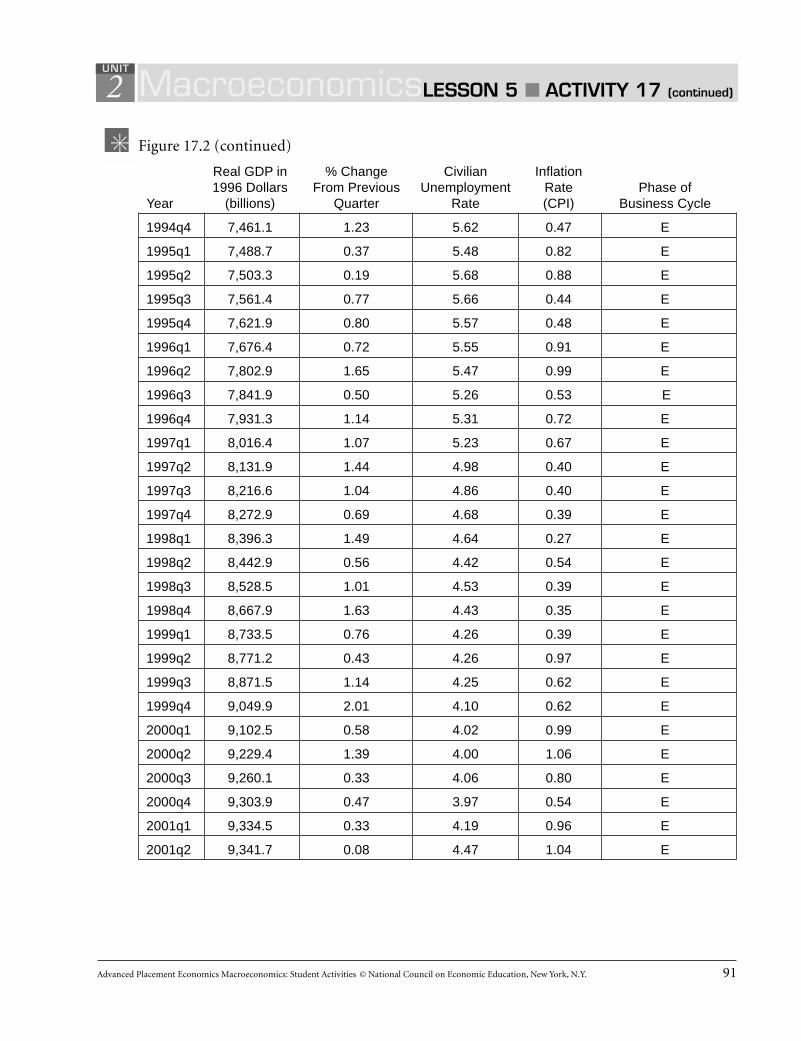
Advanced Placement Economics Macroeconomics: Student Activities © National Council on Economic Education, New York, N.Y. 91
2 MacroeconomicsLESSON 5 ■ ACTIVITY 17 (continued)
UNIT
Figure 17.2 (continued)
Real GDP in % Change Civilian Inflation1996 Dollars From Previous Unemployment Rate Phase of
Year (billions) Quarter Rate (CPI) Business Cycle
1994q4 7,461.1 1.23 5.62 0.47 E
1995q1 7,488.7 0.37 5.48 0.82 E
1995q2 7,503.3 0.19 5.68 0.88 E
1995q3 7,561.4 0.77 5.66 0.44 E
1995q4 7,621.9 0.80 5.57 0.48 E
1996q1 7,676.4 0.72 5.55 0.91 E
1996q2 7,802.9 1.65 5.47 0.99 E
1996q3 7,841.9 0.50 5.26 0.53 E
1996q4 7,931.3 1.14 5.31 0.72 E
1997q1 8,016.4 1.07 5.23 0.67 E
1997q2 8,131.9 1.44 4.98 0.40 E
1997q3 8,216.6 1.04 4.86 0.40 E
1997q4 8,272.9 0.69 4.68 0.39 E
1998q1 8,396.3 1.49 4.64 0.27 E
1998q2 8,442.9 0.56 4.42 0.54 E
1998q3 8,528.5 1.01 4.53 0.39 E
1998q4 8,667.9 1.63 4.43 0.35 E
1999q1 8,733.5 0.76 4.26 0.39 E
1999q2 8,771.2 0.43 4.26 0.97 E
1999q3 8,871.5 1.14 4.25 0.62 E
1999q4 9,049.9 2.01 4.10 0.62 E
2000q1 9,102.5 0.58 4.02 0.99 E
2000q2 9,229.4 1.39 4.00 1.06 E
2000q3 9,260.1 0.33 4.06 0.80 E
2000q4 9,303.9 0.47 3.97 0.54 E
2001q1 9,334.5 0.33 4.19 0.96 E
2001q2 9,341.7 0.08 4.47 1.04 E

Advanced Placement Economics Macroeconomics: Student Activities © National Council on Economic Education, New York, N.Y. 93
2
Test Your Understanding of Macroeconomic IndicatorsAnswer the questions and briefly explain your answers.
1. The unemployment rate and employment both go up. Ellen says that it is not possible for both torise at the same time. Is Ellen correct or incorrect? Why?
2. True, false or uncertain, and explain why? “Gross domestic product measures the amount ofwealth in the economy.”
3. True, false or uncertain, and explain why? “A decrease in gross domestic product must reduce aperson’s standard of living.”
4. True, false or uncertain, and explain why? “If nominal GDP increases by 5 percent and the pricelevel increases by 7 percent, real GDP has decreased.”
5. True, false or uncertain, and explain why? “In preparing an index of prices, it is important that allcommodities entering the index be given equal weight.”
6. True, false or uncertain, and explain why? “Frictional and structural unemployment are two wordsfor the same thing.”
Macroeconomics LESSON 5 ■ ACTIVITY 18UNIT
Several questions come from Phillip Saunders, Introduction to Macroeconomics: Student Workbook, 18th ed. (Bloomington, Ind.,1998). Copyright 1998 Phillip Saunders. All rights reserved. Betty Shackleford, Maconaquah High School, Bunker Hill, Ind., andKathleen Whitsett, Princeton High School, Cincinnati, Ohio, contributed to this activity.
94 Advanced Placement Economics Macroeconomics: Student Activities © National Council on Economic Education, New York, N.Y.
2 MacroeconomicsLESSON 5 ■ ACTIVITY 18 (continued)
UNIT
7. Why does unanticipated inflation help borrowers and hurt lenders?
8. True, false or uncertain, and explain why? “Inflation always increases when unemploymentdecreases.”
9. True, false or uncertain, and explain why? “If the economy is at full employment, the unemploy-ment rate is zero.”
10. True, false or uncertain, and explain why? “Seasonal unemployment is a continual worry becausesome people are out of work on a regular basis.”

Advanced Placement Economics Macroeconomics: Student Activities © National Council on Economic Education, New York, N.Y. 95
Circle the letter of each correct answer.
1. In the circular flow diagram, which of the fol-lowing is true in the product market?
(A) Households sell goods and services to busi-ness firms.
(B) Households sell resources to business firms.
(C) Business firms sell resources to households.
(D) Business firms sell goods and services tohouseholds.
(E) Households buy resources from businessfirms.
2. In the circular flow diagram, which of the fol-lowing is true in resource or factor markets?
(A) Households buy resources from businessfirms.
(B) Households sell products to business firms.
(C) Households sell resources to business firms.
(D) Business firms sell goods and services tohouseholds.
(E) Business firms sell resources to households.
3. Which of the following is the best measure ofthe production or output of an economy?
(A) Consumer price index
(B) Unemployment rate
(C) Gross domestic product
(D) Prime rate
(E) Index of leading indicators
4. The market value of all final goods and servicesproduced in the economy in a given year is
(A) net national product.
(B) national income.
(C) personal income.
(D) gross domestic product.
(E) producer price index.
5. Which of the following people would be consid-ered unemployed?
(A) A person who quits work to care for agingparents
(B) A person who stayed home to raise his chil-dren and now starts looking for a job
(C) A person who quits a job to return to schoolfull time
(D) A person who is qualified to teach but isdriving a bus until a teaching job is available
(E) A person who works two part-time jobs butis looking for a full-time job
6. In the gross domestic product, the largest dollaramount is
(A) consumer spending.
(B) rental payments.
(C) net exports of goods and services.
(D) gross private domestic investment.
(E) government purchases of goods and services.
7. The largest dollar amount of gross domesticproduct is
(A) rental payments.
(B) government expenditures on goods andservices.
(C) profit.
(D) net interest.
(E) wages and salaries to employees.
Sample Multiple-Choice Questions
2 Macroeconomics SAMPLE QUESTIONS MULTIPLE-CHOICE
UNIT
96 Advanced Placement Economics Macroeconomics: Student Activities © National Council on Economic Education, New York, N.Y.
8. Which of the following purchases is includedin the calculation of gross domestic product?
(A) A used economics textbook from thebookstore
(B) New harvesting equipment for the farm
(C) 1,000 shares of stock in a computer firm
(D) A car produced in a foreign country
(E) Government bonds issued by a foreignfirm
9. Which of the following would be included inthe calculation of gross domestic product?
(A) Government purchase of a new submarine
(B) Social Security payment to a retired mili-tary officer
(C) The purchase of a home built 10 years ago
(D) Contributions to a charity organization
(E) Work performed by a barber who cuts thehair of his or her own children
10. Which of the following would be counted asinvestment when calculating gross domesticproduct?
(A) The purchase of a used computer by anauto manufacturer
(B) The purchase of a share of IBM stock byan employee
(C) The construction of a new house
(D) The construction of roads by the govern-ment
(E) The profit earned when selling shares ofstock
11. Which of the following would be an exampleof an intermediate good or service?
(A) A calculator purchased by a collegestudent for taking exams
(B) Gasoline purchased by an insurance agentto visit clients at their homes
(C) A house purchased by a family with fourchildren
(D) A car purchased by a student’s parents andgiven to the student
(E) Tuition paid by a student at a state univer-sity
12. Of the following, which is the best example ofstructural unemployment?
(A) A computer programmer who quits herjob to move to a warmer climate
(B) A construction worker who loses his job inthe winter
(C) An auto worker who loses her job during arecession
(D) A steel worker who is replaced by a robot
(E) A toy maker who worked for a companythat closed because consumers did not buyits toys
13. If the price index in a country were 100 for theyear 2000 and 120 for 2003 and nominal grossdomestic product in 2003 were $480 billion,then real gross domestic product for 2003 in2000 dollars would be
(A) about $360 billion.
(B) about $380 billion.
(C) about $400 billion.
(D) about $600 billion.
(E) indeterminate with the given information.
2 Macroeconomics SAMPLE QUESTIONS MULTIPLE-CHOICE
UNIT
(continued)
Advanced Placement Economics Macroeconomics: Student Activities © National Council on Economic Education, New York, N.Y. 97
Use the following information for a hypotheticaleconomy to answer questions 14 and 15.
GDP GDPCurrent or Price Deflator Price DeflatorNominal Index Index
YEAR GDP (1990 = 100) (2000 = 100)
1990 $500 100
2000 $1,200 200 100
14. The value of the gross domestic product in2000, in terms of 1990 prices, was
(A) $600. (B) $700.
(C) $1,000. (D) $1,200.
(E) $1,300.
15. If 2000 were made the base year for the GDPprice deflator index, the value of the indexnumber for 1990 (rounded to the nearestwhole number) would be
(A) zero. (B) 42.
(C) 142. (D) 212.
(E) 256.
16. The CPI tends to overstate true changes in thecost of living for which of the following reasons?I. The index does not take into account a
change in quality.II. Consumers change purchase patterns as
prices change.III. The CPI includes only domestically pro-
duced goods.IV. Consumers often buy at discount rather
than retail.
(A) I only
(B) I and II only
(C) I, II and III only
(D) I, II and IV only
(E) I, II, III and IV
17. Which of the following is true about the natu-ral rate of unemployment?
(A) It can vary over time.
(B) It is 2 percent or less of the civilian labor force.
(C) It is equal to the structural unemploymentrate.
(D) It allows for some frictional and cyclicalunemployment.
(E) It is the full-employment rate minus thecyclical unemployment rate.
18. Suppose a factory added $5,000 worth of outputthis year. Incidentally, the waste from this factorycaused $1,000 worth of loss to the neighboringwaterways. As a result, gross domestic product will
(A) increase by $5,000.
(B) increase by $4,000.
(C) increase by $1,000.
(D) decrease by $4,000.
(E) decrease by $1,000.
19. Which of the following is true if real GDP inYear 1 is $5,000 and in Year 2 is $5,200?
(A) Output has increased by 4 percent.
(B) Output has declined by 4 percent.
(C) Output change is uncertain.
(D) The economy is experiencing 4 percentinflation.
(E) The economy is experiencing a recession.
20. When the actual inflation rate is greater thanthe anticipated inflation rate, which of the fol-lowing is most likely to suffer?
(A) Those who lend at a fixed interest rate
(B) Those who borrow at a fixed interest rate
(C) Retired persons with cost-of-living adjust-ment in their benefits
(D) Employers who hire workers with long-term labor contracts
(E) Those who lend with flexible interest rates
2 Macroeconomics SAMPLE QUESTIONS MULTIPLE-CHOICE
UNIT
(continued)


Advanced Placement Economics Macroeconomics: Student Activities © National Council on Economic Education, New York, N.Y. 99
Sample Short Free-Response Questions1. Answer the following questions about GDP.
(A) Explain whether this statement is true, false or uncertain: “To ignore the production of inter-mediate goods when measuring the total product of a country means ignoring the work, theefforts and the incomes of millions of citizens. This is a mistake and can be rectified only byincluding intermediate goods production in GDP figures.”
(B) Give two reasons for using real GDP per capita as a measure of the standard of living for anation.
(C) Give two reasons why real GDP per capita is not a good measure of the standard of living for anation.
2. Explain the statement “A man diminishes GDP by marrying his cook.”
2 Macroeconomics SAMPLE QUESTIONS SHORT FREE-RESPONSE
UNIT
100 Advanced Placement Economics Macroeconomics: Student Activities © National Council on Economic Education, New York, N.Y.
3. You read the headline: “Real GDP Rises 3% This Year; Further Increases Likely Next Year, Econo-mists Say.”
(A) What does this headline mean? Be specific.
(B) Why do people care about the growth in real GDP?
(C) What is the difference between real GDP and nominal GDP?
4. In a certain year, the annual unemployment rate was 6.1 percent. Define the term unemploymentrate, and explain its meaning. What other information do you want to know before recommend-ing a policy to reduce unemployment? Explain why you would want to know this information.
5. You read the following headline: “Inflation Rate at 1.1% — Lowest Rate in 2 Decades.”
(A) What is meant by inflation?
(B) How did the statisticians arrive at 1.1 percent? What measure did they probably use?
(C) What does this headline imply about inflation during the previous 20 years?
2 Macroeconomics SAMPLE QUESTIONS SHORT FREE-RESPONSE
UNIT
(continued)

Advanced Placement Economics Macroeconomics: Student Activities © National Council on Economic Education, New York, N.Y. 101
6. The following table shows a price index for a five-year period.
(A) Using 2000 as the base year, calculate the price index for each year.
Price Index Price IndexYear (1999 = 100) (2000 = 100)
1998 88 5
1999 100 5555
2000 120 23 /
2001 132
2002 140
(B) If 2001 nominal GDP were $400 billion and 2002 nominal GDP were $420 billion, what wasthe growth rate for the economy from 2001 to 2002?
7. Assume the inflation rate is 2 percent. How is this rate measured, and what does this rate of infla-tion mean to the average citizen?
2 Macroeconomics SAMPLE QUESTIONS SHORT FREE-RESPONSE
UNIT
(continued)

Advanced Placement Economics Macroeconomics: Student Activities © National Council on Economic Education, New York, N.Y. 103
Sample Long Free-Response Questions1. Define unanticipated inflation. How does unanticipated inflation affect lenders, borrowers, home-
owners and the federal government?
2 Macroeconomics SAMPLE QUESTIONS LONG FREE-RESPONSE
UNIT
104 Advanced Placement Economics Macroeconomics: Student Activities © National Council on Economic Education, New York, N.Y.
2. You read the following information about the economy:
■ Real GDP up 3 percent from a year ago
■ Unemployment rate of 4.6 percent
■ Consumer price index up 6 percent from a year ago
■ Index of leading indicators up for the last six months
■ Prime interest rate of 10 percent, up from 7 percent a year ago
(A) Explain what each of these economic indicators measures and the significance of the currentdata for the economy.
(B) These indicators should paint a picture of the entire economy. Describe this picture.
2 Macroeconomics SAMPLE QUESTIONS LONG FREE-RESPONSE
UNIT
(continued)
Macroeconomics | Unit 3Macroeconomics | Unit 3Aggregate Demand and
Aggregate Supply: Fluctuationsin Outputs and Prices


Advanced Placement Economics Macroeconomics: Student Activities © National Council on Economic Education, New York, N.Y. 107
■ The Keynesian aggregate expenditure modelis a simple model of the economy and showsthe multiplied effect that changes in govern-ment spending, taxes and investment canhave on the economy.
■ The marginal propensity to consume (MPC)is the additional consumption spendingfrom an additional dollar of income. Themarginal propensity to save (MPS) is theadditional savings from an additional dollarof income.
■ The marginal propensity to consume andthe marginal propensity to save are relatedby MPC + MPS = 1. In the simple model,an additional dollar of income will either beconsumed or saved.
■ The multiplier is a number that shows therelationship between changes in auton-omous spending and maximum changes inreal gross domestic product (real GDP).
■ In a simple model, the formula for calculat-ing the multiplier is
Income expenditure 1 1= _______ = ____
multiplier 1 – MPC MPS
■ The multiplier effects result from subse-quent rounds of induced spending thatoccur when autonomous spending changes.
■ Investment and its response to changes inthe interest rate are important in under-standing the relationship between monetarypolicy and GDP.
■ Aggregate demand (AD) and aggregate sup-ply (AS) curves look and operate much likethe supply and demand curves used inmicroeconomics. However, these macroeco-nomic AD and AS curves depict differentconcepts, and they change for different rea-sons than do microeconomic demand andsupply curves. AD and AS curves can be
used to illustrate changes in real output andthe price level of an economy.
■ The downward sloping aggregate demandcurve is explained by the interest rate effect,the wealth effect and the net export effect.The wealth effect is also called the real-balance effect.
■ The aggregate supply curve can be dividedinto three ranges: the horizontal range, theupward sloping or intermediate range, andthe vertical range.
■ Shifts in aggregate demand can change thelevel of output, the price level or both. Thedeterminants of aggregate demand includeconsumer spending, investment spending,government spending, net export spendingand money supply.
■ Shifts in aggregate supply can also changethe level of output and the price level. Thedeterminants of AS include changes in inputprices, productivity, the legal institutionalenvironment and the quantity of availableresources.
■ In the short run, economists think that equi-librium levels of GDP can occur at less than,greater than or at the full-employment level ofGDP. Economists believe that long-run equi-librium can occur only at full employment.
■ In a dynamic aggregate demand and aggre-gate supply model of the economy, changes inwages and prices over time induce the econo-my to move to the long-run equilibrium.
■ Fiscal policy consists of government actionsthat may increase or decrease aggregatedemand. These actions involve changes ingovernment expenditures and taxation.
■ The government uses an expansionary fiscalpolicy to try to increase aggregate demandduring a recession. The government may
3 Macroeconomics KEY IDEASUNIT
108 Advanced Placement Economics Macroeconomics: Student Activities © National Council on Economic Education, New York, N.Y.
decrease taxes, increase spending or do acombination of the two.
■ The government uses a contractionary fiscalpolicy to try to decrease aggregate demandwhen the economy is overheating. The gov-ernment may increase taxes, decrease spend-ing or do a combination of the two.
■ A change in output can also be illustrated bythe Keynesian aggregate expenditure model.This model differs from the AD and ASmodel because in the Keynesian model theprice level is assumed to be constant.
■ The AD and AS model can be reconciledwith the Keynesian expenditure model. Inthe horizontal range of the AS curve, bothmodels are identical. The models differ inthe intermediate and vertical ranges of theAS curve.
■ Autonomous spending is that part of ADthat is independent of the current rate ofeconomic activity.
■ Induced spending is that part of AD thatdepends on the current level of economicactivity.
■ Discretionary fiscal policy means the federalgovernment must take deliberate action orpass a new law changing taxes or spending.The automatic or built-in stabilizers changegovernment spending or taxes without newlaws being passed or deliberate action beingtaken.
■ Stagflation, when the economy simultane-ously experiences inflation and unemploy-ment, can be explained by a decrease inaggregate supply.
3 Macroeconomics KEY IDEASUNIT

Advanced Placement Economics Macroeconomics: Student Activities © National Council on Economic Education, New York, N.Y. 109
3
Keynesian EquilibriumThis activity is designed to give you practice with manipulations of the aggregate expenditure model.It shows you how the expenditure schedule is derived and how it helps to determine the equilibriumlevel of income. This activity assumes that the price level is constant with the consumer price indexor price level having a value of 100. All numbers in Figure 19.1 are in billions of constant dollars.
Figure 19.1Income-Expenditure Schedule
Total SpendingIncome Consumption Investment Government (Aggregate(Output) Spending Spending Spending Expenditure)
$2,400 $2,500 $300 $100
2,600 2,600 300 100
2,800 2,700 300 100
3,000 2,800 300 100
3,200 2,900 300 100
3,400 3,000 300 100
3,600 3,100 300 100
3,800 3,200 300 100
1. Use the data on consumption spending and income to draw the consumption function on thegraph in Figure 19.2. Label the function C.
2. Using the consumption function you have just drawn and the data on investment and governmentspending, draw the aggregate expenditure schedule on the same graph. Label it AE (C + I + G).What is the difference between the aggregate expenditure schedule and the consumptionfunction?
3. Now draw a line representing all the points at which total spending and income could be equal.Label this the 45° line.
4. The 45° line represents all the points that could be the equilibrium level of total spending. Nowcircle the one point that is the equilibrium level of total spending. What is the equilibrium level oftotal spending on your graph? ________________
Macroeconomics LESSON 1 ■ ACTIVITY 19UNIT
Adapted from William J. Baumol and Alan S. Blinder, Economics, Principles and Policy, 3rd ed. (New York: Harcourt Brace &Company, 1985), p. 55. James Chasey, Homewood-Flossmoor High School, Flossmoor, Ill., contributed to this activity.
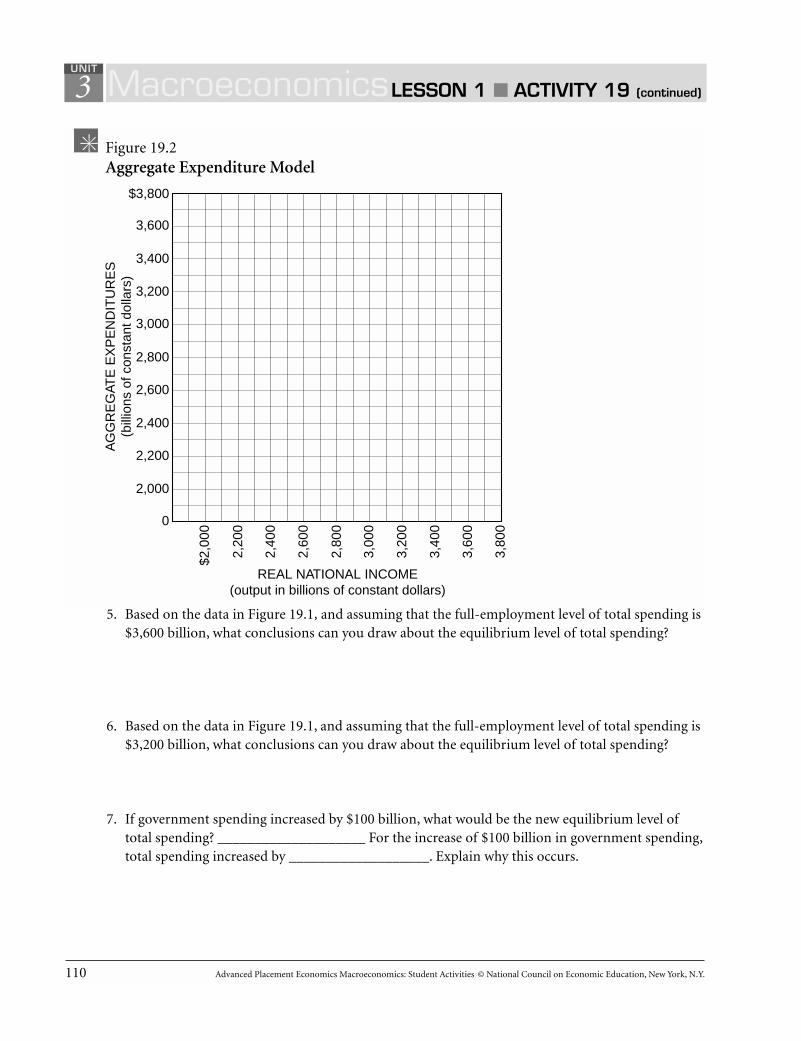
110 Advanced Placement Economics Macroeconomics: Student Activities © National Council on Economic Education, New York, N.Y.
3
5. Based on the data in Figure 19.1, and assuming that the full-employment level of total spending is$3,600 billion, what conclusions can you draw about the equilibrium level of total spending?
6. Based on the data in Figure 19.1, and assuming that the full-employment level of total spending is$3,200 billion, what conclusions can you draw about the equilibrium level of total spending?
7. If government spending increased by $100 billion, what would be the new equilibrium level oftotal spending? ____________________ For the increase of $100 billion in government spending,total spending increased by ___________________. Explain why this occurs.
MacroeconomicsLESSON 1 ■ ACTIVITY 19 (continued)
UNIT
$2,0
00
0
2,000
2,200
2,400
2,600
2,800
3,000
3,200
3,400
3,600
$3,800
AG
GR
EG
ATE
EX
PE
ND
ITU
RE
S(b
illio
ns o
f con
stan
t dol
lars
)
2,20
0
2,40
0
2,60
0
2,80
0
3,00
0
3,20
0
REAL NATIONAL INCOME(output in billions of constant dollars)
Figure 19.2Aggregate Expenditure Model
3,40
0
3,60
0
3,80
0

Advanced Placement Economics Macroeconomics: Student Activities © National Council on Economic Education, New York, N.Y. 111
3
Practice with APC, APS, MPC and MPS
Part AAverage PropensitiesThe average propensity to consume (APC) is the ratio of consumption expenditures (C) to disposableincome (DI), or APC = C / DI.
The average propensity to save (APS) is the ratio of savings (S) to disposable income, or APS = S / DI.
1. Using the data in Figure 20.1, calculate the APC and APS at each level of disposable income given.The first calculation is completed as an example.
Figure 20.1Average Propensities to Consume and to Save
DisposableIncome Consumption Saving APC APS
$0 $2,000 –$2,000 — —
2,000 3,600 –1,600 1.8 –0.8
4,000 5,200 –1,200
6,000 6,800 –800
8,000 8,400 –400
10,000 10,000 0
12,000 11,600 400
2. How can savings be negative? Explain.
Part BMarginal PropensitiesThe marginal propensity to consume (MPC) is the change in consumption divided by the change in dis-posable income. It is a fraction of any change in DI that is spent on consumer goods: MPC = ∆C / ∆DI.
The marginal propensity to save (MPS) is the fraction saved of any change in disposable income.The MPS is equal to the change in saving divided by the change in DI: MPS = ∆S / ∆DI.
3. Using the data in Figure 20.2, calculate the MPC and MPS at each level of disposable income. Thefirst calculation is completed as an example. (This is not a typical consumption function. Its pur-pose is to provide practice in calculating MPC and MPS.)
Macroeconomics LESSON 1 ■ ACTIVITY 20UNIT
Activity written by John Morton, National Council on Economic Education, New York, N.Y., and James Spellicy, Lowell High School,San Francisco, Calif.
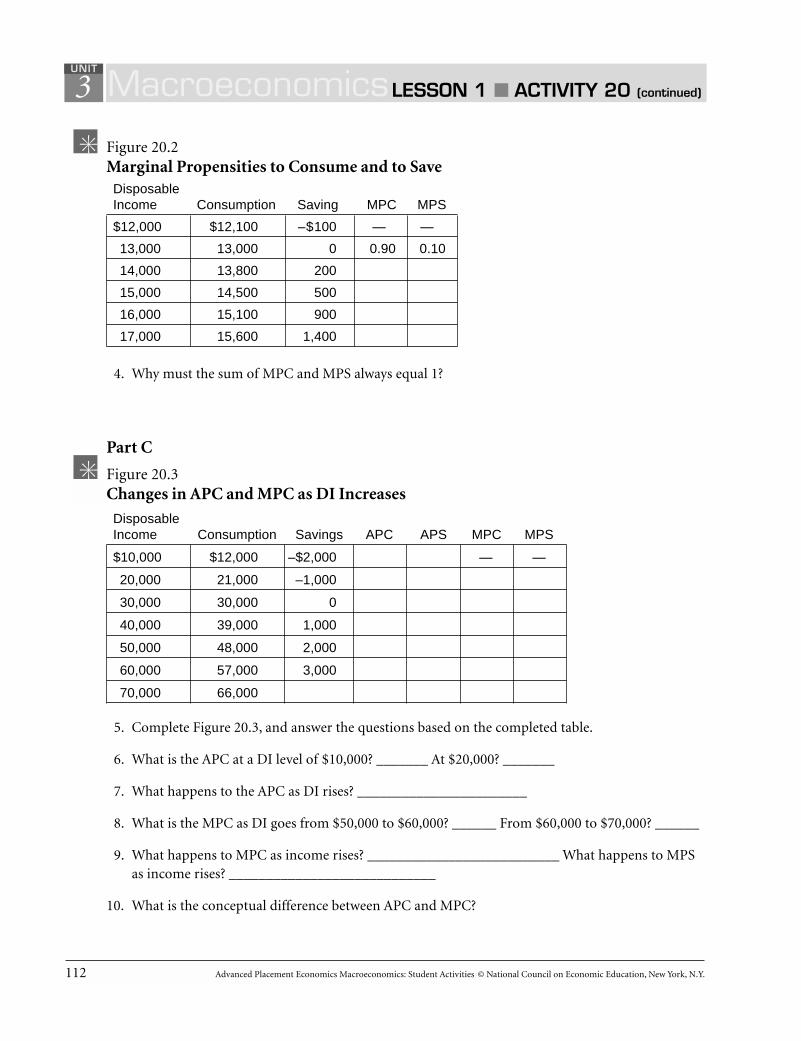
112 Advanced Placement Economics Macroeconomics: Student Activities © National Council on Economic Education, New York, N.Y.
3
Figure 20.2Marginal Propensities to Consume and to SaveDisposableIncome Consumption Saving MPC MPS
$12,000 $12,100 –$100 — —
13,000 13,000 0 0.90 0.10
14,000 13,800 200
15,000 14,500 500
16,000 15,100 900
17,000 15,600 1,400
4. Why must the sum of MPC and MPS always equal 1?
Part C
Figure 20.3Changes in APC and MPC as DI Increases
DisposableIncome Consumption Savings APC APS MPC MPS
$10,000 $12,000 –$2,000 — —
20,000 21,000 –1,000
30,000 30,000 0
40,000 39,000 1,000
50,000 48,000 2,000
60,000 57,000 3,000
70,000 66,000
5. Complete Figure 20.3, and answer the questions based on the completed table.
6. What is the APC at a DI level of $10,000? _______ At $20,000? _______
7. What happens to the APC as DI rises? _______________________
8. What is the MPC as DI goes from $50,000 to $60,000? ______ From $60,000 to $70,000? ______
9. What happens to MPC as income rises? __________________________ What happens to MPSas income rises? ____________________________
10. What is the conceptual difference between APC and MPC?
MacroeconomicsLESSON 1 ■ ACTIVITY 20 (continued)
UNIT

Advanced Placement Economics Macroeconomics: Student Activities © National Council on Economic Education, New York, N.Y. 113
3
The Magic of the MultiplierThe people in Econoland live on an isolated island. One year a stranger arrived and built a factory tomake seashell charms. The factory is considered an investment on Econoland. If the marginal pro-pensity to consume on the island were 75 percent, or 0.75, this would mean that Econoland residentswould consume or spend 75 percent of any change in income and save 25 percent of any change inincome. The additional spending would generate additional income and eventually a multipleincrease in income. This is called the multiplier effect. When they heard about this multiplier effect,the islanders were thrilled about the new factory because they liked the idea of additional income.
The residents of Econoland wanted to know what would eventually happen to the levels of GDP,consumption and saving on the island as the new spending worked its way through the economy.Luckily there was a retired university economist who had settled on Econoland who offered a briefstatement of the multiplier. “It’s simple,” he said: “One person’s spending becomes another person’sincome.” The economist began a numerical example. “This shows the process,” he said. The roundsrefer to the new spending moving from resident to resident. He stopped his example at four roundsand added the rest of the rounds to cover all Econoland’s citizens.
Figure 21.1Changes in Econoland’s GDP, Consumption and Saving
Round Income (GDP) Consumption Spending Saving
Round 1 $1,000 0.75 of $1,000 = $750 0.25 of $1,000 = $250
Round 2 One person’s spendingbecoming another person’s 0.75 of $750 0.25 of $750income: $750 = $562.50 = $187.50
Round 3 The next person’s spendingbecoming another person’s 0.75 of $562.50 0.25 of $562.50income: $562.50 = $421.88 = $140.62
Round 4 The next person’s spendingbecoming another person’s 0.75 of $421.88 0.25 of $421.87income: $421.87 = $316.41 = $105.47
Rounds • • •
continue • • •
• • •
All rounds Final outcome for Final outcome for Final outcomeincome (GDP) consumption for saving1 / (1 – 0.75) x $1,000 = spending 0.25 of $4,000 = $1,0004 x $1,000 = $4,000 0.75 of $4,000 = $3,000
Macroeconomics LESSON 1 ■ ACTIVITY 21UNIT
Activity written by Charles Bennett, Gannon University, Erie, Pa.

114 Advanced Placement Economics Macroeconomics: Student Activities © National Council on Economic Education, New York, N.Y.
3The retired economist then summarized the multiplier effect for the assembled crowd of
Econolanders. “This shows us that the factory is an investment that has a multiplied effect on ourGDP. In this case, the multiplier is 4.” He added, “It appears to be magic, but it is simply that one per-son’s spending becomes another person’s income.” There were some nods of agreement but also manypuzzled looks, so the old professor asked the citizens a series of questions. Answer these questions asif you were an Econolander.
1. Would the multiplier be larger or smaller if you saved more of your additional income? ________
2. What do you think would happen if all Econolanders saved all of the change in their incomes?
3. What would happen if you spent all of the change in your income?
The professor broke out into a smile as the answers all came out correct.
The economist reminded the islanders about the multiplied effect on GDP that a new road aroundthe island would have. That new bridge built by the island government over the lagoon would alsohave a multiplied effect on GDP. This time there were many more nods of approval and understand-ing.
The economist also indicated that if the government of Econoland lowered taxes, the citizenswould have more income to spend, which would cause a multiplier effect. He said there was anotherside to this: If the taxes were raised, there would be a multiplier effect, which would decrease incomeand GDP by a multiple amount.
The King of Econoland commissioned the old economist to write a simple explanation about mul-tipliers so all the citizens of Econoland would understand. He told the old economist: “If you succeedin helping all citizens understand the multiplier in simple terms, you will be rewarded. If not, you willbe banished from the island.”
The economist started banging away on an old rusting typewriter since he did not want to be ban-ished from this island paradise. The result follows:
MacroeconomicsLESSON 1 ■ ACTIVITY 21 (continued)
UNIT

Advanced Placement Economics Macroeconomics: Student Activities © National Council on Economic Education, New York, N.Y. 115
3
The Professor’s Treatise on Multipliers
MULTIPLIER FORMULAS AND TERMS
Marginal propensity to consume (MPC) = change in consumption divided by change in income
Marginal propensity to save (MPS) = change in saving divided by change in income
Investment Multiplier = 1 / (1 – MPC) or simply 1 / MPS
How to use the investment multiplier: change in GDP = change in investment times investmentmultiplier
When to use the investment multiplier: when there is a change in investment such as a new factory ornew equipment
Government Spending Multiplier = 1 / (1 – MPC) or simply 1 / MPS
How to use the government spending multiplier: change in GDP = change in government spendingtimes government spending multiplier
When to use the government spending multiplier: when there is a change in government spending suchas a new road or bridge
Tax Multiplier = – MPC / (1 – MPC) = – MPC / MPS
How to use the tax multiplier: change in GDP = change in taxes times tax multiplier
When to use the tax multiplier: when there is a change in lump-sum taxes. Remember that the taxmultiplier has a negative sign.
Figure 21.2Multiplier Table(Derived from using the formulas above)
GovernmentInvestment Spending Tax
MPC Multiplier Multiplier Multiplier0.90 10.0 10.0 –9.00.80 5.0 5.0 –4.00.75 4.0 4.0 –3.00.60 2.5 2.5 –1.50.50 2.0 2.0 –1.0
“ALWAYS” RULES (A surefire way to remember multipliers)
■ The investment multiplier is always equal to the same value as the government spending multiplier.
■ The investment and government spending multipliers are always positive.
■ The tax multiplier is always negative.
MacroeconomicsLESSON 1 ■ ACTIVITY 21 (continued)
UNIT
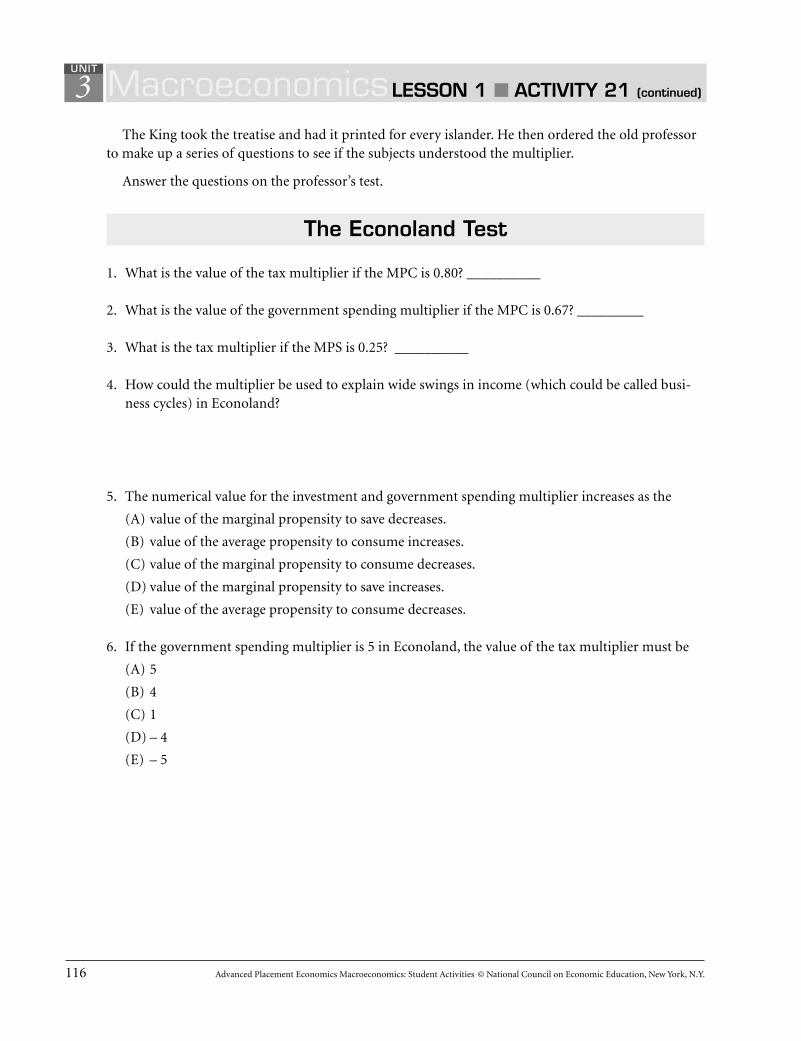
116 Advanced Placement Economics Macroeconomics: Student Activities © National Council on Economic Education, New York, N.Y.
3The King took the treatise and had it printed for every islander. He then ordered the old professor
to make up a series of questions to see if the subjects understood the multiplier.
Answer the questions on the professor’s test.
The Econoland Test
1. What is the value of the tax multiplier if the MPC is 0.80? __________
2. What is the value of the government spending multiplier if the MPC is 0.67? _________
3. What is the tax multiplier if the MPS is 0.25? __________
4. How could the multiplier be used to explain wide swings in income (which could be called busi-ness cycles) in Econoland?
5. The numerical value for the investment and government spending multiplier increases as the
(A) value of the marginal propensity to save decreases.
(B) value of the average propensity to consume increases.
(C) value of the marginal propensity to consume decreases.
(D) value of the marginal propensity to save increases.
(E) value of the average propensity to consume decreases.
6. If the government spending multiplier is 5 in Econoland, the value of the tax multiplier must be
(A) 5
(B) 4
(C) 1
(D) – 4
(E) – 5
MacroeconomicsLESSON 1 ■ ACTIVITY 21 (continued)
UNIT
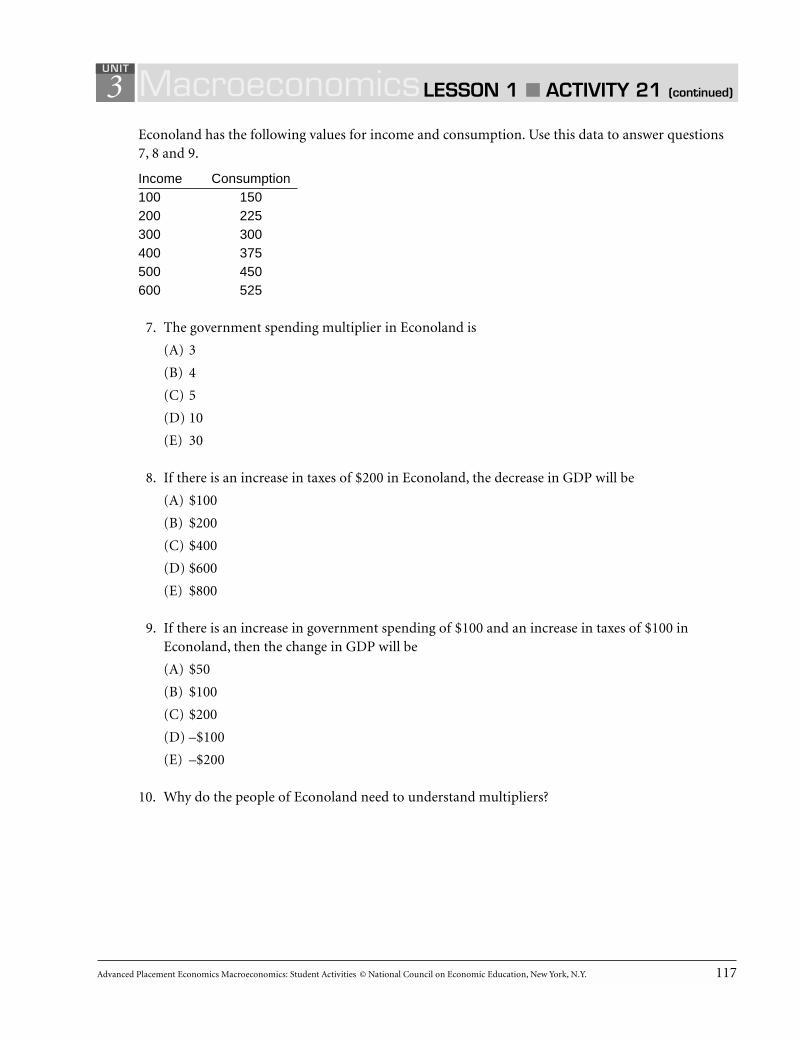
Advanced Placement Economics Macroeconomics: Student Activities © National Council on Economic Education, New York, N.Y. 117
3Econoland has the following values for income and consumption. Use this data to answer questions7, 8 and 9.
Income Consumption100 150200 225300 300400 375500 450600 525
7. The government spending multiplier in Econoland is
(A) 3
(B) 4
(C) 5
(D) 10
(E) 30
8. If there is an increase in taxes of $200 in Econoland, the decrease in GDP will be
(A) $100
(B) $200
(C) $400
(D) $600
(E) $800
9. If there is an increase in government spending of $100 and an increase in taxes of $100 inEconoland, then the change in GDP will be
(A) $50
(B) $100
(C) $200
(D) –$100
(E) –$200
10. Why do the people of Econoland need to understand multipliers?
MacroeconomicsLESSON 1 ■ ACTIVITY 21 (continued)
UNIT

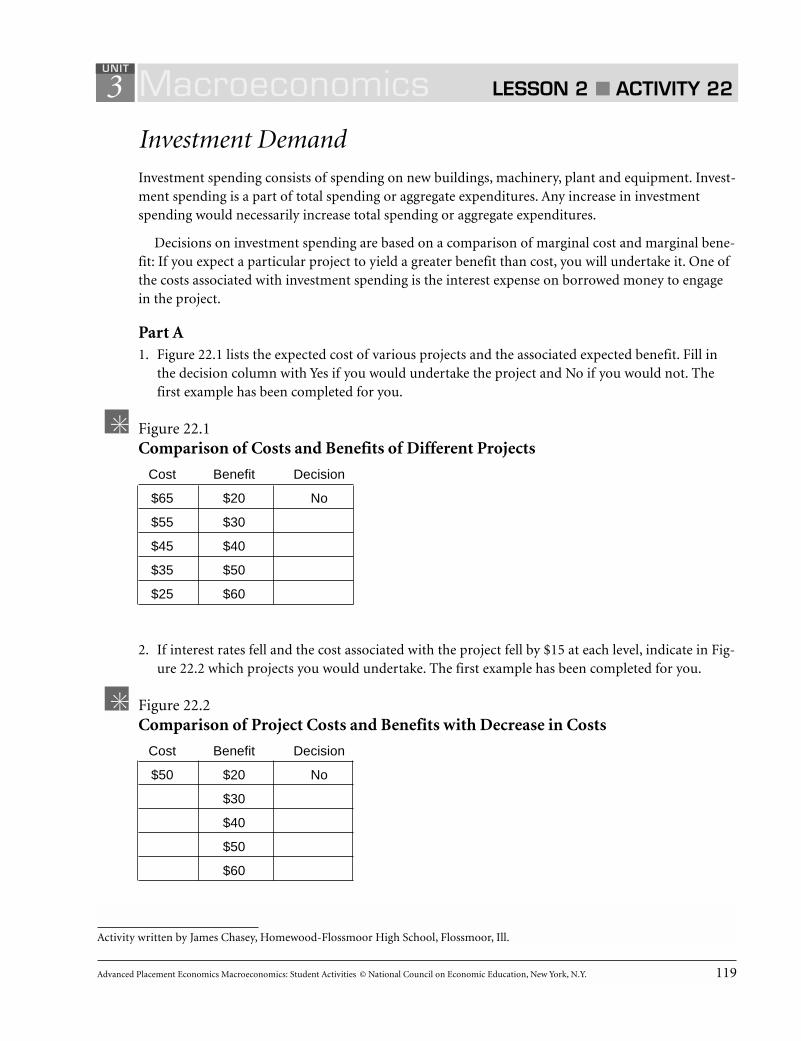
Advanced Placement Economics Macroeconomics: Student Activities © National Council on Economic Education, New York, N.Y. 119
3
Investment DemandInvestment spending consists of spending on new buildings, machinery, plant and equipment. Invest-ment spending is a part of total spending or aggregate expenditures. Any increase in investmentspending would necessarily increase total spending or aggregate expenditures.
Decisions on investment spending are based on a comparison of marginal cost and marginal bene-fit: If you expect a particular project to yield a greater benefit than cost, you will undertake it. One ofthe costs associated with investment spending is the interest expense on borrowed money to engagein the project.
Part A1. Figure 22.1 lists the expected cost of various projects and the associated expected benefit. Fill in
the decision column with Yes if you would undertake the project and No if you would not. Thefirst example has been completed for you.
Figure 22.1Comparison of Costs and Benefits of Different Projects
Cost Benefit Decision
$65 $20 No
$55 $30
$45 $40
$35 $50
$25 $60
2. If interest rates fell and the cost associated with the project fell by $15 at each level, indicate in Fig-ure 22.2 which projects you would undertake. The first example has been completed for you.
Figure 22.2Comparison of Project Costs and Benefits with Decrease in Costs
Cost Benefit Decision
$50 $20 No
$30
$40
$50
$60
Macroeconomics LESSON 2 ■ ACTIVITY 22UNIT
Activity written by James Chasey, Homewood-Flossmoor High School, Flossmoor, Ill.
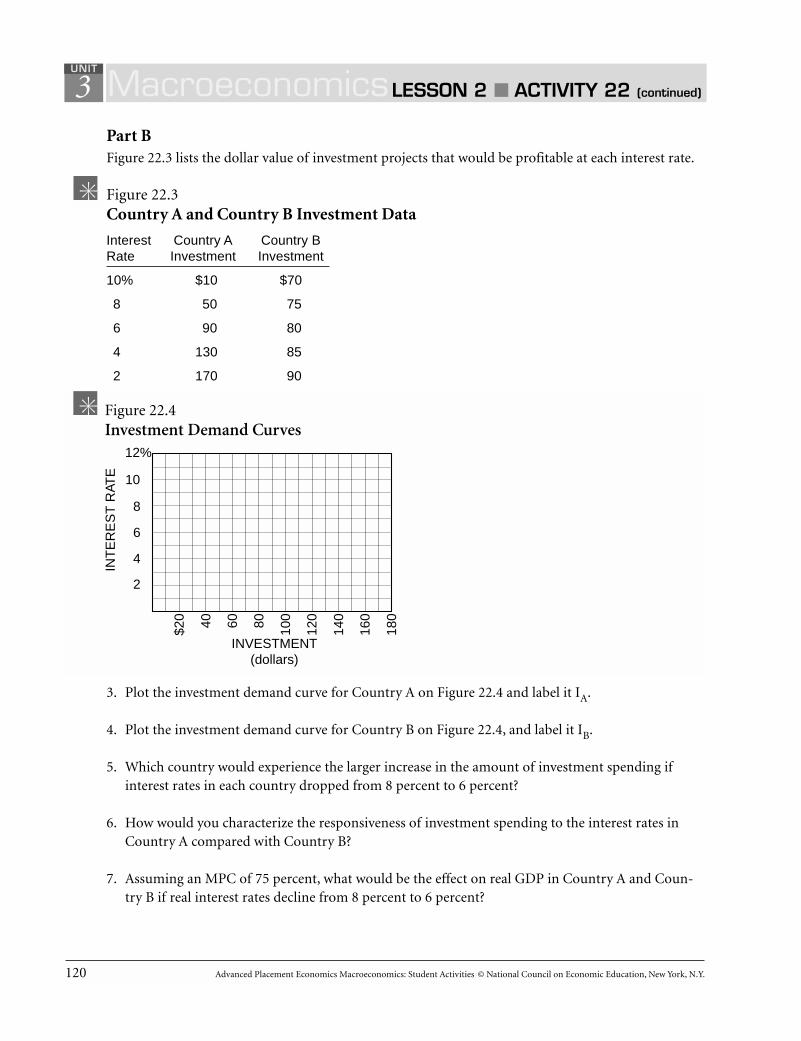
120 Advanced Placement Economics Macroeconomics: Student Activities © National Council on Economic Education, New York, N.Y.
3Part BFigure 22.3 lists the dollar value of investment projects that would be profitable at each interest rate.
Figure 22.3Country A and Country B Investment Data
Interest Country A Country BRate Investment Investment
10% $10 $70
8 50 75
6 90 80
4 130 85
2 170 90
3. Plot the investment demand curve for Country A on Figure 22.4 and label it IA.
4. Plot the investment demand curve for Country B on Figure 22.4, and label it IB.
5. Which country would experience the larger increase in the amount of investment spending ifinterest rates in each country dropped from 8 percent to 6 percent?
6. How would you characterize the responsiveness of investment spending to the interest rates inCountry A compared with Country B?
7. Assuming an MPC of 75 percent, what would be the effect on real GDP in Country A and Coun-try B if real interest rates decline from 8 percent to 6 percent?
MacroeconomicsLESSON 2 ■ ACTIVITY 22 (continued)
UNIT
Figure 22.4Investment Demand Curves
$20 40 60 80 100
120
140
160
180
2
4
6
8
10%
INT
ER
ES
T R
ATE
INVESTMENT(dollars)
12%
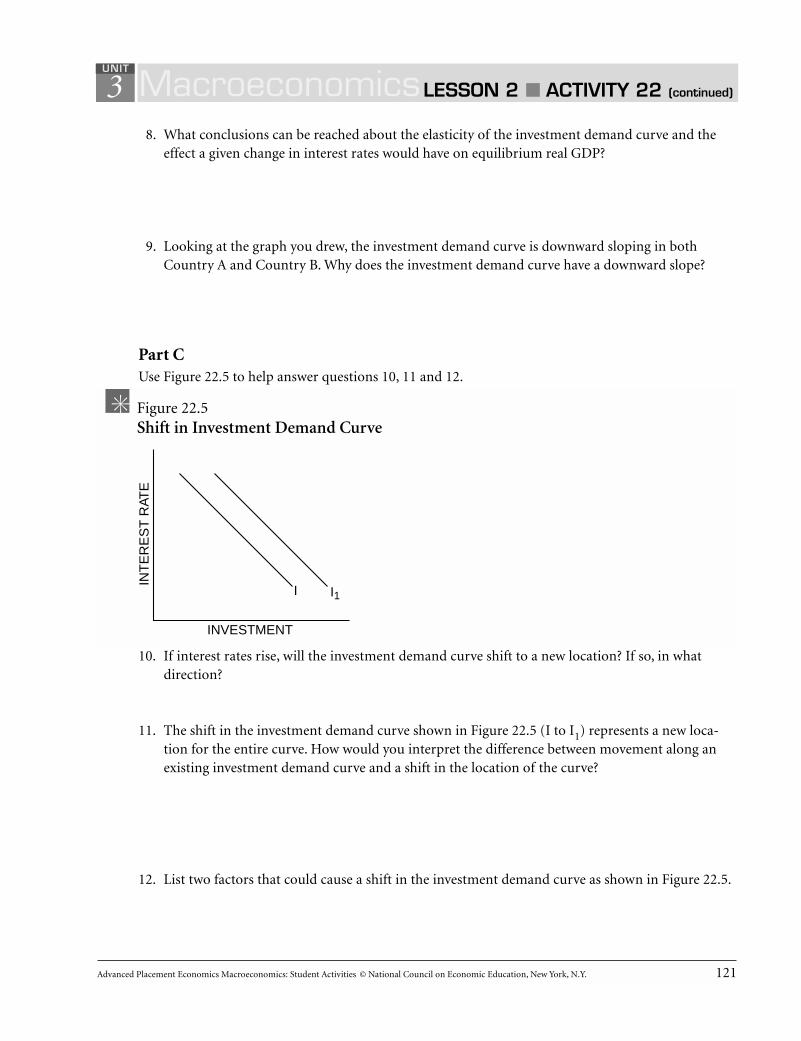
Advanced Placement Economics Macroeconomics: Student Activities © National Council on Economic Education, New York, N.Y. 121
38. What conclusions can be reached about the elasticity of the investment demand curve and the
effect a given change in interest rates would have on equilibrium real GDP?
9. Looking at the graph you drew, the investment demand curve is downward sloping in bothCountry A and Country B. Why does the investment demand curve have a downward slope?
Part CUse Figure 22.5 to help answer questions 10, 11 and 12.
10. If interest rates rise, will the investment demand curve shift to a new location? If so, in whatdirection?
11. The shift in the investment demand curve shown in Figure 22.5 (I to I1) represents a new loca-tion for the entire curve. How would you interpret the difference between movement along anexisting investment demand curve and a shift in the location of the curve?
12. List two factors that could cause a shift in the investment demand curve as shown in Figure 22.5.
MacroeconomicsLESSON 2 ■ ACTIVITY 22 (continued)
UNIT
INT
ER
ES
T R
ATE
INVESTMENT
I1I
Figure 22.5Shift in Investment Demand Curve


Advanced Placement Economics Macroeconomics: Student Activities © National Council on Economic Education, New York, N.Y. 123
3
An Introduction to Aggregate Demand
Part AWhy Is the Aggregate Demand Curve Downward Sloping?
1. According to the AD curve, what is the relationship between the price level and real GDP?
2. Explain how each of the following effects helps explain why the AD curve is downward sloping.
(A) Interest rate effect
(B) Wealth effect or real-balance effect
(C) Net export effect
Macroeconomics LESSON 3 ■ ACTIVITY 23UNIT
Activity written by John Morton, National Council on Economic Education, New York, N.Y.
PR
ICE
LE
VE
L
REAL GDP
AD
Figure 23.1Aggregate Demand Curve
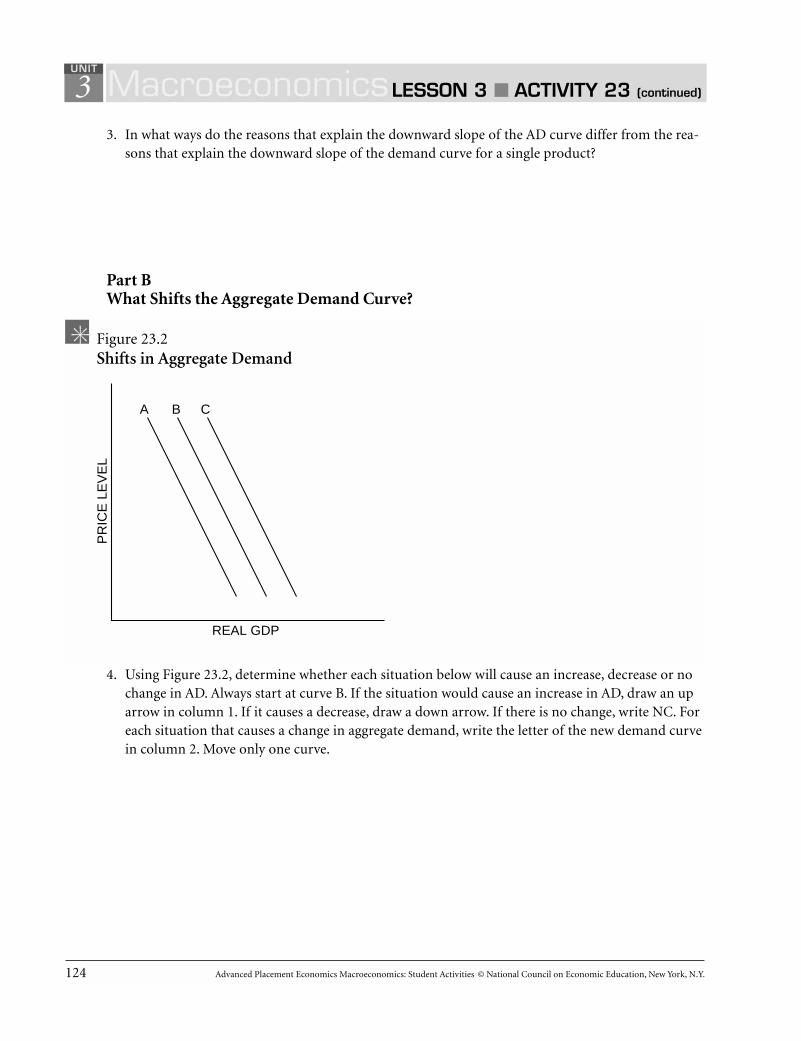
124 Advanced Placement Economics Macroeconomics: Student Activities © National Council on Economic Education, New York, N.Y.
33. In what ways do the reasons that explain the downward slope of the AD curve differ from the rea-
sons that explain the downward slope of the demand curve for a single product?
Part BWhat Shifts the Aggregate Demand Curve?
4. Using Figure 23.2, determine whether each situation below will cause an increase, decrease or nochange in AD. Always start at curve B. If the situation would cause an increase in AD, draw an uparrow in column 1. If it causes a decrease, draw a down arrow. If there is no change, write NC. Foreach situation that causes a change in aggregate demand, write the letter of the new demand curvein column 2. Move only one curve.
MacroeconomicsLESSON 3 ■ ACTIVITY 23 (continued)
UNIT
PR
ICE
LE
VE
L
REAL GDP
A B C
Figure 23.2Shifts in Aggregate Demand
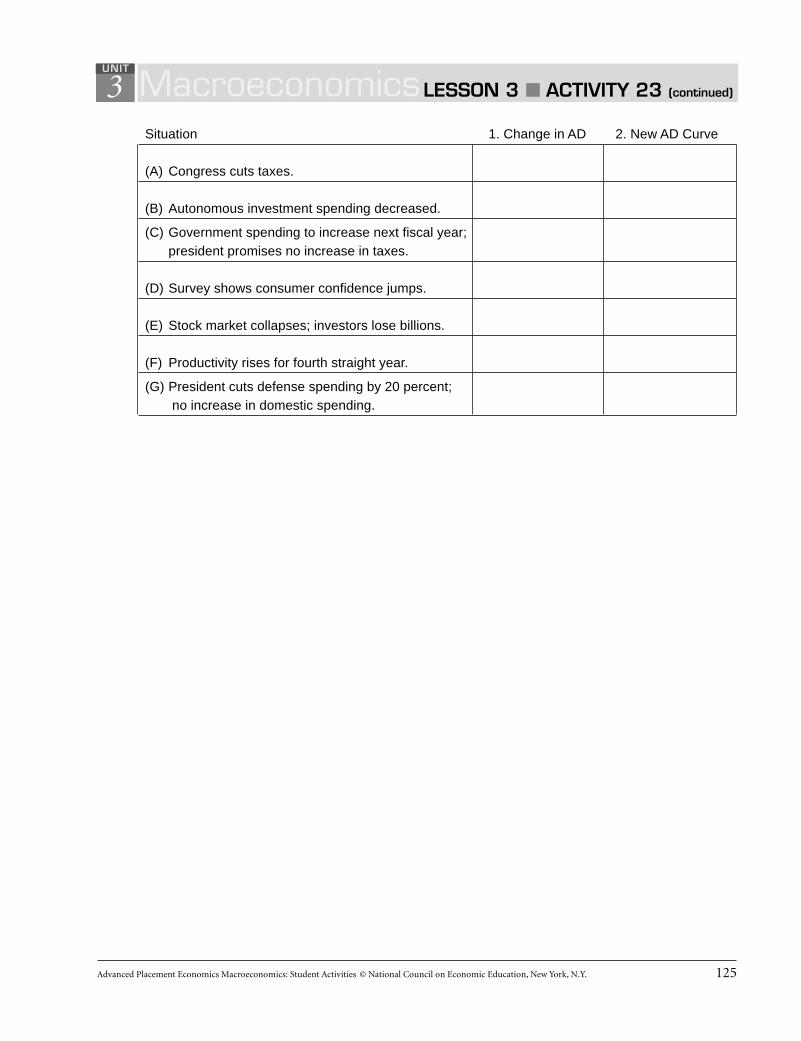
Advanced Placement Economics Macroeconomics: Student Activities © National Council on Economic Education, New York, N.Y. 125
3Situation 1. Change in AD 2. New AD Curve
(A) Congress cuts taxes.
(B) Autonomous investment spending decreased.
(C) Government spending to increase next fiscal year; president promises no increase in taxes.
(D) Survey shows consumer confidence jumps.
(E) Stock market collapses; investors lose billions.
(F) Productivity rises for fourth straight year.
(G) President cuts defense spending by 20 percent;no increase in domestic spending.
MacroeconomicsLESSON 3 ■ ACTIVITY 23 (continued)
UNIT


Advanced Placement Economics Macroeconomics: Student Activities © National Council on Economic Education, New York, N.Y. 127
3
An Introduction to Short-Run Aggregate Supply
Part AWhy Can the Aggregate Supply Curve Have Three Different Shapes?
1. Under what conditions would an economy have a horizontal SRAS curve?
2. Under what conditions would an economy have a vertical SRAS curve?
3. Under what conditions would an economy have a positively sloped SRAS curve?
Macroeconomics LESSON 4 ■ ACTIVITY 24UNIT
Activity written by John Morton, National Council on Economic Education, New York, N.Y.
Figure 24.1Possible Shapes of Aggregate Supply Curve
REAL GDP
SRAS
SRAS SRAS
PR
ICE
LE
VE
L
REAL GDP
PR
ICE
LE
VE
L
REAL GDP
PR
ICE
LE
VE
L

128 Advanced Placement Economics Macroeconomics: Student Activities © National Council on Economic Education, New York, N.Y.
34. Assume AD increased. What would be the effect on real GDP and the price level if the economy
had a horizontal SRAS curve? A positively sloped SRAS curve? A vertical SRAS curve?
5. What range of the SRAS curve do you think the economy is in today? Explain.
Part BWhat Shifts the Short-Run Aggregate Supply Curve?
6. Using Figure 24.2, determine whether each situation below will cause an increase, decrease or nochange in short-run aggregate supply (SRAS). Always start at curve B. If the situation would causean increase in SRAS, draw an up arrow in column 1. If it causes a decrease, draw a down arrow. Ifthere is no change, write NC. For each situation that causes a change in SRAS, write the letter ofthe new curve in column 2. Move only one curve.
MacroeconomicsLESSON 4 ■ ACTIVITY 24 (continued)
UNIT
PR
ICE
LE
VE
L
REAL GDP
AB
C
Figure 24.2Shifts in Short-Run Aggregate Supply

Advanced Placement Economics Macroeconomics: Student Activities © National Council on Economic Education, New York, N.Y. 129
3Situation 1. Change in SRAS 2. New SRAS Curve
(A) Unions grow more aggressive; wage rates increase.
(B) OPEC successfully increases oil prices.
(C) Labor productivity increases dramatically.
(D) Giant natural gas discovery decreases energy prices.
(E) Computer technology brings new efficiencyto industry.
(F) Government spending increases.
(G) Cuts in tax rates increase incentives to save.
(H) Low birth rate will decrease the labor force in future.
(I) Research shows that improved schools have increased the skills of American workers and managers.
MacroeconomicsLESSON 4 ■ ACTIVITY 24 (continued)
UNIT

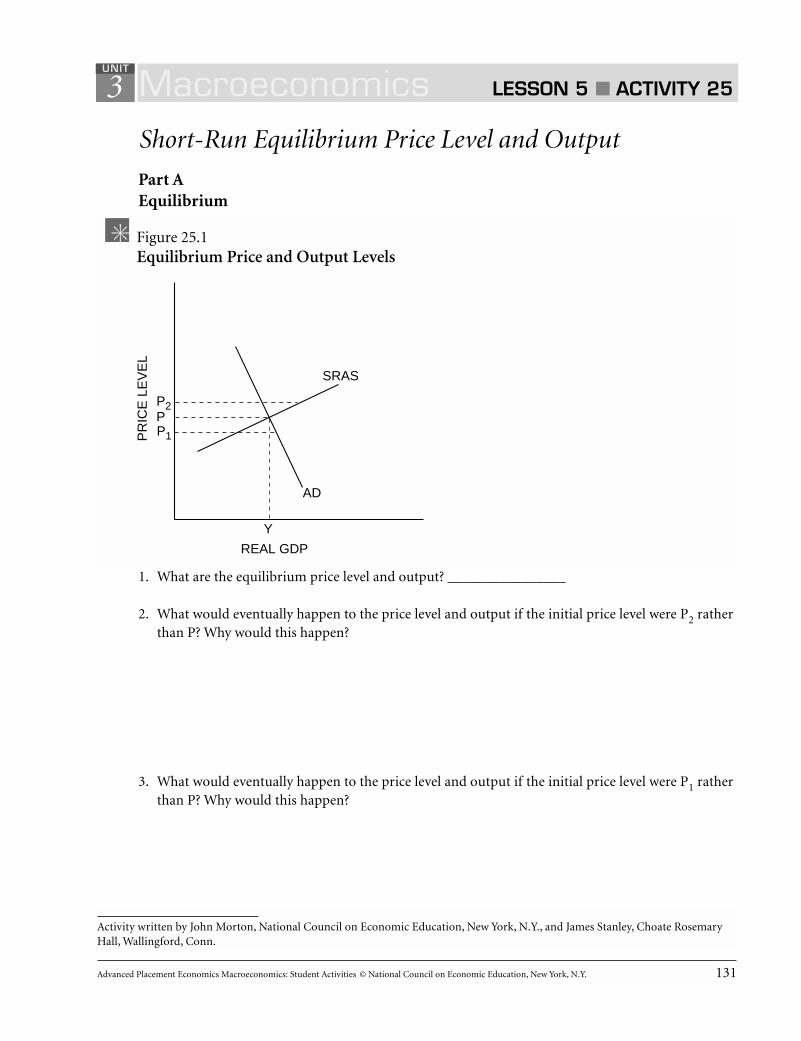
Advanced Placement Economics Macroeconomics: Student Activities © National Council on Economic Education, New York, N.Y. 131
3
Short-Run Equilibrium Price Level and Output
Part AEquilibrium
1. What are the equilibrium price level and output? ________________
2. What would eventually happen to the price level and output if the initial price level were P2 ratherthan P? Why would this happen?
3. What would eventually happen to the price level and output if the initial price level were P1 ratherthan P? Why would this happen?
Macroeconomics LESSON 5 ■ ACTIVITY 25UNIT
Activity written by John Morton, National Council on Economic Education, New York, N.Y., and James Stanley, Choate RosemaryHall, Wallingford, Conn.
PP1
SRAS
AD
Y
REAL GDP
PR
ICE
LE
VE
L
P2
Figure 25.1Equilibrium Price and Output Levels

132 Advanced Placement Economics Macroeconomics: Student Activities © National Council on Economic Education, New York, N.Y.
3Part BChanges in the Equilibrium Price Level and OutputFor each situation described below, illustrate the change on the AD and AS graph and describe theeffect on the equilibrium price level and real GDP by circling the correct symbol: ↑ for increase,↓ for decrease, or — for unchanged.
4. Congress passes a tax cut for the middle 5. During a recession, the governmentclass, and the president signs it. increases spending on schools,
highways and other public works.
Price level: — Price level: —
Real GDP: — Real GDP: —
6. New oil discoveries cause large decreases 7. Illustrate the effects of an increase in aggregatein energy prices. demand.
Price level — Price level —
Real GDP — Real GDP —
➞
➞➞
➞➞
➞➞
➞➞
➞➞
➞➞
➞➞
➞
MacroeconomicsLESSON 5 ■ ACTIVITY 25 (continued)
UNIT
REAL GDP
Middle Class Tax Cut
PR
ICE
LE
VE
L
SRAS
AD
REAL GDP
Increased Government Spending
PR
ICE
LE
VE
L
SRAS
AD
REAL GDP
New Oil Discoveries
PR
ICE
LE
VE
L
SRAS
AD
REAL GDP
Effects of an Increase in AD
PR
ICE
LE
VE
L
SRAS
AD

Advanced Placement Economics Macroeconomics: Student Activities © National Council on Economic Education, New York, N.Y. 133
38. Illustrate the effects of increases in 9. New technology and better
production costs. education increase productivity.
Price level — Price level —
Real GDP — Real GDP —
10. A new president makes consumers and 11. With the unemployment rate at fivebusinesses more confident about the percent, the federal governmentfuture economy. Note: Show the reduces personal taxes and increaseschange in AD only. spending. Note: Show the change in AD only.
Price level — Price level —
Real GDP — Real GDP —
➞
➞
➞
➞
➞
➞
➞
➞
➞
➞
➞
➞
➞
➞
➞
➞
MacroeconomicsLESSON 5 ■ ACTIVITY 25 (continued)
UNIT
REAL GDP
Effects of Increases in Production CostsP
RIC
E L
EV
EL
SRAS
AD
REAL GDP
Increased Confidence for Future Economy
PR
ICE
LE
VE
L
SRAS
AD
REAL GDP
Reduced Taxes and IncreasedGovernment Spending
PR
ICE
LE
VE
L
SRAS
AD
LRAS
REAL GDP
Effects of New Technologyand Better Education
PR
ICE
LE
VE
L SRAS
AD

134 Advanced Placement Economics Macroeconomics: Student Activities © National Council on Economic Education, New York, N.Y.
3Part CSummarizing Aggregate Demand and Aggregate Supply ShiftsFor each of the events below, make additions to the graph to illustrate the change. Then indicate theresponse in terms of shifts in or movements along the aggregate demand or aggregate supply curveand the short-run effect on real GDP and the price level. Indicate shifts in the curve by S and move-ments along the curve by A. Indicate the changes in price level, unemployment and real GDP with anup arrow for an increase and a down arrow for a decrease.
MacroeconomicsLESSON 5 ■ ACTIVITY 25 (continued)
UNIT
REAL GDPP
RIC
E L
EV
EL
SRAS
REAL GDP
AD Curve
AS Curve
Real GDP
Price Level
Unemployment
PR
ICE
LE
VE
L
REAL GDP
PR
ICE
LE
VE
L
SRAS
3. Boom in invest-ment assuming some unemployed resources are available
1. Increase in laborproductivity due totechnological change
2. Increase in theprice of inputs usedby many firms
4. A major reduc-tion in investmentspending
REAL GDP
PR
ICE
LE
VE
L
SRASSRAS
AD AD AD AD

Advanced Placement Economics Macroeconomics: Student Activities © National Council on Economic Education, New York, N.Y. 135
3
Reconciling the Keynesian Aggregate Expenditure ModelWith the Aggregate Demand and Aggregate Supply ModelNow it is time to reconcile the Keynesian aggregate expenditure model with the aggregate demandand supply model. We find both differences and similarities when comparing the two models:
■ The Keynesian model is a fixed, or constant, price model while the AD and AS model is a variable-price model. The vertical axis of the Keynesian model is aggregate expenditure while the verticalaxis of the AD and AS model is price level.
■ Aggregate expenditure (C + I + G + Net Exports) on the Keynesian model is aggregate demand onthe AD and AS model. A shift upward in aggregate expenditure is the same as a shift outward inaggregate demand. A shift downward of aggregate expenditure is the same as a shift inward ofaggregate demand.
■ The AD and AS model can account for shifts in aggregate supply. The Keynesian model cannot doso.
■ In the Keynesian model, a shift in aggregate expenditures results in the full multiplier effect, andthe multiplier can easily be calculated from the graphs. In the AD and AS model, the multiplier isnot at full strength on the positively sloped and vertical AS curves.
■ In the AD and AS model, the increase in the price level diminishes the impact of the multiplier.
Macroeconomics LESSON 5 ■ ACTIVITY 26UNIT
Activity written by John Morton, National Council on Economic Education, New York, N.Y.

136 Advanced Placement Economics Macroeconomics: Student Activities © National Council on Economic Education, New York, N.Y.
3For each of the following situations, illustrate the indicated change on both the AD and AS modeland the Keynesian model.
1. The economy is at less than full employment. An increase in consumer confidence moves theeconomy to full employment.
2. The economy is at full employment but businesses begin to believe that a recession is ahead.
MacroeconomicsLESSON 5 ■ ACTIVITY 26 (continued)
UNIT
Figure 26.1An Increase in Consumer Confidence
REAL GDP
AE
45˚FE
SRAS
LRAS
AD
REAL GDP
Less Than Full EmploymentUsing the AD and AS Model
Less Than Full EmploymentUsing the Keynesian Model
AG
GR
EG
AT
EE
XP
EN
DIT
UR
ES
PR
ICE
LE
VE
L
Figure 26.2Businesses Believe a Recession Is Coming
REAL GDP
AD
AE
45˚FE
SRAS
LRAS
REAL GDP
Full EmploymentUsing the AD and AS Model
Full EmploymentUsing the Keynesian Model
AG
GR
EG
AT
EE
XP
EN
DIT
UR
ES
PR
ICE
LE
VE
L
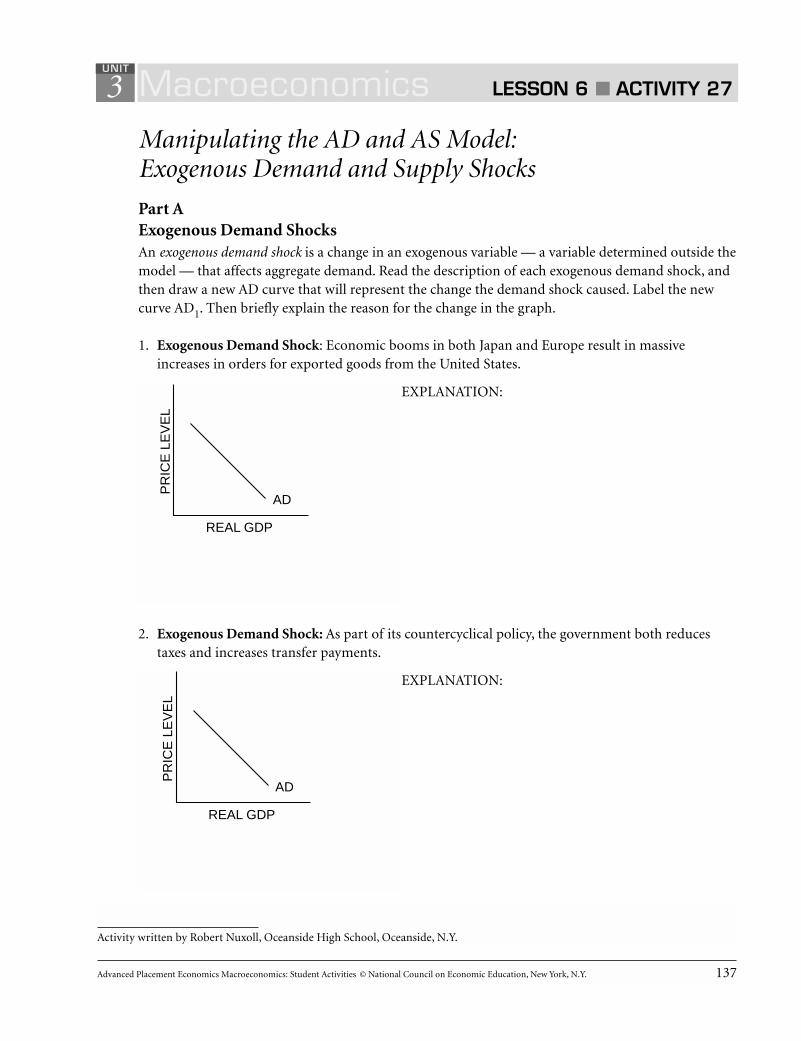
Advanced Placement Economics Macroeconomics: Student Activities © National Council on Economic Education, New York, N.Y. 137
3
Manipulating the AD and AS Model: Exogenous Demand and Supply Shocks
Part AExogenous Demand ShocksAn exogenous demand shock is a change in an exogenous variable — a variable determined outside themodel — that affects aggregate demand. Read the description of each exogenous demand shock, andthen draw a new AD curve that will represent the change the demand shock caused. Label the newcurve AD1. Then briefly explain the reason for the change in the graph.
1. Exogenous Demand Shock: Economic booms in both Japan and Europe result in massiveincreases in orders for exported goods from the United States.
EXPLANATION:
2. Exogenous Demand Shock: As part of its countercyclical policy, the government both reducestaxes and increases transfer payments.
EXPLANATION:
Macroeconomics LESSON 6 ■ ACTIVITY 27UNIT
Activity written by Robert Nuxoll, Oceanside High School, Oceanside, N.Y.
REAL GDP
PR
ICE
LE
VE
L
AD
REAL GDP
PR
ICE
LE
VE
L
AD

138 Advanced Placement Economics Macroeconomics: Student Activities © National Council on Economic Education, New York, N.Y.
33. Exogenous Demand Shock: While the United States was in the midst of the Great Depression, a
foreign power attacked, Congress declared war and more than 1,000,000 soldiers were drafted inthe first year while defense spending was increased several times over.
EXPLANATION:
4. Exogenous Demand Shock: To balance the budget, the federal government cuts Social Securitypayments by 10 percent and federal aid to education by 20 percent.
EXPLANATION:
Part BExogenous Supply Shocks The cause of an exogenous supply shock is the change in an exogenous variable — a variable determinedoutside the model — that affects aggregate supply. Read the description of each exogenous shock toshort-run aggregate supply, and then draw a new SRAS curve that will represent the change caused bythe shock. Label the new curve SRAS1.Then briefly explain the reason for the change in the graph.
MacroeconomicsLESSON 6 ■ ACTIVITY 27 (continued)
UNIT
REAL GDP
PR
ICE
LE
VE
L
AD
REAL GDP
PR
ICE
LE
VE
L
AD

Advanced Placement Economics Macroeconomics: Student Activities © National Council on Economic Education, New York, N.Y. 139
35. Exogenous Supply Shock: New environmental standards raise the average cost of autos and trucks
5 percent.
EXPLANATION:
6. Exogenous Supply Shock: Fine weather results in the highest corn and wheat yields in 40 years.
EXPLANATION:
7. Exogenous Supply Shock: Because of decreased international tension, the government sells offthousands of army-surplus Jeeps and trucks at prices that are far less than the market price fortheir commercial counterparts.
EXPLANATION:
MacroeconomicsLESSON 6 ■ ACTIVITY 27 (continued)
UNIT
REAL GDP
PR
ICE
LE
VE
L
SRAS
REAL GDP
PR
ICE
LE
VE
L
SRAS
REAL GDP
PR
ICE
LE
VE
L
SRAS
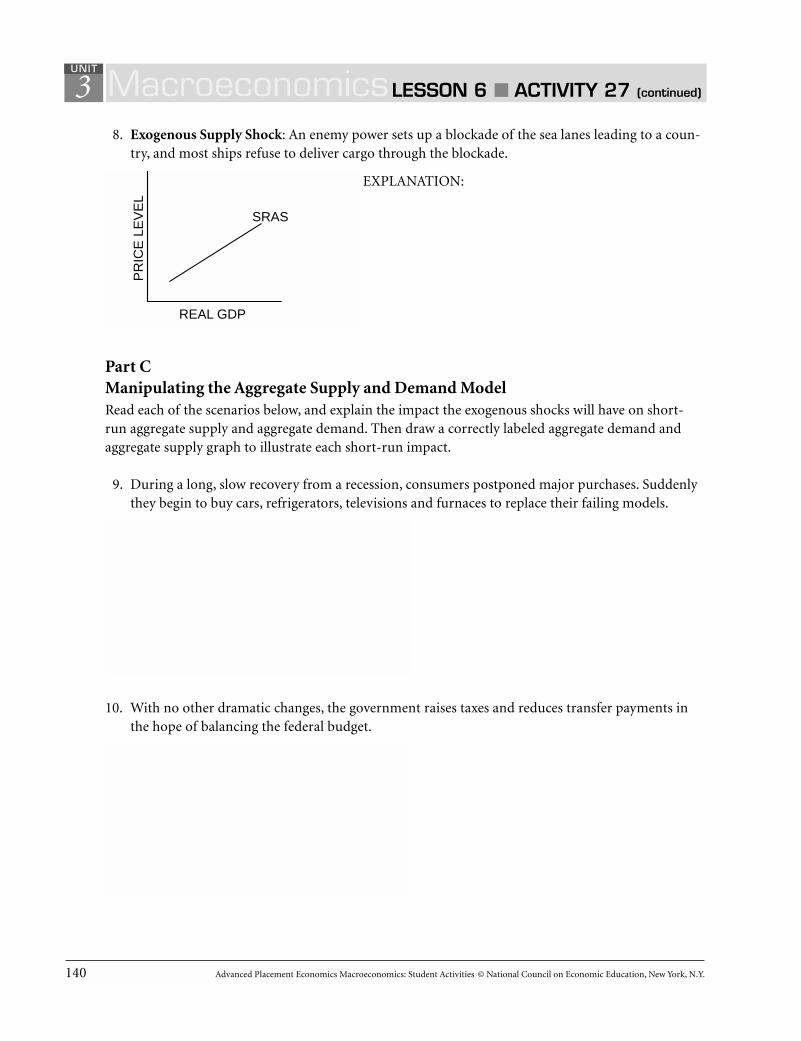
140 Advanced Placement Economics Macroeconomics: Student Activities © National Council on Economic Education, New York, N.Y.
38. Exogenous Supply Shock: An enemy power sets up a blockade of the sea lanes leading to a coun-
try, and most ships refuse to deliver cargo through the blockade.
EXPLANATION:
Part CManipulating the Aggregate Supply and Demand ModelRead each of the scenarios below, and explain the impact the exogenous shocks will have on short-run aggregate supply and aggregate demand. Then draw a correctly labeled aggregate demand andaggregate supply graph to illustrate each short-run impact.
9. During a long, slow recovery from a recession, consumers postponed major purchases. Suddenlythey begin to buy cars, refrigerators, televisions and furnaces to replace their failing models.
10. With no other dramatic changes, the government raises taxes and reduces transfer payments inthe hope of balancing the federal budget.
MacroeconomicsLESSON 6 ■ ACTIVITY 27 (continued)
UNIT
REAL GDP
PR
ICE
LE
VE
L
SRAS

Advanced Placement Economics Macroeconomics: Student Activities © National Council on Economic Education, New York, N.Y. 141
311. News of possible future layoffs frightens the public into reducing spending and increasing saving
for the feared “rainy day.”
12. Because of rising tensions in many developing countries, firms begin to build new factories inEconoland and to purchase sophisticated machinery from Econoland businesses that will enablethem to produce in Econoland at prices that are competitive.
13. Brazil solves its foreign debt and inflation problems. It then orders $10 billion worth of capitalmachinery from Econoland. Draw the AD and short-run AS graph for Econoland.
MacroeconomicsLESSON 6 ■ ACTIVITY 27 (continued)
UNIT


Advanced Placement Economics Macroeconomics: Student Activities © National Council on Economic Education, New York, N.Y. 143
3
The Macroeconomic Model: Short Run to Long RunIn this activity we are working from the short run to the long run. The aggregate demand curve isdownward sloping and the aggregate supply curve is upward sloping. The aggregate supply curve isupward sloping in the short run because of slow wage and price adjustments within the economy.
Part A1. In the following graph, suppose the aggregate demand shifts from AD to AD1. How will the econ-
omy react over time? Assume that no monetary or fiscal policy is undertaken.
(A) What will happen to output in the short run? Explain.
(B) What will happen to output as the economy moves to the long-run equilibrium? Explain.
(C) What will happen to the price level? Explain.
Macroeconomics LESSON 6 ■ ACTIVITY 28UNIT
Activity written by Rae Jean B. Goodman, U.S. Naval Academy, Annapolis, Md. Part B was written by Robert Nuxoll, Oceanside HighSchool, Oceanside, N.Y.
PR
ICE
LE
VE
L
Figure 28.1Increase in Aggregate Demand Starting at Full Employment
REAL GDP
LRAS
SRAS
AD1
AD
Y*

144 Advanced Placement Economics Macroeconomics: Student Activities © National Council on Economic Education, New York, N.Y.
3(D) What will happen to wages? Explain.
(E) In the graph, draw the shifts in AD and SRAS that you think will occur. Indicate the finalaggregate demand and short-run aggregate supply curves by labeling them as ADf and SRASf .
2. In the following graph, suppose the aggregate supply shifts from SRAS to SRAS1. How will theeconomy react over time? Assume that no monetary or fiscal policy is undertaken.
(A) What will happen to output in the short run? Explain.
MacroeconomicsLESSON 6 ■ ACTIVITY 28 (continued)
UNIT
PR
ICE
LE
VE
L
Figure 28.2Change in Short-Run Aggregate Supply
REAL GDP
SRAS1LRAS
SRAS
AD
Y*

Advanced Placement Economics Macroeconomics: Student Activities © National Council on Economic Education, New York, N.Y. 145
3(B) What will happen to output as the economy moves to the long-run equilibrium? Explain.
(C) What will happen to the price level? Explain.
(D) What will happen to wages? Explain.
(E) In the graph, draw the shifts in AD and SRAS that you think will occur. Indicate the finalaggregate demand and short-run aggregate supply curves by labeling them as ADf and SRASf.
Part BRead the description of each exogenous shock to aggregate supply and aggregate demand. Draw anew SRAS or AD curve that represents the change caused by the shock in the short run. Explain thereasons for the change in the graph, and then explain what happens in the long run if no stabilizationpolicy is implemented. Identify the final AD curve as ADf and the final SRAS curve as SRASf . If thereis a change in LRAS, show the change and label the new curve LRASf .
3. The government increases defense spending by 10 percent a year over a five-year period.
EXPLANATION:
MacroeconomicsLESSON 6 ■ ACTIVITY 28 (continued)
UNIT
REAL GDP
LRAS
PR
ICE
LE
VE
L SRAS
AD
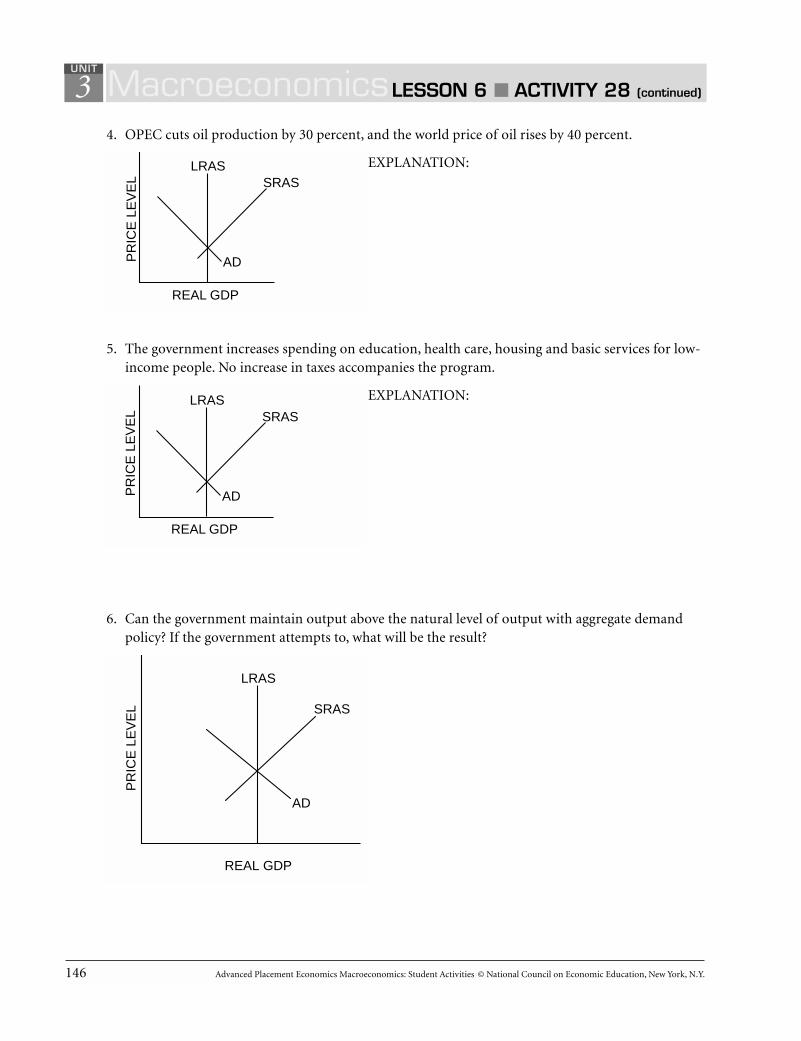
146 Advanced Placement Economics Macroeconomics: Student Activities © National Council on Economic Education, New York, N.Y.
34. OPEC cuts oil production by 30 percent, and the world price of oil rises by 40 percent.
EXPLANATION:
5. The government increases spending on education, health care, housing and basic services for low-income people. No increase in taxes accompanies the program.
EXPLANATION:
6. Can the government maintain output above the natural level of output with aggregate demandpolicy? If the government attempts to, what will be the result?
MacroeconomicsLESSON 6 ■ ACTIVITY 28 (continued)
UNIT
REAL GDP
LRAS
PR
ICE
LE
VE
L SRAS
AD
REAL GDP
LRAS
PR
ICE
LE
VE
L SRAS
AD
PR
ICE
LE
VE
L
REAL GDP
LRAS
SRAS
AD

Advanced Placement Economics Macroeconomics: Student Activities © National Council on Economic Education, New York, N.Y. 147
3
Long-Run Aggregate Supply (LRAS) and the Production Possibilities Curve (PPC)The long-run aggregate supply (LRAS) curve differs from the short-run aggregate supply (SRAS)curve. The LRAS curve is a vertical line at an output level that represents the quantity of goods andservices a nation can produce over a sustained period using all of its productive resources as efficient-ly as possible with all of the current technology available to it. Long-run aggregate supply is at fullemployment. LRAS doesn’t change as the price level changes. Developing more and better resourcesor improving technology will shift the LRAS curve outward, but it will still be vertical.
The LRAS curve represents a point on an economy’s production possibilities curve. Rememberthat the production possibilities curve (PPC) represents the maximum output of two goods that canbe produced given scarce resources. The economy could grow if the PPC shifts outward because ofmore resources or technological advances. For the same reason, the LRAS curve shifts outward ifmore resources are developed or if there are technological advances.
SRAS can actually be greater than LRAS. Resources can be used more intensively in the short run.For example, workers can work more hours and machines can operate for more hours. However, thisoutput level cannot be sustained in the long run. Eventually, the equilibrium level of output will fallunless LRAS is increased. As an analogy on a personal level, you may pull an all-nighter to prepare forseveral exams on the same day. You cannot, however, work 24 hours a day all the time.
Macroeconomics LESSON 7 ■ ACTIVITY 29UNIT
Activity written by James Stanley, Choate Rosemary Hall, Wallingford, Conn.
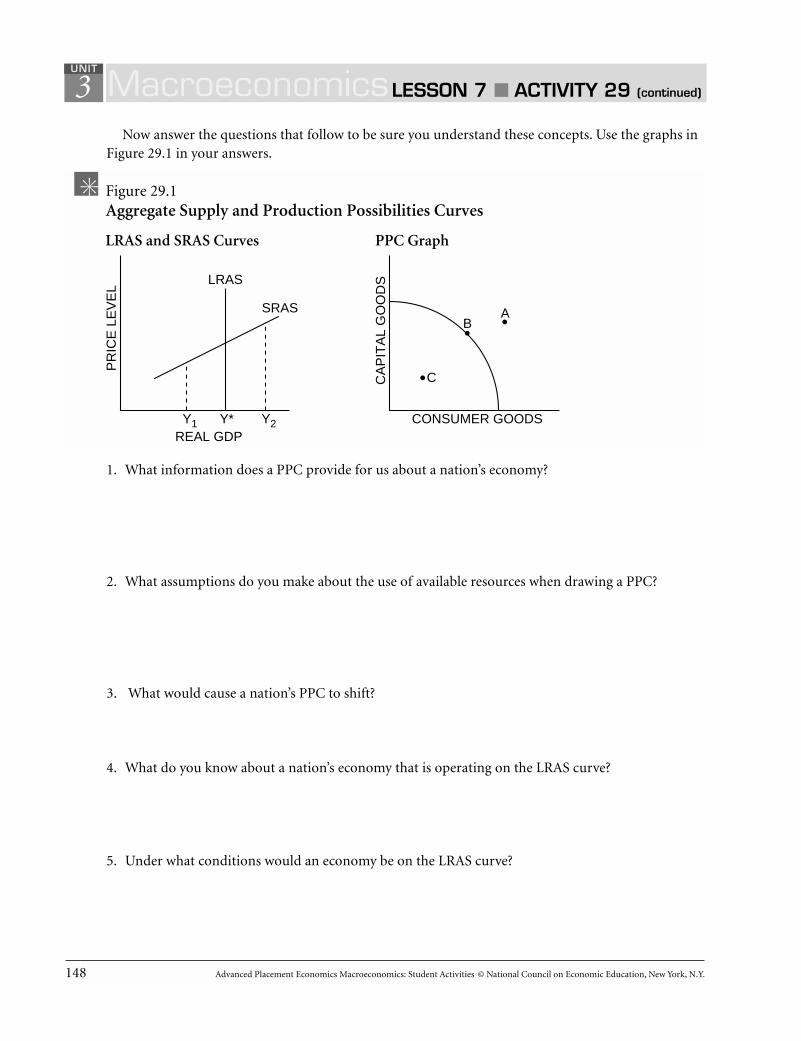
148 Advanced Placement Economics Macroeconomics: Student Activities © National Council on Economic Education, New York, N.Y.
3Now answer the questions that follow to be sure you understand these concepts. Use the graphs in
Figure 29.1 in your answers.
1. What information does a PPC provide for us about a nation’s economy?
2. What assumptions do you make about the use of available resources when drawing a PPC?
3. What would cause a nation’s PPC to shift?
4. What do you know about a nation’s economy that is operating on the LRAS curve?
5. Under what conditions would an economy be on the LRAS curve?
MacroeconomicsLESSON 7 ■ ACTIVITY 29 (continued)
UNIT
Figure 29.1Aggregate Supply and Production Possibilities Curves
REAL GDP
LRAS and SRAS Curves
C
SRAS
LRAS
BA
Y1 Y* Y2 CONSUMER GOODS
PPC Graph
CA
PIT
AL
GO
OD
S
PR
ICE
LE
VE
L

Advanced Placement Economics Macroeconomics: Student Activities © National Council on Economic Education, New York, N.Y. 149
36. If the price level rises, will LRAS shift? ______ Will the LRAS curve shift if AD changes? _______
7. If an economy finds that it faces a short-run equilibrium where real GDP is Y1, how would youdescribe the condition of the economy? Given this equilibrium level of output, at what pointwould the economy lie on the PPC? Explain your answer.
8. If an economy finds that it faces a short-run equilibrium where real GDP is Y, how would youdescribe the condition of the economy? Given this equilibrium level of output, at what pointwould the economy lie on the PPC? Explain your answer.
9. If an economy finds that it faces a short-run equilibrium where real GDP is Y2, how would youdescribe the condition of the economy? Given this equilibrium level of output, at what pointwould the economy lie on the PPC? Explain your answer.
10. If the economy were producing at Y2, what would happen in the long run? Why?
11. What could cause a nation’s LRAS to shift?
12. How would a rightward shift in LRAS be shown on the PPC?
MacroeconomicsLESSON 7 ■ ACTIVITY 29 (continued)
UNIT


Advanced Placement Economics Macroeconomics: Student Activities © National Council on Economic Education, New York, N.Y. 151
3
The Tools of Fiscal PolicyChanges in federal taxes and federal government spending designed to affect the level of aggregatedemand in the economy are called fiscal policy.
Aggregate demand is the total amount of spending on goods and services in the economy during astated period of time. Aggregate demand consists of consumer spending, government spending,investment spending and net exports.
Aggregate supply consists of the total amount of goods and services available in the economy dur-ing a stated period of time.
During a recession, aggregate demand is usually too low to bring about full employment ofresources. Government can increase aggregate demand by spending more, cutting taxes or doingboth. These actions often result in budget deficits because the government spends more than it col-lects in taxes. Increasing government spending without increasing taxes or decreasing taxes withoutdecreasing government expenditures should increase aggregate demand. Such an expansionary fiscalpolicy should increase employment, the price level or both.
If the level of aggregate demand is too high, creating inflationary pressure, government can reduceits spending, increase taxes or do both. These actions should result in a larger budget surplus or asmaller budget deficit than existed before. Such a contractionary fiscal policy should lower the level ofaggregate demand, and the economy will experience less employment, a lower price level or both.
Macroeconomics LESSON 8 ■ ACTIVITY 30UNIT
From Master Curriculum Guide in Economics: Teaching Strategies for High School Economics Courses (New York: National Council onEconomic Education, 1985), pp. 151-152

152 Advanced Placement Economics Macroeconomics: Student Activities © National Council on Economic Education, New York, N.Y.
3Part ADecide whether each of the following fiscal policies of the federal government is expansionary orcontractionary. Write expansionary or contractionary, and explain the reasons for your choice.
1. The government cuts business and personal income taxes and increases its own spending.
2. The government increases the personal income tax, Social Security tax and corporate income tax.Government spending stays the same.
3. Government spending goes up while taxes remain the same.
4. The government reduces the wages of its employees while raising taxes on consumers andbusinesses. Other government spending remains the same.
MacroeconomicsLESSON 8 ■ ACTIVITY 30 (continued)
UNIT

Advanced Placement Economics Macroeconomics: Student Activities © National Council on Economic Education, New York, N.Y. 153
3Part BEffects of Fiscal PolicyTest your understanding of fiscal policy by completing the table in Figure 30.1. Your choices for eachsituation must be consistent — that is, you should choose either an expansionary or contractionaryfiscal policy. (Fiscal policy cannot provide a solution to one of the situations.) Fill in the spaces asfollows:
Column A: Objective for Aggregate DemandDraw an up arrow if you wish to increase aggregate demand.Draw a down arrow if you wish to decrease aggregate demand.
Column B: Action on TaxesDraw an up arrow if you wish to increase taxes.Draw a down arrow if you wish to decrease taxes.
Column C: Action on Government SpendingDraw an up arrow if you wish to increase government spending.Draw a down arrow if you wish to decrease government spending.
Column D: Effect on Federal BudgetWrite toward deficit if your action will increase the deficit (or reduce the surplus).Write toward surplus if your action will reduce the deficit (or increase the surplus).
Column E: Effect on the National DebtDraw an up arrow if you think the national debt will increase.Draw a down arrow if you think the national debt will decrease.
Figure 30.1Effects of Fiscal Policy
(A) (D) (E)Objective (C) Effect Effect
for (B) Action on on on theAggregate Action Government Federal NationalDemand on Taxes Spending Budget Debt
1. National unemployment rate rises to 12 percent.
2. Inflation is strong at a rate of 14 percent per year.
3. Surveys show consumers are losing confidence in the economy, retail sales are weak and business inventories are increasing rapidly.
4. Business sales and investment are expanding rapidly, and economiststhink strong inflation lies ahead.
5. Inflation persists while unemploy-ment stays high.
MacroeconomicsLESSON 8 ■ ACTIVITY 30 (continued)
UNIT

Advanced Placement Economics Macroeconomics: Student Activities © National Council on Economic Education, New York, N.Y. 155
3
Discretionary and Automatic Fiscal PolicyOne of the goals of economic policy is to stabilize the economy. This means trying to keep employ-ment high and the price level stable. To accomplish this, the amount of aggregate demand in theeconomy must be near the full-employment level of output. If aggregate demand is too low, there willbe unemployment. If aggregate demand is too high, there will be inflation.
If aggregate demand is too low, government may be able to stimulate spending in the economy byincreasing its spending or by cutting taxes. These policies are examples of expansionary fiscal policy. Ifgovernment wants to slow down aggregate demand, it would pursue a contractionary fiscal policy. Todo this, it could cut government spending or raise taxes.
If government has to pass a law or take some other specific action to change its tax and/or spendingpolicies, then government is stabilizing the economy through discretionary policy. If the effect happensby itself as the economic situation changes, then it is known as an automatic stabilizer. An example ofan automatic stabilizer is unemployment compensation: If the economy goes into a recession and peo-ple are laid off, they may be eligible to receive unemployment compensation. This payment helps thembuy necessities and helps keep aggregate demand from falling as much as it might otherwise. The pay-ments help stabilize the economy but occur without any additional legislation.
Macroeconomics LESSON 8 ■ ACTIVITY 31UNIT
Activity written by David Nelson, Western Washington University, Bellingham, Wash.
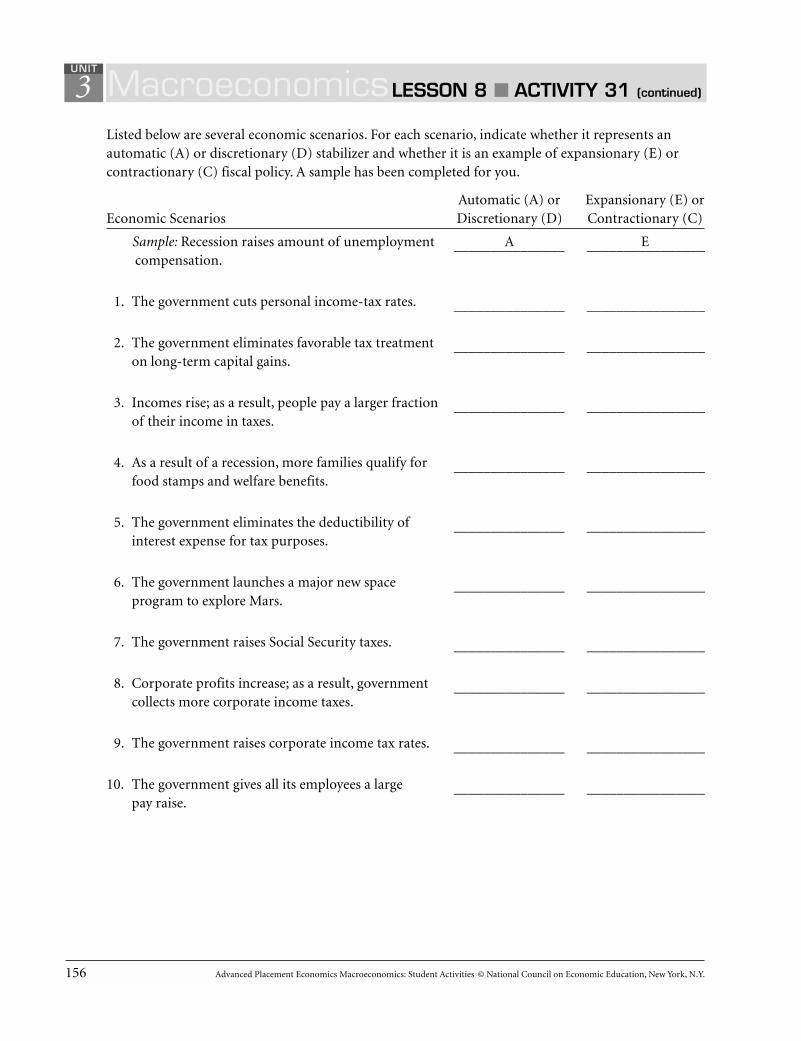
156 Advanced Placement Economics Macroeconomics: Student Activities © National Council on Economic Education, New York, N.Y.
3Listed below are several economic scenarios. For each scenario, indicate whether it represents anautomatic (A) or discretionary (D) stabilizer and whether it is an example of expansionary (E) orcontractionary (C) fiscal policy. A sample has been completed for you.
Automatic (A) or Expansionary (E) orEconomic Scenarios Discretionary (D) Contractionary (C)
Sample: Recession raises amount of unemployment A Ecompensation.
_______________ ________________
1. The government cuts personal income-tax rates. _______________ ________________
2. The government eliminates favorable tax treatment on long-term capital gains.
_______________ ________________
3. Incomes rise; as a result, people pay a larger fraction of their income in taxes.
_______________ ________________
4. As a result of a recession, more families qualify for food stamps and welfare benefits.
_______________ ________________
5. The government eliminates the deductibility ofinterest expense for tax purposes.
_______________ ________________
6. The government launches a major new space program to explore Mars.
_______________ ________________
7. The government raises Social Security taxes. _______________ ________________
8. Corporate profits increase; as a result, government collects more corporate income taxes.
_______________ ________________
9. The government raises corporate income tax rates. _______________ ________________
10. The government gives all its employees a large pay raise.
_______________ ________________
MacroeconomicsLESSON 8 ■ ACTIVITY 31 (continued)
UNIT
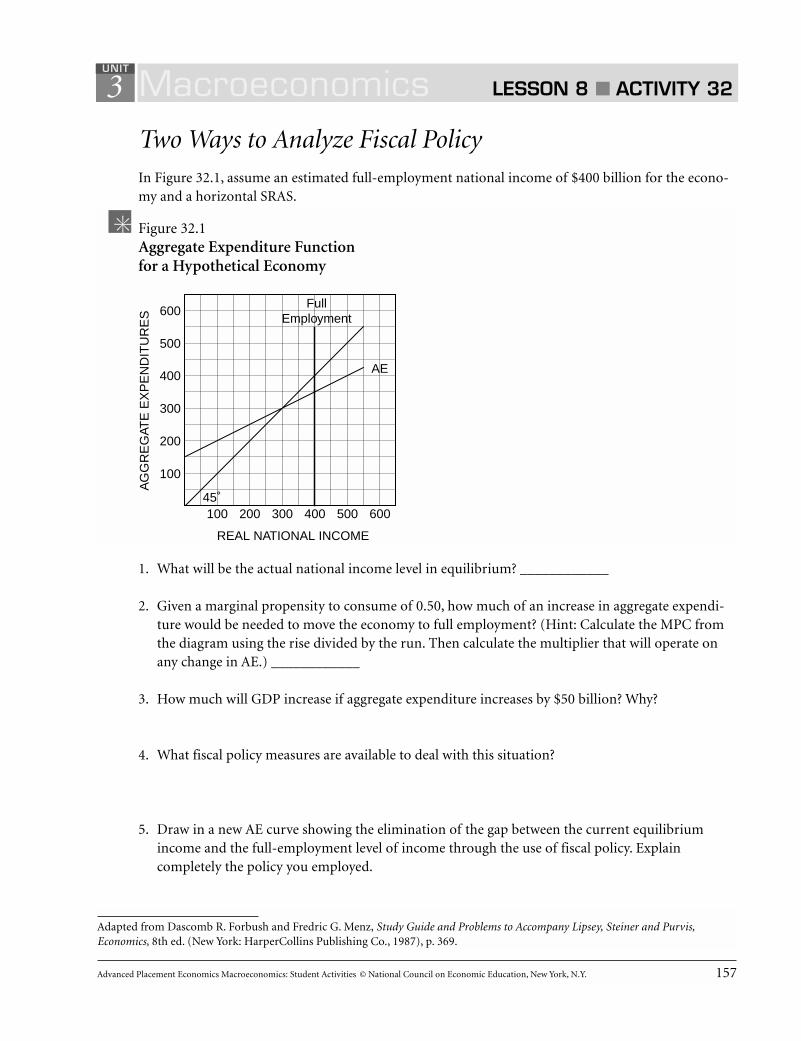
Advanced Placement Economics Macroeconomics: Student Activities © National Council on Economic Education, New York, N.Y. 157
3
Two Ways to Analyze Fiscal PolicyIn Figure 32.1, assume an estimated full-employment national income of $400 billion for the econo-my and a horizontal SRAS.
1. What will be the actual national income level in equilibrium? ____________
2. Given a marginal propensity to consume of 0.50, how much of an increase in aggregate expendi-ture would be needed to move the economy to full employment? (Hint: Calculate the MPC fromthe diagram using the rise divided by the run. Then calculate the multiplier that will operate onany change in AE.) ____________
3. How much will GDP increase if aggregate expenditure increases by $50 billion? Why?
4. What fiscal policy measures are available to deal with this situation?
5. Draw in a new AE curve showing the elimination of the gap between the current equilibriumincome and the full-employment level of income through the use of fiscal policy. Explaincompletely the policy you employed.
Macroeconomics LESSON 8 ■ ACTIVITY 32UNIT
Adapted from Dascomb R. Forbush and Fredric G. Menz, Study Guide and Problems to Accompany Lipsey, Steiner and Purvis,Economics, 8th ed. (New York: HarperCollins Publishing Co., 1987), p. 369.
100 200 300 400 500 600
100
200
300
400
500
600
AG
GR
EG
ATE
EX
PE
ND
ITU
RE
S
REAL NATIONAL INCOME
Figure 32.1Aggregate Expenditure Function for a Hypothetical Economy
FullEmployment
AE
45˚
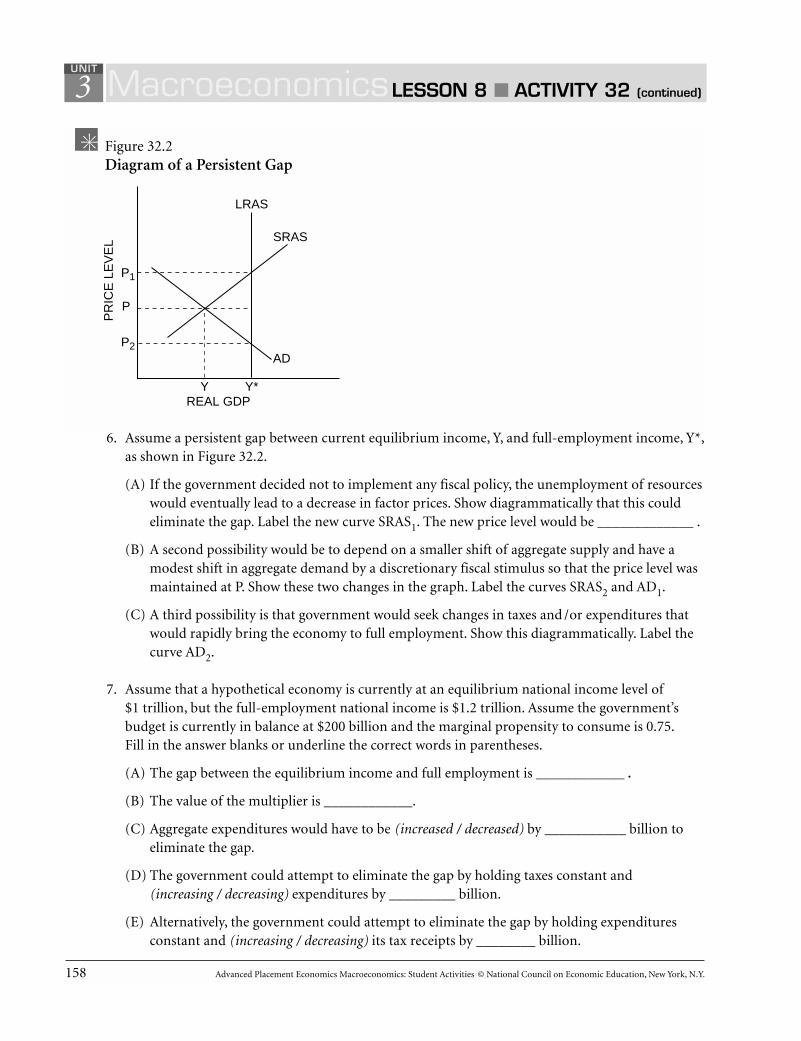
158 Advanced Placement Economics Macroeconomics: Student Activities © National Council on Economic Education, New York, N.Y.
3
6. Assume a persistent gap between current equilibrium income, Y, and full-employment income, Y*,as shown in Figure 32.2.
(A) If the government decided not to implement any fiscal policy, the unemployment of resourceswould eventually lead to a decrease in factor prices. Show diagrammatically that this couldeliminate the gap. Label the new curve SRAS1. The new price level would be _____________ .
(B) A second possibility would be to depend on a smaller shift of aggregate supply and have amodest shift in aggregate demand by a discretionary fiscal stimulus so that the price level wasmaintained at P. Show these two changes in the graph. Label the curves SRAS2 and AD1.
(C) A third possibility is that government would seek changes in taxes and / or expenditures thatwould rapidly bring the economy to full employment. Show this diagrammatically. Label thecurve AD2.
7. Assume that a hypothetical economy is currently at an equilibrium national income level of$1 trillion, but the full-employment national income is $1.2 trillion. Assume the government’sbudget is currently in balance at $200 billion and the marginal propensity to consume is 0.75.Fill in the answer blanks or underline the correct words in parentheses.
(A) The gap between the equilibrium income and full employment is ____________ .
(B) The value of the multiplier is ____________.
(C) Aggregate expenditures would have to be (increased / decreased) by ___________ billion toeliminate the gap.
(D) The government could attempt to eliminate the gap by holding taxes constant and (increasing / decreasing) expenditures by _________ billion.
(E) Alternatively, the government could attempt to eliminate the gap by holding expendituresconstant and (increasing / decreasing) its tax receipts by ________ billion.
MacroeconomicsLESSON 8 ■ ACTIVITY 32 (continued)
UNIT
P1
P
LRAS
YREAL GDP
PR
ICE
LE
VE
L
Y*
SRAS
ADP2
Figure 32.2Diagram of a Persistent Gap
Advanced Placement Economics Macroeconomics: Student Activities © National Council on Economic Education, New York, N.Y. 159
3
Analyzing the MacroeconomyAnswer the following questions. In some cases, you may also want to include a graph to show youranalysis.
1. True, false or uncertain, and explain why? “Regardless of our current economic situation, anincrease in aggregate demand will always create new jobs.”
2. True, false or uncertain, and explain why? “In the long run, when nominal wages increase, every-one has more money to spend; therefore, the economy as a whole benefits.”
3. True, false or uncertain, and explain why? “When unemployment rises, the price level falls. Whenunemployment falls, the price level rises. It is impossible to have a rising price level with risingunemployment.”
4. True, false or uncertain, and explain why? “Our economy is able to adjust to a long-run equilibri-um after a decrease in aggregate demand because prices and wages are sticky.”
5. True, false or uncertain, and explain why? “If we are in a recession, as long as we continue toincrease aggregate demand, we can achieve full employment without driving up the inflation rate.”
Macroeconomics LESSON 8 ■ ACTIVITY 33UNIT
Activity written by James Stanley, Choate Rosemary Hall, Wallingford, Conn., and John Morton, National Council on EconomicEducation, New York, N.Y.
160 Advanced Placement Economics Macroeconomics: Student Activities © National Council on Economic Education, New York, N.Y.
36. True, false or uncertain, and explain why? “When the economy experiences an increase in aggre-
gate demand, it will discover that its production possibilities curve has shifted outward.”
7. Use short-run AD and AS analysis to illustrate the results of the following events. Then explain whythese changes have taken place. Each answer should be accompanied by a clearly labeled diagram.
(A) There is a 25 percent decrease in the price of crude oil.
(B) Price levels in Germany, Japan and Great Britain rise considerably, while price levels in theUnited States remain unchanged.
(C) The federal government launches a major new highway-construction program.
MacroeconomicsLESSON 8 ■ ACTIVITY 33 (continued)
UNIT
Advanced Placement Economics Macroeconomics: Student Activities © National Council on Economic Education, New York, N.Y. 161
3(D) An insidious computer virus causes all IBM computers in the United States to crash.
(E) There is an increase in worker productivity.
8. Illustrate the following fiscal policy using both the AD and AS model and the Keynesian aggregateexpenditure model. In other words, draw two graphs for the fiscal policy change and give a briefexplanation of each graph. In your explanation, be sure to emphasize the line of reasoning thatgenerated your results; it is not enough to list the results of your analysis.
Fiscal Policy: At less than full employment, the federal government decreases taxes while holdinggovernment spending constant.
MacroeconomicsLESSON 8 ■ ACTIVITY 33 (continued)
UNIT


Advanced Placement Economics Macroeconomics: Student Activities © National Council on Economic Education, New York, N.Y. 163
Circle the letter of each correct answer.
1. Which of the following best describes aggregatesupply?
(A) The amount buyers plan to spend onoutput
(B) A schedule showing the relationshipbetween inputs and outputs
(C) A schedule showing the trade-off betweeninflation and unemployment
(D) A schedule indicating the level of real out-put that will be purchased at each possibleprice level
(E) A schedule indicating the level of real out-put that will be produced at each possibleprice level
2. A change in which of the following will causethe aggregate demand curve to shift?
(A) Energy prices
(B) Productivity rates
(C) Consumer wealth
(D) Prices of inputs
(E) Prices of consumer goods
3. The short-run aggregate supply curve will shiftto the right when
(A) energy prices increase.
(B) government regulation increases.
(C) prices of inputs decrease.
(D) investment spending decreases.
(E) productivity rates decrease.
4. A rightward shift in the aggregate demand curvewith a horizontal aggregate supply curve willcause employment and the price level to changein which of the following ways?
Employment Price Level(A) Increase Increase
(B) Increase Decrease
(C) Increase No change
(D) Decrease No change
(E) No change No change
5. An increase in the capital stock will cause the
(A) aggregate demand curve to shift leftward.
(B) production possibilities curve to shift in.
(C) Phillips curve to shift out.
(D) long-run aggregate supply curve to shiftrightward.
(E) consumption function to shift down.
6. Which of the following is a fiscal policy thatwould increase aggregate demand in the Keyne-sian model?
(A) A decrease in personal income taxes
(B) A decrease in government spending
(C) An increase in corporate income taxes
(D) A purchase of government bonds by theFederal Reserve
(E) A sale of government bonds by the FederalReserve
3 Macroeconomics SAMPLE QUESTIONS MULTIPLE-CHOICE
UNIT
Sample Multiple-Choice Questions
164 Advanced Placement Economics Macroeconomics: Student Activities © National Council on Economic Education, New York, N.Y.
7. An increase in labor productivity would most like-ly cause real gross domestic product and the pricelevel to change in which of the following ways?
Real GDP Price Level(A) Increase Increase
(B) Increase Decrease
(C) Increase No change
(D) Decrease Increase
(E) Decrease No change
8. If Maria Escalera’s disposable income increasesfrom $600 to $650 and her level of personal-consumption expenditures increase from $480to $520, you may conclude that her marginalpropensity to
(A) consume is 0.8.
(B) consume is 0.4.
(C) consume is 0.25.
(D) save is 0.8.
(E) save is 0.25.
9. In the Keynesian aggregate-expenditure model, ifthe MPC is 0.75 and gross investment increasesby $6 billion, equilibrium GDP will increase by
(A) $6 billion.
(B) $8 billion.
(C) $12 billion.
(D) $24 billion.
(E) $42 billion.
10. In the Keynesian aggregate-expenditure model,the simple spending multiplier can be calculat-ed by dividing
(A) the initial change in spending by the changein real gross domestic product (GDP).
(B) the change in real gross domestic productby the initial change in spending.
(C) one by one minus the marginal propensityto save.
(D) one by one plus the marginal propensity toconsume.
(E) the propensity to save by the propensity toconsume.
11. Which of the following will cause theconsumption schedule to shift upward?
(A) An increase in the amount of consumerindebtedness
(B) A reduction in the wealth or assets held byconsumers
(C) An expectation of future declines in theconsumer price index
(D) An expectation of future shortages ofessential consumer goods
(E) A growing belief that personal income willdecline in the future
12. The investment demand curve will shift to theright as the result of
(A) excess productive capacity.
(B) an increase in corporate business taxes.
(C) businesses becoming more optimistic withrespect to future business conditions.
(D) recessions in foreign nations that tradewith the United States, causing a lowerdemand for U.S. products.
(E) a decrease in the real interest rate.
3 Macroeconomics SAMPLE QUESTIONS MULTIPLE-CHOICE
UNIT
(continued)
Advanced Placement Economics Macroeconomics: Student Activities © National Council on Economic Education, New York, N.Y. 165
13. Automatic stabilizers in the economy includewhich of the following?
I. A progressive personal income tax
II. Unemployment compensation
III. Congressional action that increases taxrates
(A) I only
(B) II only
(C) III only
(D) I and II only
(E) I and III only
14. In order to be called an automatic, or built-in,stabilizer, which of the following must taxesautomatically do in a recessionary period andin an inflationary period?
Recessionary Period Inflationary Period(A) Decrease Decrease
(B) Decrease Increase
(C) Increase Decrease
(D) Increase Increase
(E) No change No change
15. The balanced-budget multiplier indicates that
(A) equal increases in government spendingand taxation will make a recession worse.
(B) equal increases in government spendingand taxation will increase total spending.
(C) government deficits might have a contrac-tionary impact on the economy.
(D) supply will necessarily create its owndemand.
(E) the level of gross domestic product isnever less than the level of disposableincome.
16. In which of the following ways will increases inshort-run aggregate supply change the pricelevel and unemployment?
Price Level Unemployment(A) Increase No change
(B) Decrease Decrease
(C) Decrease Increase
(D) Decrease No change
(E) No change Increase
17. Assume the aggregate supply curve is upwardsloping and the economy is in a recession. Ifthe government increases both taxes and gov-ernment spending by $25 billion, the pricelevel and real GDP will most likely change inwhich of the following ways?
Price Level Real GDP(A) Increase Increase
(B) Increase Decrease
(C) Increase No Change
(D) Decrease Decrease
(E) Decrease No Change
3 Macroeconomics SAMPLE QUESTIONS MULTIPLE-CHOICE
UNIT
(continued)

166 Advanced Placement Economics Macroeconomics: Student Activities © National Council on Economic Education, New York, N.Y.
Use the information in the graph above to answerquestions 18, 19 and 20. Assume a closed economywith no tax function.
18. Which of the following are true statementsabout total income?
I. Equilibrium total income is $800 billion.
II. Planned investment is $50 billion.
III. Equilibrium aggregate expenditure is $600billion.
(A) I only
(B) II only
(C) III only
(D) I and III only
(E) II and III only
19. In the graph, if full-employment GDP is $800billion, the minimum increase in autonomousexpenditures that would be required to movetotal income to full employment income is
(A) $200 billion.
(B) $100 billion.
(C) $50 billion.
(D) $25 billion.
(E) zero because total income is already at fullemployment.
20. In the graph, the values of the MPC, MPS andsimple-expenditure multiplier are
MPC MPS Multiplier(A) 0.5 0.5 2.0
(B) 0.6 0.4 2.5
(C) 0.75 0.25 4.0
(D) 0.8 0.2 5.0
(E) 0.9 0.1 10.0
3 Macroeconomics SAMPLE QUESTIONS MULTIPLE-CHOICE
UNIT
(continued)
$200
0
$300
$400
$500
$600
$800
200
400
600
$800
12575
150
TOTAL INCOME
AG
GR
EG
AT
E E
XP
EN
DIT
UR
E(in
bill
ions
)
C + I + GC + IC
45˚
Advanced Placement Economics Macroeconomics: Student Activities © National Council on Economic Education, New York, N.Y. 167
21. Which of the following fiscal policy actionswould be most effective in combating arecession?
GovernmentTaxes Spending
(A) $25 billion decrease $25 billion decrease
(B) $25 billion decrease $25 billion increase
(C) $25 billion decrease No change
(D) $25 billion increase $25 billion decrease
(E) $25 billion increase $25 billion increase
22. If the primary goal is to reduce inflation,which of the following fiscal policy actionswould be appropriate during a period of a rap-idly increasing consumer price index?
I. Reduce government expenditures fordefense and space research.
II. Increase transfer payments to those mostseverely affected by the rising price index.
III. Increase personal income tax rates.
(A) I only
(B) II only
(C) III only
(D) I and III only
(E) II and III only
23. As the average price level decreases, the pur-chasing power of people’s cash balancesincreases. This results in an increase in spend-ing. This effect is called
(A) the Laffer effect.
(B) the Keynesian effect.
(C) the money illusion effect.
(D) the real-balance effect.
(E) the neutrality of money.
24. A severe, sustained increase in oil prices wouldmost likely cause short-run and long-runaggregate supply curves and the productionpossibilities curve to change in which of thefollowing ways?
Short-Run Long-Run ProductionAggregate Aggregate Possibilities Supply Curve Supply Curve Curve
(A) Decrease No change Shift outward
(B) Decrease Decrease Shift outward
(C) Decrease Decrease Shift inward
(D) Increase No change No change
(E) Increase Increase Shift inward
25. A decrease in lump-sum personal income taxeswill most likely result in an increase in realGDP because which of the following occurs?
I. Government spending decreases to main-tain a balanced budget.
II. Consumption spending increases becausedisposable personal income increases.
III. Investment spending decreases becausedisposable personal income increases.
(A) I only
(B) II only
(C) III only
(D) I and III only
(E) I, II and III
3 Macroeconomics SAMPLE QUESTIONS MULTIPLE-CHOICE
UNIT
(continued)
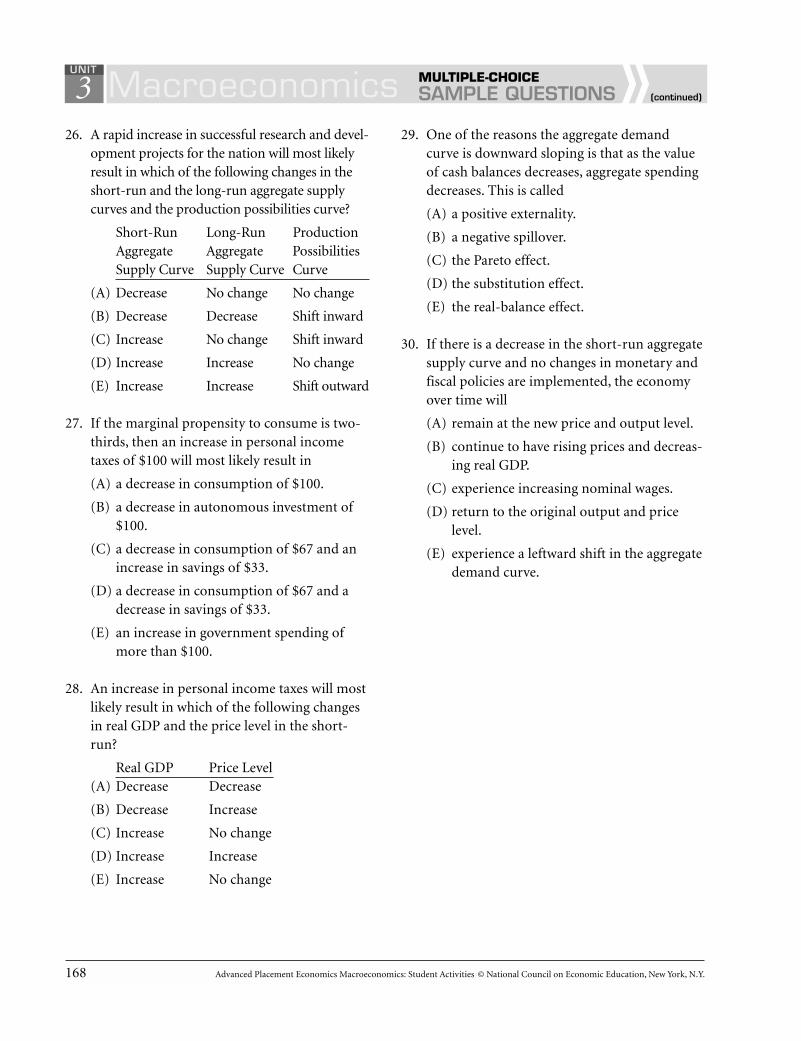
168 Advanced Placement Economics Macroeconomics: Student Activities © National Council on Economic Education, New York, N.Y.
26. A rapid increase in successful research and devel-opment projects for the nation will most likelyresult in which of the following changes in theshort-run and the long-run aggregate supplycurves and the production possibilities curve?
Short-Run Long-Run ProductionAggregate Aggregate Possibilities Supply Curve Supply Curve Curve
(A) Decrease No change No change
(B) Decrease Decrease Shift inward
(C) Increase No change Shift inward
(D) Increase Increase No change
(E) Increase Increase Shift outward
27. If the marginal propensity to consume is two-thirds, then an increase in personal incometaxes of $100 will most likely result in
(A) a decrease in consumption of $100.
(B) a decrease in autonomous investment of$100.
(C) a decrease in consumption of $67 and anincrease in savings of $33.
(D) a decrease in consumption of $67 and adecrease in savings of $33.
(E) an increase in government spending ofmore than $100.
28. An increase in personal income taxes will mostlikely result in which of the following changesin real GDP and the price level in the short-run?
Real GDP Price Level(A) Decrease Decrease
(B) Decrease Increase
(C) Increase No change
(D) Increase Increase
(E) Increase No change
29. One of the reasons the aggregate demandcurve is downward sloping is that as the valueof cash balances decreases, aggregate spendingdecreases. This is called
(A) a positive externality.
(B) a negative spillover.
(C) the Pareto effect.
(D) the substitution effect.
(E) the real-balance effect.
30. If there is a decrease in the short-run aggregatesupply curve and no changes in monetary andfiscal policies are implemented, the economyover time will
(A) remain at the new price and output level.
(B) continue to have rising prices and decreas-ing real GDP.
(C) experience increasing nominal wages.
(D) return to the original output and pricelevel.
(E) experience a leftward shift in the aggregatedemand curve.
3 Macroeconomics SAMPLE QUESTIONS MULTIPLE-CHOICE
UNIT
(continued)

Advanced Placement Economics Macroeconomics: Student Activities © National Council on Economic Education, New York, N.Y. 169
Sample Short Free-Response Questions1. In the 1960s many newspaper reporters were accustomed to reporting a decrease in the unemploy-
ment rate when the overall price level increased. However, in the 1970s, when increases in the overallprice level were accompanied by increases, not decreases, in the unemployment rate, some reporterswent so far as to declare macroeconomics “bankrupt” and unable to explain this “mystery.”
Using short-run aggregate demand and aggregate supply analysis, explain the “mystery” of why the increases in the overall price level during the 1960s might have been accompanied by decreasesin the unemployment rate and the increases in the overall price level during the 1970s might havebeen accompanied by increases in the unemployment rate.
3 Macroeconomics SAMPLE QUESTIONS SHORT FREE-RESPONSE
UNIT

170 Advanced Placement Economics Macroeconomics: Student Activities © National Council on Economic Education, New York, N.Y.
2. The U.S. stock market declined dramatically from 2000 to 2003.
(A) What did this decline mean?
(B) What were the possible effects of this decline on the U.S. economy’s output, prices andemployment?
3. Some economists claim that investment spending is more important than consumption spendingin causing changes in the business cycle. However, investment spending is only one-fourth of con-sumption spending. Explain why investment spending can be so important if it is so much lessthan consumption spending.
4. In 1981, factories used 79 percent of their capacity. In 1982, factories used 71 percent of theircapacity. In which year do you think the economy was on a steeper portion of its short-run aggre-gate supply curve? Explain.
3 Macroeconomics SAMPLE QUESTIONS SHORT FREE-RESPONSE
UNIT
(continued)
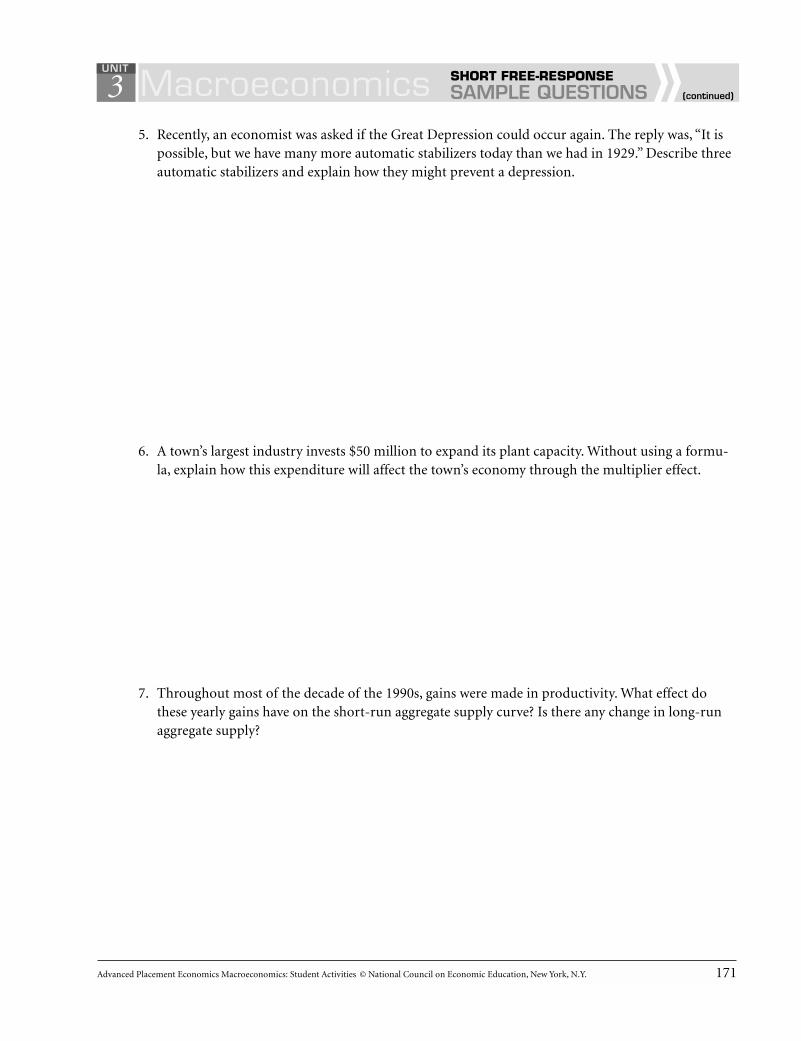
Advanced Placement Economics Macroeconomics: Student Activities © National Council on Economic Education, New York, N.Y. 171
5. Recently, an economist was asked if the Great Depression could occur again. The reply was, “It ispossible, but we have many more automatic stabilizers today than we had in 1929.” Describe threeautomatic stabilizers and explain how they might prevent a depression.
6. A town’s largest industry invests $50 million to expand its plant capacity. Without using a formu-la, explain how this expenditure will affect the town’s economy through the multiplier effect.
7. Throughout most of the decade of the 1990s, gains were made in productivity. What effect dothese yearly gains have on the short-run aggregate supply curve? Is there any change in long-runaggregate supply?
3 Macroeconomics SAMPLE QUESTIONS SHORT FREE-RESPONSE
UNIT
(continued)


Advanced Placement Economics Macroeconomics: Student Activities © National Council on Economic Education, New York, N.Y. 173
Sample Long Free-Response Questions1. Assume you are a member of Congress. A member of your staff has just given you the following
economic statistics:
Year Ago Last Estimate for Quarter Quarter Quarter Now Ending
Real gross domestic product(in billions of 1997 dollars) $2,789 $2,689 $2,598
Consumer price index 197 201 204
Unemployment rate 5% 8% 10.2%
Gross private investment(in billions of 1997 dollars) $312 $300 $287
(A) What economic problem is this nation facing?
(B) Identify the fiscal policy actions you would recommend.
(C) What are the goals of your fiscal policy actions?
(D) Explain how each policy action you identified in Question 1(B) will fit the goals you stated inQuestion 1(C).
3 Macroeconomics SAMPLE QUESTIONS LONG FREE-RESPONSE
UNIT
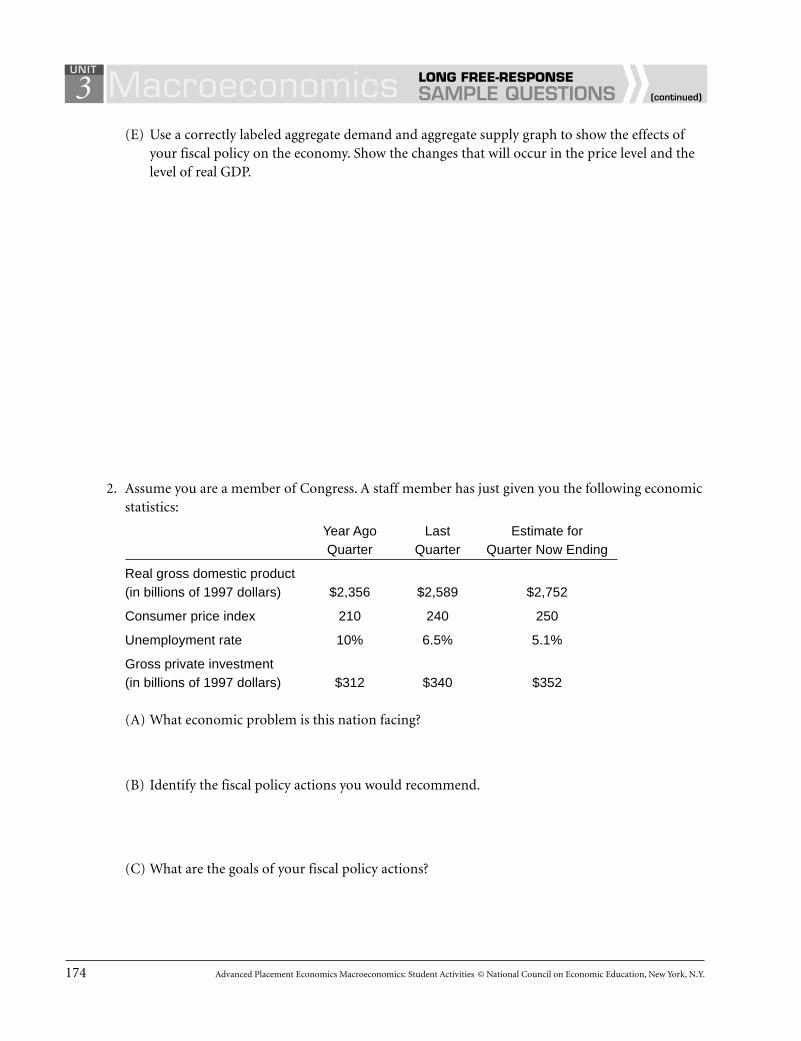
174 Advanced Placement Economics Macroeconomics: Student Activities © National Council on Economic Education, New York, N.Y.
(E) Use a correctly labeled aggregate demand and aggregate supply graph to show the effects ofyour fiscal policy on the economy. Show the changes that will occur in the price level and thelevel of real GDP.
2. Assume you are a member of Congress. A staff member has just given you the following economicstatistics:
Year Ago Last Estimate for Quarter Quarter Quarter Now Ending
Real gross domestic product(in billions of 1997 dollars) $2,356 $2,589 $2,752
Consumer price index 210 240 250
Unemployment rate 10% 6.5% 5.1%
Gross private investment (in billions of 1997 dollars) $312 $340 $352
(A) What economic problem is this nation facing?
(B) Identify the fiscal policy actions you would recommend.
(C) What are the goals of your fiscal policy actions?
3 Macroeconomics SAMPLE QUESTIONS LONG FREE-RESPONSE
UNIT
(continued)
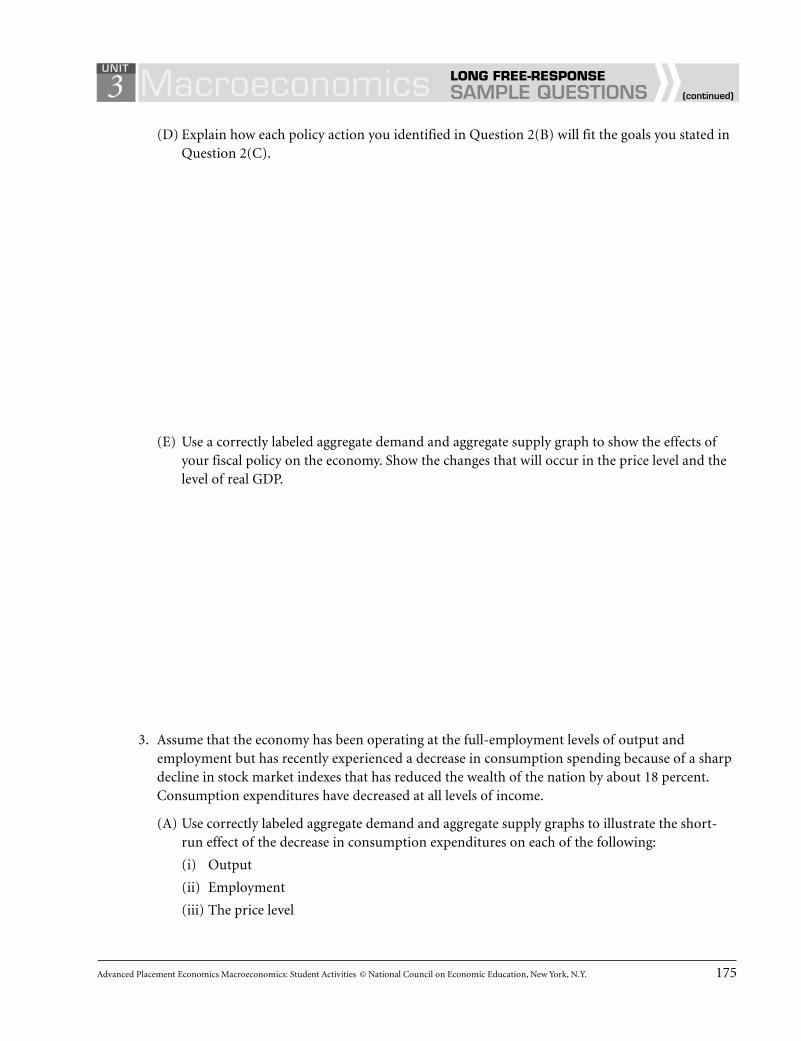
Advanced Placement Economics Macroeconomics: Student Activities © National Council on Economic Education, New York, N.Y. 175
(D) Explain how each policy action you identified in Question 2(B) will fit the goals you stated inQuestion 2(C).
(E) Use a correctly labeled aggregate demand and aggregate supply graph to show the effects ofyour fiscal policy on the economy. Show the changes that will occur in the price level and thelevel of real GDP.
3. Assume that the economy has been operating at the full-employment levels of output andemployment but has recently experienced a decrease in consumption spending because of a sharpdecline in stock market indexes that has reduced the wealth of the nation by about 18 percent.Consumption expenditures have decreased at all levels of income.
(A) Use correctly labeled aggregate demand and aggregate supply graphs to illustrate the short-run effect of the decrease in consumption expenditures on each of the following:
(i)ii Output
(ii)i Employment
(iii) The price level
3 Macroeconomics SAMPLE QUESTIONS LONG FREE-RESPONSE
UNIT
(continued)

176 Advanced Placement Economics Macroeconomics: Student Activities © National Council on Economic Education, New York, N.Y.
(B) Identify two fiscal policy actions that could be used to counter the effects of the initial decreasein consumption spending. Explain, using correctly labeled aggregate demand and aggregatesupply graphs, the short-run effects of each of your policies on each of the following:
(i)ii Output
(ii)i Employment
(iii) The price level
3 Macroeconomics SAMPLE QUESTIONS LONG FREE-RESPONSE
UNIT
(continued)

Advanced Placement Economics Macroeconomics: Student Activities © National Council on Economic Education, New York, N.Y. 177
4. Assume that political problems restrict the supply of oil in international markets. Consequently,increased production costs result in the following economic conditions in the United States:
■ The unemployment rate is 8 percent and rising.
■ The CPI is rising 9 percent annually and accelerating.
■ The annual rate of growth of real GDP is –1.5 percent.
(A) Identify and describe the major macroeconomic problems in the economy. Using correctlylabeled aggregate demand and aggregate supply graphs, show the condition of the economy.
(B) With a federal budget deficit of nearly $350 billion, fiscal authorities are considering the fol-lowing policy actions to address the existing economic problems:
Policy 1: Increase government expenditures.
Policy 2: Increase personal income taxes.
Policy 3: Decrease business taxes and regulations.
Describe the effect of each of the policies on the economy, and demonstrate each on an indi-vidual aggregate demand and aggregate supply graph. Be sure to include each of the followingin your description:
(i)ii Output
(ii)i Employment
(iii) The price level
3 Macroeconomics SAMPLE QUESTIONS LONG FREE-RESPONSE
UNIT
(continued)
178 Advanced Placement Economics Macroeconomics: Student Activities © National Council on Economic Education, New York, N.Y.
Policy 1:
Policy 2:
Policy 3:
3 Macroeconomics SAMPLE QUESTIONS LONG FREE-RESPONSE
UNIT
(continued)
Macroeconomics | Unit 4Macroeconomics | Unit 4Money, Monetary Policy
and Economic Stability


Advanced Placement Economics Macroeconomics: Student Activities © National Council on Economic Education, New York, N.Y. 181
■ Throughout history, there have been fourbasic types of money: commodity money,representative money, fiat money and check-book money.
■ Money has three main functions: a mediumof exchange, a standard of value (or unit ofaccount) and a store of value.
■ To accomplish its functions, the characteris-tics of money include portability, uniform-ity, acceptability, durability, divisibility andstability in value.
■ M1 is the narrowest definition of money andconsists of checkable deposits, traveler’schecks and currency. Checkable depositsinclude demand deposits and account forabout 75 percent of M1.
■ M2 and M3 are broader definitions ofmoney and include savings accounts andother time deposits.
■ The demand for money is the sum of trans-actions demand, precautionary demand andspeculative demand. The demand for moneyis determined by interest rates, income andthe price level.
■ MV = PQ is the equation of exchange:Money times velocity equals price timesquantity of goods. PQ is the nominal GDP.
■ Velocity is the number of times a year thatthe money supply is used to make paymentsfor final goods and services:
GDPV = ____
M
■ Money is created when banks make loans.One bank’s loan becomes another bank’sdemand deposit. Demand deposits aremoney. When a loan is repaid, money isdestroyed.
■ Banks are required to keep a percentage oftheir deposits as reserves. Reserves can becurrency in the bank vault or deposits at theFederal Reserve Banks. This reserve require-ment limits the amount of money banks cancreate.
■ The simple deposit expansion multiplier isequal to 1 divided by the required reserveratio (rr).
1Deposit expansion multiplier = _____
rr
■ The higher the reserve requirement, the lessmoney can be created; the lower the reserverequirement, the more money can be created.
■ The Federal Reserve regulates financial insti-tutions and controls the nation’s money sup-ply. The three main tools that the Fed uses tocontrol the money supply are buying andselling government bonds on the open mar-ket (open market operations), changing thediscount rate and changing the reserverequirement.
■ If the Fed wants to encourage bank lendingand increase the money supply, it will buybonds on the open market, decrease the dis-count rate or decrease the reserve require-ment. This is referred to as expansionarymonetary policy or an easy money policyand is used by the Fed to reduce unemploy-ment.
■ If the Fed wants to hold down or decreasethe money supply, it will discourage banklending by selling bonds on the open mar-ket, increasing the discount rate or increas-ing the reserve requirement. This is called acontractionary monetary policy or a tightmoney policy and is used by the Fed to dis-courage bank lending during periods ofinflation.
4 Macroeconomics KEY IDEASUNIT
182 Advanced Placement Economics Macroeconomics: Student Activities © National Council on Economic Education, New York, N.Y.
■ Open market operations are the most fre-quently used tool because they permit the Fedto make small changes in the money supplyand can be implemented immediately.
■ Changes in the reserve requirement can havesubstantial economic effects, and thus theFed rarely changes the reserve requirement.The Fed uses changes in the discount rateprimarily as a signal of a change in the direc-tion of monetary policy.
■ The Fed cannot target both the money sup-ply and interest rates simultaneously, so itmust choose which variable to target.
■ The Fed currently targets the federal fundsrate rather than the money supply to imple-ment monetary policy. It targets the federalfunds rate because the Fed believes that thisrate is closely tied to economic activity.
■ The federal funds rate is the interest rate abank charges when it lends excess reserves toother banks.
4 Macroeconomics KEY IDEASUNIT

Advanced Placement Economics Macroeconomics: Student Activities © National Council on Economic Education, New York, N.Y. 183
4
MoneyThroughout history, a wide variety of items have served as money. These include gold, silver, largestone wheels, tobacco, beer, dog teeth, porpoise teeth, cattle, metal coins, paper bills and checks. All ofthese types of money should be judged on how well they accomplish the functions of money. Moneyis what money does!
The functions of money are to serve as a medium of exchange, a standard of value and a store ofvalue.
To be a good medium of exchange, money must be accepted by people when they buy and sell goodsand services. It should be portable or easily carried from place to place. It must also be divisible so thatlarge and small transactions can be made. It must also be uniform so that a particular unit such as aquarter represents the same value as every other quarter.
To be a good standard of value, or unit of account, money must be useful for quoting prices. Toaccomplish this, money must be familiar, divisible and accepted.
To be a good store of value, money must be durable so it can be kept for future use. It also shouldhave a stable value so people do not lose purchasing power if they use the money at a later time.
Money is any item or commodity that is generally accepted in payment for goods and services orin repayment of debts, and serves as an asset to its holder.
Macroeconomics LESSON 1 ■ ACTIVITY 34UNIT
Activity written by John Morton, National Council on Economic Education, New York, N.Y., and revised by Charles A. Bennett,Gannon University, Erie, Pa.
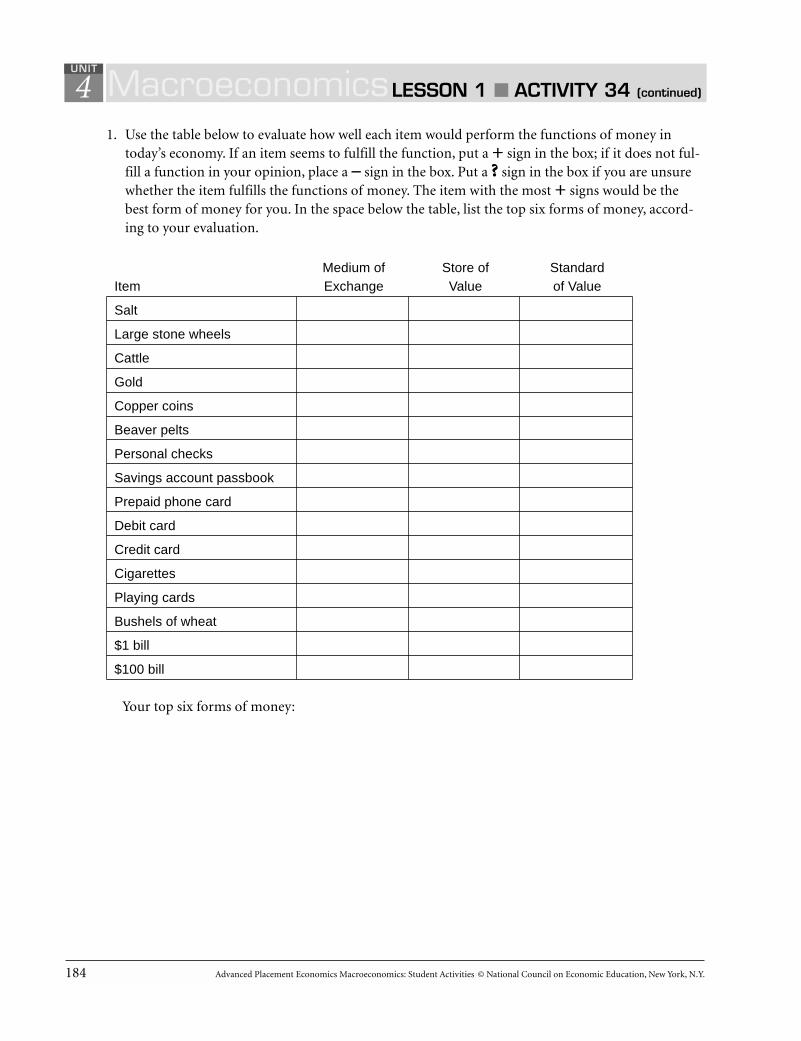
184 Advanced Placement Economics Macroeconomics: Student Activities © National Council on Economic Education, New York, N.Y.
41. Use the table below to evaluate how well each item would perform the functions of money in
today’s economy. If an item seems to fulfill the function, put a + sign in the box; if it does not ful-fill a function in your opinion, place a – sign in the box. Put a ? sign in the box if you are unsurewhether the item fulfills the functions of money. The item with the most + signs would be thebest form of money for you. In the space below the table, list the top six forms of money, accord-ing to your evaluation.
Medium of Store of StandardItem Exchange Value of Value
Salt
Large stone wheels
Cattle
Gold
Copper coins
Beaver pelts
Personal checks
Savings account passbook
Prepaid phone card
Debit card
Credit card
Cigarettes
Playing cards
Bushels of wheat
$1 bill
$100 bill
Your top six forms of money:
MacroeconomicsLESSON 1 ■ ACTIVITY 34 (continued)
UNIT

Advanced Placement Economics Macroeconomics: Student Activities © National Council on Economic Education, New York, N.Y. 185
42. After you finish the evaluation in Question 1, rate the various items in the table below. Evaluate
how well they meet the characteristics of money. Again, if an item seems to fit a characteristic, usea + sign; if the item does not seem to fit a characteristic, use a – sign. If there is a difference ofopinion or if you are uncertain, use a ? sign. The item with the most + signs would best fit thecharacteristics of money. In the space below the table, list your six top items.
StabilityItem Portability Uniformity Acceptability Durability in Value
Salt
Large stone wheels
Cattle
Gold
Copper coins
Beaver pelts
Personal checks
Savings account passbook
Prepaid phone card
Debit card
Credit card
Cigarettes
Playing cards
Bushels of wheat
$1 bill
$100 bill
Your top six items:
3. Why might factors such as ease of storage, difficulty in counterfeiting and security of electronictransfer of funds also be characteristics that you might use in evaluating money?
MacroeconomicsLESSON 1 ■ ACTIVITY 34 (continued)
UNIT


Advanced Placement Economics Macroeconomics: Student Activities © National Council on Economic Education, New York, N.Y. 187
4
What’s All This About the Ms?While monetary policy is the subject of debates that capture the public’s attention, the first steps inthe formulation of policy may appear relatively mundane. We must first define and measure themoney supply. Defining and measuring money has become an increasingly difficult task because ofreforms in the financial system, and because people and banks hold money in myriad different forms.
Money Defined . . .There is general agreement on a simple conceptual definition of money. However, the complexity ofthe real world and our rapidly evolving financial system prevent agreement on a single measure ofmoney, and this can cause confusion.
The Federal Reserve defines monetary aggregates by grouping assets that the public uses in roughlysimilar ways. In defining these measures of money, the Fed draws somewhat arbitrary lines betweengroups of assets that serve in varying degrees as both the medium-of-exchange and store-of-valuefunctions of money.
Depository institutions such as banks, savings and loan associations and credit unions report tothe Fed the value of their time and savings deposits, vault cash and transaction accounts such ascheckable deposits.
The data on checkable deposits are the primary source for the calculation of required reserves andthe construction of the monetary aggregates. The Fed’s Board of Governors and the Federal OpenMarket Committee use this information in the formulation of monetary policy.
. . . and MeasuredM1 is the narrowest definition and measure of the money supply. It includes assets used primarily for
transactions or as a medium of exchange. M1 includes currency and coin held by the nonbankpublic, demand deposits, other checkable deposits and traveler’s checks.
M2 is a broader measure of money stock. In addition to the items included in M1, M2 includes theamount held in savings and small time deposits, money market deposit accounts (MMDAs), noninsti-tutional money market mutual funds (MMMFs) and certain other short-term money market assets.
M3 is an even broader definition of the money supply. It includes all of the components of M2 plus anumber of financial assets and instruments generally employed by large businesses and financialinstitutions.
We can look at the three definitions of money in the following terms:
■ M1 includes items that are primarily used as a medium of exchange.
■ M2 includes items that are used as a store of value.
■ M3 includes items that serve as a unit of account.
Macroeconomics LESSON 1 ■ ACTIVITY 35UNIT
Activity from Econ Ed (New York: The Federal Reserve Bank of New York, September 1987) and revised by Robert Wedge,Massachusetts Council on Economic Education, Waltham, Mass.
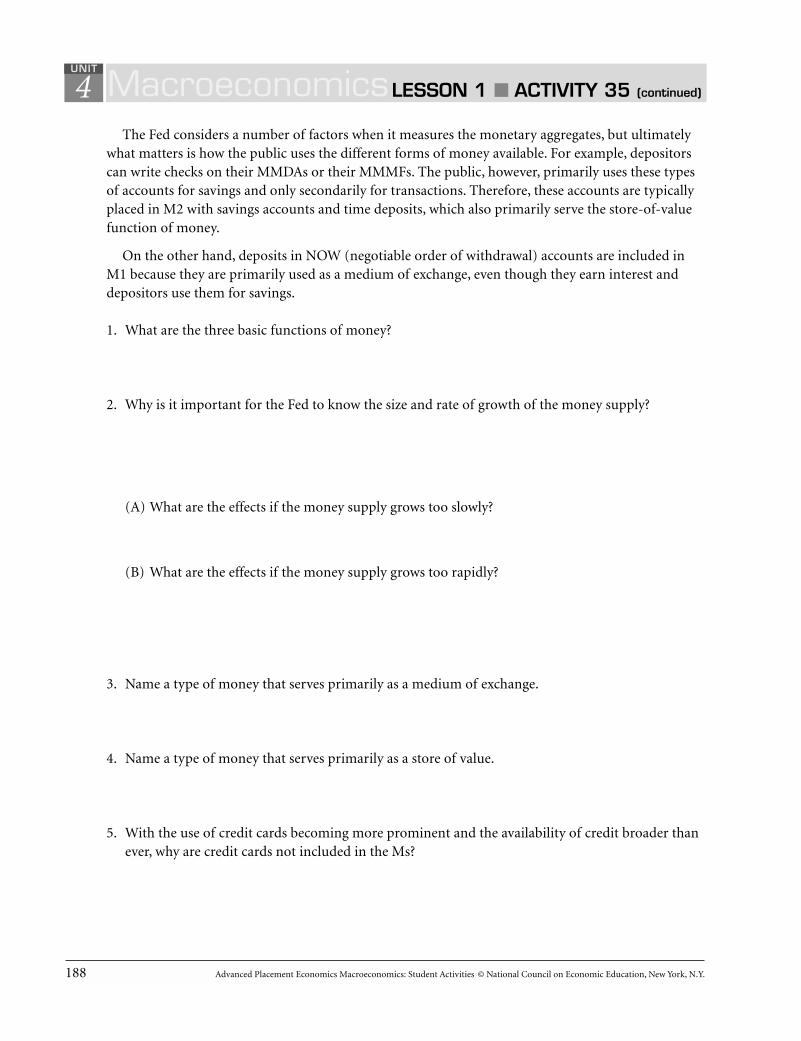
188 Advanced Placement Economics Macroeconomics: Student Activities © National Council on Economic Education, New York, N.Y.
4The Fed considers a number of factors when it measures the monetary aggregates, but ultimately
what matters is how the public uses the different forms of money available. For example, depositorscan write checks on their MMDAs or their MMMFs. The public, however, primarily uses these typesof accounts for savings and only secondarily for transactions. Therefore, these accounts are typicallyplaced in M2 with savings accounts and time deposits, which also primarily serve the store-of-valuefunction of money.
On the other hand, deposits in NOW (negotiable order of withdrawal) accounts are included inM1 because they are primarily used as a medium of exchange, even though they earn interest anddepositors use them for savings.
1. What are the three basic functions of money?
2. Why is it important for the Fed to know the size and rate of growth of the money supply?
(A) What are the effects if the money supply grows too slowly?
(B) What are the effects if the money supply grows too rapidly?
3. Name a type of money that serves primarily as a medium of exchange.
4. Name a type of money that serves primarily as a store of value.
5. With the use of credit cards becoming more prominent and the availability of credit broader thanever, why are credit cards not included in the Ms?
MacroeconomicsLESSON 1 ■ ACTIVITY 35 (continued)
UNIT

Advanced Placement Economics Macroeconomics: Student Activities © National Council on Economic Education, New York, N.Y. 189
46. Why is it difficult for the Fed to get an accurate measure of the money supply?
7. Why must the Fed continue to develop new ways to track the money supply?
8. Use the data in Figure 35.1 to calculate M1, M2 and M3. Assume that all items not mentioned arezero. Show all components for your answers.
Figure 35.1Calculating the Ms
Checkable deposits $850(demand deposits, NOW, ATM andcredit union share draft accounts)
Currency $200
Large time deposits $800
Noncheckable savings deposits $302
Small time deposits $1,745
Institutional money market mutual funds $1,210
M1 = __________________________
M2 = __________________________
M3 = __________________________
MacroeconomicsLESSON 1 ■ ACTIVITY 35 (continued)
UNIT

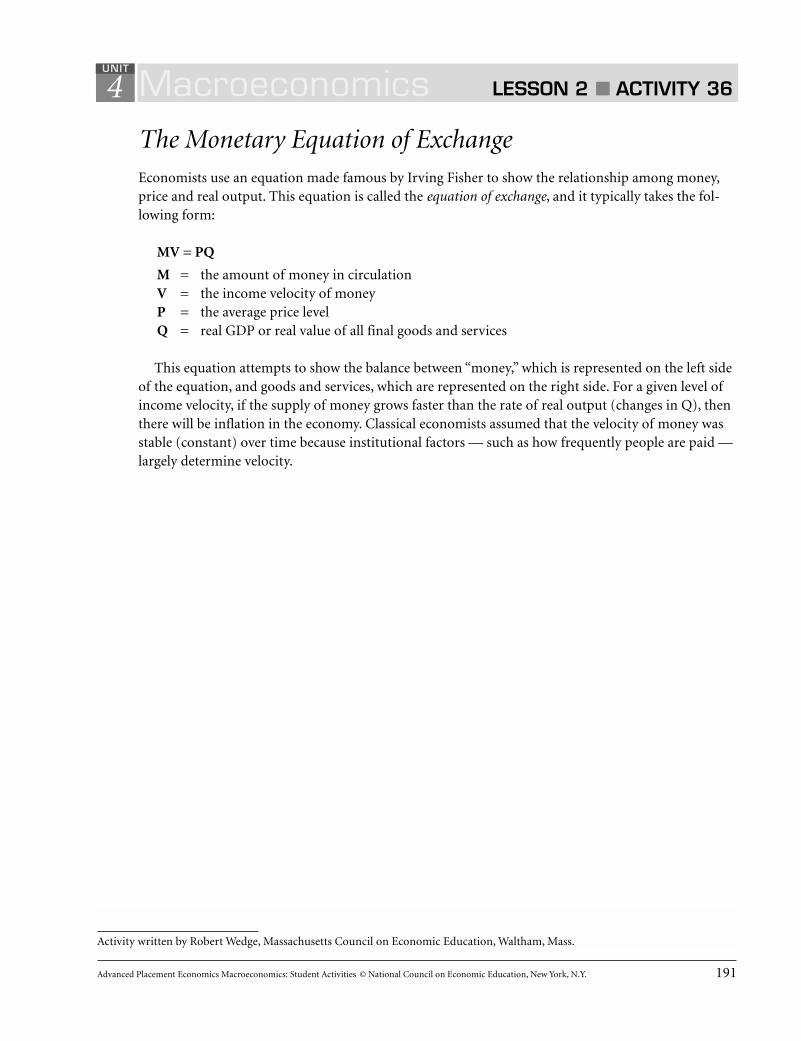
Advanced Placement Economics Macroeconomics: Student Activities © National Council on Economic Education, New York, N.Y. 191
4
The Monetary Equation of ExchangeEconomists use an equation made famous by Irving Fisher to show the relationship among money,price and real output. This equation is called the equation of exchange, and it typically takes the fol-lowing form:
MV = PQ
M = the amount of money in circulationV = the income velocity of moneyP = the average price levelQ = real GDP or real value of all final goods and services
This equation attempts to show the balance between “money,” which is represented on the left sideof the equation, and goods and services, which are represented on the right side. For a given level ofincome velocity, if the supply of money grows faster than the rate of real output (changes in Q), thenthere will be inflation in the economy. Classical economists assumed that the velocity of money wasstable (constant) over time because institutional factors — such as how frequently people are paid —largely determine velocity.
Macroeconomics LESSON 2 ■ ACTIVITY 36UNIT
Activity written by Robert Wedge, Massachusetts Council on Economic Education, Waltham, Mass.

192 Advanced Placement Economics Macroeconomics: Student Activities © National Council on Economic Education, New York, N.Y.
4Part A1. Define (in your own words and in one or two sentences each) the four variables in the equation of
exchange.
2. The product of velocity (V) and the money supply (M) equals PQ. How can PQ be defined?
3. Suppose velocity remains constant, while the money supply increases. Explain how this wouldaffect nominal GDP.
4. During the past 30 years, the use of credit cards has increased, and banks and financial institutionsincreasingly use computers for transactions. Explain how these changes might affect velocity.
5. As the result of legislative and regulatory reform throughout the 1980s and 1990s, banks and otherfinancial institutions began paying interest on a significant proportion of the checkable depositsin the M1 definition of the money supply. Explain how these changes might be expected to affectthe velocity of M1.
Part BThe following tables give data on money supply, prices, real GDP and velocity for the U.S. economyfor 14 recent years. Because of rounding, some totals may not come out exactly.
MacroeconomicsLESSON 2 ■ ACTIVITY 36 (continued)
UNIT
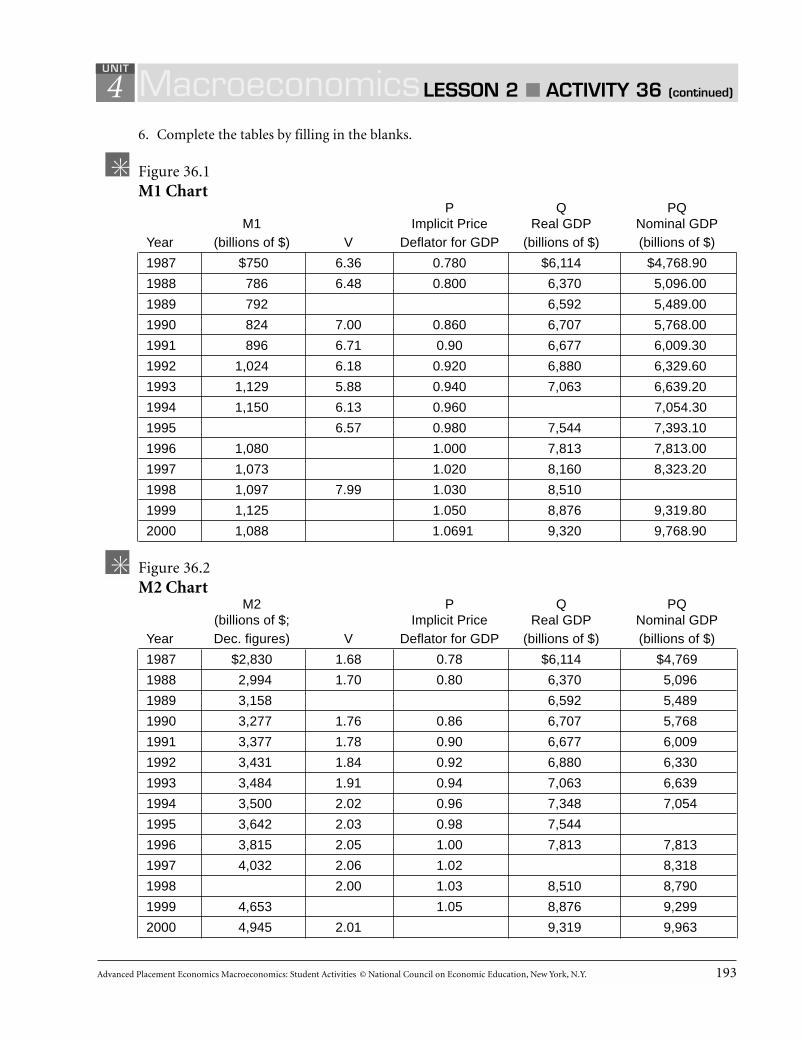
Advanced Placement Economics Macroeconomics: Student Activities © National Council on Economic Education, New York, N.Y. 193
46. Complete the tables by filling in the blanks.
Figure 36.1M1 Chart
P Q PQM1 Implicit Price Real GDP Nominal GDP
Year (billions of $) V Deflator for GDP (billions of $) (billions of $)
1987 $750 6.36 0.780 $6,114 $4,768.90
1988 786 6.48 0.800 6,370 5,096.00
1989 792 6,592 5,489.00
1990 824 7.00 0.860 6,707 5,768.00
1991 896 6.71 0.90 6,677 6,009.30
1992 1,024 6.18 0.920 6,880 6,329.60
1993 1,129 5.88 0.940 7,063 6,639.20
1994 1,150 6.13 0.960 7,054.30
1995 6.57 0.980 7,544 7,393.10
1996 1,080 1.000 7,813 7,813.00
1997 1,073 1.020 8,160 8,323.20
1998 1,097 7.99 1.030 8,510
1999 1,125 1.050 8,876 9,319.80
2000 1,088 1.0691 9,320 9,768.90
Figure 36.2M2 Chart
M2 P Q PQ(billions of $; Implicit Price Real GDP Nominal GDP
Year Dec. figures) V Deflator for GDP (billions of $) (billions of $)
1987 $2,830 1.68 0.78 $6,114 $4,769
1988 2,994 1.70 0.80 6,370 5,096
1989 3,158 6,592 5,489
1990 3,277 1.76 0.86 6,707 5,768
1991 3,377 1.78 0.90 6,677 6,009
1992 3,431 1.84 0.92 6,880 6,330
1993 3,484 1.91 0.94 7,063 6,639
1994 3,500 2.02 0.96 7,348 7,054
1995 3,642 2.03 0.98 7,544
1996 3,815 2.05 1.00 7,813 7,813
1997 4,032 2.06 1.02 8,318
1998 2.00 1.03 8,510 8,790
1999 4,653 1.05 8,876 9,299
2000 4,945 2.01 9,319 9,963
MacroeconomicsLESSON 2 ■ ACTIVITY 36 (continued)
UNIT

194 Advanced Placement Economics Macroeconomics: Student Activities © National Council on Economic Education, New York, N.Y.
47. What might one infer from the changes of the 1980s and 1990s about the classical assumption that
institutional factors determine velocity?
8. Use the grid below and the M1 and M2 data to graph the income velocity from 1987 to 2000.
(A) What trends do you see?
(B) What is the difference in the value of M1 velocity and M2 velocity? Explain why they are dif-ferent.
9. For a given money supply growth, a(n) (increase / decrease) in velocity will (increase / decrease)inflationary pressure. (Underline the correct word(s) in parentheses.)
MacroeconomicsLESSON 2 ■ ACTIVITY 36 (continued)
UNIT
VE
LOC
ITY
1987
1988
1989
1990
1991
1992
1993
1994
1995
1996
1997
1998
1999
2000
2001
0.5
1.0
1.5
2.0
2.5
3.0
3.5
4.0
4.5
5.0
5.5
6.0
6.5
7.0
7.5
8.0
8.5
9.0
9.5
10.0

Advanced Placement Economics Macroeconomics: Student Activities © National Council on Economic Education, New York, N.Y. 195
4
The Multiple Expansion of Checkable DepositsThis activity is designed to illustrate how banks’ lending of excess reserves can expand the nation’smoney supply and to explain how the Federal Reserve System can limit the growth of the moneysupply using the required reserve ratio.
Part AAssume that
■ the required reserve ratio is 10 percent of checkable deposits and banks lend out the other 90percent of their deposits (banks wish to hold no excess reserves) and
■ all money lent out by one bank is redeposited in another bank.
1. Under these assumptions, if a new checkable deposit of $1,000 is made in Bank 1,
(A) how much will Bank 1 keep as required reserves? $________________
(B) how much will Bank 1 lend out? $________________
(C) how much will be redeposited in Bank 2? $________________
(D) how much will Bank 2 keep as required reserves? $________________
(E) how much will Bank 2 lend out? $________________
(F) how much will be redeposited in Bank 3? $________________
2. Use your answers to Question 1 to help you complete the table in Figure 37.1. Fill in the blanks inthe table, rounding numbers to the second decimal (for example, $59.049 = $59.05). After youhave completed the table, answer the questions that follow by filling in the blanks or underliningthe correct answer in parentheses so each statement is true.
Figure 37.1Checkable Deposits, Reserves and Loans in Seven Banks
Bank No. New Checkable Deposits 10% Fractional Reserves Loans
1 $1,000.00 $100.00 $900.00
2 900.00 810.00
3 81.00
4 656.10
5
6 59.05
7 531.44 478.30
All other banks combined
Total for all banks $10,000.00 $9,000.00
Macroeconomics LESSON 3 ■ ACTIVITY 37UNIT
Adapted from Phillip Saunders, Introduction to Macroeconomics: Student Workbook, 18th ed. (Bloomington, Ind., 1998). CopyrightPhillip Saunders. All rights reserved. Contributions made by Robert Wedge, Massachusetts Council on Economic Education,Waltham, Mass., and Lisa C. Herman-Ellison, Kokomo High School–South Campus, Kokomo, Ind.

196 Advanced Placement Economics Macroeconomics: Student Activities © National Council on Economic Education, New York, N.Y.
43. In this example:
(A) The original deposit of $1,000 increased total bank reserves by $________. Eventually, this ledto a total of $10,000 expansion of bank deposits, __________ of which was because of theoriginal deposit, while _________ was because of bank lending activities.
(B) Therefore, if the fractional reserve had been 15 percent instead of 10 percent, the amount ofdeposit expansion would have been (more / less) than in this example.
(C) Therefore, if the fractional reserve had been 5 percent instead of 10 percent, the amount ofdeposit expansion would have been (more / less) than in this example.
(D) If banks had not loaned out all of their excess reserves, the amount of deposit expansionwould have been (more / less) than in this example.
(E) If all loans had not been redeposited in the banking system, the amount of deposit expansionwould have been (more / less) than in this example.
4. Another way to represent the multiple expansion of deposits is through T-accounts. In short, a T-account is an accounting relationship that looks at changes in balance sheet items. Since balancesheets must balance, so, too, must T-accounts. T-account entries on the asset side must bebalanced by an offsetting asset or an offsetting liability. A sample T-account is provided below. Forthe bank, assets include accounts at the Federal Reserve District Bank, Treasury securities andloans; liabilities are deposits and net worth is assets minus liabilities. Show how the $1,000 check-able deposit described in Question 1 would be listed in a T-account.
Assets Liabilities
MacroeconomicsLESSON 3 ■ ACTIVITY 37 (continued)
UNIT
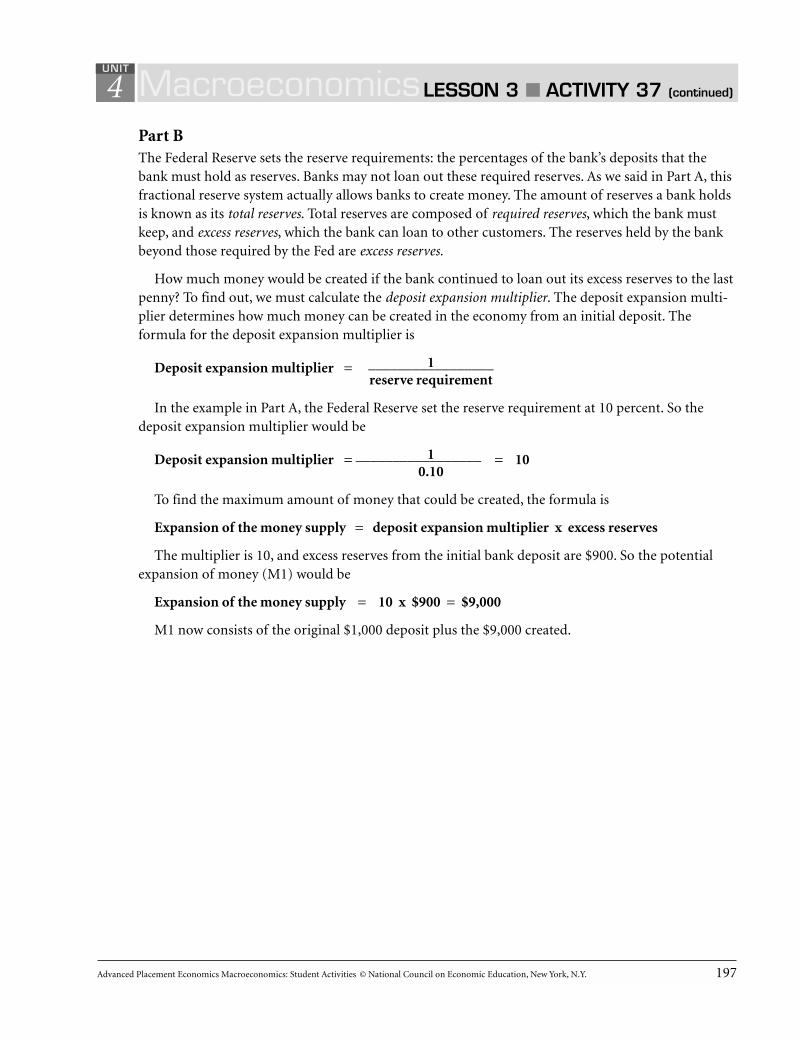
Advanced Placement Economics Macroeconomics: Student Activities © National Council on Economic Education, New York, N.Y. 197
4Part BThe Federal Reserve sets the reserve requirements: the percentages of the bank’s deposits that thebank must hold as reserves. Banks may not loan out these required reserves. As we said in Part A, thisfractional reserve system actually allows banks to create money. The amount of reserves a bank holdsis known as its total reserves. Total reserves are composed of required reserves, which the bank mustkeep, and excess reserves, which the bank can loan to other customers. The reserves held by the bankbeyond those required by the Fed are excess reserves.
How much money would be created if the bank continued to loan out its excess reserves to the lastpenny? To find out, we must calculate the deposit expansion multiplier. The deposit expansion multi-plier determines how much money can be created in the economy from an initial deposit. Theformula for the deposit expansion multiplier is
1Deposit expansion multiplier = _________________reserve requirement
In the example in Part A, the Federal Reserve set the reserve requirement at 10 percent. So thedeposit expansion multiplier would be
1Deposit expansion multiplier = _________________ = 100.10
To find the maximum amount of money that could be created, the formula is
Expansion of the money supply = deposit expansion multiplier x excess reserves
The multiplier is 10, and excess reserves from the initial bank deposit are $900. So the potentialexpansion of money (M1) would be
Expansion of the money supply = 10 x $900 = $9,000
M1 now consists of the original $1,000 deposit plus the $9,000 created.
MacroeconomicsLESSON 3 ■ ACTIVITY 37 (continued)
UNIT
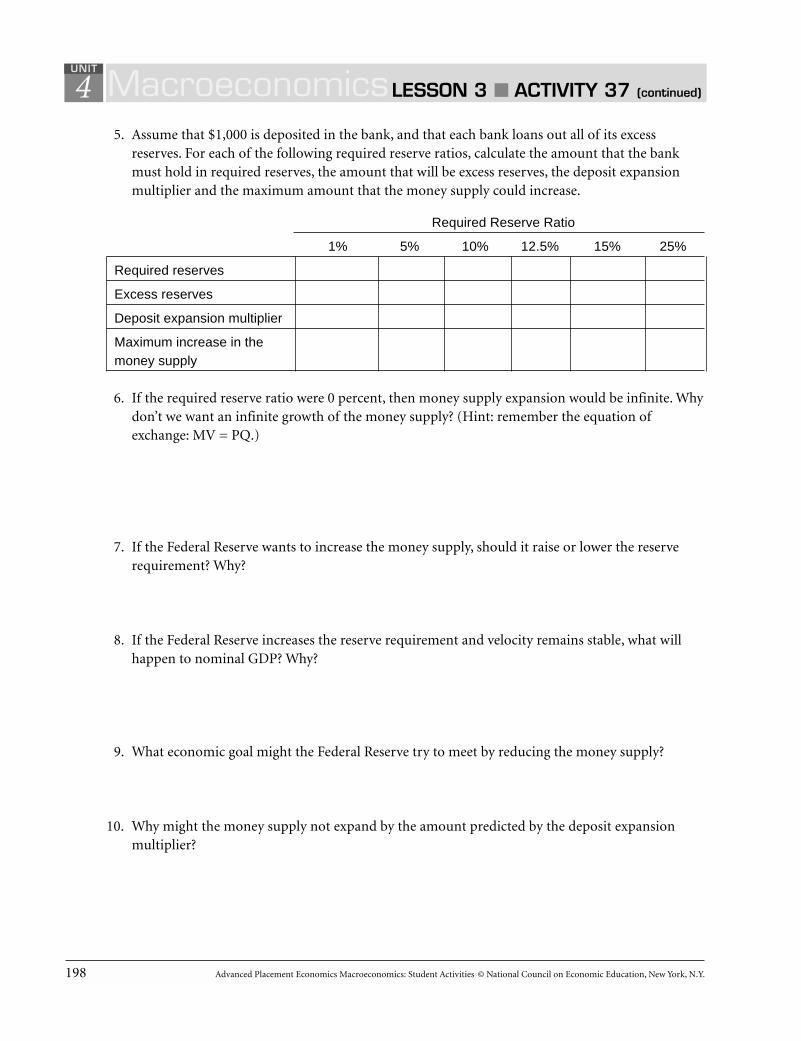
198 Advanced Placement Economics Macroeconomics: Student Activities © National Council on Economic Education, New York, N.Y.
45. Assume that $1,000 is deposited in the bank, and that each bank loans out all of its excess
reserves. For each of the following required reserve ratios, calculate the amount that the bankmust hold in required reserves, the amount that will be excess reserves, the deposit expansionmultiplier and the maximum amount that the money supply could increase.
Required Reserve Ratio
1% 5% 10% 12.5% 15% 25%
Required reserves
Excess reserves
Deposit expansion multiplier
Maximum increase in themoney supply
6. If the required reserve ratio were 0 percent, then money supply expansion would be infinite. Whydon’t we want an infinite growth of the money supply? (Hint: remember the equation ofexchange: MV = PQ.)
7. If the Federal Reserve wants to increase the money supply, should it raise or lower the reserverequirement? Why?
8. If the Federal Reserve increases the reserve requirement and velocity remains stable, what willhappen to nominal GDP? Why?
9. What economic goal might the Federal Reserve try to meet by reducing the money supply?
10. Why might the money supply not expand by the amount predicted by the deposit expansionmultiplier?
MacroeconomicsLESSON 3 ■ ACTIVITY 37 (continued)
UNIT

Advanced Placement Economics Macroeconomics: Student Activities © National Council on Economic Education, New York, N.Y. 199
4
The Federal Reserve: The Mechanics of Monetary PolicyTo manage the money supply, the Federal Reserve uses the tools of monetary policy to influence thequantity of reserves in the banking system. Increasing (decreasing) reserves tends to expand(contract) a bank’s ability to make loans. Thus, reserve management gives the Fed powerful influenceover the money supply and, in turn, over the general price level. The primary tool for reserve man-agement today is open market operations (OMO). Discount rate changes serve primarily as signals;reserve requirements are rarely changed. Using T-accounts, Figures 38.1 and 38.2 show how the Fedcould use open market operations to increase the money supply by $100.
Example: Baseline caseFigure 38.1 shows a baseline T-account. The required reserve ratio is 10 percent of checkingdeposits. With $26 in reserve accounts and $4 in Federal Reserve notes (vault cash), total bankreserves equal $30, exactly 10 percent of checkable deposits (in other words, no excess reserves).Net worth = assets – liabilities.
Figure 38.1Baseline Case
Assets Liabilities
The Fed
Treasury securities $83 $26 Reserve accounts of banks
$57 Federal Reserve notes
Banks
Reserve accounts $26 $300 Checkable deposits
Federal Reserve notes $4
Loans $405 $135 Net worth (to stockholders)
Bank Customers
Checkable deposits $300 $405 Loans
Federal Reserve notes $53
Treasury securities $52
Money supply = $353 ($300 + $53)
Macroeconomics LESSON 4 ■ ACTIVITY 38UNIT
Activity written by Robert Graboyes, University of Richmond, Richmond, Va.

200 Advanced Placement Economics Macroeconomics: Student Activities © National Council on Economic Education, New York, N.Y.
4
Example: Expansionary policy via open market purchasesSuppose the Fed believes the economy is heading into a recession and wishes to increase the moneysupply by $100. Using open market operations, the Fed purchases $10 worth of Treasury securitiesfrom the public.
Figure 38.2 shows the consolidated accounts after the changes of this Fed action work their waythrough the economy. Changes are shown in boldface. Be sure to compare Figure 38.1 with Figure38.2 to see the changes. The Fed’s $10 increase in reserve accounts yields a $100 increase in themoney supply.
Figure 38.2After $10 Open Market Purchase
Assets Liabilities
The Fed
Treasury securities (+$10) $93 $36 Reserve accounts of banks (+$10)
$57 Federal Reserve notes
Banks
Reserve accounts (+$10) $36 $400 Checkable deposits (+$100)
Federal Reserve notes $4
Loans (+$90) $495 $135 Net worth (to stockholders)
Bank Customers
Checkable deposits (+$100) $400 $495 Loans (+$90)
Federal Reserve notes $53
Treasury securities (– $10) $42
Money supply = $453 ($400 + $53)
MacroeconomicsLESSON 4 ■ ACTIVITY 38 (continued)
UNIT

For Questions 1 through 4, start with the baseline case in Figure 38.1. The Fed wishes to decrease themoney supply from $353 to $303 by open market operations. The reserve requirement is 10 percent.
1. Will the Fed want to buy or sell existing Treasury securities? _____________
2. What is the money multiplier? _____________
3. What is the value of Treasury securities that need to be bought or sold? _____________
4. Fill in Figure 38.3 to show the accounts after open market operations are finished and all changeshave worked their way through the economy:
Figure 38.3After Open Market Operations Are Finished
Assets Liabilities
The Fed
Treasury securities Reserve accounts of banks
$57 Federal Reserve notes
Banks
Reserve accounts Checkable deposits
Federal Reserve notes
Loans $135 Net worth (to stockholders)
Bank Customers
Checkable deposits Loans
Federal Reserve notes $53
Treasury securities
Money supply = ____________________
For Questions 5 through 7, suppose banks keep zero excess reserves and the reserve requirement is15 percent.
5. What is the deposit expansion multiplier? _____________
Advanced Placement Economics Macroeconomics: Student Activities © National Council on Economic Education, New York, N.Y. 201
4 MacroeconomicsLESSON 4 ■ ACTIVITY 38 (continued)
UNIT
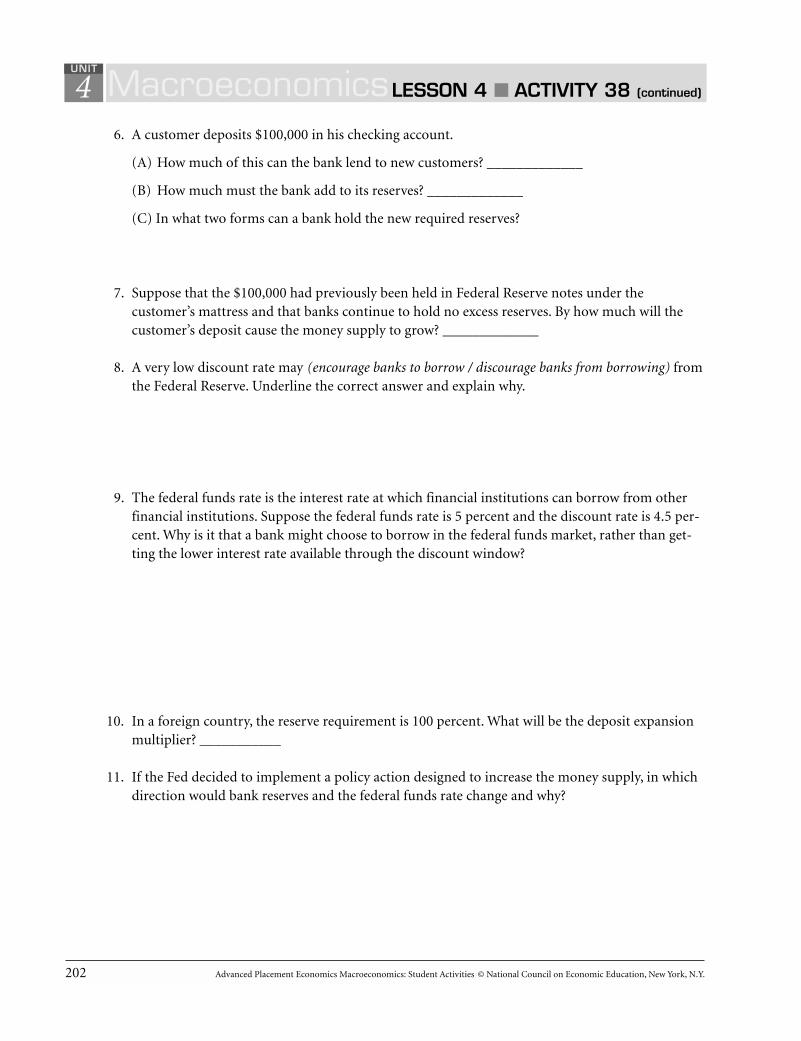
202 Advanced Placement Economics Macroeconomics: Student Activities © National Council on Economic Education, New York, N.Y.
46. A customer deposits $100,000 in his checking account.
(A) How much of this can the bank lend to new customers? _____________
(B) How much must the bank add to its reserves? _____________
(C) In what two forms can a bank hold the new required reserves?
7. Suppose that the $100,000 had previously been held in Federal Reserve notes under thecustomer’s mattress and that banks continue to hold no excess reserves. By how much will thecustomer’s deposit cause the money supply to grow? _____________
8. A very low discount rate may (encourage banks to borrow / discourage banks from borrowing) fromthe Federal Reserve. Underline the correct answer and explain why.
9. The federal funds rate is the interest rate at which financial institutions can borrow from otherfinancial institutions. Suppose the federal funds rate is 5 percent and the discount rate is 4.5 per-cent. Why is it that a bank might choose to borrow in the federal funds market, rather than get-ting the lower interest rate available through the discount window?
10. In a foreign country, the reserve requirement is 100 percent. What will be the deposit expansionmultiplier? ___________
11. If the Fed decided to implement a policy action designed to increase the money supply, in whichdirection would bank reserves and the federal funds rate change and why?
MacroeconomicsLESSON 4 ■ ACTIVITY 38 (continued)
UNIT
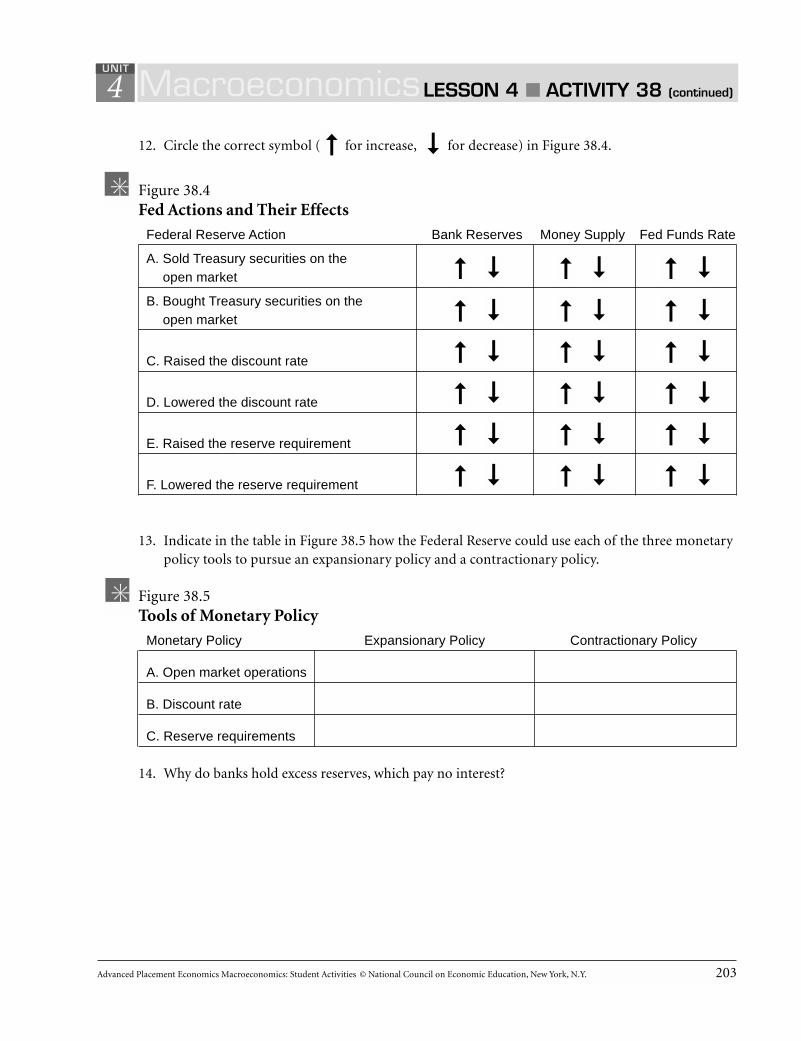
Advanced Placement Economics Macroeconomics: Student Activities © National Council on Economic Education, New York, N.Y. 203
4
12. Circle the correct symbol ( for increase, for decrease) in Figure 38.4.
Figure 38.4Fed Actions and Their Effects
Federal Reserve Action Bank Reserves Money Supply Fed Funds Rate
A. Sold Treasury securities on the open market
B. Bought Treasury securities on the open market
C. Raised the discount rate
D. Lowered the discount rate
E. Raised the reserve requirement
F. Lowered the reserve requirement
13. Indicate in the table in Figure 38.5 how the Federal Reserve could use each of the three monetarypolicy tools to pursue an expansionary policy and a contractionary policy.
Figure 38.5Tools of Monetary Policy
Monetary Policy Expansionary Policy Contractionary Policy
A. Open market operations
B. Discount rate
C. Reserve requirements
14. Why do banks hold excess reserves, which pay no interest?
➞
➞
➞
➞
➞
➞
➞
➞
➞
➞
➞
➞
➞
➞
➞
➞
➞
➞
➞
➞
➞
➞
➞
➞
➞
➞
➞
➞
➞
➞
➞
➞
➞
➞
➞
➞
➞
➞
MacroeconomicsLESSON 4 ■ ACTIVITY 38 (continued)
UNIT

204 Advanced Placement Economics Macroeconomics: Student Activities © National Council on Economic Education, New York, N.Y.
415. Why does the Fed rarely use the reserve requirement as an instrument of monetary policy?
16. What does it mean to say that the Fed changes the discount rate mostly as a signal to markets?
17. Why does the Fed currently target the federal funds rate rather than the money supply?
MacroeconomicsLESSON 4 ■ ACTIVITY 38 (continued)
UNIT
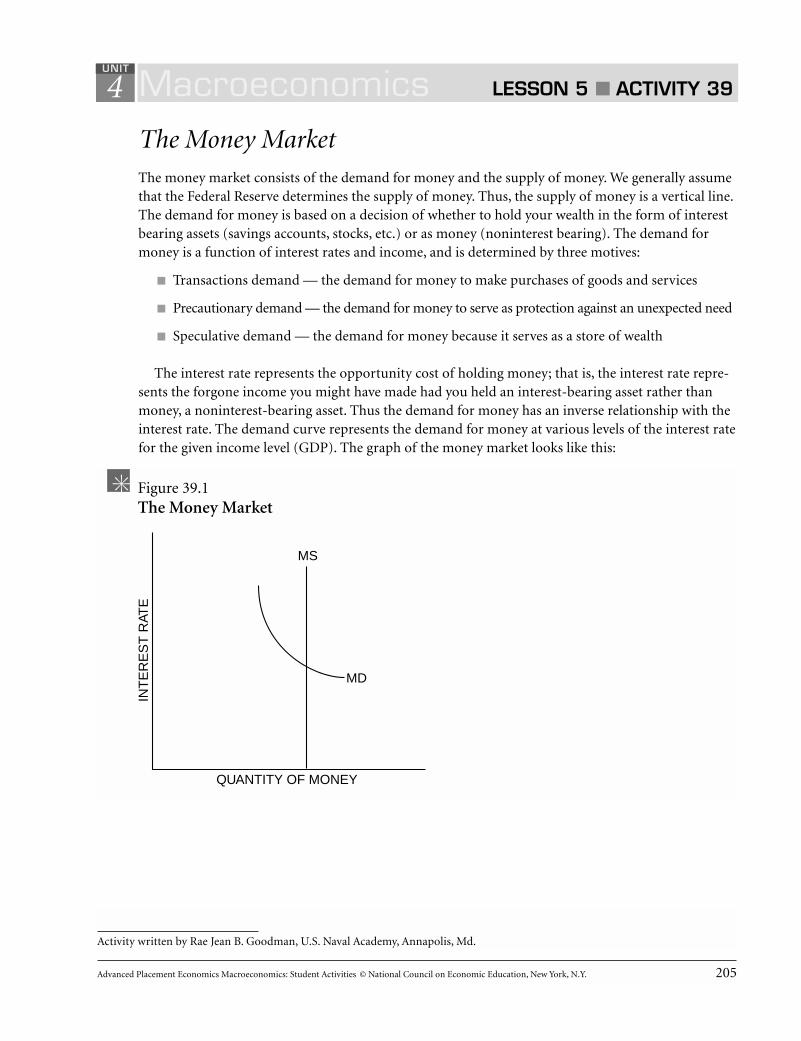
Advanced Placement Economics Macroeconomics: Student Activities © National Council on Economic Education, New York, N.Y. 205
4
The Money MarketThe money market consists of the demand for money and the supply of money. We generally assumethat the Federal Reserve determines the supply of money. Thus, the supply of money is a vertical line.The demand for money is based on a decision of whether to hold your wealth in the form of interestbearing assets (savings accounts, stocks, etc.) or as money (noninterest bearing). The demand formoney is a function of interest rates and income, and is determined by three motives:
■ Transactions demand — the demand for money to make purchases of goods and services
■ Precautionary demand — the demand for money to serve as protection against an unexpected need
■ Speculative demand — the demand for money because it serves as a store of wealth
The interest rate represents the opportunity cost of holding money; that is, the interest rate repre-sents the forgone income you might have made had you held an interest-bearing asset rather thanmoney, a noninterest-bearing asset. Thus the demand for money has an inverse relationship with theinterest rate. The demand curve represents the demand for money at various levels of the interest ratefor the given income level (GDP). The graph of the money market looks like this:
Macroeconomics LESSON 5 ■ ACTIVITY 39UNIT
Activity written by Rae Jean B. Goodman, U.S. Naval Academy, Annapolis, Md.
INT
ER
ES
T R
ATE
QUANTITY OF MONEY
MS
MD
Figure 39.1The Money Market
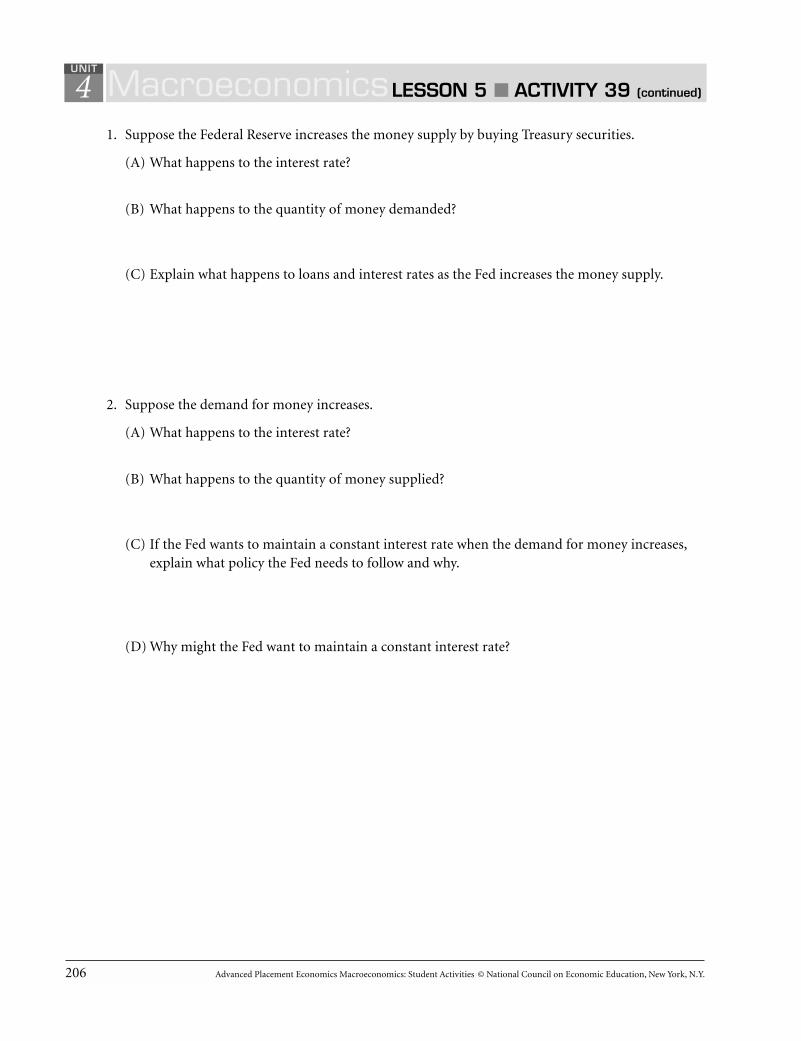
206 Advanced Placement Economics Macroeconomics: Student Activities © National Council on Economic Education, New York, N.Y.
41. Suppose the Federal Reserve increases the money supply by buying Treasury securities.
(A) What happens to the interest rate?
(B) What happens to the quantity of money demanded?
(C) Explain what happens to loans and interest rates as the Fed increases the money supply.
2. Suppose the demand for money increases.
(A) What happens to the interest rate?
(B) What happens to the quantity of money supplied?
(C) If the Fed wants to maintain a constant interest rate when the demand for money increases,explain what policy the Fed needs to follow and why.
(D) Why might the Fed want to maintain a constant interest rate?
MacroeconomicsLESSON 5 ■ ACTIVITY 39 (continued)
UNIT
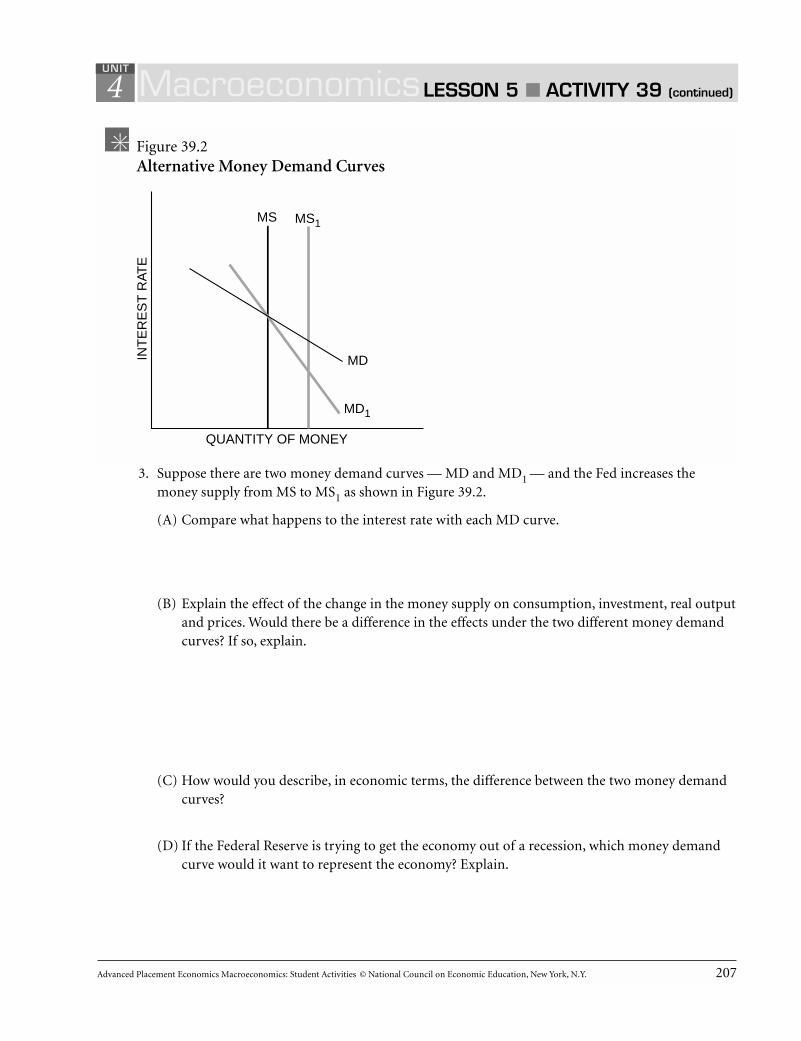
Advanced Placement Economics Macroeconomics: Student Activities © National Council on Economic Education, New York, N.Y. 207
4
3. Suppose there are two money demand curves — MD and MD1 — and the Fed increases themoney supply from MS to MS1 as shown in Figure 39.2.
(A) Compare what happens to the interest rate with each MD curve.
(B) Explain the effect of the change in the money supply on consumption, investment, real outputand prices. Would there be a difference in the effects under the two different money demandcurves? If so, explain.
(C) How would you describe, in economic terms, the difference between the two money demandcurves?
(D) If the Federal Reserve is trying to get the economy out of a recession, which money demandcurve would it want to represent the economy? Explain.
MacroeconomicsLESSON 5 ■ ACTIVITY 39 (continued)
UNIT
INT
ER
ES
T R
ATE
Figure 39.2Alternative Money Demand Curves
QUANTITY OF MONEY
MS
MD1
MD
MS1


Advanced Placement Economics Macroeconomics: Student Activities © National Council on Economic Education, New York, N.Y. 209
4
The Federal Reserve: Monetary Policy and Macroeconomics
The Basics■ Purpose of monetary policy: “To promote effectively the goals of maximum employment, stable
prices and moderate long-term interest rates” (The Federal Reserve System: Purpose and Functions,Washington D.C.: Federal Reserve Board of Governors, page 17.)
■ Primary goal since 1979: To stabilize prices, which is arguably the strongest contribution the Fedcan make toward maximizing long-term real output and moderating long-term interest rates
■ Reason for this goal: Over time, it has become evident that monetary policy’s long-term influenceover prices is strong and predictable, but its influence over real output and real interest rates ismostly short-term and not highly predictable.
Linkages That Motivate Monetary PolicyThe following diagram illustrates how monetary policy operates and how it affects prices and quanti-ties (real output).
Money x Velocity = Price x Quantity
Fed Policy Reserves
Short-term interest rates
The Fed Influences the Money Supply by Managing ReservesA greater volume of reserves leads banks to expand credit, expanding the money supply through themoney multiplier.
■ Tools of policy: Open market operations are the most frequently used tool. Changes in the dis-count rate are used primarily to signal the Fed’s policy. Reserve requirements are seldom adjusted.
■ Choice of policy targets: The Fed can set money supply targets, knowing that such actions willaffect short-term interest rates as a by-product. Or the Fed can target short-term interest ratesdirectly. Because of changes in financial institutions and other economic relationships, the optimaloperating procedures change over time.
■ Limitation on policy: The Fed cannot target the money supply and short-term interest ratessimultaneously. Ceteris paribus, or all other factors held constant, increasing (decreasing) themoney supply decreases (increases) short-term interest rates.
■ Importance of velocity: Changes in the money supply have little short-term effect on velocity, sochanges in the money supply must affect prices or real output, or both. This linkage provides theunderlying motive for the long-term conduct of monetary policy.
Macroeconomics LESSON 5 ■ ACTIVITY 40UNIT
Activity written by Robert Graboyes, University of Richmond, Richmond, Va.

210 Advanced Placement Economics Macroeconomics: Student Activities © National Council on Economic Education, New York, N.Y.
4
Economists Can Disagree Sharply Over the Effects of a GivenMonetary PolicyThis disagreement can occur because
■ the relationship between reserves and the money supply can change.
■ the relationship between the money supply and short-term interest rates can change.
■ velocity is not entirely stable.
■ it is difficult to determine which money supply measure is most appropriate to policy.
■ though today’s monetary economists do not generally fall neatly into categories such as“Keynesian” and “monetarist,” debates persist over the relative impact of monetary policy on pricesand output. These relative impacts can change over time.
■ data are imperfect, and many data series are produced and transmitted with lags.
■ economic relationships are dynamic. Action the Fed takes today affects the economy well into thefuture.
MacroeconomicsLESSON 5 ■ ACTIVITY 40 (continued)
UNIT
Advanced Placement Economics Macroeconomics: Student Activities © National Council on Economic Education, New York, N.Y. 211
41. What is monetary policy?
2. From 1998 to 2002, what was the dominant focus of monetary policy and why?
3. Explain why the money supply and short-term interest rates are inversely related.
4. What are some reasons for lags and imperfections in data used by central banks?
5. Why do many economists believe that central banks have more control over the price level thanover real output?
6. What might cause velocity to change?
MacroeconomicsLESSON 5 ■ ACTIVITY 40 (continued)
UNIT
212 Advanced Placement Economics Macroeconomics: Student Activities © National Council on Economic Education, New York, N.Y.
47. If velocity were extremely volatile, why would this complicate the job of making monetary policy?
8. What role does the money multiplier play in enabling the Fed to conduct monetary policy?
9. What is the fed funds rate?
10. What happens to the fed funds rate if the Fed follows a contractionary (tight money) policy?
11. What happens to the fed funds rate if the Fed follows an expansionary (easy money) policy?
12. Why do observers pay close attention to the federal funds rate?
MacroeconomicsLESSON 5 ■ ACTIVITY 40 (continued)
UNIT

Advanced Placement Economics Macroeconomics: Student Activities © National Council on Economic Education, New York, N.Y. 213
4
Real Interest Rates and Nominal Interest RatesIf you bought a one-year bond for $1,000 and the bond paid an interest rate of 10 percent, at the endof the year would you be 10 percent wealthier? You will certainly have 10 percent more money thanyou did a year earlier, but can you buy 10 percent more? If the price level has risen, the answer is thatyou cannot buy 10 percent more: If the inflation rate were 8 percent, then you could buy only 2 per-cent more; if the inflation rate were 12 percent, you would be able to buy 2 percent less! The nominalinterest rate is the rate the bank pays you on your savings or the rate that appears on your bond or carloan. The actual real interest rate represents the change in your purchasing power. The expected realinterest rate represents the amount you need to receive in real terms to forgo consumption now forconsumption in the future.
The relationship between the nominal interest rate, the real interest rate and the inflation rate canbe written as
r = i – π
where r is the real interest rate, i is the nominal interest rate and πis the inflation rate. This relationshipis called the Fisher Equation. In the example above with the 10 percent bond, if the inflation rate were6 percent, then your real interest rate (the increase in your purchasing power) would be 4 percent.
Obviously banks and customers do not know what inflation is going to be, so the interest rates onloans, bonds, etc. are set based on expected inflation. The expected real interest rate is
re = i – πe
where πe is the expected inflation rate. The equation can be rewritten as
i = re + πe
A bank sets the nominal interest rate equal to its expected real interest rate plus the expected infla-tion rate. However, the real interest rate it actually receives may be different if inflation is not equal tothe bank’s expected inflation rate.
The equation of exchange is MV = PQ. If we assume that velocity (V) is constant, then changes inthe money supply (M) result in changes in the nominal output (PQ). The equation of exchange canbe rewritten in terms of percentage change to be
percentage change in money supply + percentage change in velocity = percentage change in price level + percentage change in real output
Macroeconomics LESSON 6 ■ ACTIVITY 41UNIT
Activity written by Rae Jean B. Goodman, U.S. Naval Academy, Annapolis, Md.
214 Advanced Placement Economics Macroeconomics: Student Activities © National Council on Economic Education, New York, N.Y.
4The first term, percentage change in the money supply, is controlled by the monetary authority
(Federal Reserve). Assuming that velocity is constant, the second term is zero. The third term is theinflation rate and the fourth term is the growth in real output. Output (Q) is determined by the fac-tors of production, technology and the production function. Output can be taken as given. Therefore,the percentage change in the money supply results in an equal percentage change in the price level.
Increases in the money supply by the Federal Reserve will result in increases in the price level, orinflation. Using the Fisher Equation, the increase in inflation would result in an increase in the nomi-nal interest rate or a decrease in the real interest rate or in some combination. This is known as theFisher Effect, or Fisher Hypothesis. Evidence indicates that increases in the inflation rate result inincreases in the nominal interest rate in the long run. Increases in the money supply are translatedinto increases in the price level and increases in the nominal interest rate in the long run.
We know that
■ in the short run, increases in the money supply decrease the nominal interest rate and realinterest rate;
■ in the long run, increases in the money supply will result in an increase in the price level and the nominal interest rate.
MacroeconomicsLESSON 6 ■ ACTIVITY 41 (continued)
UNIT
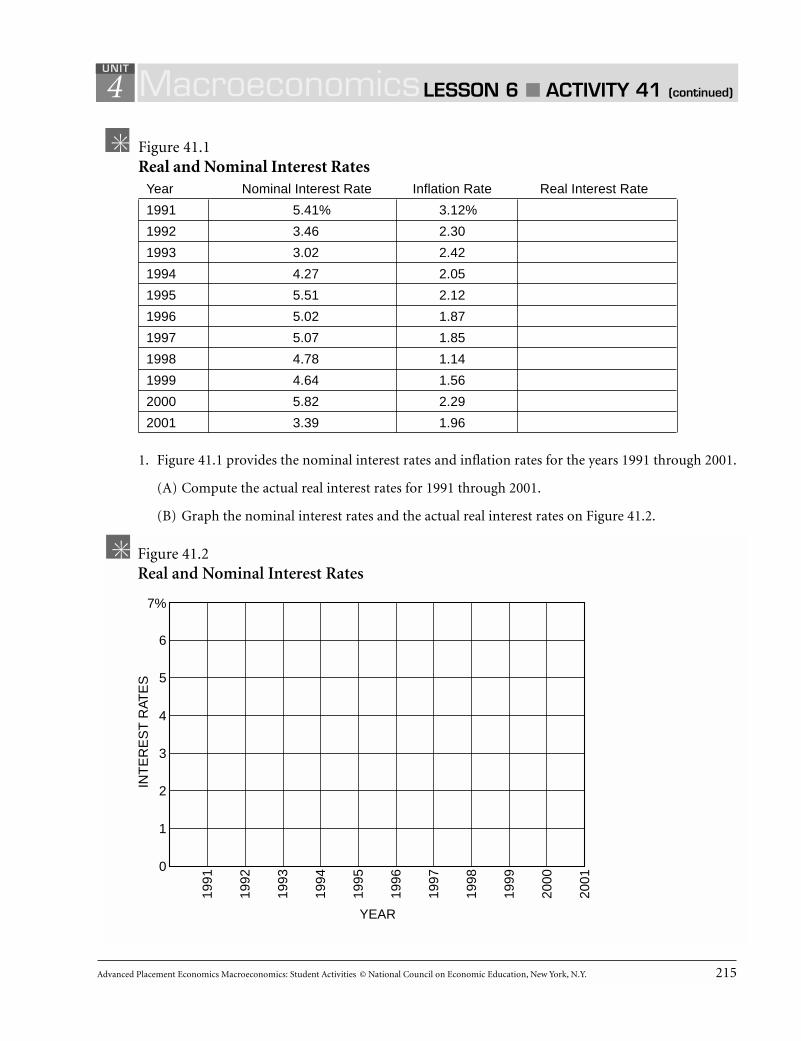
Advanced Placement Economics Macroeconomics: Student Activities © National Council on Economic Education, New York, N.Y. 215
4
Figure 41.1Real and Nominal Interest Rates
Year Nominal Interest Rate Inflation Rate Real Interest Rate
1991 5.41% 3.12%
1992 3.46 2.30
1993 3.02 2.42
1994 4.27 2.05
1995 5.51 2.12
1996 5.02 1.87
1997 5.07 1.85
1998 4.78 1.14
1999 4.64 1.56
2000 5.82 2.29
2001 3.39 1.96
1. Figure 41.1 provides the nominal interest rates and inflation rates for the years 1991 through 2001.
(A) Compute the actual real interest rates for 1991 through 2001.
(B) Graph the nominal interest rates and the actual real interest rates on Figure 41.2.
MacroeconomicsLESSON 6 ■ ACTIVITY 41 (continued)
UNIT
YEAR
Figure 41.2Real and Nominal Interest Rates
INT
ER
ES
T R
ATE
S
1991
0
1
2
3
4
5
6
7%
1992
1993
1994
1995
1996
1997
1998
1999
2000
2001
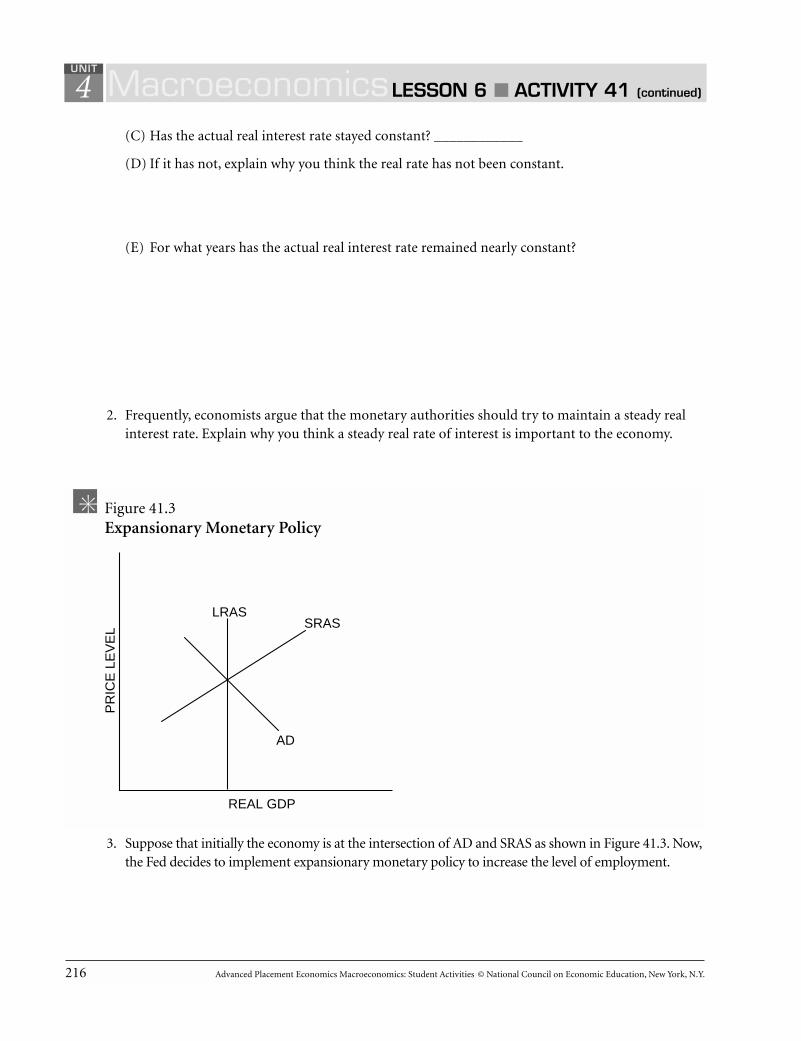
216 Advanced Placement Economics Macroeconomics: Student Activities © National Council on Economic Education, New York, N.Y.
4(C) Has the actual real interest rate stayed constant? ____________
(D) If it has not, explain why you think the real rate has not been constant.
(E) For what years has the actual real interest rate remained nearly constant?
2. Frequently, economists argue that the monetary authorities should try to maintain a steady realinterest rate. Explain why you think a steady real rate of interest is important to the economy.
3. Suppose that initially the economy is at the intersection of AD and SRAS as shown in Figure 41.3. Now,the Fed decides to implement expansionary monetary policy to increase the level of employment.
MacroeconomicsLESSON 6 ■ ACTIVITY 41 (continued)
UNIT
PR
ICE
LE
VE
L
Figure 41.3Expansionary Monetary Policy
REAL GDP
LRASSRAS
AD

Advanced Placement Economics Macroeconomics: Student Activities © National Council on Economic Education, New York, N.Y. 217
4(A) In the short run, what happens to real output? Explain why.
(B) In the short run, what happens to the price level? Explain why.
(C) In the short run, what happens to employment and nominal wages? Explain why.
(D) In the short run, what happens to nominal interest rates and real interest rates?
(E) In the long run, what happens to real output? Explain why.
(F) In the long run, what happens to the price level? Explain why.
(G) In the long run, what happens to employment and nominal wages? Explain why.
(H) In the long run, what happens to the nominal interest rate and the real interest rate?
MacroeconomicsLESSON 6 ■ ACTIVITY 41 (continued)
UNIT


Advanced Placement Economics Macroeconomics: Student Activities © National Council on Economic Education, New York, N.Y. 219
4
Monetary PolicyWe now bring together all of the pieces of the process by which monetary policy is transmitted to theeconomy, and we examine both the short-run effects and the long-run effects of monetary policy.
1. Suppose that initially the economy is at the intersection of AD and SRAS in Figure 42.1.
(A) What monetary policy should the Fed implement to move the economy to full-employmentoutput? ______________________________________
(B) If the Fed is going to use open market operations, it should (buy / sell) Treasury securities.
(C) What is the effect on Treasury security (bond) prices?
(D) In the short run, what is the effect on nominal interest rates? Explain.
(E) In the short run, what happens to real output? Explain how the Fed’s action results in achange in real output.
Macroeconomics LESSON 6 ■ ACTIVITY 42UNIT
Activity written by Rae Jean B. Goodman, U.S. Naval Academy, Annapolis, Md.
PR
ICE
LE
VE
L
Figure 42.1Effects of Monetary Policy
REAL GDP
LRASSRAS
AD

220 Advanced Placement Economics Macroeconomics: Student Activities © National Council on Economic Education, New York, N.Y.
4(F) In the short run, what happens to the price level? Explain how the Fed’s action results in a
change to the price level.
2. Suppose that initially the economy is at the intersection of AD and SRAS in Figure 42.2.
(A) What monetary policy should the Fed implement to move the economy to full-employmentoutput? _____________________________________
(B) If the Fed is going to use open market operations, it should (buy / sell) Treasury securities.
(C) What is the effect on Treasury security (bond) prices?
(D) In the short run, what is the effect on nominal interest rates? Explain.
(E) In the short run, what happens to real output? Explain how the Fed’s action results in achange in real output.
MacroeconomicsLESSON 6 ■ ACTIVITY 42 (continued)
UNIT
PR
ICE
LE
VE
L
Figure 42.2Moving to Full Employment
REAL GDP
LRASSRAS
AD

Advanced Placement Economics Macroeconomics: Student Activities © National Council on Economic Education, New York, N.Y. 221
4(F) In the short run, what happens to the price level? Explain how the Fed’s action results in a
change to the price level.
3. Suppose that in the situation shown in Figure 42.3, the aggregate supply and demand curves arerepresented by LRAS, SRAS and AD. The monetary authorities decide to maintain the level ofemployment represented by the output level Y1 by using expansionary monetary policy.
(A) Explain the effect of the expansionary monetary policy on the price level and output in theshort run.
(B) Explain the effect on the price level and output in the long run.
MacroeconomicsLESSON 6 ■ ACTIVITY 42 (continued)
UNIT
Figure 42.3Expansionary Monetary Policy
PR
ICE
LE
VE
L
REAL GDP
LRAS
SRAS
AD
Y1Y*

222 Advanced Placement Economics Macroeconomics: Student Activities © National Council on Economic Education, New York, N.Y.
4(C) Explain what you think will happen to the nominal rate of interest and the real rate of interest
in the short run as the Fed continues to increase the money supply. Explain why.
(D) Explain what you think will happen to the nominal rate of interest and the real rate of interestin the long run. Explain why.
4. Many economists think that moving from short-run equilibrium to long-run equilibrium maytake several years. List three reasons why the economy might not immediately move to long-runequilibrium.
5. In a short paragraph, summarize the long-run impact of an expansionary monetary policy on theeconomy.
MacroeconomicsLESSON 6 ■ ACTIVITY 42 (continued)
UNIT

Advanced Placement Economics Macroeconomics: Student Activities © National Council on Economic Education, New York, N.Y. 223
Circle the letter of each correct answer.
1. The M1 definition of money includes which ofthe following?I. CurrencyII. Demand deposits (checkable deposits)III. Savings accounts and small time depositsIV. Eurodollars
(A) I only
(B) II only
(C) III only
(D) I and II only
(E) II, III and IV only
2. If the legal reserve requirement is 25 percent, thevalue of the simple deposit expansion multiplier is
(A) 2. (B) 4. (C) 5.
(D) 10. (E) 1.0.
3. When money is used as a standard of value, aperson is
(A) earning more money than before.
(B) purchasing a necessity.
(C) making a financial transaction.
(D) making price comparisons among products.
(E) writing a check for groceries.
4. Which of the following are true statementsabout the federal funds rate?I. It is the same thing as the discount rate.II. It is the interest rate that banks charge each
other for short-term loans.III. It is influenced by open market operations.
(A) I only
(B) II only
(C) III only
(D) I and II only
(E) II and III only
5. Suppose the Federal Reserve buys $400,000worth of securities from the securities dealers onthe open market. If the reserve requirement is 20percent and the banks hold no excess reserves,what will happen to the total money supply?
(A) It will be unchanged.
(B) It will contract by $2,000,000.
(C) It will contract by $800,000.
(D) It will expand by $2,000,000.
(E) It will expand by $800,000.
6. The money market is definitely in equilibriumin which of the following cases?
(A) When velocity is constant
(B) When the quantity of money demandedequals the quantity of money supplied
(C) When the present value is equal to theinterest rate
(D) When the present value is greater than theinterest rate
(E) When the interest rate is equal to the priceof bonds
7. A commercial bank holds $500,000 in demanddeposit liabilities and $120,000 in reserves. Ifthe required reserve ratio is 20 percent, which ofthe following is the maximum amount by whichthis single commercial bank and the maximumamount by which the banking system canincrease loans?
Amount Created Amount Createdby Single Bank by Banking System
(A) $5,000 $25,000
(B) $20,000 $80,000
(C) $20,000 $100,000
(D) $30,000 $150,000
(E) $120,000 $500,000
4 Macroeconomics SAMPLE QUESTIONS MULTIPLE-CHOICE
UNIT
Sample Multiple-Choice Questions
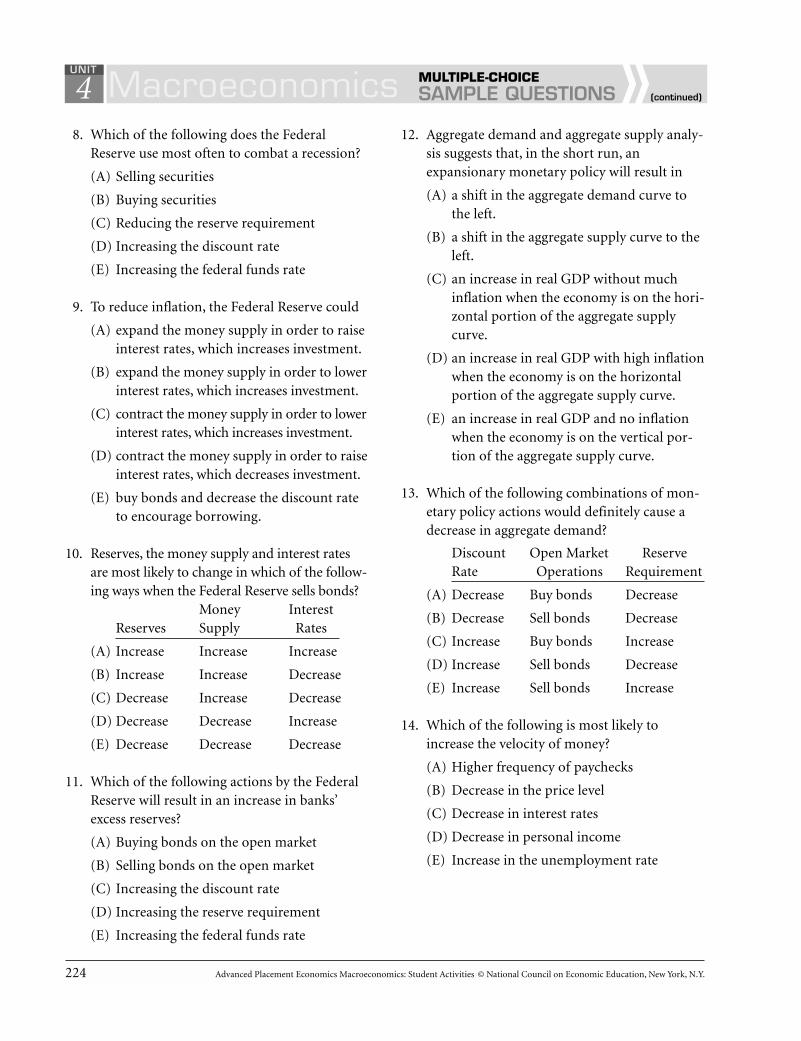
224 Advanced Placement Economics Macroeconomics: Student Activities © National Council on Economic Education, New York, N.Y.
8. Which of the following does the FederalReserve use most often to combat a recession?
(A) Selling securities
(B) Buying securities
(C) Reducing the reserve requirement
(D) Increasing the discount rate
(E) Increasing the federal funds rate
9. To reduce inflation, the Federal Reserve could
(A) expand the money supply in order to raiseinterest rates, which increases investment.
(B) expand the money supply in order to lowerinterest rates, which increases investment.
(C) contract the money supply in order to lowerinterest rates, which increases investment.
(D) contract the money supply in order to raiseinterest rates, which decreases investment.
(E) buy bonds and decrease the discount rateto encourage borrowing.
10. Reserves, the money supply and interest ratesare most likely to change in which of the follow-ing ways when the Federal Reserve sells bonds?
Money InterestReserves Supply Rates
(A) Increase Increase Increase
(B) Increase Increase Decrease
(C) Decrease Increase Decrease
(D) Decrease Decrease Increase
(E) Decrease Decrease Decrease
11. Which of the following actions by the FederalReserve will result in an increase in banks’excess reserves?
(A) Buying bonds on the open market
(B) Selling bonds on the open market
(C) Increasing the discount rate
(D) Increasing the reserve requirement
(E) Increasing the federal funds rate
12. Aggregate demand and aggregate supply analy-sis suggests that, in the short run, anexpansionary monetary policy will result in
(A) a shift in the aggregate demand curve tothe left.
(B) a shift in the aggregate supply curve to theleft.
(C) an increase in real GDP without muchinflation when the economy is on the hori-zontal portion of the aggregate supplycurve.
(D) an increase in real GDP with high inflationwhen the economy is on the horizontalportion of the aggregate supply curve.
(E) an increase in real GDP and no inflationwhen the economy is on the vertical por-tion of the aggregate supply curve.
13. Which of the following combinations of mon-etary policy actions would definitely cause adecrease in aggregate demand?
Discount Open Market ReserveRate Operations Requirement
(A) Decrease Buy bonds Decrease
(B) Decrease Sell bonds Decrease
(C) Increase Buy bonds Increase
(D) Increase Sell bonds Decrease
(E) Increase Sell bonds Increase
14. Which of the following is most likely toincrease the velocity of money?
(A) Higher frequency of paychecks
(B) Decrease in the price level
(C) Decrease in interest rates
(D) Decrease in personal income
(E) Increase in the unemployment rate
4 Macroeconomics SAMPLE QUESTIONS MULTIPLE-CHOICE
UNIT
(continued)

Advanced Placement Economics Macroeconomics: Student Activities © National Council on Economic Education, New York, N.Y. 225
15. Which of the following characteristics ofmoney could be found in bars of gold?
(A) Portability, uniformity and stability invalue
(B) Portability and acceptability
(C) Uniformity, acceptability and stability invalue
(D) Uniformity and durability
(E) Portability and stability in value
16. The real interest rate is simply stated as the
(A) price of borrowed money in the future.
(B) inflation rate minus the CPI.
(C) nominal interest rate over time.
(D) nominal interest rate minus the expectedinflation rate.
(E) nominal interest rate plus the expectedinflation rate.
17. Vault cash and reserve accounts are similar inthat each
(A) earns no interest.
(B) provides for the bank’s use of largeamounts of cash.
(C) is maintained by the bank at a fixed per-centage set by the Federal Reserve.
(D) is kept on account at the Federal ReserveBank.
(E) is part of the money supply.
18. The neutrality of money refers to the situationwhere
(A) money has not been the cause of war.
(B) increases in interest rates are matched bydecreases in the price of bonds.
(C) increases in interest rates are matched byincreases in the price of bonds.
(D) increases in the money supply eventuallyresult in no change in real output.
(E) decreases in the money supply result inincreases in the interest rate in the shortrun.
19. Expansionary monetary policy results in whichof the following in the short run?I. The money supply increases.II. The nominal interest rate decreases.III. The real interest rate decreases.IV. Bond prices decrease.
(A) I and II only
(B) I, II and III only
(C) I, II and IV only
(D) III and IV only
(E) IV only
20. True statements about expansionary monetarypolicy in the long run include which of the fol-lowing?I. Price level increases to match the increase
in the money supply.II. The nominal interest rate equals the real
interest rate plus the expected inflationrate.
III. The real output level has not permanentlyincreased.
(A) I only
(B) II only
(C) III only
(D) I and II only
(E) I, II and III
4 Macroeconomics SAMPLE QUESTIONS MULTIPLE-CHOICE
UNIT
(continued)


Advanced Placement Economics Macroeconomics: Student Activities © National Council on Economic Education, New York, N.Y. 227
Sample Short Free-Response Questions*1. The reserve requirement for the banking system is 20 percent. Currently Third National Bank has
no excess reserves. Then Behroz deposits $100 in her checking account at Third National.
(A) Explain, without using a mathematical formula, why Behroz’s deposit can lead to an increasein the money supply that is greater than $100.
(B) Discuss two limitations of this process.
4 Macroeconomics SAMPLE QUESTIONS SHORT FREE-RESPONSE
UNIT
*Actual free-response question from a past AP test. Reprinted by permission of the College Entrance Examination Board, the copy-right owner. For limited use by NCEE.
228 Advanced Placement Economics Macroeconomics: Student Activities © National Council on Economic Education, New York, N.Y.
2. The Federal Reserve has three primary tools to expand or contract the money supply.
(A) List the three tools.
(B) Which tool does the Fed use most often?
(C) Explain why the Federal Reserve uses the tool you indicated in Question 2(B).
3. Milton Friedman has said, “Inflation is primarily a monetary phenomenon.”
(A) Describe the conditions under which an increase in the money supply would be inflationary.
(B) Use an aggregate supply and aggregate demand graph to show the conditions under whichincreases in the money supply are entirely inflationary.
4 Macroeconomics SAMPLE QUESTIONS SHORT FREE-RESPONSE
UNIT
(continued)

Advanced Placement Economics Macroeconomics: Student Activities © National Council on Economic Education, New York, N.Y. 229
4. Explain the statement that the Federal Reserve can “target” the size of the money supply or theinterest rate, but not both.
5. Suppose the required reserve ratio is 0.20.
(A) What would be the value of the deposit expansion multiplier? ___________
(B) Discuss why it is unlikely that a new deposit of $1,000 to a checking account would result inthe money supply fully increasing as indicated by the deposit expansion multiplier.
6. Banks can borrow reserves at either the federal funds rate or at the discount rate.
(A) Define the federal funds rate.
(B) Define the discount rate.
(C) Under what conditions would banks borrow at the discount rate?
4 Macroeconomics SAMPLE QUESTIONS SHORT FREE-RESPONSE
UNIT
(continued)


Advanced Placement Economics Macroeconomics: Student Activities © National Council on Economic Education, New York, N.Y. 231
Sample Long Free-Response Questions1. Suppose the economy is experiencing rising unemployment, slowing increases in real GDP and
modest inflation. The Federal Reserve decides to follow an expansionary policy.
(A) Describe what this policy might include.
(B) If the policy is effective, explain the short-run effect it would have on each of the following:(i) Interest rates(ii) Private investment(iii) GDP(iv) Employment
4 Macroeconomics SAMPLE QUESTIONS LONG FREE-RESPONSE
UNIT

232 Advanced Placement Economics Macroeconomics: Student Activities © National Council on Economic Education, New York, N.Y.
2. The Federal Reserve Board of Governors determines that it is currently appropriate to follow acontractionary policy.
(A) Use a correctly labeled aggregate demand and aggregate supply graph to illustrate the situa-tion that would make this policy appropriate.
(B) Would the monetary policy be to increase or decrease the money supply? Explain.
4 Macroeconomics SAMPLE QUESTIONS LONG FREE-RESPONSE
UNIT
(continued)

Advanced Placement Economics Macroeconomics: Student Activities © National Council on Economic Education, New York, N.Y. 233
(C) Describe the policy the Federal Reserve is likely to take, and explain how its action achieves thegoal of following a contractionary policy. Explain how the policy would affect each of thefollowing:(i) Interest rates(ii) Investment(iii) Output(iv) Price level(v) Employment
4 Macroeconomics SAMPLE QUESTIONS LONG FREE-RESPONSE
UNIT
(continued)
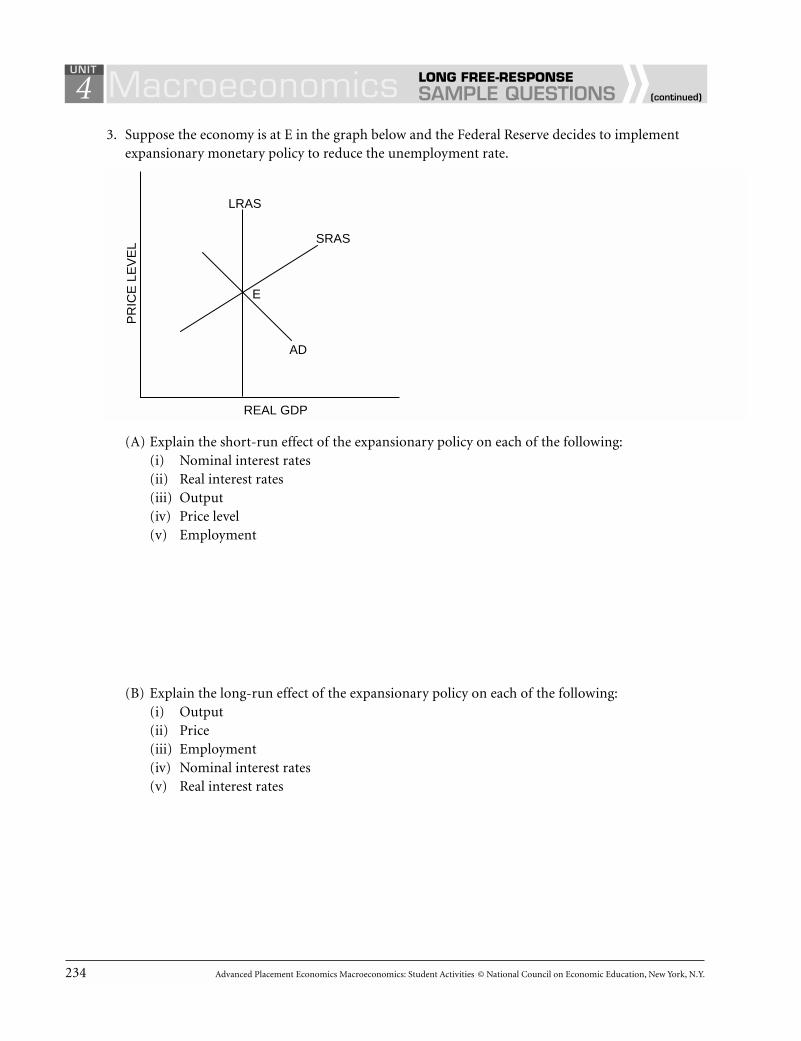
234 Advanced Placement Economics Macroeconomics: Student Activities © National Council on Economic Education, New York, N.Y.
3. Suppose the economy is at E in the graph below and the Federal Reserve decides to implementexpansionary monetary policy to reduce the unemployment rate.
(A) Explain the short-run effect of the expansionary policy on each of the following:(i) Nominal interest rates(ii) Real interest rates(iii) Output(iv) Price level(v) Employment
(B) Explain the long-run effect of the expansionary policy on each of the following:(i) Output(ii) Price(iii) Employment(iv) Nominal interest rates(v) Real interest rates
4 Macroeconomics SAMPLE QUESTIONS LONG FREE-RESPONSE
UNIT
(continued)
PR
ICE
LE
VE
L
REAL GDP
LRAS
SRAS
AD
E

Macroeconomics | Unit 5Macroeconomics | Unit 5Monetary and Fiscal Policy
Combinations: Stabilization
Policy in the Real World


Advanced Placement Economics Macroeconomics: Student Activities © National Council on Economic Education, New York, N.Y. 237
■ Macroeconomic policy involves combina-tions of fiscal and monetary policies.
■ The inside lag is the amount of time it takespolicy makers to recognize the economic sit-uation and take action. The outside orimpact lag is the amount of time it takes theeconomy to respond to the policy changes.The inside lag is long for fiscal policy andshort for monetary policy. The outside lag isvery short for fiscal policy and variable formonetary policy.
■ Crowding-out is the effect on investmentand consumption spending of an increase ininterest rates caused by increased borrowingby the federal government. The higher inter-est rates crowd out business and consumerborrowing.
■ A Phillips curve illustrates the trade-offbetween inflation and unemployment. Thetrade-off differs in the short and long run,varies at different times and is often differ-ent for increases and decreases in output.
■ The short-run Phillips curve shows a trade-off between the inflation rate and the unem-ployment rate.
■ The long-run Phillips curve is vertical.
■ Both monetary and fiscal policies are pri-marily aggregate demand policies, but notall of the macroeconomic problems in theeconomy are aggregate demand problems.
■ If factors other than excess aggregate demandare contributing to inflation, it is difficult formonetary policy to control inflation.
■ The Barro-Ricardo effect is the possibilitythat government deficits will lead to anincrease in private savings and a decrease inconsumption, thus offsetting the effects ofexpansionary fiscal policy.
■ Economic growth is concerned with increas-ing an economy’s total productive capacityat full employment or its natural rate of out-put. This output is represented by a verticallong-run aggregate supply curve.
■ Economic growth can be shown graphicallyas a rightward shift of a nation’s long-runaggregate supply curve or a rightward shiftof its production possibilities curve.
■ Short-run economic growth is usually meas-ured by changes in real gross domestic prod-uct or by changes in real GDP per capita.
■ The rate of economic growth is affected by avariety of aggregate supply and aggregatedemand factors.
■ Different economic theories are only onereason why economists disagree. Other rea-sons are different assumptions, different val-ues, different interpretations about economichistory and different ideas about policy lags.
5 Macroeconomics KEY IDEASUNIT


Advanced Placement Economics Macroeconomics: Student Activities © National Council on Economic Education, New York, N.Y. 239
5
Monetary and Fiscal Policy
Part ATools of Monetary and Fiscal PolicyBoth monetary and fiscal policy can be used to influence the inflation rate and real output. Indicatewhat effect each specific policy has on inflation and real output in the short run (nine to 18 months).
Figure 43.1
Monetary Policy Inflation Real Output
1. (A) Buy government securities
(B) Sell government securities
2. (A) Decrease the discount rate
(B) Increase the discount rate
3. (A) Decrease reserve requirement
(B) Increase reserve requirement
Fiscal Policy Inflation Real Output
4. (A) Increase government spending
(B) Decrease government spending
5. (A) Increase taxes
(B) Decrease taxes
Part BLags in Policy MakingAs the economic situation changes, policy makers must decide when to take action and which policyaction to take. Then they must implement the policy. The economy then responds to the policy. Theamount of time it takes policy makers to recognize and take action is called the inside lag. Theamount of time it takes the economy to respond to the policy changes is called the outside or impactlag. The inside lag is estimated to be short for monetary policy but long for fiscal policy. The insidelag is long for fiscal policy because the legislative branch must come to agreement about the appro-priate action. The outside lag, however, is long and variable for monetary policy but very short forfiscal policy.
6. Explain why the inside lag can be short for monetary policy but the outside lag is long and variable.
Macroeconomics LESSON 1 ■ ACTIVITY 43UNIT
Activity written by Rae Jean B. Goodman, U.S. Naval Academy, Annapolis, Md.
240 Advanced Placement Economics Macroeconomics: Student Activities © National Council on Economic Education, New York, N.Y.
57. Explain why the outside lag is short for fiscal policy.
8. Explain why lags are important to the discussion of stabilization policy.
MacroeconomicsLESSON 1 ■ ACTIVITY 43 (continued)
UNIT

Advanced Placement Economics Macroeconomics: Student Activities © National Council on Economic Education, New York, N.Y. 241
5
Crowding-Out: A Graphical RepresentationMonetary policy and fiscal policy do not exist in separate airtight compartments. Monetary policyand fiscal policy can reinforce or accommodate each other, or they can work at cross-purposes. Thisactivity assumes no changes in the foreign exchange rate, imports or exports.
For example, an expansionary fiscal policy will increase aggregate demand. The expansionary fiscalpolicy should also increase the demand for money. If the Fed does not increase the money supply,interest rates will rise. Because the government is borrowing money to finance its expansionary fiscalpolicy, consumers and businesses will be crowded-out of the financial markets. This could lower con-sumer and investment spending and slow down the economic expansion. On the other hand, if theFed increases the money supply, interest rates should not rise as much. Of course, increasing themoney supply will increase the price level further.
Part AUsing Aggregate Demand and Aggregate Supply Analysis
1. Assume fiscal policy is expansionary and monetary policy keeps the stock of money constant atMS. Shift one curve in each graph to illustrate the effect of the fiscal policy.
(A) Which curve did you shift in the short-run aggregate demand and aggregate supply graph?What happens as a result of this new curve?
(B) In the money market graph, which curve did you shift to demonstrate the effect of the fiscalpolicy? What happens as a result of this shift?
Macroeconomics LESSON 1 ■ ACTIVITY 44UNIT
Adapted from Phillip Saunders, Introduction to Macroeconomics: Student Workbook, 18th ed. (Bloomington, Ind., 1998). Copyright1998 Phillip Saunders. All rights reserved. Activity revised by Rae Jean B. Goodman, U.S. Naval Academy, Annapolis, Md.
Figure 44.1Crowding-Out Using Aggregate Demand and Aggregate Supply Analysis
REAL GDP QUANTITY OFMONEY
PR
ICE
LE
VE
L
NO
MIN
AL
INT
ER
ES
TR
ATE
SRAS
AD
MS
MD
i
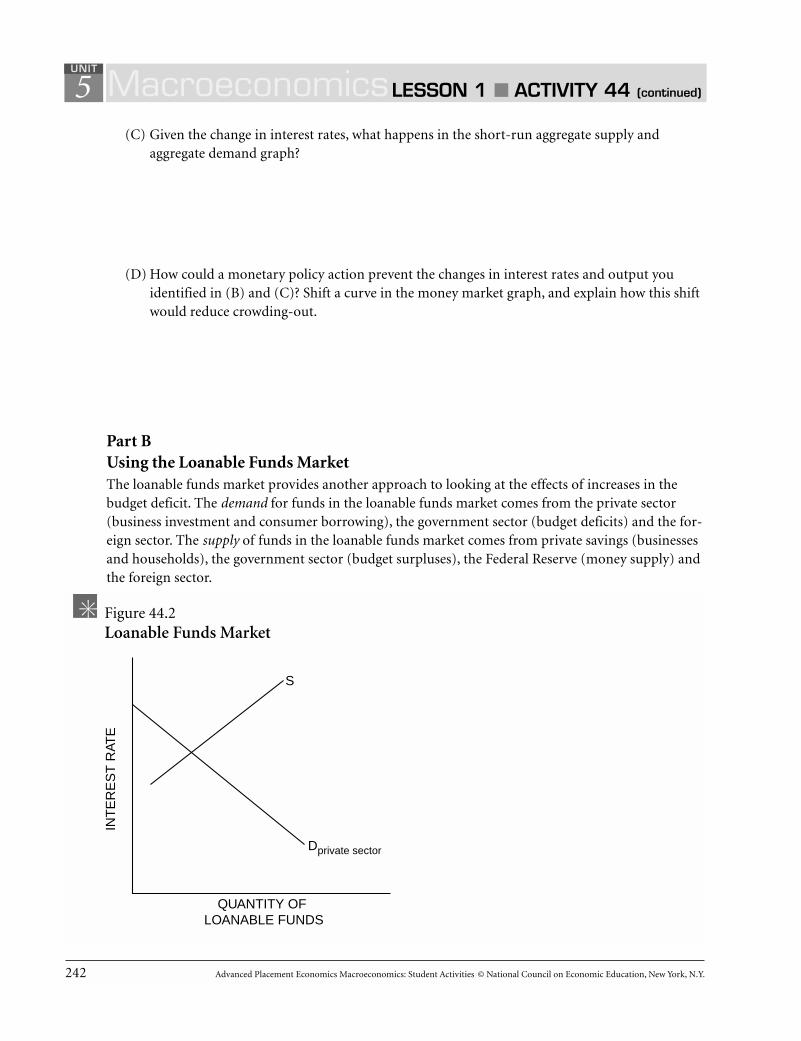
242 Advanced Placement Economics Macroeconomics: Student Activities © National Council on Economic Education, New York, N.Y.
5(C) Given the change in interest rates, what happens in the short-run aggregate supply and
aggregate demand graph?
(D) How could a monetary policy action prevent the changes in interest rates and output youidentified in (B) and (C)? Shift a curve in the money market graph, and explain how this shiftwould reduce crowding-out.
Part BUsing the Loanable Funds MarketThe loanable funds market provides another approach to looking at the effects of increases in thebudget deficit. The demand for funds in the loanable funds market comes from the private sector(business investment and consumer borrowing), the government sector (budget deficits) and the for-eign sector. The supply of funds in the loanable funds market comes from private savings (businessesand households), the government sector (budget surpluses), the Federal Reserve (money supply) andthe foreign sector.
MacroeconomicsLESSON 1 ■ ACTIVITY 44 (continued)
UNIT
Figure 44.2Loanable Funds Market
QUANTITY OF LOANABLE FUNDS
INT
ER
ES
T R
ATE
S
Dprivate sector
Advanced Placement Economics Macroeconomics: Student Activities © National Council on Economic Education, New York, N.Y. 243
52. Shift one of the curves on Figure 44.2 to indicate what occurs in the loanable funds market if
government spending increases without any increases in tax revenue or the money supply.
(A) What happens to the interest rate as a result of this expansionary fiscal policy? Explain.
(B) Indicate on the graph the new quantity of private demand for loanable funds.
(C) An accommodating monetary policy could prevent the effects you described in (A) and (B).Shift a curve in the diagram to show how the accommodating monetary policy wouldcounteract the effects of crowding-out. Explain what would happen to interest rates and thelevel of private demand for loanable funds as a result of this new curve.
Part CApplications3. Indicate whether you agree (A), disagree (D) or are uncertain (U) about the truth of the following
statement and explain your reasoning. “Exhaustion of excess bank reserves inevitably puts a ceil-ing on every business boom because without money the boom cannot continue.”
MacroeconomicsLESSON 1 ■ ACTIVITY 44 (continued)
UNIT
244 Advanced Placement Economics Macroeconomics: Student Activities © National Council on Economic Education, New York, N.Y.
5Answer the questions that follow each of the scenarios below.
4. The Federal Reserve Open Market Committee wishes to accommodate or reinforce acontractionary fiscal policy.
(A) Would the Fed buy bonds, sell bonds or neither?
(B) What effect would this policy have on bond prices and interest rates?
(C) What effect would this policy have on bank reserves and the money supply?
(D) What effect would this policy have on the quantity of loanable funds demanded by the privatesector?
(E) What effect would the change in interest rates you identified in (B) have on aggregate demand?
5. The Federal Reserve Open Market Committee wishes to accommodate or reinforce an expansion-ary fiscal policy.
(A) Would the Fed buy bonds, sell bonds or neither?
(B) What effect would this policy have on bond prices and interest rates?
(C) What effect would this policy have on bank reserves and the money supply?
(D) What effect would this policy have on the quantity of loanable funds demanded by the privatesector?
(E) What effect would the change in interest rates you identified in (B) have on aggregate demand?
MacroeconomicsLESSON 1 ■ ACTIVITY 44 (continued)
UNIT

Advanced Placement Economics Macroeconomics: Student Activities © National Council on Economic Education, New York, N.Y. 245
5
Graphing Monetary and Fiscal Policy InteractionsIllustrate the short-run effects for each monetary and fiscal policy combination using aggregate demandand supply curves, the money market and the loanable funds market. Once again, assume that there are
no changes in the foreign sector. Circle the appropriate symbols ( for increase, for decrease, and ?for uncertain), and explain the effect of the policies on real GDP, the price level, unemployment, interestrates and investment.
1. The unemployment rate is 10 percent, and the CPI is increasing at a 2 percent rate. The federalgovernment cuts personal income taxes and increases its spending. The Fed buys bonds on theopen market.
(A) Real GDP ? Explain.
(B) The price level ? Explain.
(C) Unemployment ? Explain.
➞
➞
➞
➞
➞
➞
➞
➞
Macroeconomics LESSON 2 ■ ACTIVITY 45UNIT
Activity written by John Morton, National Council on Economic Education, New York, N.Y., with modifications by Rae Jean B.Goodman, U.S. Naval Academy, Annapolis, Md.
Figure 45.1Expansionary Monetary and Fiscal Policy
REAL GDP
PR
ICE
LE
VE
L
QUANTITY OFLOANABLE FUNDS
INT
ER
ES
T R
ATE
QUANTITY OF MONEY
INT
ER
ES
T R
ATE

246 Advanced Placement Economics Macroeconomics: Student Activities © National Council on Economic Education, New York, N.Y.
5
(D) Interest rates ? Explain.
(E) Investment ? Explain.
2. The unemployment rate is 6 percent, and the CPI is increasing at a 9 percent rate. The federalgovernment raises personal income taxes and cuts spending. The Federal Reserve sells bonds onthe open market.
(A) Real GDP ? Explain.
(B) The price level ? Explain.
➞
➞
➞
➞
➞
➞
➞
➞
MacroeconomicsLESSON 2 ■ ACTIVITY 45 (continued)
UNIT
Figure 45.2Contractionary Monetary and Fiscal Policy
REAL GDP
PR
ICE
LE
VE
L
QUANTITY OFLOANABLE FUNDS
INT
ER
ES
T R
ATE
QUANTITY OF MONEY
INT
ER
ES
T R
ATE

Advanced Placement Economics Macroeconomics: Student Activities © National Council on Economic Education, New York, N.Y. 247
5
(C) Unemployment ? Explain.
(D) Interest rates ? Explain..
(E) Investment ? Explain.
3. The unemployment rate is 6 percent, and the CPI is increasing at a 5 percent rate. The federalgovernment cuts personal-income taxes and maintains current spending. The Fed sells bonds onthe open market.
(A) Real GDP ? Explain.
➞
➞
➞
➞
➞
➞
➞
➞
MacroeconomicsLESSON 2 ■ ACTIVITY 45 (continued)
UNIT
Figure 45.3Contractionary Monetary Policy and Expansionary Fiscal Policy
REAL GDP
PR
ICE
LE
VE
L
QUANTITY OFLOANABLE FUNDS
INT
ER
ES
T R
ATE
QUANTITY OF MONEY
INT
ER
ES
T R
ATE

248 Advanced Placement Economics Macroeconomics: Student Activities © National Council on Economic Education, New York, N.Y.
5
(B) The price level ? Explain.
(C) Unemployment ? Explain.
(D) Interest rates ? Explain.
(E) Investment ? Explain.
➞
➞
➞
➞
➞
➞
➞
➞
MacroeconomicsLESSON 2 ■ ACTIVITY 45 (continued)
UNIT
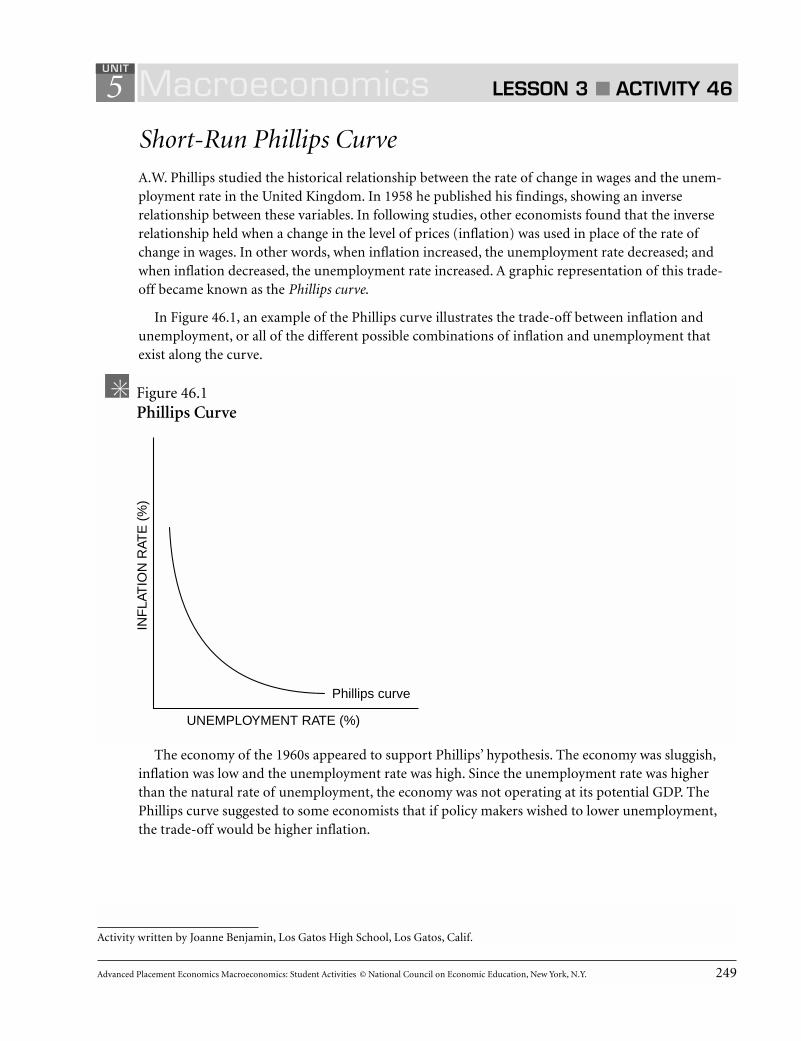
Advanced Placement Economics Macroeconomics: Student Activities © National Council on Economic Education, New York, N.Y. 249
5
Short-Run Phillips CurveA.W. Phillips studied the historical relationship between the rate of change in wages and the unem-ployment rate in the United Kingdom. In 1958 he published his findings, showing an inverserelationship between these variables. In following studies, other economists found that the inverserelationship held when a change in the level of prices (inflation) was used in place of the rate ofchange in wages. In other words, when inflation increased, the unemployment rate decreased; andwhen inflation decreased, the unemployment rate increased. A graphic representation of this trade-off became known as the Phillips curve.
In Figure 46.1, an example of the Phillips curve illustrates the trade-off between inflation andunemployment, or all of the different possible combinations of inflation and unemployment thatexist along the curve.
The economy of the 1960s appeared to support Phillips’ hypothesis. The economy was sluggish,inflation was low and the unemployment rate was high. Since the unemployment rate was higherthan the natural rate of unemployment, the economy was not operating at its potential GDP. ThePhillips curve suggested to some economists that if policy makers wished to lower unemployment,the trade-off would be higher inflation.
Macroeconomics LESSON 3 ■ ACTIVITY 46UNIT
Activity written by Joanne Benjamin, Los Gatos High School, Los Gatos, Calif.
Figure 46.1Phillips Curve
Phillips curve
UNEMPLOYMENT RATE (%)
INF
LAT
ION
RAT
E (
%)
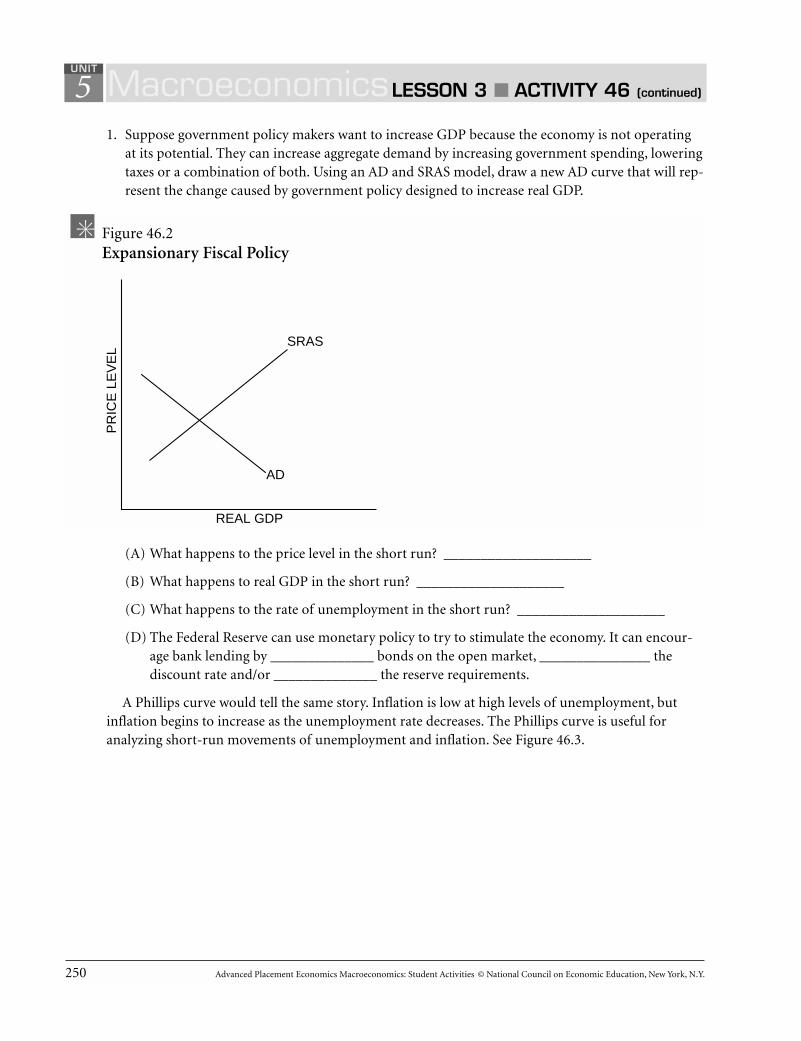
250 Advanced Placement Economics Macroeconomics: Student Activities © National Council on Economic Education, New York, N.Y.
51. Suppose government policy makers want to increase GDP because the economy is not operating
at its potential. They can increase aggregate demand by increasing government spending, loweringtaxes or a combination of both. Using an AD and SRAS model, draw a new AD curve that will rep-resent the change caused by government policy designed to increase real GDP.
(A) What happens to the price level in the short run? ____________________
(B) What happens to real GDP in the short run? ____________________
(C) What happens to the rate of unemployment in the short run? ____________________
(D) The Federal Reserve can use monetary policy to try to stimulate the economy. It can encour-age bank lending by ______________ bonds on the open market, _______________ thediscount rate and/or ______________ the reserve requirements.
A Phillips curve would tell the same story. Inflation is low at high levels of unemployment, butinflation begins to increase as the unemployment rate decreases. The Phillips curve is useful foranalyzing short-run movements of unemployment and inflation. See Figure 46.3.
MacroeconomicsLESSON 3 ■ ACTIVITY 46 (continued)
UNIT
Figure 46.2Expansionary Fiscal Policy
REAL GDP
PR
ICE
LE
VE
L
SRAS
AD
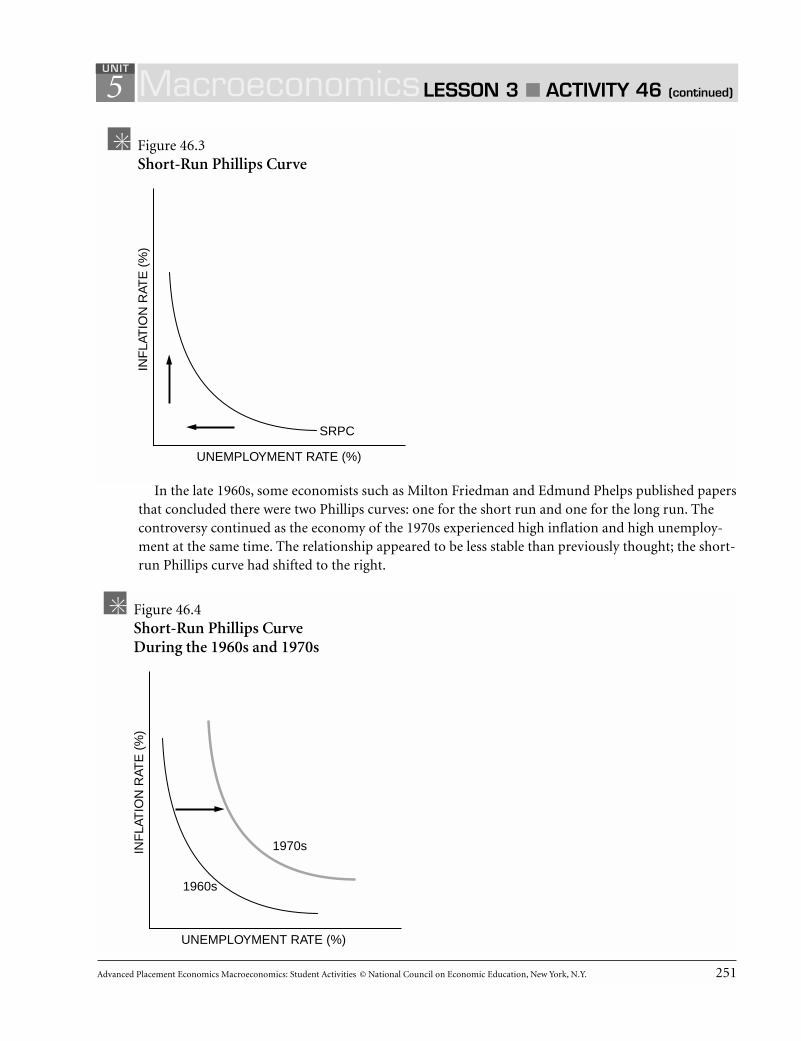
Advanced Placement Economics Macroeconomics: Student Activities © National Council on Economic Education, New York, N.Y. 251
5
In the late 1960s, some economists such as Milton Friedman and Edmund Phelps published papersthat concluded there were two Phillips curves: one for the short run and one for the long run. Thecontroversy continued as the economy of the 1970s experienced high inflation and high unemploy-ment at the same time. The relationship appeared to be less stable than previously thought; the short-run Phillips curve had shifted to the right.
MacroeconomicsLESSON 3 ■ ACTIVITY 46 (continued)
UNIT
Figure 46.3Short-Run Phillips Curve
SRPC
UNEMPLOYMENT RATE (%)
INF
LAT
ION
RAT
E (
%)
Figure 46.4Short-Run Phillips Curve During the 1960s and 1970s
1960s
1970s
UNEMPLOYMENT RATE (%)
INF
LAT
ION
RAT
E (
%)

252 Advanced Placement Economics Macroeconomics: Student Activities © National Council on Economic Education, New York, N.Y.
52. Aggregate supply shocks resulting from the oil embargo imposed by Middle Eastern countries
(OPEC) and worldwide crop failures helped to bring about higher inflation and higher unemploy-ment rates. The economy, with rising prices and decreased output, was in a state of stagflation.Using an AD and SRAS model, draw a new SRAS curve that will represent the change caused bythe OPEC oil embargo.
(A) In the short run, based on the new SRAS,
(i) what happens to the price level? ____________________
(ii) what happens to real GDP? ____________________
(iii) what happens to the rate of unemployment? ____________________
(B) As the economy moves to the long run,
(i) what happens to the wage rate?
(ii) what happens to the price level?
(iii) what happens to real GDP?
(iv) what happens to the rate of unemployment?
MacroeconomicsLESSON 3 ■ ACTIVITY 46 (continued)
UNIT
Figure 46.5Effects of Oil Embargo
PR
ICE
LE
VE
L
REAL GDP
LRAS
SRAS
AD
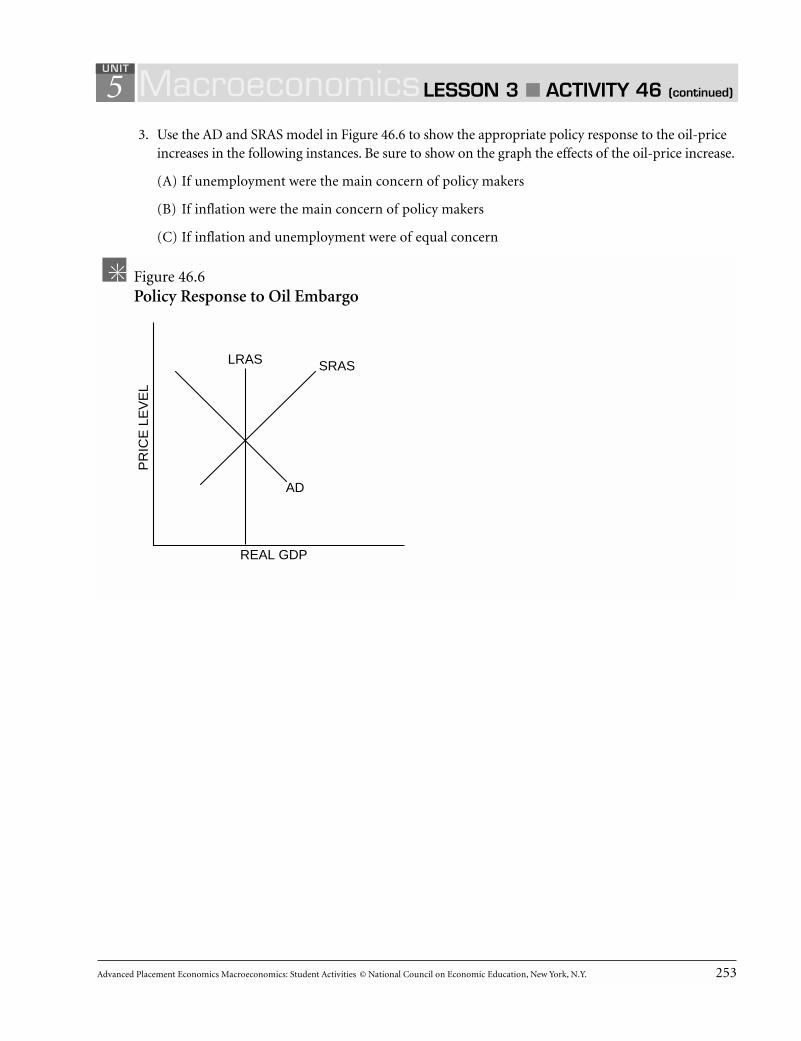
Advanced Placement Economics Macroeconomics: Student Activities © National Council on Economic Education, New York, N.Y. 253
53. Use the AD and SRAS model in Figure 46.6 to show the appropriate policy response to the oil-price
increases in the following instances. Be sure to show on the graph the effects of the oil-price increase.
(A) If unemployment were the main concern of policy makers
(B) If inflation were the main concern of policy makers
(C) If inflation and unemployment were of equal concern
MacroeconomicsLESSON 3 ■ ACTIVITY 46 (continued)
UNIT
Figure 46.6Policy Response to Oil Embargo
PR
ICE
LE
VE
L
REAL GDP
LRAS SRAS
AD
254 Advanced Placement Economics Macroeconomics: Student Activities © National Council on Economic Education, New York, N.Y.
54. As inflation in the 1970s continued to increase, economists argued that, for a reduction in money
growth to be fully effective in lowering inflation, the Federal Reserve would need to convince peo-ple it was serious about reducing money growth — in other words, the Fed would stick with alower money growth policy until inflation decreased. Why would it be important for the Fed toestablish this credibility?
5. In 1980, the unemployment rate was no lower than it had been in 1960, but inflation was muchhigher. Between 1980 and 1982, the economy experienced a recession and unemployment rose.Explain the general effect of a recession on unemployment and inflation. Then explain why therecession of 1980-82 was accompanied by high inflation.
6. Eventually the OPEC cartel was weakened, and energy prices decreased. Several U.S. industries,including communications and transportation, were deregulated. This caused greatercompetition. Explain and illustrate the effects of a weakened oil cartel and deregulation using boththe aggregate demand and aggregate supply model and the Phillips curve.
MacroeconomicsLESSON 3 ■ ACTIVITY 46 (continued)
UNIT
Advanced Placement Economics Macroeconomics: Student Activities © National Council on Economic Education, New York, N.Y. 255
5
Economic Growth and the Determinants ofProductive CapacityThe limit of an economy’s ability to produce real goods and services is set by the quantity and qualityof its basic productive resources and technology. At any given moment, an economy’s total productivecapacity may be fixed, but over time an economy can increase (or decrease) its capacity to producereal goods and services by increasing (or decreasing) the quantity and/or the quality of its productiveresources.
An economy’s productive resources can be classified in several different ways. Some of ourresources are physical or tangible: things that we can see, count, weigh or measure. Other resourcesthat are useful in the production process are intangible. Intangible resources are more difficult toidentify and measure, but no less important than tangible resources.
At any given time, an economy’s productive capacity is determined by the quantity and quality of its
■ Human Resources: labor resources, but not all labor is equal. Different people have differentskills, based on their investment in human capital. Human capital (education and skill level)and entrepreneurship are difficult to measure.
■ Natural Resources: the gifts of nature that are useful in producing goods and services. Thereare fixed, exhaustible and renewable natural resources.
■ Capital Goods: the plant, equipment and machinery needed to make other goods and services
■ Technological Progress: when production becomes more efficient, producing more outputwithout using any more inputs: additional capital or labor
■ Public Policy: the basic social, economic, legal and political values and institutions supported bya society that either aid or hinder efficient markets and the production of goods and services
In practice, economic growth is usually measured by changes in real GDP or, better still, changes inreal GDP per capita: gross domestic product per person adjusted for changes in prices. The rate ofeconomic growth is the average annual percentage change in real GDP per capita. Economists usereal GDP per capita to measure living standards across time and between countries.
To summarize, economic growth occurs because an economy experiences technical progress,increased investments in physical capital and increased investments in human capital. In the mostfundamental sense, economic growth is concerned with increasing an economy’s total productivecapacity at full employment.
Macroeconomics LESSON 4 ■ ACTIVITY 47UNIT
Adapted from Phillip Saunders, Introduction to Macroeconomics: Student Workbook, 18th ed. (Bloomington, Ind., 1998). Copyright1998 Phillip Saunders. All rights reserved. Activity revised by Elaine McBeth, College of William and Mary, Williamsburg, Va.

256 Advanced Placement Economics Macroeconomics: Student Activities © National Council on Economic Education, New York, N.Y.
5Part AMeasuring Economic Growth in Hamilton County and Jefferson County
Figure 47.1
Hamilton Hamilton Jefferson JeffersonYear Real GDP Population Real GDP Population
1 $2.1 billion 70,000 $500,000 15
2 2.5 billion 80,000 525,000 16
3 2.8 billion 90,000 600,000 17
4 2.7 billion 86,000 650,000 18
1. Using Figure 47.1 as a reference, fill out the tables in Figures 47.2, 47.3 and 47.4.
Figure 47.2
Hamilton JeffersonTime period % Change in Real GDP % Change in Real GDP
From Year 1 to Year 2
From Year 2 to Year 3
From Year 3 to Year 4
Figure 47.3
Hamilton JeffersonYear Per Capita Real GDP Per Capita Real GDP
1
2
3
4
Figure 47.4
Hamilton JeffersonTime period % Change in Per Capita Real GDP % Change in Per Capita Real GDP
From Year 1 to Year 2
From Year 2 to Year 3
From Year 3 to Year 4
MacroeconomicsLESSON 4 ■ ACTIVITY 47 (continued)
UNIT

Advanced Placement Economics Macroeconomics: Student Activities © National Council on Economic Education, New York, N.Y. 257
52. When did Hamilton County experience the largest growth in real GDP? ____________________
In per capita real GDP? _____________________
Are these growth rates different? Explain.
3. When did Jefferson County experience the largest growth in real GDP? _____________________
In per capita real GDP? _____________________
Are these growth rates different? Explain.
4. The residents of Hamilton County believe they live in a wealthier community than small ruralJefferson County. Based on these numbers, do they? Explain.
MacroeconomicsLESSON 4 ■ ACTIVITY 47 (continued)
UNIT

258 Advanced Placement Economics Macroeconomics: Student Activities © National Council on Economic Education, New York, N.Y.
5Part BAnalyzing the Reasons for Economic GrowthEconomic growth can be illustrated by a rightward shift of the long-run aggregate supply curve or ashift outward of the production possibilities curve of consumption goods vs. capital goods.
5. Draw a graph that includes AD, SRAS and LRAS and then draw a graph of a PPC.
(A) On each graph you drew, show the effect of an increased investment in education that makesthe work force more productive. Explain your reasoning.
(B) Of the five factors that affect economic growth, which factor is increased by this investment ineducation?
MacroeconomicsLESSON 4 ■ ACTIVITY 47 (continued)
UNIT
Figure 47.5Relationship Between LRAS and PPC: Increased Investment in Education
REAL GDP
PR
ICE
LE
VE
L
CONSUMPTIONGOODS
CA
PIT
AL
GO
OD
S

Advanced Placement Economics Macroeconomics: Student Activities © National Council on Economic Education, New York, N.Y. 259
56. Explain how fewer government regulations will affect economic growth. Cite an example to support
your explanation. Show the effect of fewer government regulations on the graphs in Figure 47.6.
7. Briefly explain how the following policies will affect economic growth and why.
(A) Higher taxes on businesses
MacroeconomicsLESSON 4 ■ ACTIVITY 47 (continued)
UNIT
Figure 47.6Relationship Between LRAS and PPC: Fewer Government Regulations
REAL GDP
PR
ICE
LE
VE
L
CONSUMPTIONGOODS
CA
PIT
AL
GO
OD
S

260 Advanced Placement Economics Macroeconomics: Student Activities © National Council on Economic Education, New York, N.Y.
5(B) Improvements in technology
(C) Less savings by people who want to enjoy the good life
(D) Higher productivity of labor because of improved management styles
(E) Lower interest rates
MacroeconomicsLESSON 4 ■ ACTIVITY 47 (continued)
UNIT

Advanced Placement Economics Macroeconomics: Student Activities © National Council on Economic Education, New York, N.Y. 261
5
Why Economists Disagree
Part AUnderstanding the Reasons Why Economists DisagreeIt is not unusual to find “experts” disagreeing with each other. Experts disagree about all sorts ofmatters: nuclear power, environmental protection and who will win the Super Bowl. Why do expertsdisagree? How can the average person make sense out of the differing viewpoints and recommenda-tions? Here are several important factors that often lead economists to different conclusions.
■ Different Time PeriodsOne economist might state that the current policy of the government will lead to inflation. Anothermight disagree. Both could be right if they are talking about the effects of the policy on inflation atdifferent times — for example, six months from now compared with two years from now.
■ Different AssumptionsBecause an economy is a complex system, it is often hard to predict the effects of a particular policyor event. Therefore, to be able to make predictions, economists usually must make certain assump-tions. But economists often differ in their assumptions. For example, one economist might assumethat the federal budget deficit will become larger next year. Another might not. These differentassumptions could be the result of their assumptions about economic growth, tax revenue andgovernment spending.
■ Different Economic TheoriesEconomists agree on many matters such as, “If the price of beef goes up and nothing else changes,people will buy less beef.” This is a prediction with which nearly all economists would agree because itrests on the generally accepted law of demand. However, economists have yet to settle a number ofimportant questions, especially those concerning macroeconomics. Macroeconomics deals with thebehavior of the economy as a whole or large subdivisions of it, and how to influence this behavior.Economists have several different theories or explanations about what influences macroeconomicbehavior. Until these theories are reconciled or until one of them is widely agreed on as best, econo-mists will disagree on macroeconomic questions because the economists are using different theories.The same applies to certain microeconomic questions.
■ Different ValuesEconomics is concerned with explaining what is happening in the economy. It is also concerned withpredictions. The economist should be able to say to the president or to Congress, “If you follow PolicyOne, then X, Y and Z will happen. If you follow Policy Two, then Q, R and S will happen. Pick thepolicy that gives the results you like better.” In practice, such statements by economists often containmore than just analysis and a prediction about results. Their statements often recommend policiesthey like because the results agree with their own values — in other words, the results they prefer. For
Macroeconomics LESSON 5 ■ ACTIVITY 48UNIT
From Master Curriculum Guide in Economics: Teaching Strategies for High School Economics Courses (New York: National Council onEconomic Education, 1985), p. 158. Modified by John Morton, National Council on Economic Education, New York, N.Y.
262 Advanced Placement Economics Macroeconomics: Student Activities © National Council on Economic Education, New York, N.Y.
5example, some economists will recommend Policy One because X, Y and Z will happen and theyfavor achieving X, Y and Z. Other economists will recommend Policy Two because they favor achiev-ing results Q, R and S. Such disagreements are basically about which outcomes the economists prefer.The economic policies they recommend are determined by their preferred outcomes.
Part BListening in on a Discussion of EconomistsFour distinguished professors of economics are discussing current economic policy at a luncheonpress conference attended by leading reporters of business news. Let’s listen in.
Professor T.X. Cut: Let’s separate issues. On the fiscal policy side, this administration’s budgetproposal is not extravagant or inflationary. The tax cuts are partly balanced by spending cuts. With somany people still unemployed and many factories still closed, a policy of this kind cannot rekindleinflation. The tax cuts will stimulate consumer spending, work effort and business investment in aneconomy just emerging from a recession. We must let people keep the fruits of their labor and sustainsavings as incentives to produce and invest more. The spending cuts will prevent government fromcontinuing to receive an ever-increasing piece of the nation’s economic pie.
Professor U.R. Nutts: Excuse me, Dr. Cut. But that position makes little sense. First of all, letme say that this administration’s tax cuts and spending cuts have been and are grossly unfair. The taxcuts have favored the rich, and the spending cuts have reduced programs that help maintain econom-ic security for Americans with low incomes. The present deficit — and the deficits projected for thefuture — are so large that they threaten our recovery from the recession. Here’s why: All deficits mustbe paid for by government borrowing, and because the government is borrowing so much money,there is less available for consumers and businesses. With government borrowing now threatening toincrease, interest rates will rise and this will reduce spending for houses and cars and, in fact, spend-ing on anything bought with a loan, as well as business investment that must be financed by borrow-ing. In other words, some important private borrowing will be crowded-out. Sometime next year, therecovery will therefore weaken, and we’ll move back into recession. Taxes should be raised, especiallyon the wealthy, and at least some government programs that help low-income people should berestored to the original funding levels.
Professor E.Z. Money: Let me just comment, U.R., on your point about federal spending andborrowing crowding-out private consumer spending and business investment. This is where mone-tary policy comes in. The Federal Reserve must continue to allow relatively free expansion of moneyand credit. If the Fed makes more money available, there will be less pressure for interest rates to rise.We’ll be able to sustain the recovery in housing, autos and other sectors. And businesses will be ableto get loans for investments at affordable interest rates. Continuing our economic growth by sustain-ing this recovery is the most important task we have before us. Increasing taxes now would onlyreduce total spending and thus threaten the recovery.
Professor Fred Critic: Excuse me, Dr. Money. You forget that the expansion of the moneysupply we’re currently witnessing is part of a long history of bungling by the monetary policy makers.Our most recent recession was brought on by the Fed’s jamming on the monetary brakes by anabrupt reduction in the increase of the money supply in order to bring inflation under control. They
MacroeconomicsLESSON 5 ■ ACTIVITY 48 (continued)
UNIT
Advanced Placement Economics Macroeconomics: Student Activities © National Council on Economic Education, New York, N.Y. 263
5overdid it, as they always do, and produced a recession. Now, they’re overdoing it in the other direc-tion: stepping on the monetary accelerator and increasing the money supply too rapidly. This willstimulate the economy all right, but in a year or two these actions will rekindle inflation. The Fedthen will again jam on the monetary brakes and produce yet another recession. Everyone knows this.Interest rates right now are higher than they should be because everyone expects more inflation later.Only moderate growth in the money supply can bring interest rates down in the long run. The onlyway to get back on a long-term, stable economic growth path is to reduce money growth to a steady,predictable, noninflationary level.
Ladies and gentlemen, that’s all the time we have. Let’s give our distinguished panel a round ofapplause.
Part CAnalyzing Disagreements Among EconomistsEconomists disagree for the following reasons:
■ Because they evaluate the impact of policy over different lengths of time.
■ Because they make different assumptions.
■ Because they have different theories about how the economy works.
■ Because they have different values and ideas about which economic goals are most important.
Now analyze each professor’s comments in Part B, using the format on the next two pages.
MacroeconomicsLESSON 5 ■ ACTIVITY 48 (continued)
UNIT

264 Advanced Placement Economics Macroeconomics: Student Activities © National Council on Economic Education, New York, N.Y.
5
Professor T.X. Cut
Major point:
Time period:
Assumptions:
Theoretical support:
Values:
Professor U.R. Nutts
Major point:
Time period:
Assumptions:
Theoretical support:
Values:
MacroeconomicsLESSON 5 ■ ACTIVITY 48 (continued)
UNIT

Advanced Placement Economics Macroeconomics: Student Activities © National Council on Economic Education, New York, N.Y. 265
5
Professor E.Z. Money
Major point:
Time period:
Assumptions:
Theoretical support:
Values:
Professor Fred Critic
Major point:
Time period:
Assumptions:
Theoretical support:
Values:
MacroeconomicsLESSON 5 ■ ACTIVITY 48 (continued)
UNIT

Advanced Placement Economics Macroeconomics: Student Activities © National Council on Economic Education, New York, N.Y. 267
Circle the letter of each correct answer.
1. Which of the following monetary and fiscal pol-icy combinations would definitely cause adecrease in aggregate demand in the short run?
Discount Government Open MarketRate Spending Operations
(A) Decrease Decrease Buy bonds
(B) Decrease Increase Buy bonds
(C) Decrease Increase Sell bonds
(D) Increase Decrease Sell bonds
(E) Increase Decrease Buy bonds
2. Which of the following monetary and fiscal pol-icy combinations would definitely cause anincrease in aggregate demand?
Reserve Government Requirements Taxes Spending
(A) Decrease Decrease Decrease
(B) Decrease Decrease Increase
(C) Increase Decrease Increase
(D) Increase Increase Decrease
(E) Increase Decrease Decrease
3. Assume that the economy has a low unemploy-ment rate and a high rate of inflation. Which ofthe following sets of monetary and fiscal poli-cies would be consistent and designed to reducethe rate of inflation?
Discount Government Open MarketRate Spending Operations
(A) Increase Increase Buy bonds
(B) Increase Increase Sell bonds
(C) Increase Decrease Sell bonds
(D) Increase Decrease Buy bonds
(E) Decrease Decrease Buy bonds
4. To counter the crowding-out effect on interestrates caused by the government’s deficit spend-ing, the Federal Reserve can
(A) cut tax rates.
(B) increase tax rates.
(C) increase the discount rate.
(D) increase the reserve requirement.
(E) buy bonds through open marketoperations.
5. Which of the following would best portraylong-run economic growth?
(A) A leftward shift of the aggregate demandcurve
(B) A rightward shift of the aggregate demandcurve
(C) A leftward shift of the production possibili-ties curve
(D) A leftward shift of the long-run aggregatesupply curve
(E) A rightward shift of the long-run aggregatesupply curve
6. An increase in which of the following would bemost likely to increase long-run economicgrowth?
(A) Taxes
(B) Interest rates
(C) Consumer spending
(D) Productivity
(E) Value of domestic currency
5 Macroeconomics SAMPLE QUESTIONS MULTIPLE-CHOICE
UNIT
Sample Multiple-Choice Questions

268 Advanced Placement Economics Macroeconomics: Student Activities © National Council on Economic Education, New York, N.Y.
7. An expansionary fiscal policy will result in anincrease in the interest rate unless which of thefollowing occurs?
(A) Taxes are cut instead of government expen-ditures being increased.
(B) The money supply is increased.
(C) Wage and price controls are imposed.
(D) The exchange rate is fixed.
(E) The Federal Reserve sells governmentbonds.
8. An expansionary monetary policy may promotelong-run growth if it leads to
(A) an increase in consumption.
(B) an increase in investment.
(C) an increase in government spending.
(D) a constant level of government spending.
(E) a decrease in net exports.
9. If the government increases spending without atax increase and simultaneously no monetary-policy changes are made, which of the followingwould most likely occur?
(A) Income would not rise at all because nonew money is available for increased con-sumer spending.
(B) The rise in income may be greater than themultiplier would predict because the higherinterest rates will stimulate investmentspending.
(C) The rise in income may be smaller than themultiplier would predict because the higherinterest rates will crowd-out private invest-ment spending.
(D) Income will go up by exactly the amount ofthe new government spending since thisacts as a direct injection to the incomestream.
(E) Income will not go up unless taxes are cutas well.
10. If Congress and the Federal Reserve bothwished to encourage growth of productivecapacity in an economy already close to fullemployment, it would be most appropriate to
(A) increase interest rates by buying bonds onthe open market.
(B) use a tight money policy to decrease gov-ernment spending.
(C) reduce taxes on consumption, increaseincome taxes and increase governmenttransfer payments.
(D) reduce interest rates by engaging in open-market operations and raise taxes on per-sonal income.
(E) increase capital gains taxes and decreasethe money supply.
11. “Sales of durable goods last month were surpris-ingly high. Recent price increases have pushedthe CPI to more than a 7 percent increase for thepast year. On average, the producer price indexhas gained 1 percent each month during the lastyear. Wage rates have increased throughout theeconomy, but productivity gains are minimal.The unemployment rate, however, is steady at 6 percent.” Which of the following changes in thetax rate, government spending and the federalfunds rate are most appropriate given the state ofthe economy?
Government FederalTax Rate Spending Funds Rate
(A) Increase Increase Increase
(B) Increase Decrease Increase
(C) Increase Decrease Decrease
(D) Decrease Increase Decrease
(E) Decrease Decrease Decrease
5 Macroeconomics SAMPLE QUESTIONS MULTIPLE-CHOICE
UNIT
(continued)

Advanced Placement Economics Macroeconomics: Student Activities © National Council on Economic Education, New York, N.Y. 269
12. When the unemployment rate is 10 percentand the CPI is rising at 2 percent, the federalgovernment cuts taxes and increases govern-ment spending. If the Federal Reserve buysbonds on the open market, interest rates,investment, real gross domestic product (GDP)and the price level are most likely to change inwhich of the following ways?
Interest Invest- Real PriceRates ment GDP Level
(A) Decrease Decrease Increase Increase
(B) Decrease Increase Increase Increase
(C) Increase Decrease Decrease Decrease
(D) Increase Decrease Increase Increase
(E) Increase Increase Increase Increase
13. When the unemployment rate is 4.5 percentand the CPI is rising at a 12 percent rate, thefederal government raises taxes and cuts gov-ernment spending. If the Federal Reserve sellsbonds on the open market, interest rates, in-vestment, real gross domestic product (GDP)and the price level are most likely to change inwhich of the following ways?
Interest Invest- Real PriceRates ment GDP Level
(A) Decrease Decrease Increase Increase
(B) Increase Decrease Increase Increase
(C) Increase Decrease Decrease Decrease
(D) Decrease Increase Increase Increase
(E) Decrease Decrease Increase Increase
14. The statement that “the cost of reducing therate of inflation is that people must lose theirjobs” indicates that the speaker believes in arelationship that is usually depicted by whichof the following?
(A) The short-run Phillips curve
(B) The liquidity trap
(C) The production function
(D) The quantity theory of money
(E) The spending multiplier
15. In the short run, combining an expansionaryfiscal policy with a tight money policy is mostlikely to cause
(A) real GDP to increase.
(B) real GDP to decrease.
(C) interest rates to fall.
(D) interest rates to rise.
(E) the federal budget deficit to decrease.
5 Macroeconomics SAMPLE QUESTIONS MULTIPLE-CHOICE
UNIT
(continued)

270 Advanced Placement Economics Macroeconomics: Student Activities © National Council on Economic Education, New York, N.Y.
Use the following graph to answer questions 16 and 17.
16. If the production possibilities curve of aneconomy shifts from AB to CD, it most likely iscaused by
(A) full employment of resources.
(B) technology advances.
(C) allocative efficiency.
(D) a decrease in the price level.
(E) productive efficiency.
17. If the production possibilities curve of aneconomy is CD and the economy is producingat Point X, which of the following is true?
(A) Technology advances changed industrialproduction.
(B) The quality and quantity of productiveresources increased.
(C) Improvements in productivity led toincreased output.
(D) Resources are not fully employed.
(E) Aggregate demand decreased.
18. The theory of rational expectations implieswhich of the following?
(A) Unemployment and the rate of inflationare directly related.
(B) An increase in the money supply will haveno effect on price level.
(C) Attempts to decrease unemploymentbelow the natural rate lead to depression.
(D) Attempts to decrease unemploymentthrough government policy will bethwarted by people’s reactions.
(E) Government policies work only if themoney supply increases by 10 percent.
19. The Phillips curve shows the relationshipbetween
(A) unemployment and economic growth.
(B) unemployment and full employment.
(C) inflation and unemployment.
(D) inflation and investment.
(E) inflation and real interest rates.
20. Which of the following explains why inflationcan increase?I. Increase in aggregate demandII. Decrease in aggregate supplyIII. Increase in rate of money supply growth
(A) I only
(B) II only
(C) III only
(D) I and II only
(E) I, II and III
5 Macroeconomics SAMPLE QUESTIONS MULTIPLE-CHOICE
UNIT
(continued)
D
ACONSUMER GOODS
CA
PIT
AL
GO
OD
S
C
B
X

Advanced Placement Economics Macroeconomics: Student Activities © National Council on Economic Education, New York, N.Y. 271
Sample Short Free-Response Questions1. Using monetary and fiscal policies, outline an expansionary policy that would encourage long-run
growth and explain why the policies will encourage this growth.
2. Some economists want to decrease government spending to reduce government budget deficits.Other economists want to reduce the size of the deficit by raising taxes. Compare these two points of view using aggregate supply and aggregate demand analysis. Illustrate the effects of each programusing a correctly labeled aggregate demand (AD) and short-run aggregate supply (SRAS) graph.
5 Macroeconomics SAMPLE QUESTIONS SHORT FREE-RESPONSE
UNIT
272 Advanced Placement Economics Macroeconomics: Student Activities © National Council on Economic Education, New York, N.Y.
3. Why is there a conflict between the Fed’s attempts to control both the money supply and the inter-est rate? What is the implication of the Fed’s attempt to control the money supply?
4. Discuss the trade-off between unemployment and inflation in the short run. Why does this trade-off pose a dilemma for policy makers? What trade-off exists between inflation and unemploymentin the long run?
5 Macroeconomics SAMPLE QUESTIONS SHORT FREE-RESPONSE
UNIT
(continued)

Advanced Placement Economics Macroeconomics: Student Activities © National Council on Economic Education, New York, N.Y. 273
5. As the national debt grows, one of the negative effects is crowding-out. Explain the meaning ofthis term. Identify two sectors of the economy that are involved in this crowding-out. Explain theactivities of these two sectors, and show how they interact to create the crowding-out effect. Use amoney market or loanable funds market graph to show crowding-out. Use an aggregate demandand aggregate supply graph to show the effects on the economy.
6. Explain the effects on long-term economic growth of using fiscal policy to fight recession andmonetary policy to fight inflation.
5 Macroeconomics SAMPLE QUESTIONS SHORT FREE-RESPONSE
UNIT
(continued)

274 Advanced Placement Economics Macroeconomics: Student Activities © National Council on Economic Education, New York, N.Y.
*7. Using the aggregate supply and aggregate demand model, explain how the use of monetary poli-cy to promote long-run economic growth will affect each of the following:
(A) Short-term interest rates
(B) The composition (mix) of aggregate expenditures
(C) Potential gross domestic product
5 Macroeconomics SAMPLE QUESTIONS SHORT FREE-RESPONSE
UNIT
(continued)
*Actual free-response question from a past AP test. Reprinted by permission of the College Entrance Examination Board, thecopyright owner. For limited use by NCEE.
Advanced Placement Economics Macroeconomics: Student Activities © National Council on Economic Education, New York, N.Y. 275
Sample Long Free-Response Questions
*1. Suppose that the following statements describe the current state of an economy:
■ The unemployment rate is 5 percent.
■ Inflation is at an annual rate of 10 percent.
■ The prime interest rate is 11.5 percent.
■ The annual growth rate of real gross domestic product is 5 percent.
(A) Identify the major problem(s) the economy faces.
(B) Describe two fiscal policy actions that could be used to alleviate the problem(s). Using theaggregate supply and aggregate demand model, explain how the actions you identified willaffect each of the following. Illustrate with a graph.
(i) Output and employment
(ii) The price level
(iii) Nominal interest rates
5 Macroeconomics SAMPLE QUESTIONS LONG FREE-RESPONSE
UNIT
*Actual free-response question from a past AP test. Reprinted by permission of the College Entrance Examination Board, thecopyright owner. For limited use by NCEE.

276 Advanced Placement Economics Macroeconomics: Student Activities © National Council on Economic Education, New York, N.Y.
(C) Instead of using fiscal policy to solve the country’s problem(s), use only monetary policy.Describe two monetary policy actions that could be used to alleviate the problem(s). Usingthe aggregate supply and aggregate demand model, explain how the actions you identifiedwould affect each of the following. Illustrate with a graph.
(i) Nominal interest rates
(ii) Output and employment
(iii) The price level
5 Macroeconomics SAMPLE QUESTIONS LONG FREE-RESPONSE
UNIT
(continued)

Advanced Placement Economics Macroeconomics: Student Activities © National Council on Economic Education, New York, N.Y. 277
*2. Suppose that the following conditions describe the current state of the U.S. economy:
■ The unemployment rate is 5 percent.
■ Inflation is 2 percent.
■ Real gross domestic product is growing at the rate of 3 percent.
(A) First, assume that the federal government increases its spending and increases taxes to main-tain a balanced budget. Using aggregate supply and aggregate demand analysis, explain theshort-run effects of these policies on each of the following:
(i) Output and employment
(ii) The price level
(iii) Interest rates
5 Macroeconomics SAMPLE QUESTIONS LONG FREE-RESPONSE
UNIT
(continued)
*Actual free-response question from a past AP test. Reprinted by permission of the College Entrance Examination Board, thecopyright owner. For limited use by NCEE.
278 Advanced Placement Economics Macroeconomics: Student Activities © National Council on Economic Education, New York, N.Y.
(B) Now assume instead that the Federal Reserve buys bonds on the open market. Analyze theimpact of this action on each of the following:
(i) Interest rates
(ii) Output and employment
(iii) The price level
(C) Using a graph, analyze the combined effect of the two policy actions described above on eachof the following:
(i) Output and employment
(ii) The price level
(iii) Interest rates
5 Macroeconomics SAMPLE QUESTIONS LONG FREE-RESPONSE
UNIT
(continued)
Advanced Placement Economics Macroeconomics: Student Activities © National Council on Economic Education, New York, N.Y. 279
3. Suppose that we have two countries: In Country A, the supply of loanable funds is relatively inter-est elastic; and in Country B, the supply of loanable funds is relatively interest inelastic. Assumethat both countries are at the same initial equilibrium interest rate and quantity of loanable funds.Suppose that each government implements an expansionary fiscal policy and finances the samesize deficit by issuing government securities.
(A) Draw the loanable funds market. Label Country A’s supply of loanable funds SA. Label CountryA’s new demand curve for loanable funds DA. Label Country B’s supply of loanable funds SB.Label Country B’s new demand for loanable funds DB. Show the impact of the deficit financing.
(B) If investment in Country A is relatively interest inelastic and investment in Country B is rela-tive interest elastic, explain the impact for each country on each of the following variables:
(i) Investment
(ii) Output
(iii) Price level
(C) Explain in which country crowding-out is greater.
5 Macroeconomics SAMPLE QUESTIONS LONG FREE-RESPONSE
UNIT
(continued)


Macroeconomics | Unit 6Macroeconomics | Unit 6
International Economics


Advanced Placement Economics Macroeconomics: Student Activities © National Council on Economic Education, New York, N.Y. 283
■ People and nations trade to improve theirstandard of living.
■ Because trade is the voluntary exchange ofgoods and services, the decision to trade willoccur only if both parties to the exchangeexpect to gain from it.
■ Voluntary trade promotes economicprogress because it allows people andnations to specialize in what they do best.
■ The law of comparative advantage explainswhy there are mutual gains from specializa-tion and trade. Through specialization andtrade, nations are able to get beyond, or out-side of, their production possibilities curve.
■ A nation has an absolute advantage overanother nation in the production of a goodwhen it can produce more of that goodusing the same amount of resources.
■ Comparative advantage occurs when anation can produce a good at a lower oppor-tunity cost than another nation. Relativecosts determine comparative advantage.
■ Every nation has a comparative advantage insome good or service.
■ Trade barriers such as tariffs and quotas limitthe potential gains from trade. These bar-riers generally protect domestic sellers at theexpense of domestic buyers. Trade barriersreduce efficiency in the allocation of scarceresources and slow economic progress.
■ The balance of payments is a broader meas-ure of international transactions than thebalance of trade. The balance of trade con-siders only a nation’s exports and imports of goods, while the balance of paymentsconsiders all international economic trans-actions including the current account, thecapital account and official reserves.
■ There are three accounts within the balanceof payments. The current account records anation’s exports and imports of goods, ser-vices, net investment income and net trans-fers. The capital account records the flows ofmoney from the purchase and sale of realand financial assets domestically and abroad.The official transactions account is an offset-ting account for government controls.
■ For the current and capital accounts, if for-eign currency is used to complete the inter-national transaction, the transaction is adebit (negative). If the transaction earns for-eign currency, it is a credit (positive).
■ To trade, nations must exchange currencies.An exchange rate is the price of one curren-cy in terms of another and is generally set bysupply and demand.
■ Appreciation is an increase in the value ofa nation’s currency in foreign-exchangemarkets. Appreciation of a nation’s cur-rency tends to reduce exports and increaseimports.
■ Depreciation is a decrease in the value ofa nation’s currency in foreign-exchangemarkets. Depreciation of a nation’s cur-rency tends to increase exports and reduceimports.
■ Monetary and fiscal policies can affectexchange rates, the international balance oftrade and the balance of payments.
■ Domestic economic policies affect inter-national trade, and international tradeaffects the domestic economy, influencingeconomic growth, unemployment and therate of inflation.
6 Macroeconomics KEY IDEASUNIT


Advanced Placement Economics Macroeconomics: Student Activities © National Council on Economic Education, New York, N.Y. 285
6
Determining Comparative AdvantageNations trade on the basis of comparative advantage, but how do we determine who has a compara-tive advantage? To do this, we need to calculate each country’s or person’s opportunity costs for bothactivities. The way we calculate opportunity cost depends crucially on how the productivity data areexpressed.
There are two ways to measure productivity: We can calculate output over a given period of time,or we can measure it by the amount of inputs (usually time) necessary to do an activity. Examples ofoutput are tons per acre, miles per gallon, words per minute, apples per tree and televisions producedper hour. Examples of input are number of hours to do a job, number of gallons of paint to paint ahouse, number of acres to feed a horse and number of pitches to throw a strike. We are going to workthrough two examples that measure productivity differently.
Part AProductivity Measures and Example Problems
Output MethodTons Produced per HourFish (A) Cheese (B)
Ted 60 25
Nancy 45 40
For Ted, the opportunity cost of producing fish in terms of cheese is 60 fish = 25 cheese; therefore 1 fish = ⁄ cheese. On the other hand, 1 cheese = ¹⁄ fish. Similarly we can calculate the opportunitycosts for Nancy. We summarize the opportunity cost information in the table below.
Opportunity Cost (B / A) Opportunity Cost (A / B)Fish Cheese
Ted 5/12 (0.42) cheese 12/5 (2.4) fish
Nancy 8/9 (0.89) cheese 9/8 (1.125) fish
Ted should produce fish because his opportunity cost in terms of cheese is less than Nancy’s oppor-tunity cost. Nancy should produce cheese because her opportunity cost in terms of fish is less thanTed’s opportunity cost to produce cheese. Ted producing fish and Nancy producing cheese yields themost fish and cheese per hour of any combination of production.
Macroeconomics LESSON 1 ■ ACTIVITY 49UNIT
Activity written by Jim Charkins, California State University, San Bernardino, Calif. Activity adapted by Jerry De Young, RiverbankHigh School, Riverbank, Calif., and Ike Brannon, Joint Economic Committee, U.S. Senate, Washington, D.C.

286 Advanced Placement Economics Macroeconomics: Student Activities © National Council on Economic Education, New York, N.Y.
6Input Method
Acres Required to Produce One BushelApples (A) Pears (B)
Tony 5 2
Chris 6 3
For the input method, the opportunity cost of producing one apple in terms of pears requires that weinitially convert the input (acres) into output. For Tony, 5 acres = 1 apple; therefore, 1 acre = ¹⁄ apple.Also 2 acres = 1 pear; therefore, 1 acre = ¹⁄ pear. Now you can use the same method as for the outputmethod: ¹⁄ apple = ¹⁄ pear; therefore 1 apple = ⁄ pear. Likewise 1 pear = ⁄ apple. We summarizethe opportunity costs in the following table.
Opportunity Cost (B / A) Opportunity Cost (A / B)Apples Pears
Tony 5/2 (2.5) pears 2/5 (0.40) apples
Chris 6/3 (2) pears 3/6 (0.50) apples
Tony has the comparative advantage in producing pears. To produce one bushel of pears, Tony mustgive up 0.40 bushels of apples, whereas Chris has to give up half (0.50) of a bushel of apples. Thus,the opportunity cost of a bushel of pears is lower for Tony than for Chris, and so Tony shouldproduce pears. Conversely, Chris should produce apples because he has the lower opportunity cost interms of forgone bushels of pears.
Part BPractice ProblemsFirst decide whether the problem is an output or input problem; underline output or input. Then inthe space below the table, calculate the opportunity cost of each product and indicate the productwith the lower opportunity cost for each person, firm or country. The first one is completed for you.
1. Anna and Barry can grow the following amounts of potatoes and cabbage with the same amountof labor. Type of problem: (output / input)
Potatoes Cabbage
Anna 100 200
Barry 120 150
For Anna, the opportunity cost of one potato is two cabbages; for Barry, the opportunity cost of onepotato is 1.25 cabbages. Barry has to give up fewer cabbages than does Anna to grow one potato. Thus,the opportunity cost of potatoes is lower for Barry than for Anna, so Barry should grow potatoes. Con-versely, to grow one cabbage, Anna must give up one-half potato and Barry must give up 0.80 potato.Thus, the opportunity cost of growing cabbages is lower for Anna than it is for Barry, so Anna shouldgrow cabbages.
MacroeconomicsLESSON 1 ■ ACTIVITY 49 (continued)
UNIT

Advanced Placement Economics Macroeconomics: Student Activities © National Council on Economic Education, New York, N.Y. 287
62. Number caught per day. Type of problem: (output / input)
Deer Antelope
Henry 4 6
John 24 12
3. Days to produce one unit of each. Type of problem: (output / input)
Cars Planes
XYZ Corp. 8 10
QKFX Corp. 15 12
4. Acres to produce 100 bushels. Type of problem: (output / input)
Corn Rice
India 9 3
China 8 2
MacroeconomicsLESSON 1 ■ ACTIVITY 49 (continued)
UNIT

288 Advanced Placement Economics Macroeconomics: Student Activities © National Council on Economic Education, New York, N.Y.
65. To produce the following from one ton of olives. Type of problem: (output / input)
Cans of Bottles ofOlives Olive Oil
Zaire 60 10
Colombia 24 8
6. Why should a person, firm or country produce the product that has the lower opportunity costand trade for the other product?
MacroeconomicsLESSON 1 ■ ACTIVITY 49 (continued)
UNIT

Advanced Placement Economics Macroeconomics: Student Activities © National Council on Economic Education, New York, N.Y. 289
6
Economic Efficiency and Gains from TradeThe following comparative advantage problems illustrate how two nations can trade even if one ismore efficient at producing both products. The country that is more efficient in the production of agood is the country that can produce the good with the least input. In other words, if the UnitedStates can produce a ton of oats in three hours and Scotland can produce a ton of oats in four hours,the United States is more efficient in the production of oats. In the language of economics, the UnitedStates would have an absolute advantage in the production of oats.
A nation has a comparative advantage in the good in which it has the lower opportunity cost. Thenation should specialize in the good for which it has the lower opportunity cost and trade for thegood for which the other country has the lower opportunity cost. A nation with an absolute advan-tage in the production of both goods will have a comparative advantage in the production of onlyone of these goods.
Terms of trade is the exchange rate between two commodities, for example, two bananas for 30grapes. The gains from trade are the additional amount of commodities a country has after specializa-tion and trade in comparison with the combination before specialization and trade. For example, acountry may gain five bananas relative to the total amount of bananas it had when producing onlywith its own resources.
Macroeconomics LESSON 1 ■ ACTIVITY 50UNIT
Activity written by John Morton, National Council on Economic Education, New York, N.Y.

290 Advanced Placement Economics Macroeconomics: Student Activities © National Council on Economic Education, New York, N.Y.
6Underline the correct words in parentheses and complete the questions.
1. The following table gives the number of hours it takes in the United States and Scotland, using thesame amount of resources, to produce a ton of oats or one bagpipe.
Oats Bagpipe
United States 3 hours 2 hours
Scotland 4 hours 5 hours
(A) (The United States / Scotland) has an absolute advantage in the production of oats.
(B) (The United States / Scotland) has an absolute advantage in the production of bagpipes.
(C) (The United States / Scotland) has a comparative advantage in the production of oats because
(D) (The United States / Scotland) has a comparative advantage in the production of bagpipesbecause
(E) Based only on the data above and comparative advantage considerations, the United Statesshould specialize in (oats / bagpipes).
(F) Based only on the data above and comparative advantage considerations, Scotland shouldspecialize in (oats / bagpipes).
(G) Why will both Scotland and the United States be better off if they specialize and trade?
(H) Suppose that Scotland and the United States agree to specialize according to comparativeadvantage and to the following terms of trade: 1 ton of oats for 1 bagpipe. In a productionperiod there are 60 hours, and before specialization Scotland produced 7.5 tons of oats and sixbagpipes. After specialization and trade with the United States, Scotland wants to maintainthe six bagpipes. How many tons of oats will it have? What are its gains from trade?
MacroeconomicsLESSON 1 ■ ACTIVITY 50 (continued)
UNIT

Advanced Placement Economics Macroeconomics: Student Activities © National Council on Economic Education, New York, N.Y. 291
62. The following table gives the number of hours it takes in the United States and Canada, using the
same amount of resources, to produce a ton of wheat or one bolt of cloth.
Wheat Cloth
United States 1 hour 2 hours
Canada 3 hours 4 hours
(A) (The United States / Canada) has an absolute advantage in the production of wheat.
(B) (The United States / Canada) has an absolute advantage in the production of cloth.
(C) (The United States / Canada) has a comparative advantage in the production of wheat because
(D) (The United States / Canada) has a comparative advantage in the production of cloth because
(E) Based only on the data above and comparative advantage considerations, the United Statesshould specialize in (wheat / cloth).
(F) Based only on the data above and comparative advantage considerations, Canada shouldspecialize in (wheat / cloth).
(G) Why will both Canada and the United States be better off if they specialize and trade?
(H) Suppose that Canada and the United States agree to specialize according to comparativeadvantage and to the following terms of trade: three tons of wheat for two bolts of cloth. In aproduction period, there are 60 hours; and before specialization, Canada produced nine tonsof wheat and 8.25 bolts of cloth. After specialization and trade with the United States, Canadawants to maintain the nine tons of wheat for each production period. How many bolts ofcloth will it have? What are its gains from trade?
MacroeconomicsLESSON 1 ■ ACTIVITY 50 (continued)
UNIT

292 Advanced Placement Economics Macroeconomics: Student Activities © National Council on Economic Education, New York, N.Y.
63. The following table gives the number of hours it takes in the United States and Japan, using the
same amount of resources, to produce one computer or one auto.
Computer Auto
United States 2 hours 5 hours
Japan 1 hour 4 hours
(A) (The United States / Japan) has an absolute advantage in the production of computers.
(B) (The United States / Japan) has an absolute advantage in the production of autos.
(C) (The United States / Japan) has a comparative advantage in the production of computersbecause
(D) (The United States / Japan) has a comparative advantage in the production of autos because
(E) Based only on the data above and comparative advantage considerations, the United Statesshould specialize in (computers / autos).
(F) Based only on the data above and comparative advantage considerations, Japan should spe-cialize in (computers/autos).
(G) Why will both Japan and the United States be better off if they specialize and trade?
(H) Suppose that Japan and the United States agree to specialize according to comparative advan-tage and to the following terms of trade: three computers for one auto. In a production periodthere are 60 hours; and before specialization, Japan produced 40 computers and five autos.After specialization and trade with the United States, Japan wants to maintain the five autosfor each production period. How many computers will it have? What are its gains from trade?
MacroeconomicsLESSON 1 ■ ACTIVITY 50 (continued)
UNIT

Advanced Placement Economics Macroeconomics: Student Activities © National Council on Economic Education, New York, N.Y. 293
6
Barriers to TradeThe free trade movement started about 200 years ago. Previously, it appears that one of the goals ofgovernments was to stifle international trade, presumably for the benefit of their own economies.Over the last 50 years, there have been efforts to reduce trade barriers, with significant success duringthe 1990s. Examples of these efforts include the North American Free Trade Agreement (NAFTA), theWorld Trade Organization (WTO), the European Union (EU) and the Asia-Pacific Economic Coop-eration (APEC) forum.
We want to be able to investigate the economic effects of various barriers to trade that a nationmight impose to protect domestic industries. In Figure 51.1, the demand curve represents thedemand by the domestic economy for a commodity that is produced domestically and also imported.The domestic supply curve indicates what the domestic suppliers are willing and able to produce atalternative prices. If there were no international trade or a complete ban on imports, the equilibriumprice would be P, and the equilibrium quantity, Q, would be produced only by domestic firms.
If there is free international trade, the Total Supply curve represents the production by domesticand foreign producers. Domestic consumers would pay P1 and consume Q1: They are able toconsume more of the commodity at a lower price. Also, at P1, domestic firms are producing Q2 andforeign producers are producing (Q1 – Q2). Thus, domestic firms are producing less under free tradethan they would if the nation did not import the commodity.
Macroeconomics LESSON 2 ■ ACTIVITY 51UNIT
Activity written by Rae Jean B. Goodman, U.S. Naval Academy, Annapolis, Md.
Q1Q2
P1
P
Q
DomesticDemand
DomesticSupply
Total Supply
QUANTITY
PR
ICE
Figure 51.1International Trade
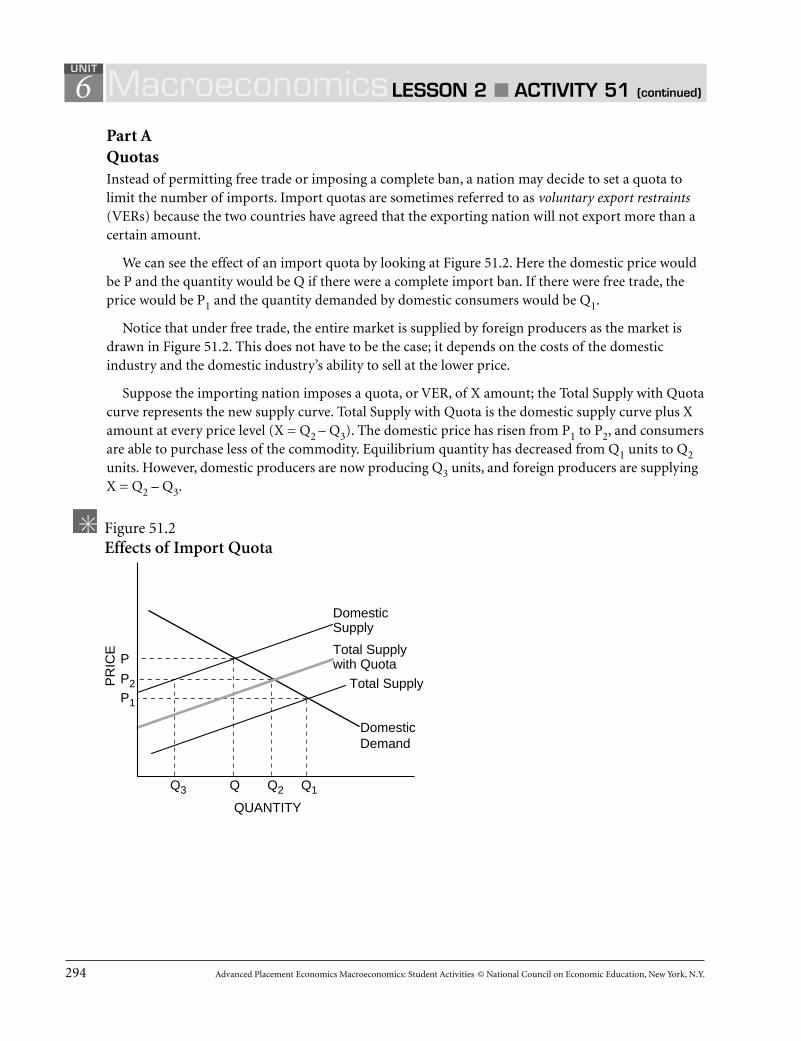
294 Advanced Placement Economics Macroeconomics: Student Activities © National Council on Economic Education, New York, N.Y.
6Part AQuotasInstead of permitting free trade or imposing a complete ban, a nation may decide to set a quota tolimit the number of imports. Import quotas are sometimes referred to as voluntary export restraints(VERs) because the two countries have agreed that the exporting nation will not export more than acertain amount.
We can see the effect of an import quota by looking at Figure 51.2. Here the domestic price wouldbe P and the quantity would be Q if there were a complete import ban. If there were free trade, theprice would be P1 and the quantity demanded by domestic consumers would be Q1.
Notice that under free trade, the entire market is supplied by foreign producers as the market isdrawn in Figure 51.2. This does not have to be the case; it depends on the costs of the domesticindustry and the domestic industry’s ability to sell at the lower price.
Suppose the importing nation imposes a quota, or VER, of X amount; the Total Supply with Quotacurve represents the new supply curve. Total Supply with Quota is the domestic supply curve plus Xamount at every price level (X = Q2 – Q3). The domestic price has risen from P1 to P2, and consumersare able to purchase less of the commodity. Equilibrium quantity has decreased from Q1 units to Q2units. However, domestic producers are now producing Q3 units, and foreign producers are supplyingX = Q2 – Q3.
MacroeconomicsLESSON 2 ■ ACTIVITY 51 (continued)
UNIT
Q1Q2Q3
P1
P2
P
Q
DomesticDemand
DomesticSupply
Total Supply
Total Supplywith Quota
QUANTITY
PR
ICE
Figure 51.2Effects of Import Quota
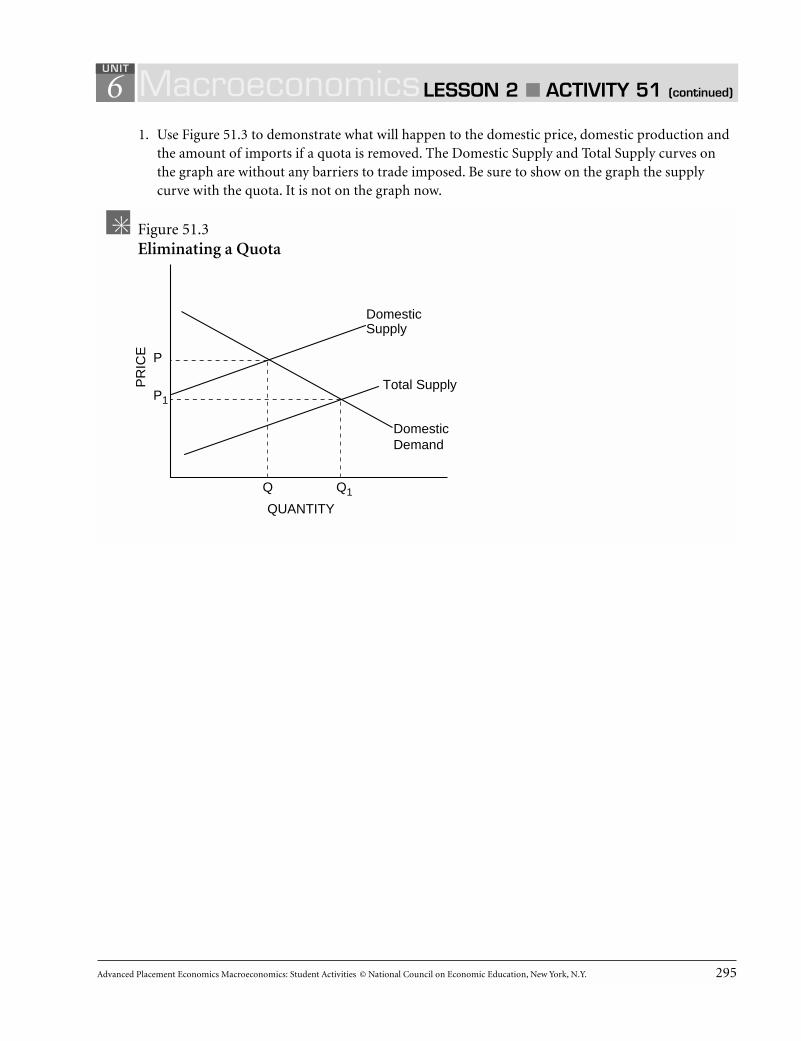
Advanced Placement Economics Macroeconomics: Student Activities © National Council on Economic Education, New York, N.Y. 295
61. Use Figure 51.3 to demonstrate what will happen to the domestic price, domestic production and
the amount of imports if a quota is removed. The Domestic Supply and Total Supply curves onthe graph are without any barriers to trade imposed. Be sure to show on the graph the supplycurve with the quota. It is not on the graph now.
MacroeconomicsLESSON 2 ■ ACTIVITY 51 (continued)
UNIT
DomesticDemand
DomesticSupply
Total Supply
QUANTITY
PR
ICE
Figure 51.3Eliminating a Quota
Q1
P1
P
Q

296 Advanced Placement Economics Macroeconomics: Student Activities © National Council on Economic Education, New York, N.Y.
62. Write a paragraph summarizing the advantages and disadvantages of a quota to the domestic
economy. Be sure to discuss the impact on domestic consumers, domestic producers and foreignproducers.
3. If a quota is imposed, explain the methods people would use to circumvent the effects of thequota.
MacroeconomicsLESSON 2 ■ ACTIVITY 51 (continued)
UNIT
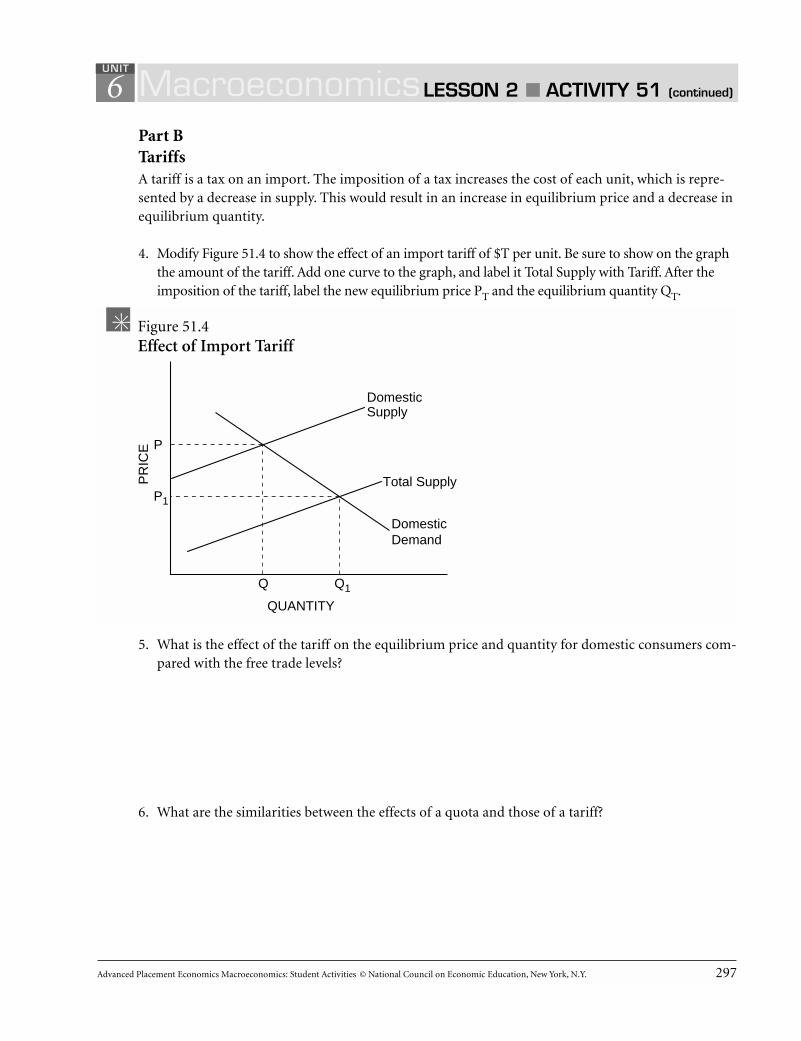
Advanced Placement Economics Macroeconomics: Student Activities © National Council on Economic Education, New York, N.Y. 297
6Part BTariffsA tariff is a tax on an import. The imposition of a tax increases the cost of each unit, which is repre-sented by a decrease in supply. This would result in an increase in equilibrium price and a decrease inequilibrium quantity.
4. Modify Figure 51.4 to show the effect of an import tariff of $T per unit. Be sure to show on the graphthe amount of the tariff. Add one curve to the graph, and label it Total Supply with Tariff. After theimposition of the tariff, label the new equilibrium price PT and the equilibrium quantity QT.
5. What is the effect of the tariff on the equilibrium price and quantity for domestic consumers com-pared with the free trade levels?
6. What are the similarities between the effects of a quota and those of a tariff?
MacroeconomicsLESSON 2 ■ ACTIVITY 51 (continued)
UNIT
Q1
P1
P
Q
DomesticDemand
DomesticSupply
Total Supply
QUANTITY
PR
ICE
Figure 51.4Effect of Import Tariff

298 Advanced Placement Economics Macroeconomics: Student Activities © National Council on Economic Education, New York, N.Y.
67. What is the primary difference between the effects of a quota and those of a tariff?
8. Suppose a country can impose either a quota that raises the domestic price to P2 as in Figure 51.2or a tariff that raises the domestic price to P2. Explain whether domestic consumers would prefer atariff or a quota and why.
Part CExport SubsidiesNations may choose to assist domestic industries by providing subsidies to an industry. The subsidieswould lower the costs and permit the industry to sell at a lower price. This assistance is called anexport subsidy because the industry can now compete on the world market and export some of itsproduct to other nations.
9. Modify Figure 51.5 to show the effects of an export subsidy on domestic producers. Indicate as PSand QS the equilibrium price and quantity for domestic consumers after an export subsidy. Add twocurves to the graph: a Domestic Supply with Subsidy curve and a Total Supply with Subsidy curve.
MacroeconomicsLESSON 2 ■ ACTIVITY 51 (continued)
UNIT
Q1Q
Domestic Demand
Domestic Supply without Subsidy
Total Supply without Subsidy
QUANTITY
Figure 51.5Effects of a Subsidy
P1
P
PR
ICE
Advanced Placement Economics Macroeconomics: Student Activities © National Council on Economic Education, New York, N.Y. 299
6According to Figure 51.5 with your modification, what would be the equilibrium price and quan-tity for
(A) a completely closed economy (no imports and no subsidy)? __________________
(B) an open economy (completely free trade) with no export subsidy? __________________
(C) an open economy with a domestic export subsidy? __________________
10. What is the effect of an export subsidy on the equilibrium price and quantity for domestic con-sumers relative to the free trade equilibrium without a subsidy?
11. If an industry receives a subsidy, what will happen at the equilibrium to domestic productionand the amount of imports?
MacroeconomicsLESSON 2 ■ ACTIVITY 51 (continued)
UNIT
300 Advanced Placement Economics Macroeconomics: Student Activities © National Council on Economic Education, New York, N.Y.
6Part DApplications12. One of the goals of the European Union is the elimination of trade barriers among the member
nations. If this goal is achieved, which groups of people will benefit and which will not benefit?
13. Identify the arguments frequently used to impose some type of trade barrier. Discuss the prosand cons of three arguments.
MacroeconomicsLESSON 2 ■ ACTIVITY 51 (continued)
UNIT
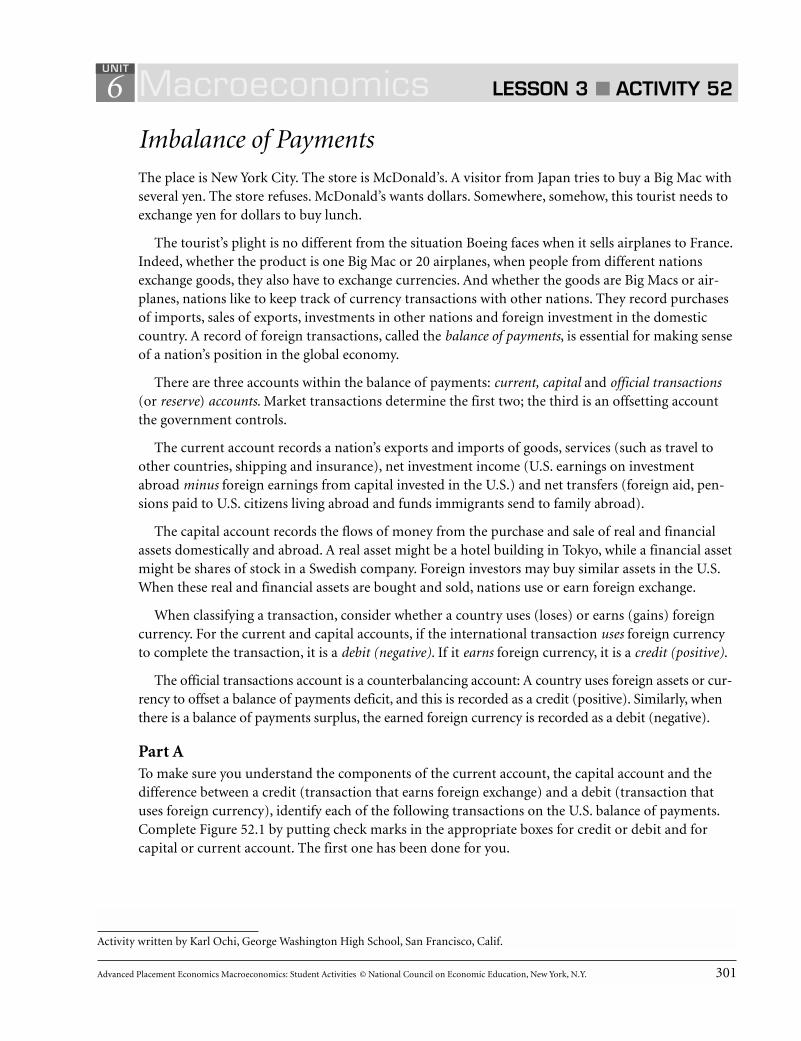
Advanced Placement Economics Macroeconomics: Student Activities © National Council on Economic Education, New York, N.Y. 301
6
Imbalance of PaymentsThe place is New York City. The store is McDonald’s. A visitor from Japan tries to buy a Big Mac withseveral yen. The store refuses. McDonald’s wants dollars. Somewhere, somehow, this tourist needs toexchange yen for dollars to buy lunch.
The tourist’s plight is no different from the situation Boeing faces when it sells airplanes to France.Indeed, whether the product is one Big Mac or 20 airplanes, when people from different nationsexchange goods, they also have to exchange currencies. And whether the goods are Big Macs or air-planes, nations like to keep track of currency transactions with other nations. They record purchasesof imports, sales of exports, investments in other nations and foreign investment in the domesticcountry. A record of foreign transactions, called the balance of payments, is essential for making senseof a nation’s position in the global economy.
There are three accounts within the balance of payments: current, capital and official transactions(or reserve) accounts. Market transactions determine the first two; the third is an offsetting accountthe government controls.
The current account records a nation’s exports and imports of goods, services (such as travel toother countries, shipping and insurance), net investment income (U.S. earnings on investmentabroad minus foreign earnings from capital invested in the U.S.) and net transfers (foreign aid, pen-sions paid to U.S. citizens living abroad and funds immigrants send to family abroad).
The capital account records the flows of money from the purchase and sale of real and financialassets domestically and abroad. A real asset might be a hotel building in Tokyo, while a financial assetmight be shares of stock in a Swedish company. Foreign investors may buy similar assets in the U.S.When these real and financial assets are bought and sold, nations use or earn foreign exchange.
When classifying a transaction, consider whether a country uses (loses) or earns (gains) foreigncurrency. For the current and capital accounts, if the international transaction uses foreign currencyto complete the transaction, it is a debit (negative). If it earns foreign currency, it is a credit (positive).
The official transactions account is a counterbalancing account: A country uses foreign assets or cur-rency to offset a balance of payments deficit, and this is recorded as a credit (positive). Similarly, whenthere is a balance of payments surplus, the earned foreign currency is recorded as a debit (negative).
Part ATo make sure you understand the components of the current account, the capital account and thedifference between a credit (transaction that earns foreign exchange) and a debit (transaction thatuses foreign currency), identify each of the following transactions on the U.S. balance of payments.Complete Figure 52.1 by putting check marks in the appropriate boxes for credit or debit and forcapital or current account. The first one has been done for you.
Macroeconomics LESSON 3 ■ ACTIVITY 52UNIT
Activity written by Karl Ochi, George Washington High School, San Francisco, Calif.
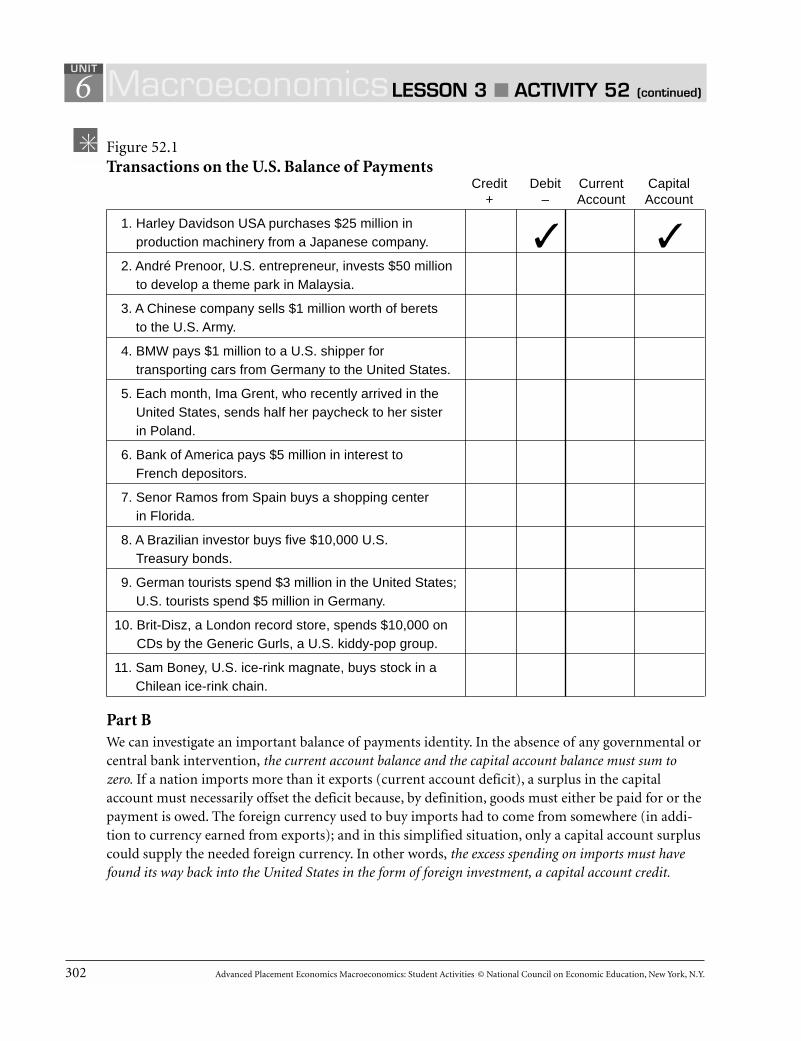
302 Advanced Placement Economics Macroeconomics: Student Activities © National Council on Economic Education, New York, N.Y.
6
Figure 52.1Transactions on the U.S. Balance of Payments
Credit Debit Current Capital+ – Account Account
1. Harley Davidson USA purchases $25 million inproduction machinery from a Japanese company. ✓ ✓
2. André Prenoor, U.S. entrepreneur, invests $50 million to develop a theme park in Malaysia.
3. A Chinese company sells $1 million worth of beretsto the U.S. Army.
4. BMW pays $1 million to a U.S. shipper for transporting cars from Germany to the United States.
5. Each month, Ima Grent, who recently arrived in the United States, sends half her paycheck to her sister in Poland.
6. Bank of America pays $5 million in interest to French depositors.
7. Senor Ramos from Spain buys a shopping center in Florida.
8. A Brazilian investor buys five $10,000 U.S. Treasury bonds.
9. German tourists spend $3 million in the United States; U.S. tourists spend $5 million in Germany.
10. Brit-Disz, a London record store, spends $10,000 on CDs by the Generic Gurls, a U.S. kiddy-pop group.
11. Sam Boney, U.S. ice-rink magnate, buys stock in a Chilean ice-rink chain.
Part BWe can investigate an important balance of payments identity. In the absence of any governmental orcentral bank intervention, the current account balance and the capital account balance must sum tozero. If a nation imports more than it exports (current account deficit), a surplus in the capitalaccount must necessarily offset the deficit because, by definition, goods must either be paid for or thepayment is owed. The foreign currency used to buy imports had to come from somewhere (in addi-tion to currency earned from exports); and in this simplified situation, only a capital account surpluscould supply the needed foreign currency. In other words, the excess spending on imports must havefound its way back into the United States in the form of foreign investment, a capital account credit.
MacroeconomicsLESSON 3 ■ ACTIVITY 52 (continued)
UNIT

Advanced Placement Economics Macroeconomics: Student Activities © National Council on Economic Education, New York, N.Y. 303
612. Analyze the data in Figure 52.2. Compute the missing figures, and answer the questions that follow.
Figure 52.22002 Balance of Payments, Z-Land
Current Account
Z-Land exports of goods $ +300
Z-Land imports of goods –400
Z-Land exports of services +150
Z-Land imports of services –120
Balance of trade _________
Net investment income +10
Net transfers –14
Balance on current account _________
Capital Account
Z-Land capital going abroad –110
Foreign capital coming into Z-Land +160
Balance on capital account _________
Balance on Current Account
Plus Balance on Capital Account _________
Official Reserves Account
Official reserves transactions balance _________
Total $ 0_________
13. Does Z-Land have a current account deficit or surplus? How do you know?
14. Without central bank intervention, does Z-Land carry a balance of payments surplus or deficit?How do you know?
15. If Z-Land runs a balance of payments deficit, how can this difference be made up? If it carries abalance of payment surplus, what will happen?
MacroeconomicsLESSON 3 ■ ACTIVITY 52 (continued)
UNIT

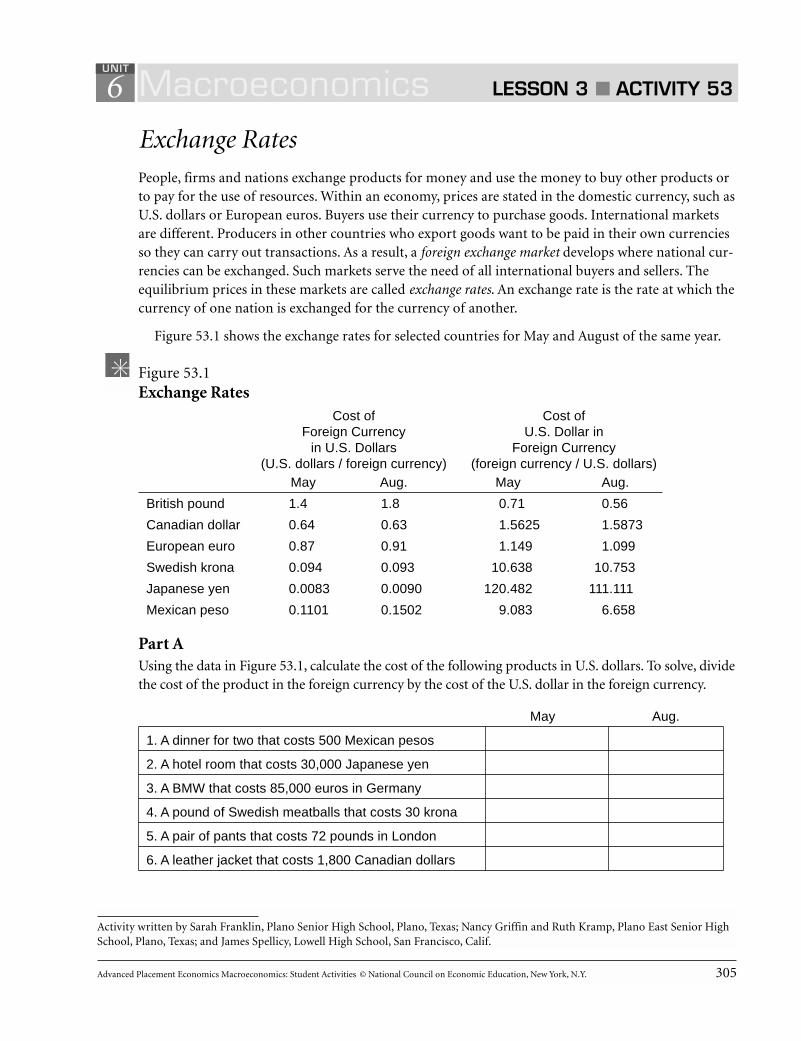
Advanced Placement Economics Macroeconomics: Student Activities © National Council on Economic Education, New York, N.Y. 305
6
Exchange RatesPeople, firms and nations exchange products for money and use the money to buy other products orto pay for the use of resources. Within an economy, prices are stated in the domestic currency, such asU.S. dollars or European euros. Buyers use their currency to purchase goods. International marketsare different. Producers in other countries who export goods want to be paid in their own currenciesso they can carry out transactions. As a result, a foreign exchange market develops where national cur-rencies can be exchanged. Such markets serve the need of all international buyers and sellers. Theequilibrium prices in these markets are called exchange rates. An exchange rate is the rate at which thecurrency of one nation is exchanged for the currency of another.
Figure 53.1 shows the exchange rates for selected countries for May and August of the same year.
Figure 53.1Exchange Rates
Cost of Cost ofForeign Currency U.S. Dollar in
in U.S. Dollars Foreign Currency(U.S. dollars / foreign currency) (foreign currency / U.S. dollars)
May Aug. May Aug.
British pound 1.4 1.8 0.71 0.56
Canadian dollar 0.64 0.63 1.5625 1.5873
European euro 0.87 0.91 1.149 1.099
Swedish krona 0.094 0.093 10.638 10.753
Japanese yen 0.0083 0.0090 120.482 111.111
Mexican peso 0.1101 0.1502 9.083 6.658
Part AUsing the data in Figure 53.1, calculate the cost of the following products in U.S. dollars. To solve, dividethe cost of the product in the foreign currency by the cost of the U.S. dollar in the foreign currency.
May Aug.
1. A dinner for two that costs 500 Mexican pesos
2. A hotel room that costs 30,000 Japanese yen
3. A BMW that costs 85,000 euros in Germany
4. A pound of Swedish meatballs that costs 30 krona
5. A pair of pants that costs 72 pounds in London
6. A leather jacket that costs 1,800 Canadian dollars
Macroeconomics LESSON 3 ■ ACTIVITY 53UNIT
Activity written by Sarah Franklin, Plano Senior High School, Plano, Texas; Nancy Griffin and Ruth Kramp, Plano East Senior HighSchool, Plano, Texas; and James Spellicy, Lowell High School, San Francisco, Calif.
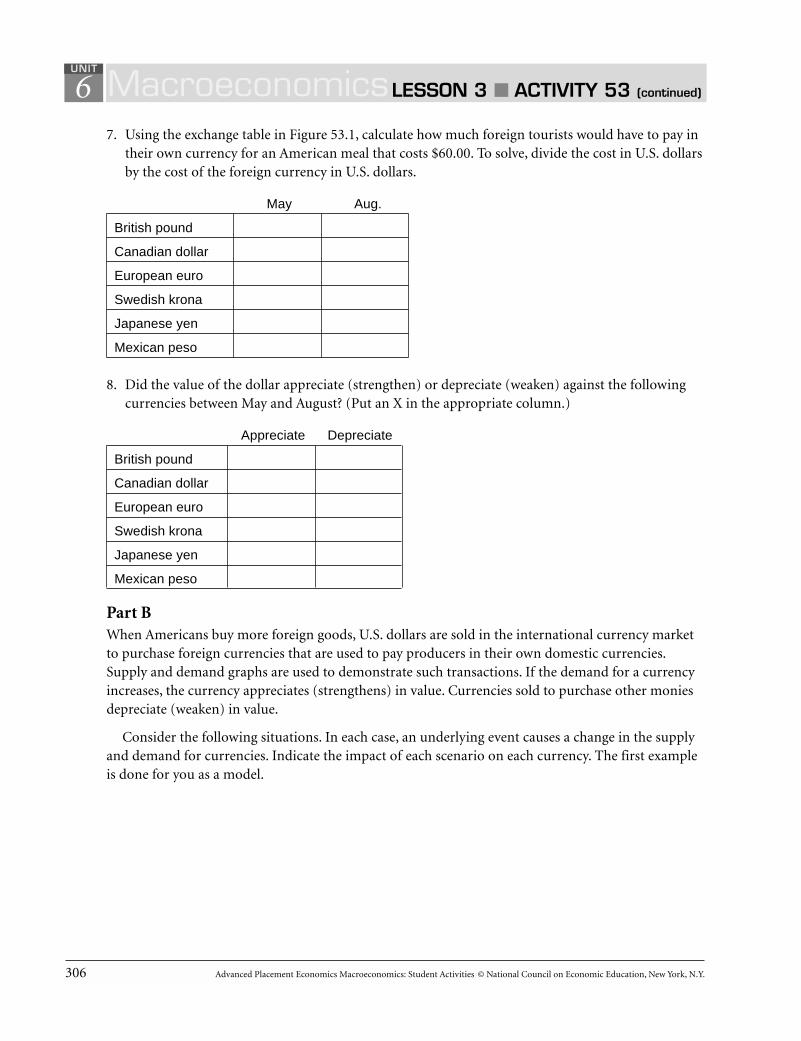
306 Advanced Placement Economics Macroeconomics: Student Activities © National Council on Economic Education, New York, N.Y.
67. Using the exchange table in Figure 53.1, calculate how much foreign tourists would have to pay in
their own currency for an American meal that costs $60.00. To solve, divide the cost in U.S. dollarsby the cost of the foreign currency in U.S. dollars.
May Aug.
British pound
Canadian dollar
European euro
Swedish krona
Japanese yen
Mexican peso
8. Did the value of the dollar appreciate (strengthen) or depreciate (weaken) against the followingcurrencies between May and August? (Put an X in the appropriate column.)
Appreciate Depreciate
British pound
Canadian dollar
European euro
Swedish krona
Japanese yen
Mexican peso
Part BWhen Americans buy more foreign goods, U.S. dollars are sold in the international currency marketto purchase foreign currencies that are used to pay producers in their own domestic currencies.Supply and demand graphs are used to demonstrate such transactions. If the demand for a currencyincreases, the currency appreciates (strengthens) in value. Currencies sold to purchase other moniesdepreciate (weaken) in value.
Consider the following situations. In each case, an underlying event causes a change in the supplyand demand for currencies. Indicate the impact of each scenario on each currency. The first exampleis done for you as a model.
MacroeconomicsLESSON 3 ■ ACTIVITY 53 (continued)
UNIT
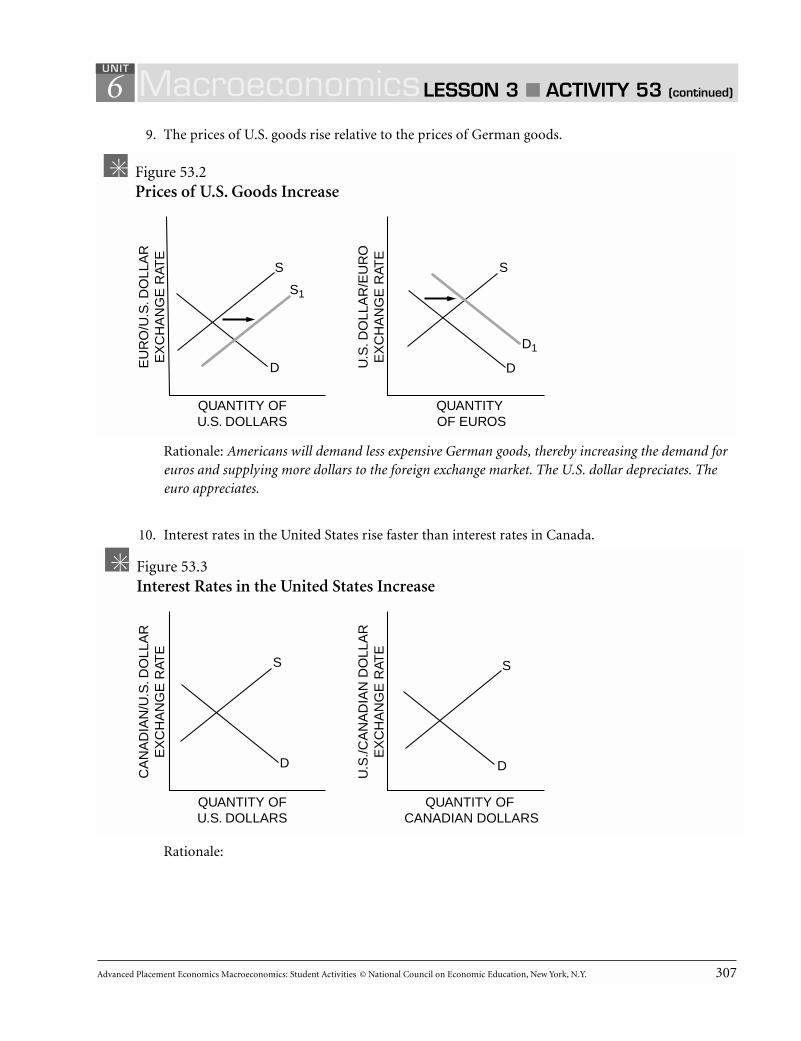
Advanced Placement Economics Macroeconomics: Student Activities © National Council on Economic Education, New York, N.Y. 307
69. The prices of U.S. goods rise relative to the prices of German goods.
Rationale: Americans will demand less expensive German goods, thereby increasing the demand foreuros and supplying more dollars to the foreign exchange market. The U.S. dollar depreciates. Theeuro appreciates.
10. Interest rates in the United States rise faster than interest rates in Canada.
Rationale:
MacroeconomicsLESSON 3 ■ ACTIVITY 53 (continued)
UNIT
Figure 53.2Prices of U.S. Goods Increase
QUANTITY OFU.S. DOLLARS
EU
RO
/U.S
. DO
LLA
RE
XC
HA
NG
E R
ATE
S1
S
D
QUANTITY OF EUROS
U.S
. DO
LLA
R/E
UR
OE
XC
HA
NG
E R
ATE
D1
S
D
Figure 53.3Interest Rates in the United States Increase
QUANTITY OFU.S. DOLLARS
CA
NA
DIA
N/U
.S. D
OLL
AR
EX
CH
AN
GE
RAT
E
S
D
QUANTITY OF CANADIAN DOLLARS
U.S
./CA
NA
DIA
N D
OLL
AR
EX
CH
AN
GE
RAT
E
S
D
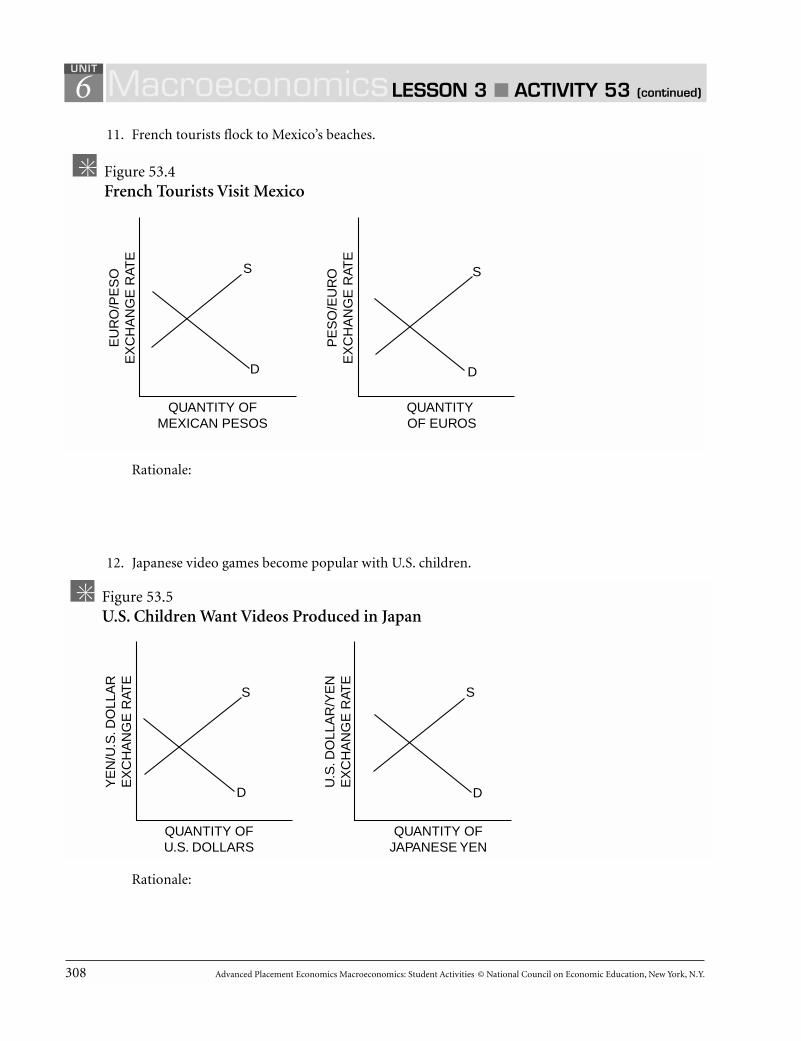
308 Advanced Placement Economics Macroeconomics: Student Activities © National Council on Economic Education, New York, N.Y.
611. French tourists flock to Mexico’s beaches.
Rationale:
12. Japanese video games become popular with U.S. children.
Rationale:
MacroeconomicsLESSON 3 ■ ACTIVITY 53 (continued)
UNIT
Figure 53.4French Tourists Visit Mexico
QUANTITY OFMEXICAN PESOS
EU
RO
/PE
SO
EX
CH
AN
GE
RAT
E
S
D
QUANTITY OF EUROS
PE
SO
/EU
RO
EX
CH
AN
GE
RAT
E
S
D
Figure 53.5U.S. Children Want Videos Produced in Japan
QUANTITY OFU.S. DOLLARS
YE
N/U
.S. D
OLL
AR
EX
CH
AN
GE
RAT
E
S
D
QUANTITY OFJAPANESE YEN
U.S
. DO
LLA
R/Y
EN
EX
CH
AN
GE
RAT
E
S
D
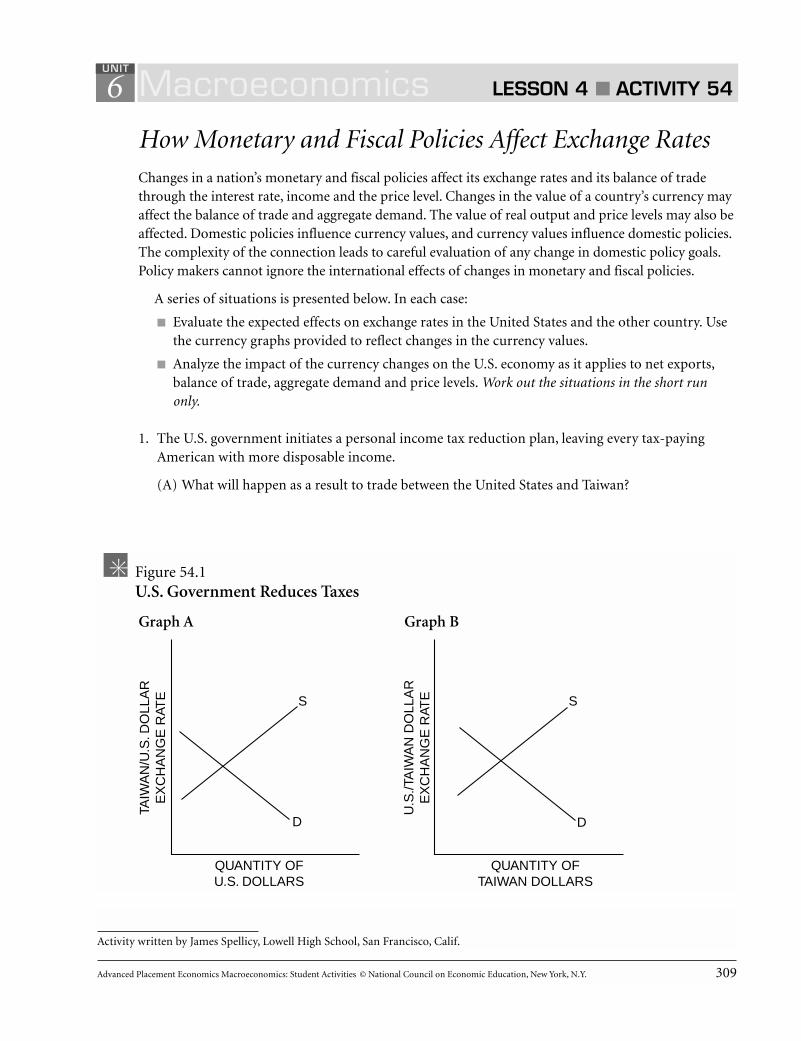
Advanced Placement Economics Macroeconomics: Student Activities © National Council on Economic Education, New York, N.Y. 309
6
How Monetary and Fiscal Policies Affect Exchange RatesChanges in a nation’s monetary and fiscal policies affect its exchange rates and its balance of tradethrough the interest rate, income and the price level. Changes in the value of a country’s currency mayaffect the balance of trade and aggregate demand. The value of real output and price levels may also beaffected. Domestic policies influence currency values, and currency values influence domestic policies.The complexity of the connection leads to careful evaluation of any change in domestic policy goals.Policy makers cannot ignore the international effects of changes in monetary and fiscal policies.
A series of situations is presented below. In each case:
■ Evaluate the expected effects on exchange rates in the United States and the other country. Usethe currency graphs provided to reflect changes in the currency values.
■ Analyze the impact of the currency changes on the U.S. economy as it applies to net exports,balance of trade, aggregate demand and price levels. Work out the situations in the short runonly.
1. The U.S. government initiates a personal income tax reduction plan, leaving every tax-payingAmerican with more disposable income.
(A) What will happen as a result to trade between the United States and Taiwan?
Macroeconomics LESSON 4 ■ ACTIVITY 54UNIT
Activity written by James Spellicy, Lowell High School, San Francisco, Calif.
Figure 54.1U.S. Government Reduces Taxes
QUANTITY OFU.S. DOLLARS
TAIW
AN
/U.S
. DO
LLA
RE
XC
HA
NG
E R
ATE S
D
QUANTITY OFTAIWAN DOLLARS
Graph A Graph B
U.S
./TA
IWA
N D
OLL
AR
EX
CH
AN
GE
RAT
E S
D
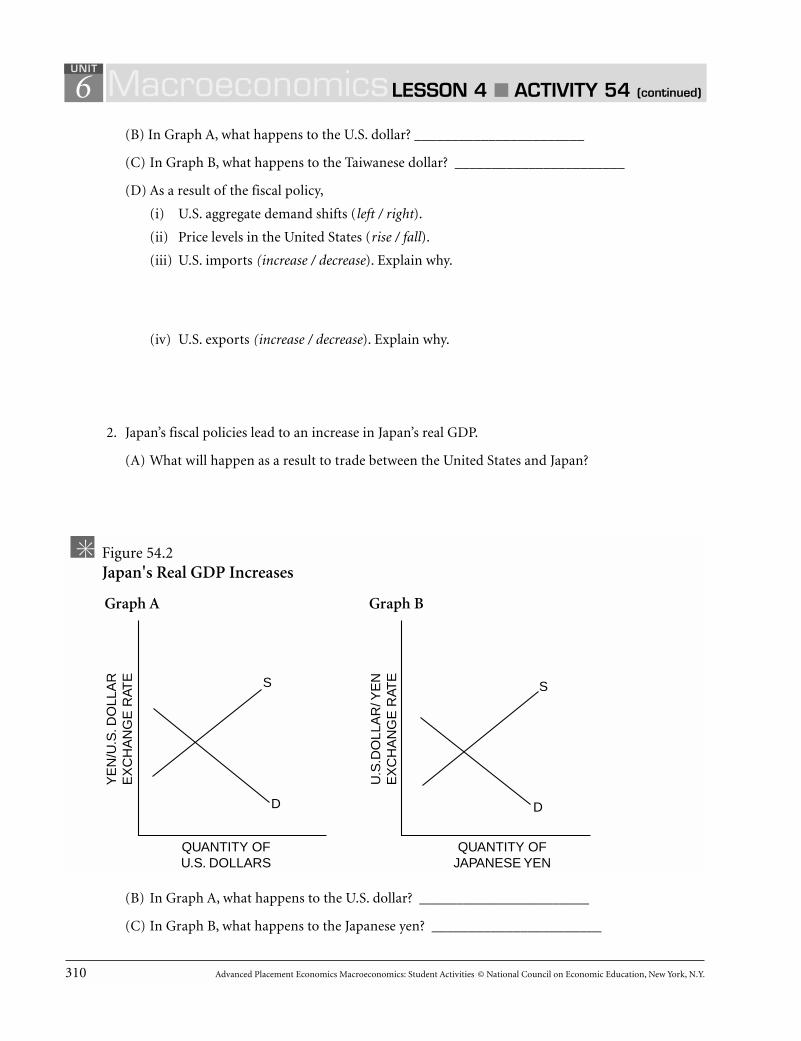
310 Advanced Placement Economics Macroeconomics: Student Activities © National Council on Economic Education, New York, N.Y.
6(B) In Graph A, what happens to the U.S. dollar? _______________________
(C) In Graph B, what happens to the Taiwanese dollar? _______________________
(D) As a result of the fiscal policy,
(i) U.S. aggregate demand shifts (left / right).
(ii) Price levels in the United States (rise / fall).
(iii) U.S. imports (increase / decrease). Explain why.
(iv) U.S. exports (increase / decrease). Explain why.
2. Japan’s fiscal policies lead to an increase in Japan’s real GDP.
(A) What will happen as a result to trade between the United States and Japan?
(B) In Graph A, what happens to the U.S. dollar? _______________________
(C) In Graph B, what happens to the Japanese yen? _______________________
MacroeconomicsLESSON 4 ■ ACTIVITY 54 (continued)
UNIT
Figure 54.2Japan's Real GDP Increases
QUANTITY OFU.S. DOLLARS
YE
N/U
.S. D
OLL
AR
EX
CH
AN
GE
RAT
E
S
D
QUANTITY OFJAPANESE YEN
U.S
.DO
LLA
R/ Y
EN
EX
CH
AN
GE
RAT
ES
D
Graph A Graph B

Advanced Placement Economics Macroeconomics: Student Activities © National Council on Economic Education, New York, N.Y. 311
6(D) As a result of the changing value of the U.S. dollar,
(i) U.S. exports (increase / decrease). Explain why.
(ii) U.S. imports (increase / decrease). Explain why.
(iii) U.S. aggregate demand shifts (left / right).
(iv) Price levels in the United States (rise / fall).
3. The U.S. federal budget deficit increases, which causes the interest rate to rise. (Assume trade with Great Britain.)
(A) What will happen as a result to trade between the United States and Great Britain?
(B) In Graph A, what happens to the U.S. dollar? __________________
(C) In Graph B, what happens to the British pound? __________________
MacroeconomicsLESSON 4 ■ ACTIVITY 54 (continued)
UNIT
Figure 54.3Interest Rates in the United States Increase
QUANTITY OFU.S. DOLLARS
BR
ITIS
H P
OU
ND
/U.S
. DO
LLA
RE
XC
HA
NG
E R
ATE
S
D
QUANTITY OFBRITISH POUNDS
U.S
. DO
LLA
R/B
RIT
ISH
PO
UN
DE
XC
HA
NG
E R
ATES
D
Graph A Graph B

312 Advanced Placement Economics Macroeconomics: Student Activities © National Council on Economic Education, New York, N.Y.
6(D) As a result of the changing value of the U.S. dollar,
(i) U.S. exports (increase / decrease). Explain why.
(ii) U.S. imports (increase / decrease). Explain why.
(iii) U.S. aggregate demand shifts (left / right).
(iv) Price levels in the United States (rise / fall).
4. Europe’s interest rates are increasing, while the U.S. interest rate remains relatively constant.
(A) What will happen as a result to trade between the United States and Europe?
(B) In Graph A, what happens to the U.S. dollar? _______________________
(C) In Graph B, what happens to the European euro? _______________________
MacroeconomicsLESSON 4 ■ ACTIVITY 54 (continued)
UNIT
Figure 54.4Interest Rates in Europe Increase
QUANTITY OFU.S. DOLLARS
EU
RO
/U.S
. DO
LLA
RE
XC
HA
NG
E R
ATE S
D
QUANTITY OF EUROS
U.S
. DO
LLA
R/E
UR
OE
XC
HA
NG
E R
ATE S
D
Graph A Graph B

Advanced Placement Economics Macroeconomics: Student Activities © National Council on Economic Education, New York, N.Y. 313
6(D) As a result of the changing value of the U.S. dollar,
(i) U.S. exports (increase / decrease). Explain why.
(ii) U.S. imports (increase / decrease). Explain why.
(iii) U.S. aggregate demand shifts (left / right).
(iv) Price levels in the United States (rise / fall).
5. There is a rapid increase in the Canadian price level while the U.S. price level remains relativelyconstant.
(A) What will happen as a result to trade between the United States and Canada?
(B) In Graph A, what happens to the U.S. dollar? __________________
(C) In Graph B, what happens to the Canadian dollar? __________________
MacroeconomicsLESSON 4 ■ ACTIVITY 54 (continued)
UNIT
Figure 54.5The Price Level in Canada Increases
QUANTITY OFU.S. DOLLARS
CA
NA
DIA
N/U
.S. D
OLL
AR
EX
CH
AN
GE
RAT
E
S
D
QUANTITY OF CANADIAN DOLLARS
U.S
./CA
NA
DIA
N D
OLL
AR
EX
CH
AN
GE
RAT
ES
D
Graph A Graph B

314 Advanced Placement Economics Macroeconomics: Student Activities © National Council on Economic Education, New York, N.Y.
6(D) As a result of the changing value of the U.S. dollar,
(i) U.S. exports (increase / decrease). Explain why.
(ii) U.S. imports (increase / decrease). Explain why.
(iii) U.S. aggregate demand shifts (left / right).
(iv) Price levels in the United States (rise / fall).
MacroeconomicsLESSON 4 ■ ACTIVITY 54 (continued)
UNIT

Advanced Placement Economics Macroeconomics: Student Activities © National Council on Economic Education, New York, N.Y. 315
6
The International Way of Thinking1. True, false or uncertain, and explain why? “Nations do not trade; people trade.”
2. Use one example from your own life when you specialized in doing something in which you had acomparative advantage and traded for something in which someone else had a comparativeadvantage.
3. Assume the U.S. government has placed a high tariff on imported bicycles.
(A) Use a supply and demand graph to show the effect of the tariff on the U.S. market for bicycles.
Macroeconomics LESSON 4 ■ ACTIVITY 55UNIT
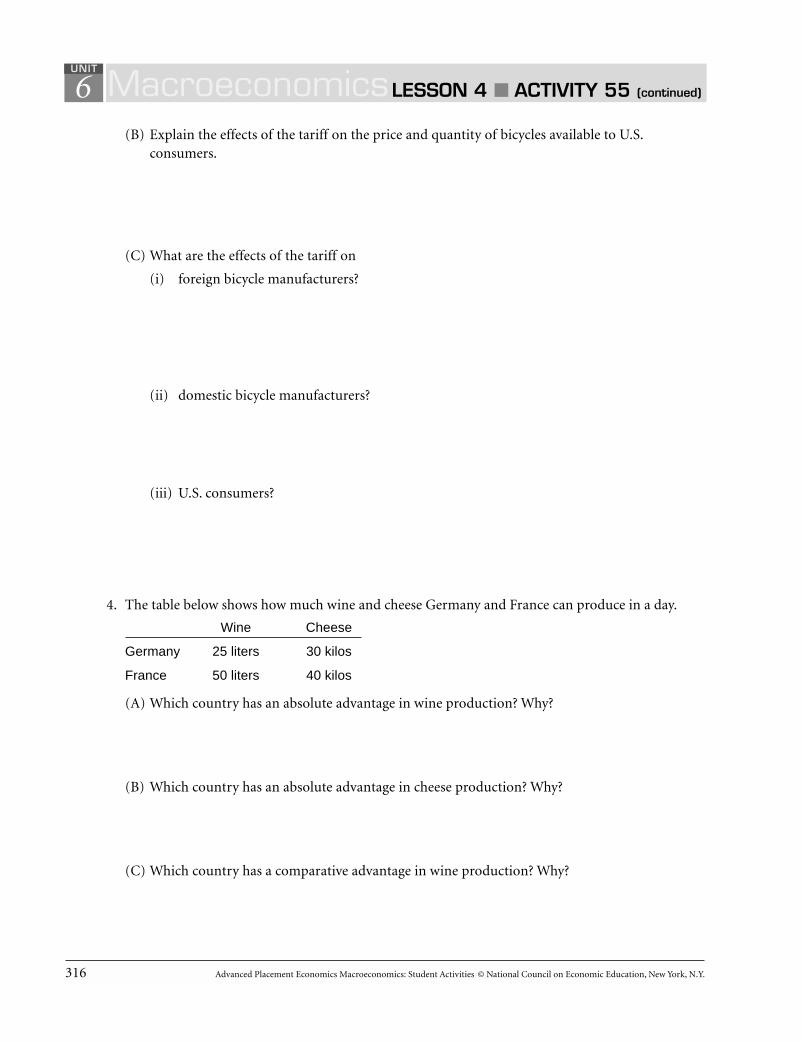
316 Advanced Placement Economics Macroeconomics: Student Activities © National Council on Economic Education, New York, N.Y.
6(B) Explain the effects of the tariff on the price and quantity of bicycles available to U.S.
consumers.
(C) What are the effects of the tariff on
(i) foreign bicycle manufacturers?
(ii) domestic bicycle manufacturers?
(iii) U.S. consumers?
4. The table below shows how much wine and cheese Germany and France can produce in a day.
Wine Cheese
Germany 25 liters 30 kilos
France 50 liters 40 kilos
(A) Which country has an absolute advantage in wine production? Why?
(B) Which country has an absolute advantage in cheese production? Why?
(C) Which country has a comparative advantage in wine production? Why?
MacroeconomicsLESSON 4 ■ ACTIVITY 55 (continued)
UNIT
Advanced Placement Economics Macroeconomics: Student Activities © National Council on Economic Education, New York, N.Y. 317
6(D) Which country has a comparative advantage in cheese production? Why?
(E) Based on the data above and considering comparative advantage only, what should Franceimport? What should France export?
(F) Based on the data above and considering comparative advantage only, what should Germanyimport? What should Germany export?
5. For each of the following situations, explain the effect of the event on the value of the U.S. dollarin relation to the Mexican peso. Draw a supply and demand graph to illustrate each situation.
(A) Americans increase their demand for Mexican tomatoes.
(B) Inflation in Mexico rises at a higher rate than in the United States.
MacroeconomicsLESSON 4 ■ ACTIVITY 55 (continued)
UNIT
318 Advanced Placement Economics Macroeconomics: Student Activities © National Council on Economic Education, New York, N.Y.
6(C) Americans increase their investments in Mexico because they feel the Mexican economy will
be strong.
(D) Interest rates rise in the United States and have become relatively higher than Mexican interestrates.
(E) Mexico becomes a much more popular tourist destination for Americans.
6. Explain three effects of a new law that would forbid U.S. citizens and businesses from trading withany other country.
7. Assume that the United States increases its federal budget deficit, which causes interest rates to rise.
(A) What would be the effect of this on the international value of the dollar? Why?
(B) What would be the effect of this on the U.S. balance of trade? Why?
MacroeconomicsLESSON 4 ■ ACTIVITY 55 (continued)
UNIT

Advanced Placement Economics Macroeconomics: Student Activities © National Council on Economic Education, New York, N.Y. 319
6(C) Would the budget deficit and higher interest rates tend to increase or decrease aggregate
demand? Why?
8. How could a nation have a negative balance of trade and still not have a deficit in its balance ofpayments?
MacroeconomicsLESSON 4 ■ ACTIVITY 55 (continued)
UNIT

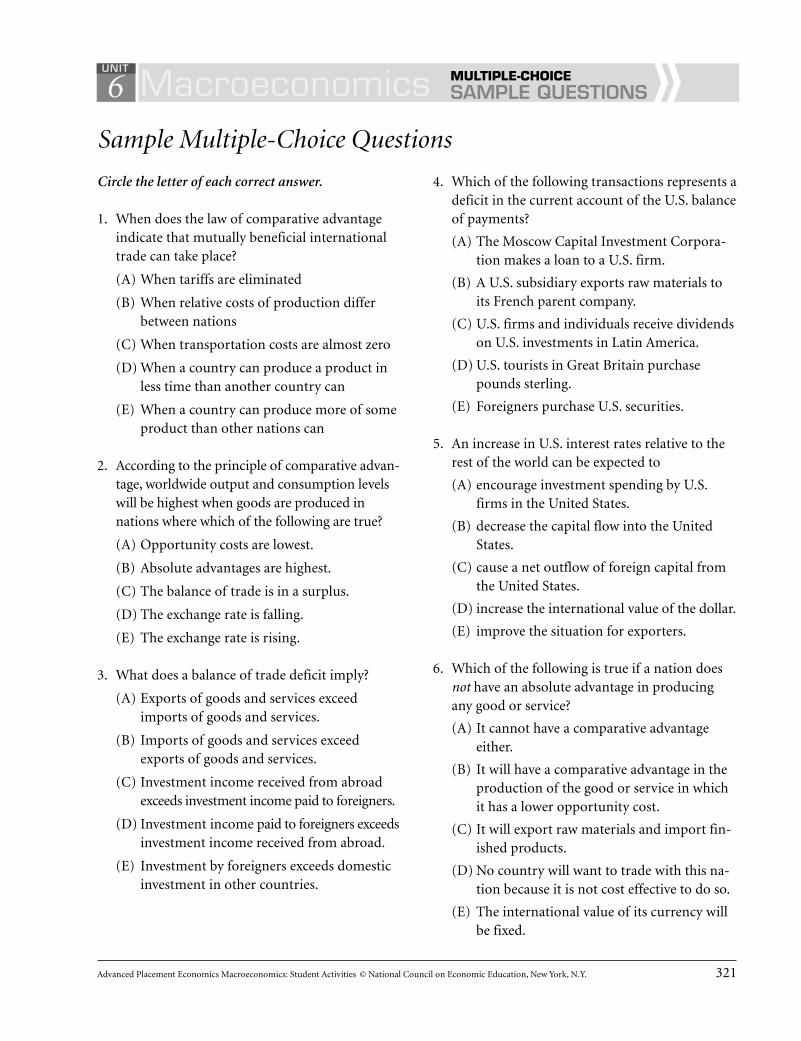
Advanced Placement Economics Macroeconomics: Student Activities © National Council on Economic Education, New York, N.Y. 321
Circle the letter of each correct answer.
1. When does the law of comparative advantageindicate that mutually beneficial internationaltrade can take place?
(A) When tariffs are eliminated
(B) When relative costs of production differbetween nations
(C) When transportation costs are almost zero
(D) When a country can produce a product inless time than another country can
(E) When a country can produce more of someproduct than other nations can
2. According to the principle of comparative advan-tage, worldwide output and consumption levelswill be highest when goods are produced innations where which of the following are true?
(A) Opportunity costs are lowest.
(B) Absolute advantages are highest.
(C) The balance of trade is in a surplus.
(D) The exchange rate is falling.
(E) The exchange rate is rising.
3. What does a balance of trade deficit imply?
(A) Exports of goods and services exceedimports of goods and services.
(B) Imports of goods and services exceedexports of goods and services.
(C) Investment income received from abroadexceeds investment income paid to foreigners.
(D) Investment income paid to foreigners exceedsinvestment income received from abroad.
(E) Investment by foreigners exceeds domesticinvestment in other countries.
4. Which of the following transactions represents adeficit in the current account of the U.S. balanceof payments?
(A) The Moscow Capital Investment Corpora-tion makes a loan to a U.S. firm.
(B) A U.S. subsidiary exports raw materials toits French parent company.
(C) U.S. firms and individuals receive dividendson U.S. investments in Latin America.
(D) U.S. tourists in Great Britain purchasepounds sterling.
(E) Foreigners purchase U.S. securities.
5. An increase in U.S. interest rates relative to therest of the world can be expected to
(A) encourage investment spending by U.S.firms in the United States.
(B) decrease the capital flow into the UnitedStates.
(C) cause a net outflow of foreign capital fromthe United States.
(D) increase the international value of the dollar.
(E) improve the situation for exporters.
6. Which of the following is true if a nation doesnot have an absolute advantage in producingany good or service?
(A) It cannot have a comparative advantageeither.
(B) It will have a comparative advantage in theproduction of the good or service in whichit has a lower opportunity cost.
(C) It will export raw materials and import fin-ished products.
(D) No country will want to trade with this na-tion because it is not cost effective to do so.
(E) The international value of its currency willbe fixed.
6 Macroeconomics SAMPLE QUESTIONS MULTIPLE-CHOICE
UNIT
Sample Multiple-Choice Questions
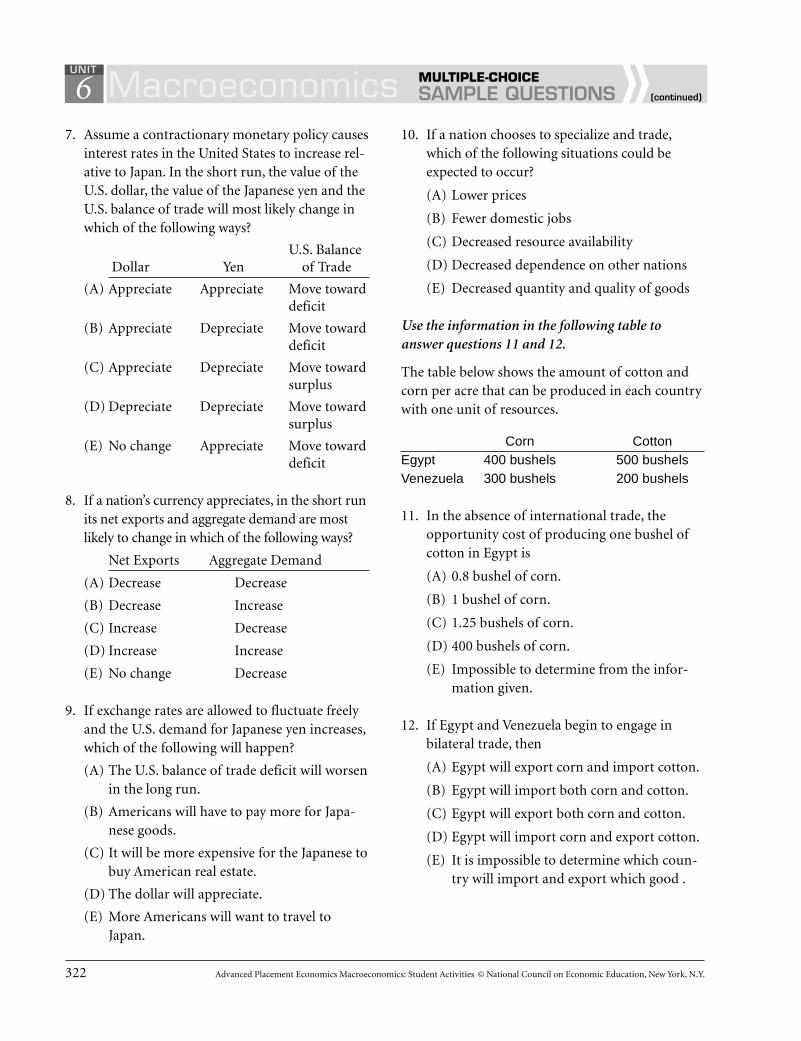
322 Advanced Placement Economics Macroeconomics: Student Activities © National Council on Economic Education, New York, N.Y.
7. Assume a contractionary monetary policy causesinterest rates in the United States to increase rel-ative to Japan. In the short run, the value of theU.S. dollar, the value of the Japanese yen and theU.S. balance of trade will most likely change inwhich of the following ways?
U.S. BalanceDollar Yen of Trade
(A) Appreciate Appreciate Move towarddeficit
(B) Appreciate Depreciate Move towarddeficit
(C) Appreciate Depreciate Move towardsurplus
(D) Depreciate Depreciate Move towardsurplus
(E) No change Appreciate Move towarddeficit
8. If a nation’s currency appreciates, in the short runits net exports and aggregate demand are mostlikely to change in which of the following ways?
Net Exports Aggregate Demand
(A) Decrease Decrease
(B) Decrease Increase
(C) Increase Decrease
(D) Increase Increase
(E) No change Decrease
9. If exchange rates are allowed to fluctuate freelyand the U.S. demand for Japanese yen increases,which of the following will happen?
(A) The U.S. balance of trade deficit will worsenin the long run.
(B) Americans will have to pay more for Japa-nese goods.
(C) It will be more expensive for the Japanese tobuy American real estate.
(D) The dollar will appreciate.
(E) More Americans will want to travel toJapan.
10. If a nation chooses to specialize and trade,which of the following situations could beexpected to occur?
(A) Lower prices
(B) Fewer domestic jobs
(C) Decreased resource availability
(D) Decreased dependence on other nations
(E) Decreased quantity and quality of goods
Use the information in the following table toanswer questions 11 and 12.
The table below shows the amount of cotton andcorn per acre that can be produced in each countrywith one unit of resources.
Corn CottonEgypt 400 bushels 500 bushelsVenezuela 300 bushels 200 bushels
11. In the absence of international trade, theopportunity cost of producing one bushel ofcotton in Egypt is
(A) 0.8 bushel of corn.
(B) 1 bushel of corn.
(C) 1.25 bushels of corn.
(D) 400 bushels of corn.
(E) Impossible to determine from the infor-mation given.
12. If Egypt and Venezuela begin to engage in bilateral trade, then
(A) Egypt will export corn and import cotton.
(B) Egypt will import both corn and cotton.
(C) Egypt will export both corn and cotton.
(D) Egypt will import corn and export cotton.
(E) It is impossible to determine which coun-try will import and export which good .
6 Macroeconomics SAMPLE QUESTIONS MULTIPLE-CHOICE
UNIT
(continued)

Advanced Placement Economics Macroeconomics: Student Activities © National Council on Economic Education, New York, N.Y. 323
13. The following data show the quantities of sodaand cheese that can be produced in the UnitedStates and France with one unit of resources.
Soda CheeseUnited States 20 bottles 60 poundsFrance 10 bottles 40 pounds
Which of the following are true statements?I. France has an absolute advantage in pro-
ducing soda.II. The United States has a comparative
advantage in producing soda.III. The United States has an absolute advan-
tage in producing cheese.IV. The United States has a comparative
advantage in producing cheese.
(A) I only
(B) II only
(C) II and III only
(D) II and IV only
(E) I, II, and III only
14. If the U.S. dollar appreciates in the foreignexchange market, U.S. imports and exports aremost likely to change in which of the followingways?
U.S. Imports U.S. Exports
(A) Increase Remain unchanged
(B) Increase Increase
(C) Increase Decrease
(D) Decrease Remain unchanged
(E) Decrease Decrease
15. In the United States, an increase in which ofthe following will cause an increase in U.S.imports?I. Per capita real incomeII. Price levelIII. Interest ratesIV. Tariffs
(A) I and II only
(B) I and III only
(C) I and IV only
(D) I, II, and III only
(E) II, III and IV only
16. The following data show the number of hoursit takes in Brazil and Colombia, using one unitof resources, to produce one ton of coffee orone ton of cocoa.
Coffee CocoaBrazil 5 hours 3 hoursColombia 6 hours 3 hours
Which of the following statements are true?I. Brazil has a comparative advantage in pro-
ducing coffee.II. Colombia has an absolute advantage in
producing coffee.III. Brazil has an absolute advantage in
producing cocoa.IV. Colombia has a comparative advantage in
producing cocoa.
(A) I only
(B) II only
(C) I and II only
(D) I and IV only
(E) I, II and III only
6 Macroeconomics SAMPLE QUESTIONS MULTIPLE-CHOICE
UNIT
(continued)

324 Advanced Placement Economics Macroeconomics: Student Activities © National Council on Economic Education, New York, N.Y.
17. Suppose that the price level in Country A in-creases relative to the price level in other coun-tries. In which of the following ways are CountryA’s imports and exports most likely to change?
Country A’s Country A’sImports Exports
(A) Increase No change
(B) Increase Decrease
(C) No change Decrease
(D) No change Increase
(E) Decrease Increase
18. In the short run, in which of the followingways is an expansionary monetary policy mostlikely to cause the interest rate and the value ofthe domestic currency to change?
Interest Rate Value of Currency
(A) Increase Increase
(B) Increase Decrease
(C) No change Decrease
(D) Decrease Increase
(E) Decrease Decrease
19. If interest rates in the United States are increas-ing faster than interest rates in other countries,which of the following is most likely to occur?
(A) The demand for dollars will decrease, andthe value of the dollar will increase.
(B) The demand for dollars will increase, andthe value of the dollar will increase.
(C) The supply of dollars will decrease, andthe value of the dollar will increase.
(D) The supply of dollars will increase, and thevalue of the dollar will increase.
(E) The supply of dollars will increase, and thevalue of the dollar will decrease.
6 Macroeconomics SAMPLE QUESTIONS MULTIPLE-CHOICE
UNIT
(continued)

Advanced Placement Economics Macroeconomics: Student Activities © National Council on Economic Education, New York, N.Y. 325
Sample Short Free-Response Questions1. In a recent year, the United States had a huge balance of trade deficit. Comment on the following
policies designed to correct this deficit.
(A) Limit foreign investment by U.S. firms in other countries.
(B) Sell dollars so the value of the dollar goes down.
(C) Put high tariffs on autos, steel and consumer electronics.
2. True, false or uncertain, and explain why? “Tariffs actually increase domestic employment byreducing foreign competition and creating more jobs for American workers. Furthermore, morejobs means higher incomes with which Americans can buy more goods from abroad. Hence,instead of reducing foreign trade, tariffs tend to increase it.”
6 Macroeconomics SAMPLE QUESTIONS SHORT FREE-RESPONSE
UNIT
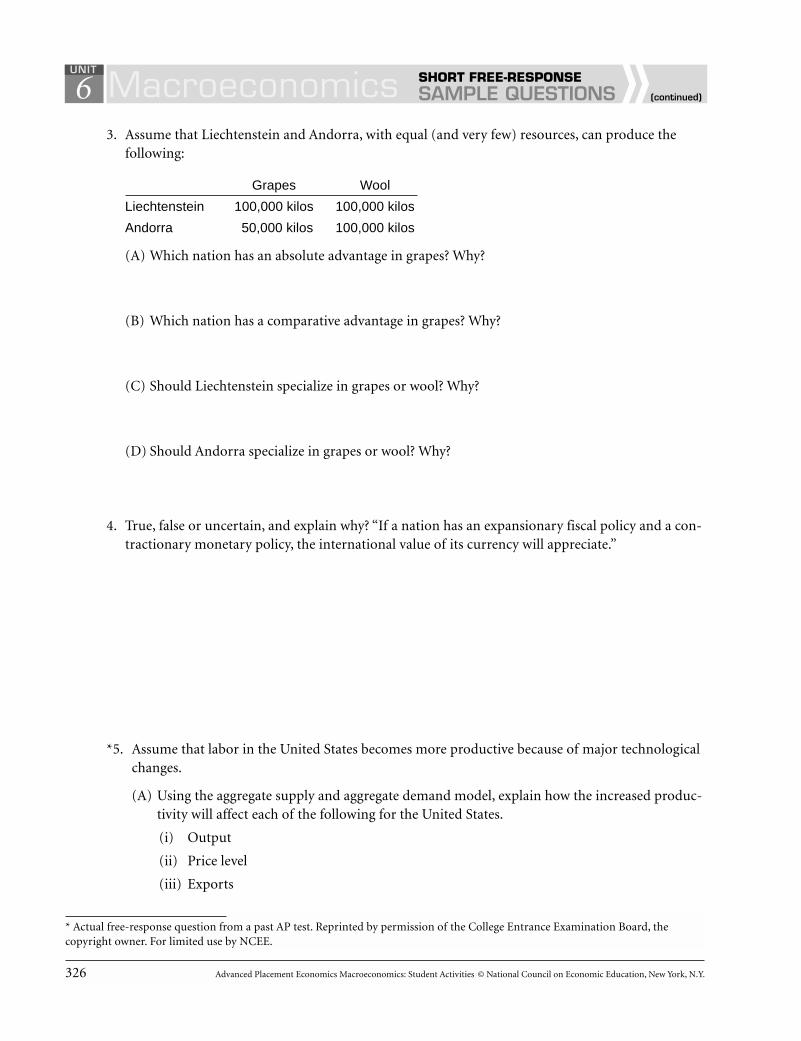
326 Advanced Placement Economics Macroeconomics: Student Activities © National Council on Economic Education, New York, N.Y.
3. Assume that Liechtenstein and Andorra, with equal (and very few) resources, can produce thefollowing:
Grapes Wool
Liechtenstein 100,000 kilos 100,000 kilos
Andorra 50,000 kilos 100,000 kilos
(A) Which nation has an absolute advantage in grapes? Why?
(B) Which nation has a comparative advantage in grapes? Why?
(C) Should Liechtenstein specialize in grapes or wool? Why?
(D) Should Andorra specialize in grapes or wool? Why?
4. True, false or uncertain, and explain why? “If a nation has an expansionary fiscal policy and a con-tractionary monetary policy, the international value of its currency will appreciate.”
*5. Assume that labor in the United States becomes more productive because of major technologicalchanges.
(A) Using the aggregate supply and aggregate demand model, explain how the increased produc-tivity will affect each of the following for the United States.
(i) Output
(ii) Price level
(iii) Exports
6 Macroeconomics SAMPLE QUESTIONS SHORT FREE-RESPONSE
UNIT
(continued)
* Actual free-response question from a past AP test. Reprinted by permission of the College Entrance Examination Board, thecopyright owner. For limited use by NCEE.

Advanced Placement Economics Macroeconomics: Student Activities © National Council on Economic Education, New York, N.Y. 327
(B) Explain how the change in exports you identified in (iii) will affect the international value ofthe dollar.
*6. Assume that in the United States, nominal wage rates rise faster than labor productivity. Analyzethe short-run effects of this situation on each of the following.
(A) The general price level
(B) The level of exports
(C) The international value of the dollar
6 Macroeconomics SAMPLE QUESTIONS SHORT FREE-RESPONSE
UNIT
(continued)
*Actual free-response question from a past AP test. Reprinted by permission of the College Entrance Examination Board, thecopyright owner. For limited use by NCEE.

328 Advanced Placement Economics Macroeconomics: Student Activities © National Council on Economic Education, New York, N.Y.
7. If the rate of inflation is higher in the United States than in other countries, analyze what willhappen to
(A) exports
(B) imports
(C) the international value of the dollar
8. Consider a simple model of the world economy in which there are two countries: the UnitedStates and Korea. Both produce cars and computers. The labor requirements for producing eachgood are given in the following table.
Labor Hours RequiredCars Computers
United States 80 20
Korea 60 10
(A) Which nation has an absolute advantage in producing cars? Explain why.
6 Macroeconomics SAMPLE QUESTIONS SHORT FREE-RESPONSE
UNIT
(continued)

Advanced Placement Economics Macroeconomics: Student Activities © National Council on Economic Education, New York, N.Y. 329
(B) Which nation has a comparative advantage in producing cars? Explain why.
(C) Show that the nation with the comparative advantage in producing cars can gain from special-ization and trade with the other.
6 Macroeconomics SAMPLE QUESTIONS SHORT FREE-RESPONSE
UNIT
(continued)


Advanced Placement Economics Macroeconomics: Student Activities © National Council on Economic Education, New York, N.Y. 331
Sample Long Free-Response Questions1. The exchange rate between the Canadian dollar and other currencies has been free to fluctuate
since the mid-1960s. For each of the following (in some cases hypothetical) events, indicatewhether the value of the Canadian dollar in terms of the U.S. dollar will tend to appreciate, depre-ciate or remain unchanged. Explain your answer. Use a supply and demand graph to illustrateeach situation.
(A) Montreal hosts the Olympics.
(B) The rate of inflation in Canada increases relative to the U.S. inflation rate.
6 Macroeconomics SAMPLE QUESTIONS LONG FREE-RESPONSE
UNIT

332 Advanced Placement Economics Macroeconomics: Student Activities © National Council on Economic Education, New York, N.Y.
(C) Investors in Quebec purchase substantial real estate in nearby New England and New York.
(D) A consortium of U.S. oil companies constructs a pipeline in Canada to transport natural gasto the United States.
6 Macroeconomics SAMPLE QUESTIONS LONG FREE-RESPONSE
UNIT
(continued)

Advanced Placement Economics Macroeconomics: Student Activities © National Council on Economic Education, New York, N.Y. 333
(E) Interest rates rise in the United States relative to interest rates in Canada.
(F) New York and New England utilities contract to buy electricity from Canada’s James Riverhydroelectric facility.
*2. The United States experiences an increase in exports because of changes in the tastes and prefer-ences of foreigners for United States goods. As a result, the following occur:
■ The real gross domestic product rises by 3 percent.
■ The inflation rate rises from 5 percent annually to 10 percent annually.
■ The level of unemployment drops from 7 percent to 5 percent.
(A) Use aggregate demand and supply analysis to explain what has happened in the economy.
(B) Suppose the Federal Reserve decides to sell bonds in the open market. Analyze the short-runeffects of this action on each of the following.
(i) Interest rates
(ii) Output and employment
(iii) Prices
6 Macroeconomics SAMPLE QUESTIONS LONG FREE-RESPONSE
UNIT
(continued)
* Actual free-response question from a past AP test. Reprinted by permission of the College Entrance Examination Board, the copy-right owner. For limited use by NCEE.
334 Advanced Placement Economics Macroeconomics: Student Activities © National Council on Economic Education, New York, N.Y.
(C) Explain the effects of the change in interest rates caused by the Federal Reserve’s action in (B)on each of the following.
(i) The international value of the dollar
(ii) Imports
(iii) Exports
(D) Now the federal government increases taxes while keeping its expenditures unchanged. Ana-lyze the short-run effects of this action on each of the following.
(i) Output and employment
(ii) Prices
(iii) Interest rates
6 Macroeconomics SAMPLE QUESTIONS LONG FREE-RESPONSE
UNIT
(continued)

Advanced Placement Economics Macroeconomics: Student Activities © National Council on Economic Education, New York, N.Y. 335
*3. A series of natural disasters occurs that causes the following changes in the U.S. economy:
■ The real gross domestic product drops by 4 percent.
■ The inflation rate rises from 5 percent to 10 percent.
■ Unemployment increases from 6 percent to 10 percent.
(A) Use aggregate demand and supply analysis to explain what has happened in the economy.
(B) Suppose that the federal government, holding taxes constant, increases its spending and theFederal Reserve increases its purchases of bonds. Explain in detail the short-run effects ofthese actions on each of the following:
(i) Output and employment
(ii) Prices
(iii) Interest rate
(C) Explain how exports and imports will be affected by the changes in output and prices result-ing from the policies described in (B).
6 Macroeconomics SAMPLE QUESTIONS LONG FREE-RESPONSE
UNIT
(continued)
* Actual free-response question from a past AP test. Reprinted by permission of the College Entrance Examination Board, thecopyright owner. For limited use by NCEE.
336 Advanced Placement Economics Macroeconomics: Student Activities © National Council on Economic Education, New York, N.Y.
4. Suppose the European Union (EU) has decided to impose trade restrictions on agriculture andsome specific manufacturing industries. In fact, the EU has decided to subsidize some agriculturalproducts from small farmers and to increase tariffs and quotas on the following key industries:steel, telecommunications, electronics, machine tools, computers and aerospace. The EU hopesthese actions will make Europe less dependent on foreign producers for these essential goods.
(A) Which groups will gain and which will lose from these proposed restrictions?
(B) What goals do governments intend to accomplish by imposing trade restrictions?
(C) What are some of the costs that result from trade restrictions?
(D) What would be the likely impact of restrictive trade policies on the total amount of tradebetween the EU and the rest of the world?
6 Macroeconomics SAMPLE QUESTIONS LONG FREE-RESPONSE
UNIT
(continued)
Advanced Placement Economics Macroeconomics: Student Activities © National Council on Economic Education, New York, N.Y. 337
(E) Show graphically how quotas, tariffs and subsidies affect trade.
6 Macroeconomics SAMPLE QUESTIONS LONG FREE-RESPONSE
UNIT
(continued)
338 Advanced Placement Economics Macroeconomics: Student Activities © National Council on Economic Education, New York, N.Y.
5. Consider a simple model of the world economy in which there are two nations. The United Statesproduces computers and Mexico produces oil.
(A) Suppose now that the Mexican demand for computers increases while the United States’demand for oil remains unchanged. Use a graph to show what would happen to the value ofthe Mexican peso.
(B) Explain how the exchange rate changes in a flexible exchange rate system.
(C) Explain how this change in the value of the peso affects Mexico’s imports and exports.
6 Macroeconomics SAMPLE QUESTIONS LONG FREE-RESPONSE
UNIT
(continued)