Advanced reconstruction algorithms for electron tomography: From comparison to combination B. Goris a , T. Roelandts b , K.J. Batenburg b,c , H. Heidari Mezerji a , S. Bals a,n a EMAT, University of Antwerp, Groenenborgerlaan 171, B-2020 Antwerp, Belgium b Vision Lab, University of Antwerp, Universiteitsplein 1, B-2610 Wilrijk, Belgium c Centrum Wiskunde & Informatica, Science Park 123, NL-1098XG Amsterdam, The Netherlands article info Keywords: Electron tomography Total variation minimization Discrete algebraic reconstruction technique Reconstruction algorithm abstract In this work, the simultaneous iterative reconstruction technique (SIRT), the total variation minimiza- tion (TVM) reconstruction technique and the discrete algebraic reconstruction technique (DART) for electron tomography are compared and the advantages and disadvantages are discussed. Furthermore, we describe how the result of a three dimensional (3D) reconstruction based on TVM can provide objective information that is needed as the input for a DART reconstruction. This approach results in a tomographic reconstruction of which the segmentation is carried out in an objective manner. & 2012 Elsevier B.V. All rights reserved. 1. Introduction Electron tomography is a technique that enables one to obtain a three dimensional (3D) reconstruction starting from of a tilt series of two dimensional (2D) projection images acquired using a transmission electron microscope (TEM). During the last decade, electron tomography has evolved into a standard technique for 3D characterization in material science [1]. Different TEM projec- tion techniques can be extended successfully to 3D, e.g. bright field TEM [2], high angle annular dark field (HAADF) scanning transmission electron microscopy (STEM) [3], energy filtered TEM [4,5], dark field TEM [6], annular dark field TEM [7], and electron holography [8]. After alignment of the projection images, the reconstruction of a 3D volume out of its 2D projections is typically carried out using a weighted backprojection (WBP) or an iterative reconstruction algorithm. The simultaneous iterative reconstruc- tion technique (SIRT) [9] is nowadays widely used. It is known that a 3D reconstruction might suffer from so- called ‘‘missing wedge’’ artefacts. A gap in the available angular range is indeed often unavoidable because of the limited space between the polepieces of the objective lens in the electron microscope and shadowing effects at high tilt angles. The quality of the reconstruction can furthermore suffer from the fact that for specific materials only a limited number of projections can be acquired due to electron beam damage. Recently, several alter- native reconstruction algorithms have been developed. These algorithms exploit additional knowledge about the original object during the reconstruction. In this manner, both the effect of the missing wedge and the limited number of projections can be minimized leading to reconstructions with a higher fidelity in comparison to classical iterative reconstruction algorithms. The discrete algebraic reconstruction technique (DART) uses prior knowledge concerning the discrete number of grey levels of the reconstructed object [10,11]. Beside reduction of artefacts, this algorithm has the additional advantage that thresholding is already applied during the reconstruction, leading to a more straightforward quantification of the reconstruction. DART was successfully used for the 3D characterization of C nanotubes containing catalytic CuO particles [12], zeolite materials [13], and several other types of nanoparticles [10,14]. A different kind of prior knowledge is exploited when using total variation mini- mization (TVM) based reconstruction algorithms. Here, it is assumed that the object that needs to be reconstructed has a sparse gradient at the nanometer scale. This is a good assumption because, for objects at the nanoscale, it is often valid to assume that boundaries between different compounds are sharp, leading to a sparse gradient of the object. This is illustrated in Fig. 1, in which a phantom object together with its gradient image is shown. Although the image in Fig. 1a is not sparse, Fig. 1b shows that the gradient is sparse. This technique was recently used for 3D reconstructions of FeO nanoparticles [15], Au nanoparticles, PbSe–CdSe core/shell nanoparticles and Pb nanoparticles in a Si needle [16]. These novel reconstruction algorithms all have specific requirements, advantages and disadvantages. In this work, we will make a comparative study of the different reconstruction algorithms. In addition, we will combine the different algorithms in order to further improve the results. Contents lists available at SciVerse ScienceDirect journal homepage: www.elsevier.com/locate/ultramic Ultramicroscopy 0304-3991/$ - see front matter & 2012 Elsevier B.V. All rights reserved. http://dx.doi.org/10.1016/j.ultramic.2012.07.003 n Corresponding author. E-mail address: [email protected] (S. Bals). Please cite this article as: B. Goris, et al., Advanced reconstruction algorithms for electron tomography: From comparison to combination, Ultramicroscopy (2012), http://dx.doi.org/10.1016/j.ultramic.2012.07.003 Ultramicroscopy ] (]]]]) ]]]–]]]
Transcript
Ultramicroscopy ] (]]]]) ]]]–]]]
Contents lists available at SciVerse ScienceDirect
Advanced reconstruction algorithms for electron tomography: Fromcomparison to combination
B. Goris a, T. Roelandts b, K.J. Batenburg b,c, H. Heidari Mezerji a, S. Bals a,n
a EMAT, University of Antwerp, Groenenborgerlaan 171, B-2020 Antwerp, Belgiumb Vision Lab, University of Antwerp, Universiteitsplein 1, B-2610 Wilrijk, Belgiumc Centrum Wiskunde & Informatica, Science Park 123, NL-1098XG Amsterdam, The Netherlands
e cite this article as: B. Goris, embination, Ultramicroscopy (2012),
a b s t r a c t
In this work, the simultaneous iterative reconstruction technique (SIRT), the total variation minimiza-
tion (TVM) reconstruction technique and the discrete algebraic reconstruction technique (DART) for
electron tomography are compared and the advantages and disadvantages are discussed. Furthermore,
we describe how the result of a three dimensional (3D) reconstruction based on TVM can provide
objective information that is needed as the input for a DART reconstruction. This approach results in a
tomographic reconstruction of which the segmentation is carried out in an objective manner.
& 2012 Elsevier B.V. All rights reserved.
1. Introduction
Electron tomography is a technique that enables one to obtaina three dimensional (3D) reconstruction starting from of a tiltseries of two dimensional (2D) projection images acquired using atransmission electron microscope (TEM). During the last decade,electron tomography has evolved into a standard technique for3D characterization in material science [1]. Different TEM projec-tion techniques can be extended successfully to 3D, e.g. brightfield TEM [2], high angle annular dark field (HAADF) scanningtransmission electron microscopy (STEM) [3], energy filtered TEM[4,5], dark field TEM [6], annular dark field TEM [7], and electronholography [8]. After alignment of the projection images, thereconstruction of a 3D volume out of its 2D projections is typicallycarried out using a weighted backprojection (WBP) or an iterativereconstruction algorithm. The simultaneous iterative reconstruc-tion technique (SIRT) [9] is nowadays widely used.
It is known that a 3D reconstruction might suffer from so-called ‘‘missing wedge’’ artefacts. A gap in the available angularrange is indeed often unavoidable because of the limited spacebetween the polepieces of the objective lens in the electronmicroscope and shadowing effects at high tilt angles. The qualityof the reconstruction can furthermore suffer from the fact that forspecific materials only a limited number of projections can beacquired due to electron beam damage. Recently, several alter-native reconstruction algorithms have been developed. Thesealgorithms exploit additional knowledge about the original object
ll rights reserved.
t al., Advanced reconstruchttp://dx.doi.org/10.1016/j
during the reconstruction. In this manner, both the effect of themissing wedge and the limited number of projections can beminimized leading to reconstructions with a higher fidelity incomparison to classical iterative reconstruction algorithms.
The discrete algebraic reconstruction technique (DART) usesprior knowledge concerning the discrete number of grey levels ofthe reconstructed object [10,11]. Beside reduction of artefacts,this algorithm has the additional advantage that thresholding isalready applied during the reconstruction, leading to a morestraightforward quantification of the reconstruction. DART wassuccessfully used for the 3D characterization of C nanotubescontaining catalytic CuO particles [12], zeolite materials [13],and several other types of nanoparticles [10,14]. A different kindof prior knowledge is exploited when using total variation mini-mization (TVM) based reconstruction algorithms. Here, it isassumed that the object that needs to be reconstructed has asparse gradient at the nanometer scale. This is a good assumptionbecause, for objects at the nanoscale, it is often valid to assumethat boundaries between different compounds are sharp, leadingto a sparse gradient of the object. This is illustrated in Fig. 1, inwhich a phantom object together with its gradient image isshown. Although the image in Fig. 1a is not sparse, Fig. 1b showsthat the gradient is sparse. This technique was recently used for3D reconstructions of FeO nanoparticles [15], Au nanoparticles,PbSe–CdSe core/shell nanoparticles and Pb nanoparticles in a Sineedle [16].
These novel reconstruction algorithms all have specificrequirements, advantages and disadvantages. In this work, wewill make a comparative study of the different reconstructionalgorithms. In addition, we will combine the different algorithmsin order to further improve the results.
tion algorithms for electron tomography: From comparison.ultramic.2012.07.003
Fig. 1. (a) Shepp Logan phantom object and its gradient image (b). It can be seen
that the gradient image is a sparse representation of the original object.
Fig. 2. Projection geometry for tomographic experiment. The vector x represents
the imaged object with dimensions w�h. The element aij of the projection matrix
A equals the contribution of element xi to projection ray bj.
B. Goris et al. / Ultramicroscopy ] (]]]]) ]]]–]]]2
2. Advanced reconstruction algorithms
The basics of electron tomography can be explained based on1D projections of a 2D object. The extension to a 3D object isstraightforward since this object can be regarded as a set of 2Dslices. For a tomographic tilt series, N projections (each containingk pixels) are acquired at tilt angles fy1,y2, . . . ,yNg from a discre-tized object f ðu,vÞ with a width w and a height h. As noticed fromFig. 2, the projections can be seen as a matrix multiplicationbetween a projection matrix and the imaged object:
Ax¼ b: ð1Þ
Here, b is a vector representing the projections, x is a vector thatrepresents the imaged object and A is the projection matrix that isdefined in such a way that the element ai,j represents thecontribution of pixel i to projection ray j. To create a tomographicreconstruction, the unknown vector x has to be determined fromthe measurements b. This is not straightforward due to thelimited number of projections. As a result, the tomographicproblem is underdetermined. Noise and other errors in the mea-sured tilt series will also hamper the reconstruction of the imagedobject. The three reconstruction algorithms that are used in thisstudy are SIRT [9], a TVM based reconstruction algorithm [16] andDART [10].
SIRT is a reconstruction technique that is based on theRiemann backprojection principle [9]. Our SIRT implementationwill start from a first reconstruction obtained by a regular back-projection. This reconstruction is re-projected along the originaltilt angles that were used to acquire the experimental projectionimages. The re-projections are all compared simultaneously to theoriginal projections. The difference between both is calculatedand is referred to as the ‘‘projection difference’’. A reconstructionof these differences is then calculated by performing an unfilteredbackprojection of the differences, and added to the previousreconstruction. This process is iterated until convergence is reached.In practice, this method will converge after approximately 20–30iterations [17]. The SIRT algorithm that is used in the remainder ofthis work is implemented in Matlab to simplify comparison withthe other reconstruction algorithms which are also carried outthrough Matlab.
2.2. Total variation minimization reconstruction algorithm
Compressive sensing is a field in image processing that isspecialized in finding a solution to a set of ill-posed linear equationsthat has a sparse representation in some basis [18–21]. In electrontomography of nanostructured materials, it is often valid to assume
Please cite this article as: B. Goris, et al., Advanced reconstructo combination, Ultramicroscopy (2012), http://dx.doi.org/10.1016/j
that the investigated object is not sparse when represented on astandard pixel basis, but that its boundary, representing the interfacebetween different compositions, is sparse. This sparsity assumptioncan be incorporated in a tomographic reconstruction algorithm bysimultaneously minimizing the projection distance and the totalvariation (i.e. the norm of the discrete gradient) of the reconstructionobject:
x ¼ arg minx
TVðxÞþm2JAx�bJ2
2
h i: ð2Þ
Here, TV(x) represents the total variation of the object and m is aregularization parameter indicating the importance of both terms inthe equation. The last term JAx�bJ2
2 represents the projectiondistance which is a measure for the correspondence between theexperimental projection images and the reprojections of the (inter-mediate) 3D reconstruction. This equation minimizes both theprojection distance and the total variation and therefore results ina reconstruction which approximately satisfies the projection dataand has a low total variation. Due to the sparsity exploited during thereconstruction algorithm, this approach yields reconstructions inwhich missing wedge artefacts are reduced.
2.3. Discrete algebraic reconstruction algorithm
DART is an iterative algorithm that incorporates prior knowl-edge concerning the different grey levels of the imaged object.This extra knowledge is implemented by combining a continuousiterative reconstruction algorithm (such as SIRT) with discretiza-tion steps. The method starts by calculating a conventional SIRTreconstruction which is subsequently thresholded. The result is
tion algorithms for electron tomography: From comparison.ultramic.2012.07.003
B. Goris et al. / Ultramicroscopy ] (]]]]) ]]]–]]] 3
then iteratively improved by applying a sequence of boundary
reconstruction steps, intertwined with segmentation steps. In eachiteration, the current grey level image is first segmented bythresholding, to obtain a reconstruction that contains only greylevels from a pre-determined set. In this segmented image, the setof boundary pixels is determined, which consists of all pixels thatare adjacent to pixels from another segmentation class. Theseboundary pixels are then updated by the continuous iterativemethod, while keeping the remainder of the pixels fixed at theirsegmented grey levels. In this way, the number of unknowns (i.e.,the boundary pixels) is strongly reduced, resulting in a less-underdetermined reconstruction problem. In this way, the accu-racy of the boundary is improved, which results in an improvedsegmentation in the next DART iteration. It has been shown thatDART yields reconstructions that contains less (missing wedge)artefacts in comparison to a SIRT reconstruction. An additionaladvantage is that the reconstruction is already segmented leadingto a straightforward quantification of the reconstructed dataset. Aprerequisite for DART is that the expected number of grey values,as well as the actual grey levels corresponding with the differentcompositions of the sample, should be known. For the implemen-tation of the DART algorithm, both the grey values of the recon-structed object and the threshold values that are used in thereconstruction are needed as well as the percentage of non-boundary pixels that are fixed to their previous grey level. Thispercentage can be adjusted according to the noise present in theprojection images of the experimental tilt series.
3. Au nanoparticles
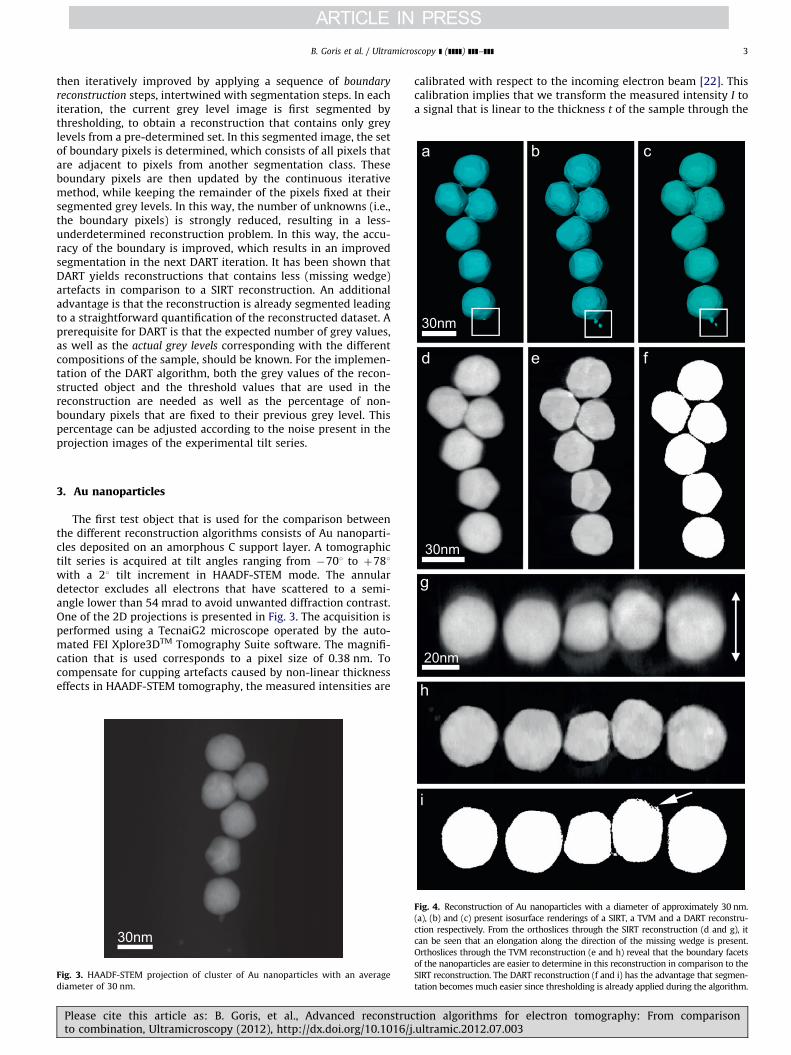
The first test object that is used for the comparison betweenthe different reconstruction algorithms consists of Au nanoparti-cles deposited on an amorphous C support layer. A tomographictilt series is acquired at tilt angles ranging from �701 to þ781with a 21 tilt increment in HAADF-STEM mode. The annulardetector excludes all electrons that have scattered to a semi-angle lower than 54 mrad to avoid unwanted diffraction contrast.One of the 2D projections is presented in Fig. 3. The acquisition isperformed using a TecnaiG2 microscope operated by the auto-mated FEI Xplore3DTM Tomography Suite software. The magnifi-cation that is used corresponds to a pixel size of 0.38 nm. Tocompensate for cupping artefacts caused by non-linear thicknesseffects in HAADF-STEM tomography, the measured intensities are
Fig. 3. HAADF-STEM projection of cluster of Au nanoparticles with an average
diameter of 30 nm.
Please cite this article as: B. Goris, et al., Advanced reconstructo combination, Ultramicroscopy (2012), http://dx.doi.org/10.1016/j
calibrated with respect to the incoming electron beam [22]. Thiscalibration implies that we transform the measured intensity I toa signal that is linear to the thickness t of the sample through the
Fig. 4. Reconstruction of Au nanoparticles with a diameter of approximately 30 nm.
(a), (b) and (c) present isosurface renderings of a SIRT, a TVM and a DART reconstru-
ction respectively. From the orthoslices through the SIRT reconstruction (d and g), it
can be seen that an elongation along the direction of the missing wedge is present.
Orthoslices through the TVM reconstruction (e and h) reveal that the boundary facets
of the nanoparticles are easier to determine in this reconstruction in comparison to the
SIRT reconstruction. The DART reconstruction (f and i) has the advantage that segmen-
tation becomes much easier since thresholding is already applied during the algorithm.
tion algorithms for electron tomography: From comparison.ultramic.2012.07.003
B. Goris et al. / Ultramicroscopy ] (]]]]) ]]]–]]]4
transformation formula:
mt¼�log 1�I
I0
� �: ð3Þ
Here, I0 corresponds to the intensity of the incoming electronbeam and m is equal to the inverse of the mean free path of theelectrons. This methodology was recently proposed in [22].Alignment of the tilt series is performed using cross-correlationavailable in the Inspect3D software.
3.1. SIRT reconstruction
First, a SIRT reconstruction of the tilt series is calculated. Anisosurface rendering together with two orthogonal slices throughthe reconstruction are presented in Fig. 4a, d and g respectively.Orthoslices through the reconstruction along the direction of themissing wedge (Fig. 4g) reveal an elongation, which is indicated bythe white arrow. Such elongation is expected for a SIRT reconstruc-tion based on the tilt range used in this study. It must be noted thatthe small Au particles (encircled in Fig. 4a–c) having a diameter of5 nm cannot be observed in the SIRT reconstruction, although theyare present in all projection images of the tilt series.
3.2. TVM reconstruction
Next, a TVM reconstruction is performed using the same tiltseries. The regularization parameter m that describes the weightof the variation regularization term equals 0.5. The result of thisreconstruction is presented in Fig. 4b, e and h. Fig. 4b correspondsto an isosurface rendering and Fig. 4e and h shows orthoslicesthrough the reconstruction. From the isosurface rendering, itappears that the small Au particles (encircled in Fig. 4b) arereconstructed well. From the orthoslices, it can be seen that theelongation along the direction of the missing wedge is reduced incomparison to the SIRT reconstruction. Moreover, also the sidefacets that compose the morphology of the Au nanoparticles arebetter defined in the TVM reconstruction. In both the SIRT andTVM reconstruction, intensity variations in the nanoparticles canbe observed, which are caused by residual diffraction contrast inthe original projections.
a
Fig. 5. (a) HAADF-STEM projection of cluster of PbSe–CdSe nanoparticles with an av
confirming the core–shell structure of the nanoparticles.
Please cite this article as: B. Goris, et al., Advanced reconstructo combination, Ultramicroscopy (2012), http://dx.doi.org/10.1016/j
3.3. DART reconstruction
Finally, a DART reconstruction of the Au nanoparticles iscreated. The intensity values used in this DART reconstructionare obtained by inspecting the grey values of the previous SIRTand TVM reconstructions. An isosurface rendering of the recon-struction is shown in Fig. 4c and Fig. 4f and i presents twoorthoslices through the reconstruction. For the isosurface render-ings, the same threshold values are used for the SIRT, TVM andDART reconstructions. No elongation in the direction of themissing wedge is observed and it can be seen that the side facetsof the nanoparticles are clearly defined. Also for DART, thesmallest particles can be observed in the isosurface rendering ofthe final reconstruction. An extra advantage of this DART recon-struction is that the segmentation is carried out during thereconstruction algorithm. It must be noted that the intensityvariations in the nanoparticles do not appear in the DARTreconstruction due to the specific nature of the algorithm. How-ever, the residual diffraction contrast that is present in theprojections may hamper the correct estimation of the boundariesleading to small artefacts as indicated by a white arrow in Fig. 4i.
4. CdSe/PbSe core/shell nanoparticles
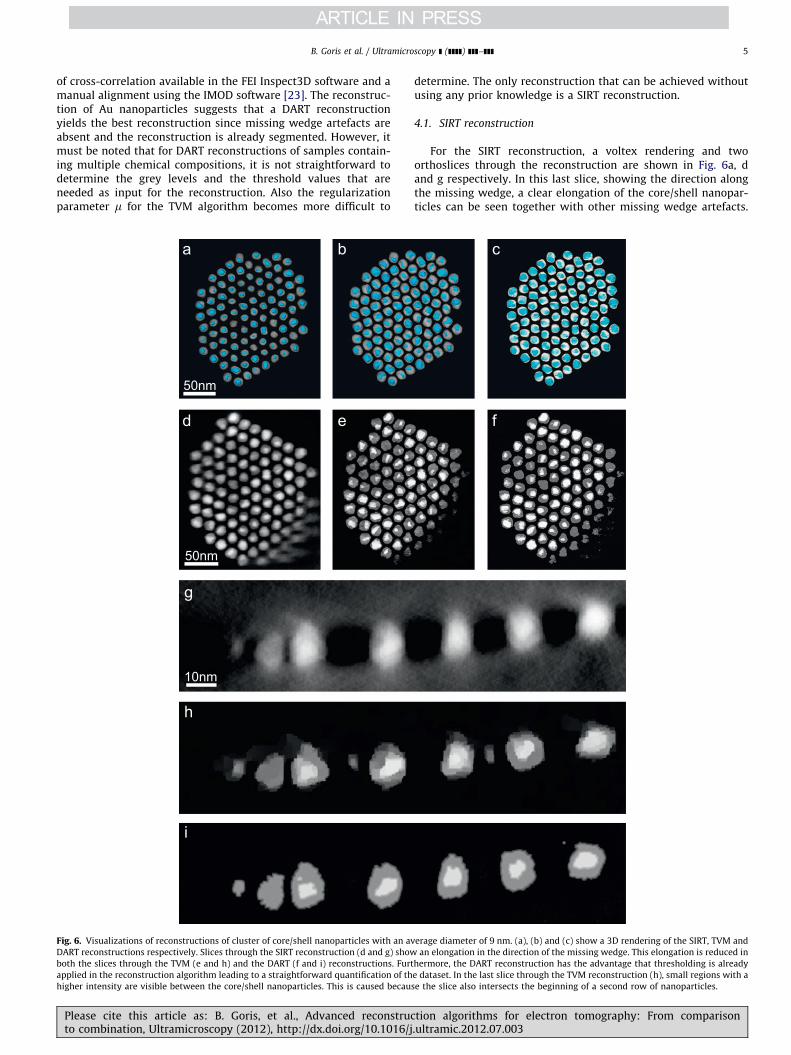
The second test sample contains PbSe/CdSe core/shell nano-particles having an average diameter of 9 nm and being dispersedon a C support. A tilt series of a particle assembly is acquired withan angular range from �701 to þ781 and a tilt increment of 21 inHAADF-STEM mode. A semi-inner collection angle of 56 mrad isused to avoid diffraction contrast. The acquisition is performed ata cubed FEI TITAN microscope using a Fischione tomography tiltholder operated by the FEI Xplore3D software. The pixel size usedduring the acquisition of the tilt series equals 1.36 nm. This islarger in comparison to the full width half maximum (FWHM) ofthe STEM probe (71.2 A). This means that the pixel size will bethe limiting factor in the reconstruction. The projection acquiredat 01 tilt angle is presented in Fig. 5a. High resolution HAADF-STEM images confirming the core–shell structure are presented inFig. 5b and c. Alignment of the tilt series is done by a combination
b
c
erage diameter of 9 nm. (b) and (c) show high resolution HAADF-STEM images
tion algorithms for electron tomography: From comparison.ultramic.2012.07.003
B. Goris et al. / Ultramicroscopy ] (]]]]) ]]]–]]] 5
of cross-correlation available in the FEI Inspect3D software and amanual alignment using the IMOD software [23]. The reconstruc-tion of Au nanoparticles suggests that a DART reconstructionyields the best reconstruction since missing wedge artefacts areabsent and the reconstruction is already segmented. However, itmust be noted that for DART reconstructions of samples contain-ing multiple chemical compositions, it is not straightforward todetermine the grey levels and the threshold values that areneeded as input for the reconstruction. Also the regularizationparameter m for the TVM algorithm becomes more difficult to
Fig. 6. Visualizations of reconstructions of cluster of core/shell nanoparticles with an av
DART reconstructions respectively. Slices through the SIRT reconstruction (d and g) show
both the slices through the TVM (e and h) and the DART (f and i) reconstructions. Furt
applied in the reconstruction algorithm leading to a straightforward quantification of th
higher intensity are visible between the core/shell nanoparticles. This is caused becaus
Please cite this article as: B. Goris, et al., Advanced reconstructo combination, Ultramicroscopy (2012), http://dx.doi.org/10.1016/j
determine. The only reconstruction that can be achieved withoutusing any prior knowledge is a SIRT reconstruction.
4.1. SIRT reconstruction
For the SIRT reconstruction, a voltex rendering and twoorthoslices through the reconstruction are shown in Fig. 6a, dand g respectively. In this last slice, showing the direction alongthe missing wedge, a clear elongation of the core/shell nanopar-ticles can be seen together with other missing wedge artefacts.
erage diameter of 9 nm. (a), (b) and (c) show a 3D rendering of the SIRT, TVM and
an elongation in the direction of the missing wedge. This elongation is reduced in
hermore, the DART reconstruction has the advantage that thresholding is already
e dataset. In the last slice through the TVM reconstruction (h), small regions with a
e the slice also intersects the beginning of a second row of nanoparticles.
tion algorithms for electron tomography: From comparison.ultramic.2012.07.003
Fig. 7. Grey level histograms of the SIRT (a), TVM (b) and DART (c) reconstruction.
From the TVM and the DART reconstruction, the grey levels corresponding to the
core and to the shell can be recognized. This is impossible from the first SIRT
reconstruction where also negative values are present as a consequence of noise
and other reconstruction artefacts.
Fig. 8. TVM reconstruction of slice through core/shell nanoparticles for different
regularization parameters m. It can be seen that m¼ 0:5 provides a good trade-off
between the level of high frequency details and artefact reduction in the
reconstruction.
B. Goris et al. / Ultramicroscopy ] (]]]]) ]]]–]]]6
The grey level histogram of the reconstruction is presented inFig. 7a and indicates that there is not a clear grey level corre-sponding to the core and the shell of the particles. This is anindication that segmentation of the reconstructed dataset will befar from straightforward. Although negative intensity values haveno physical meaning for electron tomography reconstructionsbased on HAADF-STEM imaging, they are often observed. Suchnegative values are the result of a combination of noise andvarious reconstruction artefacts.
4.2. TVM reconstruction
Also a TVM reconstruction of the nanoparticles is created. For adataset containing different chemical compositions and grey levels,the regularization parameter m becomes more crucial. A very highvalue of m will lead to a reconstruction resembling a SIRTreconstruction. On the other hand, an underestimation of the valueof m results in a reconstruction where noise and artefacts arereduced, but high frequency details are lost as well. A TVMreconstruction of a 2D slice through the core/shell nanoparticlesis shown in Fig. 8 where different values for the regularizationparameter m are used. The images in Fig. 8 suggest that m¼ 0:5provides a good trade-off between the level of high frequencydetails and artefact reduction in the reconstruction. An estimationof the reconstruction that was expected, can be determined fromthe previous SIRT reconstruction where no prior knowledge isrequired. A 3D visualization of the TVM reconstruction is presentedin Fig. 6b and two orthoslices through the reconstruction areshown in Fig. 6e and h. From these slices, it is clear that missing
Please cite this article as: B. Goris, et al., Advanced reconstructo combination, Ultramicroscopy (2012), http://dx.doi.org/10.1016/j
wedge artefacts are reduced in comparison to a SIRT reconstruc-tion. From the orthoslice shown in Fig. 6h, it can be seen that thepixel size is indeed the limiting resolution factor in this reconstruc-tion. Furthermore, segmentation and therefore quantificationbecomes easier since the grey levels of the different chemicalcomponents are more pronounced in this reconstruction comparedto a SIRT reconstruction. This can be seen in the histogram throughthe reconstruction displayed in Fig. 7b. From the grey levelhistogram of the reconstruction, it is clear that the grey level ofthe shell corresponds to 0.45 and the grey level of the core to 0.83.Negative intensity values are absent in the histogram of thereconstruction because during the TVM reconstruction, an addi-tional restriction is used forcing the intensity values to be positive.
4.3. DART reconstruction
Whereas it is difficult to compare the quality of reconstructions ofexperimental datasets, the previous dataset of Au nanoparticlessuggested that DART provides a reconstruction with a superiorquality in comparison to SIRT and TVM. However, an estimation ofthe grey levels is necessary for the reconstruction and this is notalways straightforward in case the investigated sample containsdifferent chemical compositions. Although the estimation of thesegrey levels can partially be automated in certain cases, obtaining the
tion algorithms for electron tomography: From comparison.ultramic.2012.07.003
B. Goris et al. / Ultramicroscopy ] (]]]]) ]]]–]]] 7
correct values can be particularly troublesome if a grey level occursonly in small regions, such as the cores in the present dataset [24]. Asan example, DART reconstructions of a slice through the core/shellnanoparticles where different grey values are used as input arepresented in Fig. 9. The threshold values that are used for thereconstruction are always chosen as the average between the twogrey levels. From this figure, it can be seen that using different greylevels as input in the algorithm results in relatively large differencesin the reconstructed slices. When inspecting the reconstructed slicesin more detail, it can be seen that a grey value of 0.45 for the shelland 0.83 for the core provides the best result. A convenient way todetermine these grey values is by inspecting the grey level histogramof the TVM reconstruction. This histogram is presented in Fig. 7b andit can be seen that the grey levels correspond indeed to 0.45 (shell)and 0.83 (core). These values can now be used as the input values fora full DART reconstruction. A 3D rendering of the resulting DARTreconstruction is shown in Fig. 6c and orthoslices are displayed inFig. 6f and i. For the isosurface renderings in Fig. 6a, b and c, the samethreshold value is used for the visualization of the SIRT, the TVM andthe DART reconstruction. From these visualizations of the reconstruc-tion, it can be seen that a DART reconstruction is again free ofmissing wedge artefacts and has the advantage that thresholding isalready applied in the algorithm leading to a more quantitative resultthan a TVM or SIRT reconstruction. A specific implementation of theDART algorithm can be used that results in a reconstruction with a
Fig. 9. DART reconstruction of slice through core/shell particles with different
threshold values. From these reconstructions, it can be seen that large differences
are present in the reconstructed slice based on the grey levels that are used as
input values.
Please cite this article as: B. Goris, et al., Advanced reconstructo combination, Ultramicroscopy (2012), http://dx.doi.org/10.1016/j
better resolution than the pixel size of the projection images [25].The histogram of the resulting DART reconstruction is shown inFig. 7c. It must be noted that this histogram is not completelydiscrete because our implementation of DART does not end with athresholding step leading to multiple grey levels at the boundaries ofthe reconstruction. An additional segmentation step has no visualinfluence on the reconstruction, but will result in a discrete histo-gram with only three nonzero intensities. Since we were unable toseparate the intensities of the C support and the vacuum in the TVMreconstruction, the Csupport is not taken into account in thediscretization process of the DART reconstruction. Using an addi-tional grey level that corresponds to the amorphous C support doesnot improve the quality of the reconstruction.
5. Discussion
Three different tomographic reconstruction algorithms (SIRT,TVM and DART) are applied to two different experimentaldatasets. First, a reconstruction is made from a tilt series of Aunanoparticles with a diameter of approximately 30 nm. Based onthe reconstructions, it is shown that all the algorithms are capableof creating a fairly good reconstruction of the morphology of thenanoparticles. A TVM reconstruction has the advantage thatmissing wedge artefacts are reduced in comparison to a SIRTreconstruction. The major advantage of a DART reconstruction incomparison to SIRT and TVM is that the segmentation is appliedduring the reconstruction leading to an easier quantification ofthe reconstructed dataset. The reconstruction of a second datasetof CdSe/PbSe core/shell nanoparticles with an average diameter of9 nm shows that combining the information obtained from thereconstructions can lead to a beneficial situation. From a first SIRTreconstruction, the main morphology of the reconstructed datasetcan be estimated and based on this knowledge, the regularizationparameter m can be determined that is needed as an input for aTVM reconstruction. This TVM reconstruction is easier to segmentin comparison to a SIRT reconstruction leading to an optimizedestimation of the grey levels necessary for a DART reconstructionwhere quantitative information can easily be obtained. Whereasthis method results in an objective determination of the greylevels that are needed as an input for a DART algorithm, webelieve that further progress can be made in optimizing thethreshold values that are needed as well. This approach wherethe result of one reconstruction provides the input of a secondreconstruction is shown in the flowchart presented in Fig. 10.
Fig. 10. Flowchart of tomographic reconstruction algorithms. This scheme indi-
cates that the result of one reconstruction algorithm can provide the required
input for the following reconstruction.
tion algorithms for electron tomography: From comparison.ultramic.2012.07.003
B. Goris et al. / Ultramicroscopy ] (]]]]) ]]]–]]]8
6. Conclusions
In this work, three tomographic reconstruction algorithms arecompared and the advantages and disadvantages are discussed.Furthermore, it is shown that a SIRT reconstruction can serve as astarting point for determining the correct regularization parameterin a TVM reconstruction. Next, the thresholded intensities fromthis TVM reconstruction serve as the grey values that are requiredin a DART reconstruction. By using this scheme, a reconstructioncan be obtained where missing wedge artefacts are reduced andfrom which quantitative information can be extracted.
Acknowledgement
The work was supported by the Flemish Fund for ScientificResearch (FWO Vlaanderen) through project fundings and a PhDresearch grant to B. Goris. K.J. Batenburg kindly acknowledgesfinancial support from the Netherlands Fund for Scientific Research(NWO) (Project number 639.072.005). The authors acknowledgefinancial support from the European Union under the SeventhFramework Program (Integrated Infrastructure Initiative N. 262348European Soft Matter Infrastructure, ESMI). We also thank H.Terryn, J. Ustarroz, A. Hubin, M. Casavola, and D. Vanmaekelberghfor provision of the samples.
References
[1] P.A. Midgley, R. Dunin-Borkowski, Electron tomography and holography inmaterials science, Nature Materials 8 (2009) 271–280.
[2] A. Koster, U. Ziese, A. Verkleij, A. Janssen, K. De Jong, Three-dimensionaltransmission electron microscopy: a novel imaging and characterizationtechnique with nanometer scale resolution for materials science, Journal ofPhysical Chemistry B 104 (2000) 9368–9370.
[3] P.A. Midgley, M. Weyland, 3D electron microscopy in the physical sciences:the development of z-contrast and eftem tomography, Ultramicroscopy 96(2003) 413–431.
[4] G. Mobus, R. Doole, B. Inkson, Spectroscopic electron tomography, Ultra-microscopy 96 (2003) 433–451.
[5] B. Goris, S. Bals, W. Van den Broek, J. Verbeeck, G. Van Tendeloo, Exploringdifferent inelastic projection mechanisms for electron tomography, Ultra-microscopy 111 (2011) 1262–1267.
[6] J. Barnard, J. Sharp, J. Tong, P. Midgley, High-resolution three-dimensionalimaging of dislocations, Science 303 (2006) 319.
[7] S. Bals, G. Van Tendeloo, C. Kisielowski, A new approach for electrontomography: annular dark-field transmission electron microscopy, AdvancedMaterials 18 (2006) 892–895.
Please cite this article as: B. Goris, et al., Advanced reconstructo combination, Ultramicroscopy (2012), http://dx.doi.org/10.1016/j
[8] D. Wolf, A. Lubk, H. Lichte, H. Friedrich, Towards automated electronholographic tomography for 3d mapping of electrostatic potentials, Ultra-microscopy 110 (2010) 390–399.
[9] P. Gilbert, Iterative methods for the three-dimensional reconstruction of anobject from projections, Journal of Theoretical Biology 36 (1972) 105–107.
[10] K. Batenburg, S. Bals, J. Sijbers, C. Kubel, P. Midgley, J. Hernandez, U. Kaiser,E.R. Encina, E. Coronado, G. Van Tendeloo, 3D imaging of nanomaterials bydiscrete tomography, Ultramicroscopy 109 (2009) 730–740.
[11] K. Batenburg, J. Sijbers, Dart: a practical reconstruction algorithm for discretetomography, IEEE Transactions on Image Processing 20 (2011) 2542–2553.
[12] S. Bals, K. Batenburg, J. Verbeeck, J. Sijbers, G. Van Tendeloo, Quantitativethree-dimensional reconstruction of catalyst particles for bamboo-like car-bon nanotubes, Nano Letters 7 (2007) 3669–3674.
[13] S. Bals, K. Batenburg, D. Liang, O. Lebedev, G. Van Tendeloo, A. Aerts,J. Martens, C. Kirschhock, Quantitative three-dimensional modeling of zeotilethrough discrete electron tomography, Journal of the American ChemicalSociety 131 (2009) 4769–4773.
[14] S. Turner, M. Tavernier, G. Huyberechts, E. Biermans, S. Bals, K. Batenburg,G. Van Tendeloo, Assisted spray pyrolysis production and characterisation ofZnO nanoparticles with narrow size distribution, Journal of NanoparticleResearch 12 (2010) 615–622.
[15] Z. Saghi, D. Holland, R. Leary, A. Falqui, G. Bertoni, A. Sederman, L. Gladden,P. Midgley, Three-dimensional morphology of iron oxide nanoparticles withreactive concave surfaces. a compressed sensing-electron tomography (CS-ET) approach, Nano Letters 11 (2011) 4666–4673.
[16] B. Goris, W. Van den Broek, K. Batenburg, H. Mezerji, S. Bals, Electrontomography based on a total variation minimization reconstruction techni-que, Ultramicroscopy 113 (2012) 120–130.
[17] H. Mezerji, W. Van den Broek, S. Bals, A practical method to determine theeffective resolution in incoherent experimental electron tomography, Ultra-microscopy 111 (2011) 330–336.
[18] D. Donoho, For most large undetermined systems of linear equations, theminimal l1-norm solution is also the sparsest solution, Communications onPure and Applied Analysis 59 (2006) 797–829.
[19] D. Donoho, Compressed sensing, IEEE Transactions on Information Theory 52(2006) 1289–1306.
[20] E. Candes, J. Romberg, T. Tao, Stable signal recovery from incomplete andinaccurate measurements, Communications on Pure and Applied Analysis 59(2008) 1207–1223.
[21] E. Candes, M. Wakin, An introduction to compressive sampling, IEEE SignalProcessing Magazine 25 (2008) 21–30.
[22] W. Van den Broek, A. Rosenauer, B. Goris, G. Martinez, S. Bals, S. Van Aert, D.Van Dyck, Correction of non-linear thickness effects in electron tomography,Ultramicroscopy 116 (2012) 8–12.
[23] J. Kremer, D. Mastronarde, J. McIntosh, Computer visualization of three-dimensional image data using imod, Journal of Structural Biology 116 (1996)71–76.
[24] K. Batenburg, W. van Aarle, J. Sijbers, A semi-automatic algorithm for greylevel estimation in tomography, Pattern Recognition Letters 32 (2011)1395–1405.
[25] W. Van Aarle, G. Van Gompel., K. Batenburg, E. Vande Casteele, J. Sijbers, A3-dimensional discrete tomography approach for superresolution micro-CTimages: application to foams, in: F. Noo (Ed.), The First InternationalConference on Image Formation in X-ray Computed Tomography, 2010,pp. 45–48.
tion algorithms for electron tomography: From comparison.ultramic.2012.07.003