15
Advanced Scientific Visualization Lumberton High Sci Vis II V202.04
| Date post: | 03-Jan-2016 |
| Category: |
Documents |
| Upload: | beatrix-pearson |
| View: | 216 times |
| Download: | 0 times |

Advanced Scientific VisualizationLumberton HighSci Vis IIV202.04

What is Advanced SciVis?
Scientific visualization, sometimes referred to in shorthand as SciVis, is the representation of data graphically and/or visually as a means of gaining understanding and insight into the data. SciVis allows the researcher to gain insight in ways previously impossible.

Examples of SciVis
• Engineering• Simulations• Medical Imaging• Meteorology• Hydrology• Finance

Types of SciVis
• Color coding• Surface rendering• Volume rendering• Image analysis• Vector and Scalar data
analysis• Parallel projections

What is Informational Visualization?
• Informational visualization is the use of interactive graphical interfaces to display, measure, and understand large amounts of data.
• Information visualization combines the aspects of graphics, human-computer interaction, and human-information interaction.

Examples of informational Vis.
• Molecular models• CAD models• Medical imagery• 2D MAP GIS• Dynamic queries (search
capabilities)

Informational Vis. Data Types
• Linear -- (one dimensional), usually sequential lists. A typical Internet search result would be an example. This is the least complex type of visualization.• Temporal -- data uses time as the one dimension (i.e.
timelines, animations, project timelines, and video representations).

Informational Vis. Data Types
• Two dimensional -- (not to be confused with 2D representations) data is associated with geographic information systems, such as a map. • Three dimensional -- is usually
real world data, and is concerned with position and orientation. Virtual reality is an example.
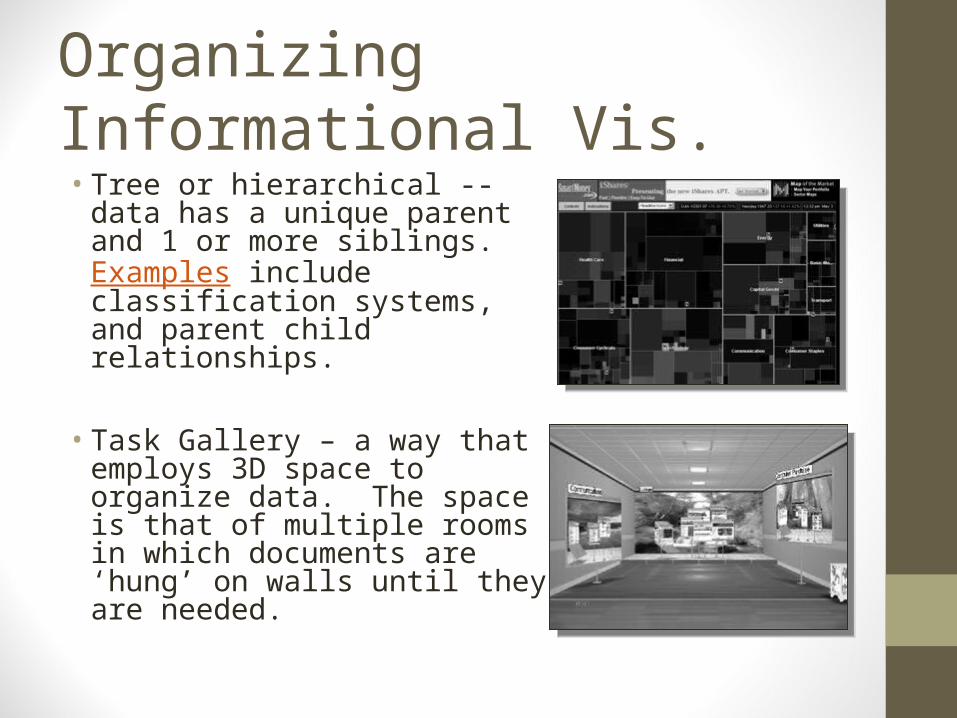
Organizing Informational Vis.• Tree or hierarchical -- data has a
unique parent and 1 or more siblings. Examples include classification systems, and parent child relationships.
• Task Gallery – a way that employs 3D space to organize data. The space is that of multiple rooms in which documents are ‘hung’ on walls until they are needed.
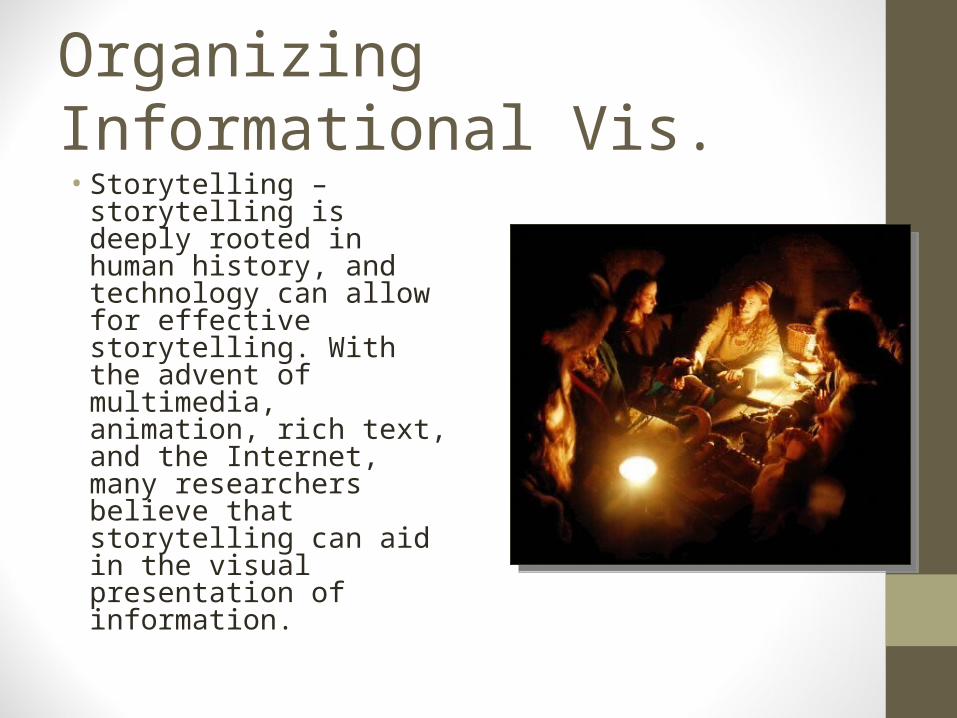
Organizing Informational Vis.• Storytelling – storytelling is
deeply rooted in human history, and technology can allow for effective storytelling. With the advent of multimedia, animation, rich text, and the Internet, many researchers believe that storytelling can aid in the visual presentation of information.

Organizing Informational Vis.
• Visual Data “Mining” -- is like an automatic changing data system. Example is a working mode of the stock market that changed continually as priced rise and fall.• SPIRE is a way to organize data in a spatial
pattern. Data fits the way the human mind works.

Different Examples of SPIRE• Galaxy Visualization -- the image
of stars in the night sky to represent a set of documents. • Theme View -- the topics or
themes within a set of documents are shown as a relief map of natural terrain. The mountains in the Theme View indicate dominant themes. The height of the peaks indicates the relative strengths of the topics in the document set.

Different Examples of SPIRE• Theme River -- helps users
identify time-related patterns, trends, and relationships across a large collection of documents. The themes in the collection are represented by a "river" that flows left to right through time. • Fractal Projections -- Information
is organized and viewed as fractal spaces.

Different Examples of SPIRE
Catch -- Computer Aided Tracking and Characterization of Homicides is a collection of tools that assist the crime analyst in the investigation process.

The End


