Advanced ship evacuation analysis using a cell-based simulation model Myung-Il Roh a, *, Sol Ha b,1 a School of Naval Architecture and Ocean Engineering, University of Ulsan, Muger2-Dong, Ulsan 680-749, Republic of Korea b Department of the Naval Architecture and Ocean Engineering, Seoul National University, Daehak-dong, Gwanak-gu, Seoul 151-744, Republic of Korea 1. Introduction 1.1. Research background Evacuation analysis should be performed for all passenger ships in accordance with Circulation 1238 (Circ. 1238) of the Interna- tional Maritime Organization (IMO) Maritime Safety Committee (MSC), entitled ‘‘Guidelines for Evacuation Analysis for New and Existing Passenger Ships,’’ a mandatory regulation issued by IMO [1]. The purpose of this regulation is to determine if the total evacuation time for a vessel is less than the allowable time according to the regulation. The maximum allowable time is 60 min for car ferry and 80 minfor regular passenger ships. The guidelines offer the possibility of using two distinct methods for evacuation analysis: simplified evacuation analysis and advanced evacuation analysis. Simplified evacuation analysis is a determin- istic method in which the total evacuation time is calculated using a simple hydraulic scheme by considering that all passengers have identical characteristics. The total evacuation time can be calculated using a simple formula provided by IMO, and the results should be submitted to the ship owner and the classification society. On the other hand, advanced evacuation analysis is a stochastic method in which the total evacuation time is estimated using a microscopic approach by considering each characteristic of each passenger. In this analysis method, the total evacuation time is estimated via computer-based simulations that represent each passenger and the detailed layout of the vessel. Advanced evacuation analysis is currently not mandatory but is expected to be required in the future. Thus, a study on an advanced evacuation analysis was performed here. 1.2. Related works Recently, researchers applied various approaches to study crowd evacuation under various situations, sometimes using such approaches separately or combining them. Cellular automata models for evacuation analysis are reviewed below. Emergent evacuation is a system composed of many pedes- trians characterized by strong interactions and environments. People want to move faster than usual in an emergent evacuation. The local interactions among pedestrians and those between pedestrians and the environment (e.g., a wall or a door) determine the global behavior of pedestrians. Various simulation models have been proposed to study the dynamics of evacuation. To simulate evacuation situations, it is important to comprehend the factors that affect passenger behavior, and to create a passenger behavior model that considers such factors. Helbing and Molnar [2] and Helbing et al. [3] proposed a social force model for pedestrians’ continuous motion. In this model, pedestrians are treated as particles subject to long-range forces induced by the social behavior of individuals. The movement of pedestrians can be Computers in Industry 64 (2013) 80–89 A R T I C L E I N F O Article history: Received 22 December 2011 Received in revised form 13 August 2012 Accepted 16 October 2012 Available online 10 November 2012 Keywords: Ship evacuation analysis Cell-based simulation model Combined discrete event and a discrete time simulation Car ferry A B S T R A C T Advanced ship evacuation analysis is one of stochastic methods in which the total evacuation time is calculated via computer-based simulations, by considering each passenger’s characteristics (e.g., age, gender, etc.) and the detailed layout of the ship. In this study, simulations for advanced evacuation analysis using a cell-based simulation model are performed. The cell-based simulation model divides the space in a uniform grid, ‘‘cell’’. Each passenger in the ship is located in a cell and moves to another cell according to a set of local rules that are supposed to be associated with the individual, crowd, and counterflow-avoiding behavior of the passengers. These behavior patterns are implemented as the local rules and are assigned to each cell. Each cell was implemented using a combined discrete event and a discrete time simulation model that represents different variables of the local rules. To verify the applicability of the advanced ship evacuation analysis, it was applied to 11 tests specified in the IMO/ MSC/Circ. 1238, and the result shows that all the requirements of such tests had been met. Finally, the analysis was applied to a car ferry having 2487 persons. ß 2012 Elsevier B.V. All rights reserved. * Corresponding author. Tel.: +82 52 259 2165; fax: +82 52 259 2836. E-mail addresses: [email protected](M.-I. Roh), [email protected](S. Ha). 1 Tel.: +82 2 880 8378; fax: +82 2 886 4920. Contents lists available at SciVerse ScienceDirect Computers in Industry jo ur n al ho m epag e: ww w.els evier .c om /lo cat e/co mp in d 0166-3615/$ – see front matter ß 2012 Elsevier B.V. All rights reserved. http://dx.doi.org/10.1016/j.compind.2012.10.004
Transcript
Computers in Industry 64 (2013) 80–89
Advanced ship evacuation analysis using a cell-based simulation model
Myung-Il Roh a,*, Sol Ha b,1
a School of Naval Architecture and Ocean Engineering, University of Ulsan, Muger2-Dong, Ulsan 680-749, Republic of Koreab Department of the Naval Architecture and Ocean Engineering, Seoul National University, Daehak-dong, Gwanak-gu, Seoul 151-744, Republic of Korea
A R T I C L E I N F O
Article history:
Received 22 December 2011
Received in revised form 13 August 2012
Accepted 16 October 2012
Available online 10 November 2012
Keywords:
Ship evacuation analysis
Cell-based simulation model
Combined discrete event and a discrete
time simulation
Car ferry
A B S T R A C T
Advanced ship evacuation analysis is one of stochastic methods in which the total evacuation time is
calculated via computer-based simulations, by considering each passenger’s characteristics (e.g., age,
gender, etc.) and the detailed layout of the ship. In this study, simulations for advanced evacuation
analysis using a cell-based simulation model are performed. The cell-based simulation model divides the
space in a uniform grid, ‘‘cell’’. Each passenger in the ship is located in a cell and moves to another cell
according to a set of local rules that are supposed to be associated with the individual, crowd, and
counterflow-avoiding behavior of the passengers. These behavior patterns are implemented as the local
rules and are assigned to each cell. Each cell was implemented using a combined discrete event and a
discrete time simulation model that represents different variables of the local rules. To verify the
applicability of the advanced ship evacuation analysis, it was applied to 11 tests specified in the IMO/
MSC/Circ. 1238, and the result shows that all the requirements of such tests had been met. Finally, the
analysis was applied to a car ferry having 2487 persons.
� 2012 Elsevier B.V. All rights reserved.
Contents lists available at SciVerse ScienceDirect
Computers in Industry
jo ur n al ho m epag e: ww w.els evier . c om / lo cat e/co mp in d
1. Introduction
1.1. Research background
Evacuation analysis should be performed for all passenger shipsin accordance with Circulation 1238 (Circ. 1238) of the Interna-tional Maritime Organization (IMO) Maritime Safety Committee(MSC), entitled ‘‘Guidelines for Evacuation Analysis for New andExisting Passenger Ships,’’ a mandatory regulation issued by IMO[1]. The purpose of this regulation is to determine if the totalevacuation time for a vessel is less than the allowable timeaccording to the regulation. The maximum allowable time is60 min for car ferry and 80 minfor regular passenger ships. Theguidelines offer the possibility of using two distinct methods forevacuation analysis: simplified evacuation analysis and advancedevacuation analysis. Simplified evacuation analysis is a determin-istic method in which the total evacuation time is calculated usinga simple hydraulic scheme by considering that all passengershave identical characteristics. The total evacuation time can becalculated using a simple formula provided by IMO, and the resultsshould be submitted to the ship owner and the classificationsociety. On the other hand, advanced evacuation analysis is astochastic method in which the total evacuation time is estimated
0166-3615/$ – see front matter � 2012 Elsevier B.V. All rights reserved.
http://dx.doi.org/10.1016/j.compind.2012.10.004
using a microscopic approach by considering each characteristic ofeach passenger. In this analysis method, the total evacuation timeis estimated via computer-based simulations that represent eachpassenger and the detailed layout of the vessel. Advancedevacuation analysis is currently not mandatory but is expectedto be required in the future. Thus, a study on an advancedevacuation analysis was performed here.
1.2. Related works
Recently, researchers applied various approaches to studycrowd evacuation under various situations, sometimes using suchapproaches separately or combining them. Cellular automatamodels for evacuation analysis are reviewed below.
Emergent evacuation is a system composed of many pedes-trians characterized by strong interactions and environments.People want to move faster than usual in an emergent evacuation.The local interactions among pedestrians and those betweenpedestrians and the environment (e.g., a wall or a door) determinethe global behavior of pedestrians. Various simulation modelshave been proposed to study the dynamics of evacuation. Tosimulate evacuation situations, it is important to comprehend thefactors that affect passenger behavior, and to create a passengerbehavior model that considers such factors. Helbing and Molnar [2]and Helbing et al. [3] proposed a social force model for pedestrians’continuous motion. In this model, pedestrians are treated asparticles subject to long-range forces induced by the socialbehavior of individuals. The movement of pedestrians can be
Fig. 1. Interaction radius (Ri) for the crowd and counterflow-avoiding behavior.
M.-I. Roh, S. Ha / Computers in Industry 64 (2013) 80–89 81
described with a main function, which determines the physical andsocial forces, and the induced velocity changes. The social forcemodel is determined by the acceleration equation. In recent years,social force models were further developed to study crowdevacuation [4,5]. Referring to these social forces, Cho et al. [6]and Cho [7] modeled passenger behavior as velocity-based, takinginto account different aspects of human behavior in an evacuation.They suggested that passenger behavior consists of individual,crowd, and counterflow-avoiding behavior. Using this model, theydeveloped an advanced evacuation analysis program for passengerships. This program was verified with the 11 tests specified in IMOMSC/Circ. 1238 and was applied to a car ferry.
Cellular automata models have also been developed to studycrowd evacuation under various situations. A cellular automatamodel quantifies the evacuation area in terms of discrete cells.Each cell can be empty or occupied by a pedestrian or an obstacleobject. A pedestrian can move to an empty neighboring cell in eachtime step. Cellular automata models can be classified into twocategories. The first category is based on the interactions betweenenvironments and pedestrians. For example, Zhao et al. [8]proposed a two-dimensional cellular automata random model tostudy the exit dynamics of occupant evacuation. Song et al. [9] andYu and Song [10] proposed a cellular automata model without astep back to simulate the pedestrian counterflow in a channelconsidering the surrounding environment. These models demon-strate that various environments, such as the exit width andobstacles, have an impact on the pedestrian movement. The secondcategory is based on the interaction among pedestrians. Kirchneret al. [11] proposed a cellular automata model for pedestriandynamics with friction to simulate competitive egress behavior.Kirchner and Schadschneider [12] proposed a bionics-inspiredcellular automata model to describe the interaction among thepedestrians and to simulate evacuation from a large room with oneor two doors. Additionally, Weng et al. [13] proposed a cellularautomata model without as with different walking velocities. Asmentioned above, the observed phenomena that occur duringevacuations have been reproduced by these models in the last fewyears. Due to the complex rules of the social-force model, it doesnot offer good calculation efficiency. On the other hand, cellularautomata models are discrete in space, time, and state variables.This makes the models ideally suited for large-scale computersimulation. As the advanced evacuation analysis for passengerships is intended for thousands of passengers, the cellularautomata model was adopted in terms of its performance.Therefore, the three passenger behaviors proposed by Cho et al.[6] and Cho [7] were modeled as cellular automata in this study.
The rest of this paper is as follows. Section 2 presents cell-basedrules for human behavior in a passenger ship. Section 3 shows howto model cell-base passenger behavior. In Section 4, the results of11 tests in IMOMSC/Circ. 1238 are explained to verify thepassenger behavior model. In Section 5, advanced evacuationanalysis for a car ferry is performed and the result is compared withthe commercial evacuation analysis program, Evi. Finally, Section 6presents the conclusions and future directions.
2. Human behavior modeling
As mentioned earlier, the passenger behavior proposed by Choet al. [6] and Cho [7] modeled passenger behavior based onvelocity. To improve performance of evacuation analysis, thismodel was converted into a cellular automata model.
This section focuses on passenger behavior, specifically statetransition of the passenger flow during an evacuation, and therelationship between the passengers. The two-dimensional cellu-lar automata model and the continuous passenger behaviorproposed by Cho et al. and Cho, respectively, were used. Generally,
the passengers try to move quickly toward the exits, avoidcolliding with one another, and sometimes go with the crowdduring an evacuation. These can be characterized by discreteindividual, crowd, and counterflow-avoiding behavior, whichindicate various interactions, including position attraction, sepa-ration caused by the surrounding passengers, and movementdirection. A network of cells was applied in this study. Each cellwas 0.4 m � 0.4 m big, which is the typical space occupied by apassenger in a dense crowd. Therefore, each cell can either beempty or occupied by only one passenger. The cell is allowed to bein only one of the following three main states at any time: empty,occupied, and obstacle. Individuals may have various walkingspeeds according to their age and gender. IMO MSC/Circ. 1238recommended a walking speed based on the age and gender. In thisstudy, 0.8 m/s is adopted as the average walking speed, which is atypical value in a dense crowd. Thus, a one time-step in the modelcorresponds to 0.5 s according to the size of each cell. The change inthe walking speed with the crowd density during an evacuation isnot considered.
In a von Neumann neighborhood, four directions are taken intoaccount: up, down, left, and right; whereas in a Moore neighbor-hood, eight directions, including diagonal directions, are consid-ered. Although a Von Neumann [14] neighborhood is simpler, it isnot as accurate as a Moore neighborhood. In this study, the Mooreneighborhood is adopted to determine the movement direction ofoccupants because eight directions can more accurately describethe movement of evacuees. Before describing the passengerbehavior, the interaction radius (Ri) is introduced. Particles makejudgments after collecting information on an area within the Ri
cells around the current position of the passenger. Take Ri = 1 as anexample in Fig. 1(a). The particles will look at 8 [=(Ri � 2 + 1)2 � 1]cells; i.e., all the cells around, except for the central one, before thepassenger decides which way to move.
The passenger behavior rules for evacuation deal withmovement to the destination, interaction between passengers,and interaction between passengers in different directions. Theserules are detailed in below.
2.1. Modeling of the individual behavior
Cho [7] modeled individual behavior by sequentially definingthe walking speed and the walking direction. He determined thewalking direction by identifying the shortest-distance route to adestination using a visibility graph. When the escape route isdetermined, the walking direction can be found along the escaperoute. A combination of the visibility graph and the Dijkstraalgorithm was used to calculate the shortest-distance route to adestination, considering the obstacle in the compartment. This
6v
5v
3v
2v
4v
Publ ic
Space # 1
Publ ic
Space #2
Corrido r #1
Corr idor #2
Obstacle #1
Obstacle #1
P1P1
Destinatio n
Dv Dv
5v
3v
2v
4vPv Obstacle
#1P1
5v
3v
2v
4v
Obstacle #1
P1Dv Dv
(b)(a)
(d)(c)
1
2
32
2.5
2.5 0.5
2
5
5
3 3 5
3.5
distan ce
Fig. 2. Steps in calculating the shortest distance. (a) Create the vertices of the graph. (b) Bond the vertices with lines that are visible to one another. (c) Determine the shortest-
distance route in the graph. (d) Calculate the shortest distance.
9.4 8.4 9.4 8.4 7.4 7.0 7.0 7.4 8.4 9.4
8.4 7.4 8.4 7.4 6.4 6.0 6.0 6.4 7.4 8.4
7.4 6.4 7.4 6.4 5.4 5.0 5.0 5.4 6.4 7.4
6.4 5.4 4.0 4.0 4.4 5.4 6.4
5.4 4.4 3.4 3.0 3.0 3.0 3.0 3.4 4.4 5.4
4.4 3.4 2.4 2.0 2.0 2.0 2.0 2.4 3.4 4.4
3.4 2.4 1.4 1.0 1.0 1.0 1.0 1.4 2.4 3.4
3.0 2.0 1.0 0.0 0.0 0.0 0.0 1.0 2.0 3.0
Exit
Wall
: Obstacle
Shortest
distance
to the exit
(-1, 1)
4.4
-2.0
(0, 1)
3. 4
-1.0
(1, 1)
3.0
-0.6
(-1, 0)
3.4
-1.0
(0, 0)
2.4(1, 0)
2.0
0.4
(-1 , -1)
2.4
0.0
(0, -1)
1.4
1.0
(1, -1)
1.0
1.4
Cell index with reference to
the current cell
Adjacent cell’s shortest
distance to the exit ( )
Individual behavior score
( )
Current cell’sshortest distance
to the exit ( )
Fig. 3. Shortest-distance grid for the simple compartment.
M.-I. Roh, S. Ha / Computers in Industry 64 (2013) 80–8982
study calculates the shortest distance to the destination usingthese combined algorithms.
The steps in calculating the shortest distance using a visibilitygraph are summarized as follows (Fig. 2).
(1) Create the vertices at the center of the door, at the corners ofthe obstacles, and at the center of the passengers (see Fig. 2(a)).
(2) Bond the vertices with lines that are visible to one another, andmake a graph (see Fig. 2(b)).
(3) Determine the shortest-distance route in the graph using theDijkstra algorithm (see Fig. 2(c)), and calculate the shortestdistance to the final destination (see Fig. 2(d)).
As described above, calculating the shortest distance consider-ing the visibility of the passenger means determining the shortestdirection by creating a new visibility graph for each time unit. Asthis is a very expensive and time-consuming procedure forthousands of passengers, however, the compartments are dis-cretized into cells, and the representative shortest distance foreach cell is determined and stored in cells in advance to start anevacuation analysis, as shown in Fig. 3.
The cell index with reference to the current cell is shown inFig. 3. The cell index is defined as a vector (i, j), wherein the firstcomponent i is increased by 1 for each step from left to right, and j,for each step from down to up.
After the shortest distance of each cell is calculated, the scorefor the individual behavior Iij is calculated using Eq. (1). Theindividual behavior score does not evolve with time and does notchanged with the presence of passengers.
Ii j ¼ Dcurrent � Di j (1)
In the equation above, Dcurrent is the shortest distance from thecurrent cell to the exit, and Dij is the shortest distance from theneighbor cell (i, j) of Dcurrent to the exit.
2.2. Modeling of the crowd behavior
This section describes the crowd behavior that causes theinteraction among the passengers. During an evacuation,passengers tend to act together with other passengers. Forexample, passengers want to use the same exit used by otherpassengers even though there are other exits. The flock
algorithm suggested by Reynolds [15,16] and Hartman andBenes [17] is used for modeling passengers’ flock behavior. Flockbehavior is a result of the motion and interaction of passengers.Each passenger has three local rules of behavior: separation,cohesion, and alignment.
2.2.1. Modeling of the separation behavior
Each passenger in a crowd tends to avoid collision with hisneighbors. This tendency is called separation or collision avoid-ance, which signifies efforts to avoid overcrowding local neighbors.The separation vector is simply calculated with the index of eachcell that is occupied by a passenger.
Exit
(-2, 2) (- 1, 2) (0 , 2)
(0, -0.5)
(1, 2) (2, 2)
(-2, 1) (- 1, 1) (0 , 1) (1, 1)
(-0. 5,-0.5)
(2, 1)
(-2, 0) (-1, 0)
(1, 0)
(0, 0) (1, 0) (2, 0)
(-2, -1 ) (- 1, -1)
(0.5, 0.5)
(0, -1) (1, -1) (2, -1)
(-2, -2 ) (-1, -2 )
(0.2, 0.4)
(0, -2 )
(0, 0.5)
(1, -2)
(-0.2, 0.4)
(2, -2 )
Wall
: obst acle
: passen ger
: occ upi ed cell
: cu rrent ce ll
(-1, -2 )
(0.2, 0.4)
(a) Cell position vector
with re fere nce to the curr ent cell
Separating vect or
/(-1, 1)
-0.021
(0, 1)
0.110
(1, 1)
0.176(-1, 0)
-0.140
(0, 0)
(0. 14, 0.1 1)
(1, 0)
0.140(-1, -1)
-0.176
(0, -1)
-0.110
(1 , -1)
0.021
Average separating
vector for separat ion
beh avior
1Separation beh avior score
/
(b)
(c)
(d)
Fig. 4. Example of the calculation of the separation behavior score of the neighbor
cells.
Exit
(-2, 2) (-1, 2) (0, 2) (1, 2) (2 , 2)
(-2, 1) (-1, 1) (0, 1) (1, 1) (2 , 1)
(-2, 0) (-1, 0) (0, 0) (1, 0) (2 , 0)
(-2, -1) (-1 , -1) (0, -1 ) (1, -1 ) (2, -1)
(-2, -2) (-1 , -2) (0, -2 ) (1, -2 ) (2, -2)
Wall
: obsta cle
: passenger
: occ upied cell
: cur rent cell
(-1, -2)
(a) Cell position vector
with re feren ce to the c urren t cell
(-1, 1)
-0.304
(0, 1)
-0.570
(1, 1)
-0.502(-1, 0)
0.140
(0, 0)
(-0. 14,-0.57 )
(1, 0)
-0.140(-1, -1)
0.502
(0, -1 )
0.57 0
(1, -1 )
0.30 4
Center of crow d
(average of
position vecto r)
1Cohesion behavior sc ore
/
(b)
(c)
Fig. 5. Sample calculation of the cohesion behavior score of the neighbor cells.
M.-I. Roh, S. Ha / Computers in Industry 64 (2013) 80–89 83
As shown in Fig. 4, the interaction range Ri was considered as 2.The current cell (0, 0) has 24 adjacent cells because the interactionrange Ri is 2 and has seven occupied cells in Fig. 4. Each cell’sposition vector vP,ij with reference to the current cell, is the same asthe cell index (see Fig. 4(a)).
The separating vector vS,ij of the occupied cell in the interactionrange Ri can be calculated as in the following equation (seeFig. 4(b)):
vS;i j ¼ �vP;i j
jjvP;i jjj� 1
jjvP;i jjj(2)
As an example of cell (1, �2), its unit position vectorððvP;i jÞ=ðjjvP;i jjjÞ is ðð1=
ffiffiffi5pÞ; �ð2=
ffiffiffi5pÞÞ, and the length of position
vector vP,ij isffiffiffi5p
. Therefore, the separating vector of cell (�1, �2)can be calculated as (�(1/5), 2/5) = (�0.2, 0.4) by using Eq. (2).Similarly, the separating vectors of seven occupied cells can becalculated.
Using these separating vectors, the separation behavior scorecan be determined in the following equation (see Fig. 4(c) and (d)).
vS ¼1
NP
vS;i j(3)
Si j ¼ jjvSjj � cos uS;i j ¼vS � vP;i j
jjvP;i jjj(4)
Here, vS is the average of the separating vectors in the occupiedadjacent cells; N is the number of occupied neighbor cells (N = 7 inFig. 4); and uS,ij is the angle between the average separating vectorvS and each cell’s position vector vP,ij.
As shown in Fig. 4, the average separating vector vS is (0.14,0.11), which is the average of the separating vectors in sevenoccupied cells among 24 adjacent cells. Using Eq. (4), theseparation behavior score of cell (1, �1) is calculated as 0.021. Theseparation behavior score is calculated for eight neighbors ofthe current cell (0, 0).
2.2.2. Modeling of the cohesion behavior
Passengers tend to stay close to the center of the local groupformed by neighbors, and to find comfort within the group. Thistendency is called cohesion.
As shown in Fig. 5, the interaction range Ri and each cell’sposition vector vP,ij is the same as the example in Section 2.2.1. Thecohesion behavior score can be determined using the followingequation.
vC ¼1
NP
vP;i j(5)
Ci j ¼ jjvC jj � cos uC;i j ¼vC � vP;i j
jjvP;i jjj(6)
Here, vC is the center of the crowd in the interaction range Ri, whichis the average position vector of the occupied cell; and uC,ij is theangle between vC and each cell’s position vector vP,ij.
As shown in Fig. 5, the center of crowd vC is (0, �2), which is theaverage position vector of seven occupied cells among 24 adjacentcells. Using Eq. (6), the cohesion behavior score of neighbor cell (1,�1) was calculated as 0.304. The cohesion behavior score wascalculated for eight neighbors of the current cell (0, 0).
2.2.3. Alignment behavior
Passengers tend to match the direction and speed of theirneighbors. This is the factor that causes passengers to follow oneanother. It is called alignment behavior.
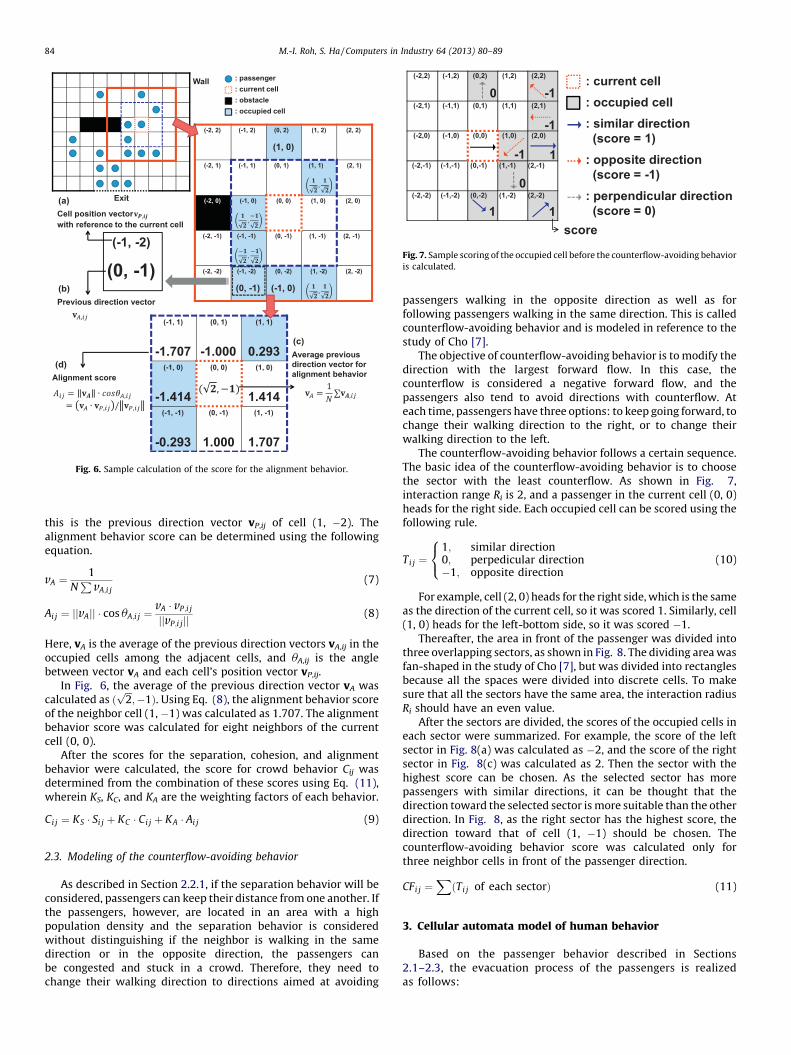
As shown in Fig. 6, the interaction range Ri and each cell’sposition vector vP,ij is the same as the example in Section 2.2.1. Thepassenger who is occupying each cell has the previous directionvector vA,ij, which refers to his/her direction in the previous timestep. As an example of cell (1, �2), the passenger in this cell wasmoved from cell (0, �3). From this, it can be known that the movingdirection in the previous time step was ðð1=
ffiffiffiffiffiffiffiffi2; 1
pÞ=
ffiffiffi2pÞ, and that
Exit
(-2, 2) (-1, 2) (0, 2)
(1, 0)
(1, 2) (2, 2)
(-2, 1) (-1, 1) (0, 1) (1, 1)
,
(2, 1)
(-2, 0) (-1, 0)
,
(0, 0) (1, 0) (2, 0)
(-2, -1) (-1, -1)
,
(0, -1) (1, -1) (2, -1)
(-2, -2) (-1, -2)
(0, -1)
(0, -2)
(-1, 0)
(1, -2)
,
(2, -2)
Wall
: obsta cle
: passe nger
: occu pied cell
: curre nt cell
(-1, -2)
(0, -1)
Cell position vect or
with referenc e to th e curr ent cell
(-1, 1)
-1.707
(0, 1)
-1.00 0
(1, 1)
0.29 3(-1, 0)
-1.414
(0, 0) (1, 0)
1.41 4(-1, -1)
-0.293
(0, -1)
1.00 0
(1, -1)
1.70 7
Average pre vious
direct ion vect or fo r
align ment beha vior
1Align ment score
/
(a)
(c)
(d)
Previous dir ection vector
(b)
Fig. 6. Sample calculation of the score for the alignment behavior.
(-2,2) (-1,2) (0,2) (1,2) (2,2)
(-2,1) (-1,1) (0,1) (1,1) (2,1)
(-2,0) (-1,0) (0,0) (1,0) (2,0)
(-2,-1) (-1 ,-1) (0,-1) (1,-1) (2,-1)
(-2,-2) (-1 ,-2) (0,-2) (1,-2) (2,-2)
: curr ent cell
: occupied cell
: sim ilar direction
(sco re = 1)
: oppo sit e di rection
(sco re = -1)
: perpe ndicular d irection
(sco re = 0)11
1
-1
-1
-1
0
0
score
Fig. 7. Sample scoring of the occupied cell before the counterflow-avoiding behavior
is calculated.
M.-I. Roh, S. Ha / Computers in Industry 64 (2013) 80–8984
this is the previous direction vector vP,ij of cell (1, �2). Thealignment behavior score can be determined using the followingequation.
vA ¼1
NP
vA;i j(7)
Ai j ¼ jjvAjj � cos uA;i j ¼vA � vP;i j
jjvP;i jjj(8)
Here, vA is the average of the previous direction vectors vA,ij in theoccupied cells among the adjacent cells, and uA,ij is the anglebetween vector vA and each cell’s position vector vP,ij.
In Fig. 6, the average of the previous direction vector vA wascalculated as ð
ffiffiffi2p
; �1Þ. Using Eq. (8), the alignment behavior scoreof the neighbor cell (1, �1) was calculated as 1.707. The alignmentbehavior score was calculated for eight neighbors of the currentcell (0, 0).
After the scores for the separation, cohesion, and alignmentbehavior were calculated, the score for crowd behavior Cij wasdetermined from the combination of these scores using Eq. (11),wherein KS, KC, and KA are the weighting factors of each behavior.
Ci j ¼ KS � Si j þ KC � Ci j þ KA � Ai j (9)
2.3. Modeling of the counterflow-avoiding behavior
As described in Section 2.2.1, if the separation behavior will beconsidered, passengers can keep their distance from one another. Ifthe passengers, however, are located in an area with a highpopulation density and the separation behavior is consideredwithout distinguishing if the neighbor is walking in the samedirection or in the opposite direction, the passengers canbe congested and stuck in a crowd. Therefore, they need tochange their walking direction to directions aimed at avoiding
passengers walking in the opposite direction as well as forfollowing passengers walking in the same direction. This is calledcounterflow-avoiding behavior and is modeled in reference to thestudy of Cho [7].
The objective of counterflow-avoiding behavior is to modify thedirection with the largest forward flow. In this case, thecounterflow is considered a negative forward flow, and thepassengers also tend to avoid directions with counterflow. Ateach time, passengers have three options: to keep going forward, tochange their walking direction to the right, or to change theirwalking direction to the left.
The counterflow-avoiding behavior follows a certain sequence.The basic idea of the counterflow-avoiding behavior is to choosethe sector with the least counterflow. As shown in Fig. 7,interaction range Ri is 2, and a passenger in the current cell (0, 0)heads for the right side. Each occupied cell can be scored using thefollowing rule.
Ti j ¼1; similar direction0; perpedicular direction�1; opposite direction
8<: (10)
For example, cell (2, 0) heads for the right side, which is the sameas the direction of the current cell, so it was scored 1. Similarly, cell(1, 0) heads for the left-bottom side, so it was scored �1.
Thereafter, the area in front of the passenger was divided intothree overlapping sectors, as shown in Fig. 8. The dividing area wasfan-shaped in the study of Cho [7], but was divided into rectanglesbecause all the spaces were divided into discrete cells. To makesure that all the sectors have the same area, the interaction radiusRi should have an even value.
After the sectors are divided, the scores of the occupied cells ineach sector were summarized. For example, the score of the leftsector in Fig. 8(a) was calculated as �2, and the score of the rightsector in Fig. 8(c) was calculated as 2. Then the sector with thehighest score can be chosen. As the selected sector has morepassengers with similar directions, it can be thought that thedirection toward the selected sector is more suitable than the otherdirection. In Fig. 8, as the right sector has the highest score, thedirection toward that of cell (1, �1) should be chosen. Thecounterflow-avoiding behavior score was calculated only forthree neighbor cells in front of the passenger direction.
CFi j ¼XðTi j of each sectorÞ (11)
3. Cellular automata model of human behavior
Based on the passenger behavior described in Sections2.1–2.3, the evacuation process of the passengers is realizedas follows:
(a) Left Secto r: -2 pt. (b) Center Secto r: -1 pt. (c ) Rig ht Secto r: 2 pt.
(-2,2) (-1,2) (0,2) (1,2) (2,2)
(-2,1) (-1,1) (0,1) (1,1) (2,1)
(-2,0) (-1,0) (0,0) (1,0) (2,0)
(-2,-1) (-1,-1) (0,-1) (1,-1) (2,-1)
(-2,-2) (-1,-2) (0,-2) (1,-2) (2,-2)
11
1
-1
-1
-1
0
0
(-2,2) (-1,2) (0,2) (1,2) (2,2)
(-2,1) (-1,1) (0,1) (1,1) (2,1)
(-2,0) (-1,0) (0,0) (1,0) (2,0)
(-2,-1) (-1 ,-1) (0,-1) (1,-1) (2,-1)
(-2,-2) (-1 ,-2) (0,-2) (1,-2) (2,-2)
11
1
-1
-1
-1
0
0
(-2,2) (-1,2) (0,2) (1,2) (2,2)
(-2,1) (-1,1) (0,1) (1,1) (2,1)
(-2,0) (-1,0) (0,0) (1,0) (2,0)
(-2,-1) (-1,-1) (0,-1) (1,-1) (2,-1)
(-2,-2) (-1,-2) (0,-2) (1,-2) (2,-2)
11
1
-1
-1
-1
0
0
(-1,1) (0,1) (1 ,1)
-2(-1,0) (0,0) (1 ,0)
-1(-1,-1 ) (0 ,-1 ) (1,-1)
2
Left secto r’s score
Cent er secto r’s score
Right sec tor’s score
(d)
Coun terflow-a voidin g
behavior score
Fig. 8. Division of the area in front of the passenger into three overlapping sectors, and scoring of each sector.
M.-I. Roh, S. Ha / Computers in Industry 64 (2013) 80–89 85
Rule 1. Update the individual behavior score
Read the compartment information on the passenger ship andcalculate the individual behavior score of each grid in advance tostart the evacuation. This rule is executed only once.
FOR EACH (every cell):
Update the distance to the exit.
Update the individual behavior score.
Before starting the evacuation, the representative shortestdistance from each cell to the exit is determined and stored in eachcell in advance. As mentioned in Section 2.1, the individualbehavior score is also calculated using these distances.
Rule 2. Update the crowd and the counterflow-avoiding behavior
score
Determine the scores of the crowd and counterflow-avoidingbehavior for each occupied cell.
FOR EACH (every occupied cell):
Update the crowd behavior score.
Update the counterflow-avoiding behavior score.
The crowd and counterflow-avoiding behavior score is updatedat each time step using the equation described in Sections 2.2 and2.3.
Rule 3. Update the total score and the moving direction
Together with the scores found in rules 1 and 2, calculate the totalscore of each adjacent grid for each occupied cell, and judgeeveryone’s moving direction in the next time step.
FOR EACH (every occupied cell):
Update the total score.
Update the moving direction.
Fig. 9 shows an example of the updating of the rule in thecellular automata model for passenger evacuation. As shown inFig. 9, each cell has only one state among the following threestates: empty, occupied, or obstacle. To move each passenger to theneighbor cell, the total score of eight neighbor cells for eachoccupied cell should first be calculated.
The total score, which determines where the evacuee will movein the next time step, is a superposition of the individual, crowd,and counterflow-avoiding behavior scores. Among all the possibletarget grids, the grid that has the highest score will be chosen as thenext position in the next time step. This process is shown inthe following equation:
ji j ¼�1; for forbidden cells ðwall; obstacleÞ1; otherwise
�(13)
Gij is the score that is used when the passenger choosesneighbor grid (i, j) as the next destination. Iij is the score for theindividual behavior, which represents the factors related to theposition of the grid and the distance to the destination, and isassociated with the behavior of each passenger. Cij is the scorefor the crowd behavior between passengers. CFij is the score forthe counterflow-avoiding behavior between the passengers inthe other groups. KI, KC, and KCF are the weighting factors of theindividual, crowd, and counterflow-avoiding behavior.
Exit
: Obst acle
Wall
(-2, 2)
“empty”
(-1, 2)
“occupied”
(0, 2)
“empty ”
(1, 2)
“occupied”
(2, 2)
“empty”
(-2, 1)
“empty”
(-1, 1)
“occupied”
(a)
(0, 1)
“occupied”
(b)
(1, 1)
“occupied”
(c)
(2, 1)
“empty”
(-2, 0)
“obsta cle”
(-1, 0)
“obstac le”
(0, 0)
“empty ”
(1, 0)
“occupied”
(2, 0)
“occupied ”
(-2, -1)
“empty”
(-1, -1)
“empty ”
(0, -1)
“occupied”
(1, 2)
“empty ”
(2, 2)
“occupied ”
(-2, -2)
“occupied ”
(-1, -2)
“empty ”
(0, -2)
“occupied”
(1, -2)
“empty ”
(2, -2)
“occupied ”
(-2, 2)
“empty ”
-4
(-1, 2)
“occupied”
-10
(0, 2)
“empty ”
-2(-2, 1)
“empty ”
1(-1, 1)
“occupied”
(a)
(0, 1)
“occupied”
5(-2, 0)
“obstac le”
-INF
(-1, 0)
“obsta cle”
-INF
(0, 0)
“empty ”
7
(-1, 2)
“occ upied ”
-1
(0, 2)
“empty ”
-4
(1, 2)
“occupied”
-3(-1, 1)
“occ upied ”
3(0, 1)
“occupied ”
(b)
(1, 1)
“occupied”
1(-1, 0)
“obstacle”
-INF
(0, 0)
“empty ”
10
(1, 0)
“occupied”
4
(0, 2)
“empty ”
-7
(1, 2)
“occupied ”
-11
(2, 2)
“empty”
-13(0, 1)
“occupied”
1(1, 1)
“occupied ”
(c)
(2, 1)
“empty”
-3(0, 0)
“empty ”
5
(1, 0)
“occupied”
2
(2, 0)
“occupied”
-2
(a)Scores of neighb or cell s
accordi ng to the cell (-1, 1)
(b)Scores of neighb or cell s
acc ordin g to the cell (0, 1)
(c)Scores of neighb or cell s
accordin g to the cell (1, 1)
: Movi ng Dir ecti on (the directio n to the hig hest sc ore)
Fig. 9. Updating the neighbor cell’s score for all the occupied cells, and choosing the moving direction.
M.-I. Roh, S. Ha / Computers in Industry 64 (2013) 80–8986
For example, the total score of eight neighbor cells of theoccupied cells (�1, 1), (0, 1), and (1, 1) in Fig. 9 can be calculatedusing Eq. (12).
Assume that the scores of the eight neighbor cells havealready been calculated, as shown in Fig. 9(a)–(c). In the case ofthe occupied cell (�1, 1), its neighbor cell (0, 1) will have a scoreof 5, and its neighbor cell (0, 0) will have a score of 7, so themoving direction of the occupied cell (�1, 1) will be the right-bottom direction of the cell, as shown in Fig. 9(a). Similarly, themoving direction of cell (0, 1) will be the bottom direction, andthe moving direction of cell (1, 1) will be the left-bottomdirection of the cell.
Rule 4. Move and conflict
If a conflict occurs, as several passengers have chosen the samegrid, only the one with the highest score can be kept goingto the selected cell, and all the others should be returned totheir original positions.
FOR EACH and every occupied cell:
Move the passenger to the neighbor cell in the moving direction.
IF (in the case of passenger conflict):
Select only one passenger – the one who has the highest score.
Move the selected passenger.
Return all the other passengers to their original positions.
As mentioned in the previous paragraph, cells (�1, 1), (0, 1), and(1, 1) chose the moving direction toward cell (0, 0), so threepassengers may conflict with one another. If a conflict occurs, thepassenger who has the highest score can be kept going toward themoving direction, and the others can stay in their originalpositions. In Fig. 10(1), the score of cell (�1, 1) to the directionof cell (0, 0) is 7, the score of cell (0, 1) is 10, and the score of cell (1,1) is 5. Therefore, cell (0, 1) has the highest score, and is chosen. Asshown in Fig. 10(3), the passenger in cell (0, 1) moved to cell (0, 0),so the state of cell (0, 1) is changed to empty, and the state of cell (0,0) is changed to occupied. Additionally, it can be seen that thepassengers in the other cells kept their positions.
Rule 5. End or repeat
After the position of each passenger is updated, the time goes onwith a discrete time step. Check the position of each passenger.If all the passengers are in their respective destinations,the evacuation is ended. If not, rule 2 is run again.
IF (update is completed):
The time interval progresses.
IF (all the passengers are in their respective destinations):
End of evacuation
ELSE
Run rule 2 again.
Exit
: Obstacl e
Wall
(-2, 2)
“empty”
(-1 , 2)
“occ upied ”
(0, 2)
“empty ”
(1, 2)
“occupied”
(2, 2)
“empty”
(-2, 1)
“empty”
(-1 , 1)
“occ upied ”
(a)
(0, 1)
“occupied”
(b)
(1, 1)
“occupied”
(c)
(2, 1)
“empty”
(-2, 0)
“obsta cle”
(-1, 0)
“obsta cle”
(0, 0)
“empty ”
(1, 0)
“occupied”
(2, 0)
“occupied”
(-2 , -1)
“empty”
(-1 , -1)
“empty”
(0, -1 )
“occupied”
(1, 2)
“empty”
(2, 2)
“occupied”
(-2, -2 )
“occ upied”
(-1 , -2)
“empty”
(0, -2 )
“occupied”
(1, -2 )
“empty”
(2, -2 )
“occupied”
(-1, 1)
“occupied”
(a)
7
(0, 1)
“occupied ”
(b)
10
(1, 1)
“occupied”
(c)
5(-1, 0)
“obs tacle”
(0, 0)
“empty ”
(1, 0)
“occupied”
(-1, -1 )
“empty ”
(0, -1 )
“occupied”
(1, 2)
“empty ”
(-1, 1)
“occupied”
(a)
2nd
(0, 1)
“occupied ”
(b)
1st
(1, 1)
“occupied ”
(c)
3rd
(-1, 0)
“obsta cle”
(0, 0)
“empty”
(1, 0)
“occupied ”
(-1 , -1)
“empty”
(0, -1)
“occupied ”
(1, 2)
“empty ”
(-1 , 1)
“occupied”
(0, 1)
“empty”(1, 1)
“occupied”
(-1 , 0)
“obstacle”
(0, 0)
“occup
ied”
(1, 0)
“occupied”
(-1, -1 )
“empty ”
(0, -1 )
“occupied”
(1, 2)
“empty ”
(3)(2)(1) sel ected
Fig. 10. Updating the rule to move a passenger to an empty neighbor cell.
Desti nation
M.-I. Roh, S. Ha / Computers in Industry 64 (2013) 80–89 87
If the position of each passenger is fully updated, thesimulation time goes on with a discrete time step. After this, itis checked if all the passengers are already in their respectivedestinations. If they are, the evacuation process is ended. If not,rules 2–5 are repeated.
4. Verification of the passenger behavior model through IMOtests
To verify the proposed model, the 11 tests noted in the IMO MSCCirc. 1238 Annex 3 guidance on the validation/verification ofevacuation simulation tools were implemented. The tests includeda check that the various components of the software wereperforming as intended. This test involved running the softwarethrough elementary test scenarios to ensure that the majorsubcomponents of the model were functioning as intended.Moreover, the tests concerned the nature of the predicted
Table 1Tests for the verification of the advanced evacuation analysis recommended by IMO
MSC/Circ. 1238.
Test Description
Test 1 Maintaining the set walking speed on a corridor
Test 2 Maintaining the set walking speed up a staircase
Test 3 Maintaining the set walking speed down a staircase
Test 4 Exit flow rate
Test 5 Response time
Test 6 Rounding corners
Test 7 Assignment of population demographic parameters
Test 8 Counterflow: two rooms connected via a corridor
Test 9 Crowd dissipation from a large public room
Test 10 Exit route allocation
Test 11 Staircase
passenger behavior with informed expectations. The 11 testsrecommended by IMO are listed in Table 1.
The results of the 11 tests verified the validity of the proposedmodel. Inthis study, the detailed results of tests 6 and 8 are described.
4.1. IMO test 6: rounding corners
Fig. 11 shows the configuration of IMO test 6 and Fig. 12 showsits simulation results. As shown in Fig. 11, twenty passengers who
20 pass engers,
unif ormly distributed
10m 2m
2m
10m
Fig. 11. Configuration of IMO test 6.
Fig. 12. Simulation results of IMO test 6.
Fig. 13. Configuration of IMO test 9.
M.-I. Roh, S. Ha / Computers in Industry 64 (2013) 80–8988
were approaching a left hand corner had to successfully navigatearound the corner without penetrating the boundaries. All thepassengers navigated around the corner without penetrating thewall, as shown in Fig. 12. They all stayed within the boundaries ofthe corridor or within the compartment’s margin.
4.2. IMO test 8: counterflow – two rooms connected via a corridor
Fig. 13 shows the configuration of IMO test 9 and Fig. 14 showsits simulation results. As shown in Fig. 13, a public room with four
Fig. 14. Simulation res
exits and 1000 passengers uniformly distributed in the room.Passengers leave via the nearest exits. It was supposed that thepassengers were 30- to 50-year-old males on a flat terrain, asmentioned in the appendix to the IMO Guidelines, and that theirwalking speeds were distributed over a population of 1000 persons.For the first step of this test, the time the last passenger leaves theroom should be recorded. Then, step 1 was repeated with closingdoors 1 and 2. The expected result was that the recorded time wouldincrease with closing doors 1 and 2. It was confirmed that the totalevacuation time increased relative to the number of doors opened.
5. Advanced evacuation analysis for a car ferry
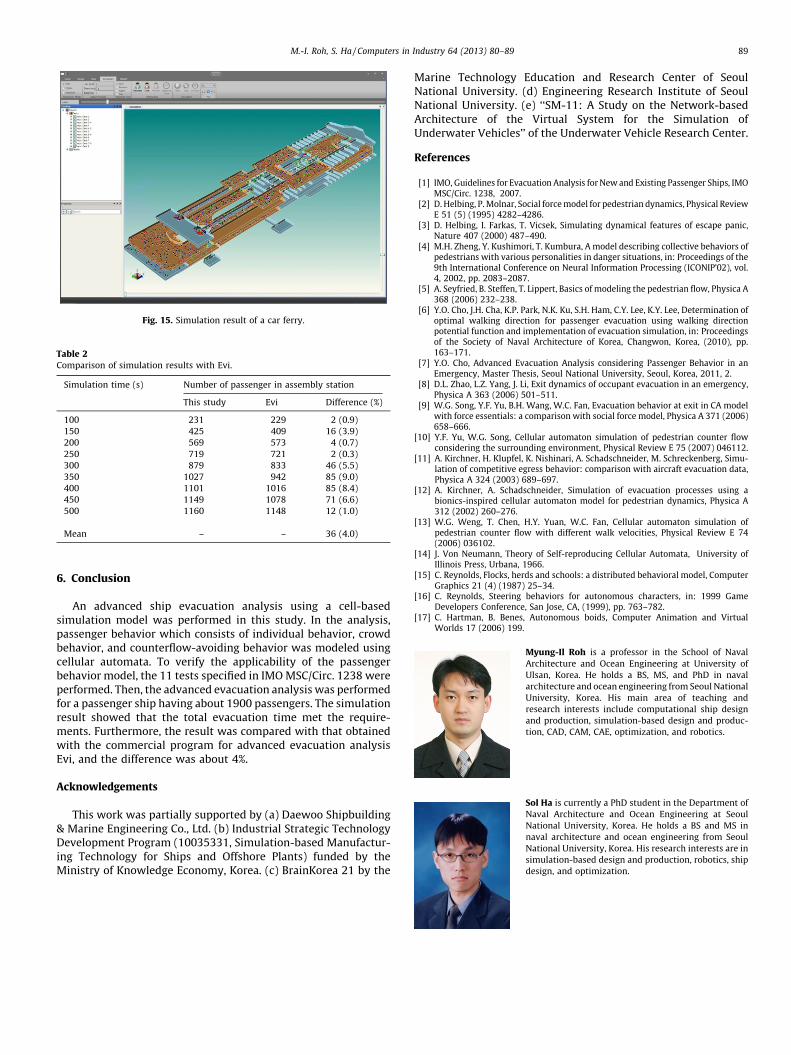
An advanced evacuation analysis for a car ferry is alsoperformed in this study. The simulation results are comparedwith the results of Evi. There were eight decks and one assemblystation on deck 5, four assembly stations on deck 7, and twoassembly stations on deck 8. The initial distribution correspondedto a total of 2487 persons located in the crew and passenger cabins.The initial distribution of the passengers is shown in Fig. 15.
The numbers of passengers at the assembly stations by time aresummarized in Table 2. The travel time was simulated as 14 minand 16 s, so the total evacuation time was calculated as 37 min and50 s. Therefore, it was confirmed that the requirement for totalevacuation by IMO was satisfied in this car ferry. The difference inthe travel time with Evi is 4.1, which can be considered almostinconsequential.
As shown in Table 2, there is a difference of about 4% betweenthis study and Evi. This difference will be caused by the differencein algorithms between them. However, the algorithm of Evi is notopen to public and is confidential now.
ults of IMO test 9.
Fig. 15. Simulation result of a car ferry.
Table 2Comparison of simulation results with Evi.
Simulation time (s) Number of passenger in assembly station
This study Evi Difference (%)
100 231 229 2 (0.9)
150 425 409 16 (3.9)
200 569 573 4 (0.7)
250 719 721 2 (0.3)
300 879 833 46 (5.5)
350 1027 942 85 (9.0)
400 1101 1016 85 (8.4)
450 1149 1078 71 (6.6)
500 1160 1148 12 (1.0)
Mean – – 36 (4.0)
M.-I. Roh, S. Ha / Computers in Industry 64 (2013) 80–89 89
6. Conclusion
An advanced ship evacuation analysis using a cell-basedsimulation model was performed in this study. In the analysis,passenger behavior which consists of individual behavior, crowdbehavior, and counterflow-avoiding behavior was modeled usingcellular automata. To verify the applicability of the passengerbehavior model, the 11 tests specified in IMO MSC/Circ. 1238 wereperformed. Then, the advanced evacuation analysis was performedfor a passenger ship having about 1900 passengers. The simulationresult showed that the total evacuation time met the require-ments. Furthermore, the result was compared with that obtainedwith the commercial program for advanced evacuation analysisEvi, and the difference was about 4%.
Acknowledgements
This work was partially supported by (a) Daewoo Shipbuilding& Marine Engineering Co., Ltd. (b) Industrial Strategic TechnologyDevelopment Program (10035331, Simulation-based Manufactur-ing Technology for Ships and Offshore Plants) funded by theMinistry of Knowledge Economy, Korea. (c) BrainKorea 21 by the
Marine Technology Education and Research Center of SeoulNational University. (d) Engineering Research Institute of SeoulNational University. (e) ‘‘SM-11: A Study on the Network-basedArchitecture of the Virtual System for the Simulation ofUnderwater Vehicles’’ of the Underwater Vehicle Research Center.
References
[1] IMO, Guidelines for Evacuation Analysis for New and Existing Passenger Ships, IMOMSC/Circ. 1238, 2007.
[2] D. Helbing, P. Molnar, Social force model for pedestrian dynamics, Physical ReviewE 51 (5) (1995) 4282–4286.
[3] D. Helbing, I. Farkas, T. Vicsek, Simulating dynamical features of escape panic,Nature 407 (2000) 487–490.
[4] M.H. Zheng, Y. Kushimori, T. Kumbura, A model describing collective behaviors ofpedestrians with various personalities in danger situations, in: Proceedings of the9th International Conference on Neural Information Processing (ICONIP’02), vol.4, 2002, pp. 2083–2087.
[5] A. Seyfried, B. Steffen, T. Lippert, Basics of modeling the pedestrian flow, Physica A368 (2006) 232–238.
[6] Y.O. Cho, J.H. Cha, K.P. Park, N.K. Ku, S.H. Ham, C.Y. Lee, K.Y. Lee, Determination ofoptimal walking direction for passenger evacuation using walking directionpotential function and implementation of evacuation simulation, in: Proceedingsof the Society of Naval Architecture of Korea, Changwon, Korea, (2010), pp.163–171.
[7] Y.O. Cho, Advanced Evacuation Analysis considering Passenger Behavior in anEmergency, Master Thesis, Seoul National University, Seoul, Korea, 2011, 2.
[8] D.L. Zhao, L.Z. Yang, J. Li, Exit dynamics of occupant evacuation in an emergency,Physica A 363 (2006) 501–511.
[9] W.G. Song, Y.F. Yu, B.H. Wang, W.C. Fan, Evacuation behavior at exit in CA modelwith force essentials: a comparison with social force model, Physica A 371 (2006)658–666.
[10] Y.F. Yu, W.G. Song, Cellular automaton simulation of pedestrian counter flowconsidering the surrounding environment, Physical Review E 75 (2007) 046112.
[11] A. Kirchner, H. Klupfel, K. Nishinari, A. Schadschneider, M. Schreckenberg, Simu-lation of competitive egress behavior: comparison with aircraft evacuation data,Physica A 324 (2003) 689–697.
[12] A. Kirchner, A. Schadschneider, Simulation of evacuation processes using abionics-inspired cellular automaton model for pedestrian dynamics, Physica A312 (2002) 260–276.
[13] W.G. Weng, T. Chen, H.Y. Yuan, W.C. Fan, Cellular automaton simulation ofpedestrian counter flow with different walk velocities, Physical Review E 74(2006) 036102.
[14] J. Von Neumann, Theory of Self-reproducing Cellular Automata, University ofIllinois Press, Urbana, 1966.
[15] C. Reynolds, Flocks, herds and schools: a distributed behavioral model, ComputerGraphics 21 (4) (1987) 25–34.
[16] C. Reynolds, Steering behaviors for autonomous characters, in: 1999 GameDevelopers Conference, San Jose, CA, (1999), pp. 763–782.
[17] C. Hartman, B. Benes, Autonomous boids, Computer Animation and VirtualWorlds 17 (2006) 199.
Myung-Il Roh is a professor in the School of Naval
Architecture and Ocean Engineering at University of
Ulsan, Korea. He holds a BS, MS, and PhD in naval
architecture and ocean engineering from Seoul National
University, Korea. His main area of teaching and
research interests include computational ship design
and production, simulation-based design and produc-
tion, CAD, CAM, CAE, optimization, and robotics.
Sol Ha is currently a PhD student in the Department of
Naval Architecture and Ocean Engineering at Seoul
National University, Korea. He holds a BS and MS in
naval architecture and ocean engineering from Seoul
National University, Korea. His research interests are in
simulation-based design and production, robotics, ship