Advancing the Science of Delivery: Inspections Regimes in Health Care and their Impact on Patient Safety Standards and Quality of Care in Kenya P149879 Concept Note / Research Protocol UPDATE 1 VERSION: JULY 2014 Abstract This study evaluates the impact of accountability mechanisms–through different models of health inspections–on quality of care and patient safety, quantity, and prices of health services in Kenya. Using health markets as the unit of intervention (broadly defined as clusters of health facilities where no facility is more than 4 KM from the center of the market), we will experimentally allocate all private and public health facilities in three counties in Kenya (around 1,000) to one of three arms: (A) those with high-intensity government-led inspections that publicly disclose the result of the inspection, and corresponding enforcement of warnings and sanctions for non-compliant health facilities; (B) those that receive privately provided supportive supervision visits and follow-ups; and (C) those that remain in the control group in a “business-as-usual” low-probability inspection regime. The results from this study will contribute to understanding the extent to which governance and accountability mechanisms can help improve service delivery in low-income countries, particularly in this case related to improving patient safety and quality of care in the public and private sectors, and if so, how these systems may operate when they are implemented “at scale.” Another important contribution of this project is the development of a set of tools and instruments that can be broadly deployed both in surveys of quality and in the design of inspection systems across diverse low-income settings. 1 The first version of this Concept Note/Research Protocol was reviewed according to WB procedures in July 2013. This version reflects the most recent adjustments based on project’s advances on regulatory reform, discussion with counterparts, intervention assessments, and pilots of data collection instruments.
Transcript
Advancing the Science of Delivery: Inspections Regimes in Health Care and their Impact on Patient Safety Standards and Quality of Care in Kenya
P149879
Concept Note / Research Protocol UPDATE1
VERSION: JULY 2014
Abstract
This study evaluates the impact of accountability mechanisms–through different models of health inspections–on quality of care and patient safety, quantity, and prices of health services in Kenya. Using health markets as the unit of intervention (broadly defined as clusters of health facilities where no facility is more than 4 KM from the center of the market), we will experimentally allocate all private and public health facilities in three counties in Kenya (around 1,000) to one of three arms: (A) those with high-intensity government-led inspections that publicly disclose the result of the inspection, and corresponding enforcement of warnings and sanctions for non-compliant health facilities; (B) those that receive privately provided supportive supervision visits and follow-ups; and (C) those that remain in the control group in a “business-as-usual” low-probability inspection regime. The results from this study will contribute to understanding the extent to which governance and accountability mechanisms can help improve service delivery in low-income countries, particularly in this case related to improving patient safety and quality of care in the public and private sectors, and if so, how these systems may operate when they are implemented “at scale.” Another important contribution of this project is the development of a set of tools and instruments that can be broadly deployed both in surveys of quality and in the design of inspection systems across diverse low-income settings.
1 The first version of this Concept Note/Research Protocol was reviewed according to WB procedures in July 2013. This version
reflects the most recent adjustments based on project’s advances on regulatory reform, discussion with counterparts, intervention assessments, and pilots of data collection instruments.
5. THEORY OF CHANGE ...................................................................................................................................... 7
7. MAIN OUTCOMES OF INTEREST ................................................................................................................... 10
8. EVALUATION DESIGN AND SAMPLING STRATEGY ........................................................................................ 12
8.1 TREATMENT AND CONTROL GROUPS ................................................................................................................... 13
9. DATA COLLECTION ....................................................................................................................................... 18
9.2 MANAGEMENT OF DATA QUALITY ...................................................................................................................... 19
9.5 IE IMPLEMENTATION MONITORING SYSTEM ......................................................................................................... 21
10. DATA PROCESSING AND ANALYSIS .......................................................................................................... 21
10.1 DATA CODING, ENTRY, AND EDITING .................................................................................................................. 21
10.2 MODEL SPECIFICATION FOR QUANTITATIVE DATA ANALYSIS .................................................................................... 22
11. STUDY LIMITATIONS AND RISKS .............................................................................................................. 22
12.1 EVALUATION TEAM AND MAIN COUNTERPARTS .................................................................................................... 23
12.2 WORK PLAN AND DELIVERABLES ........................................................................................................................ 25
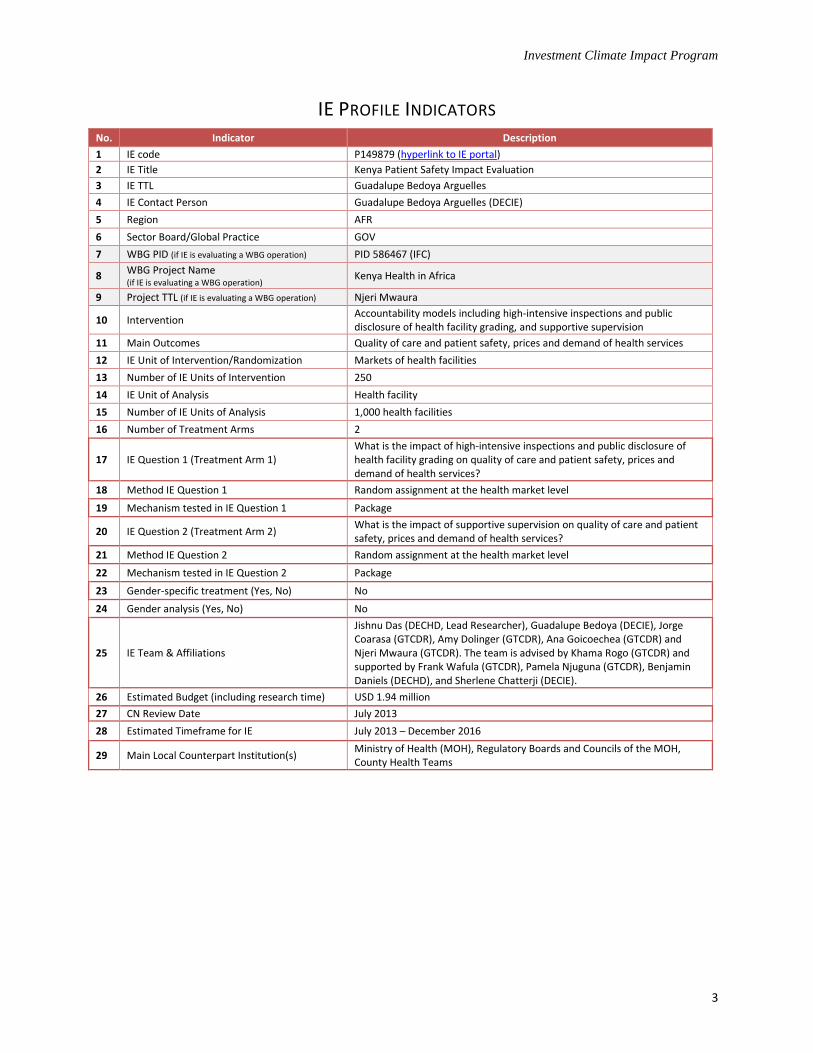
4 IE Contact Person Guadalupe Bedoya Arguelles (DECIE)
5 Region AFR
6 Sector Board/Global Practice GOV
7 WBG PID (if IE is evaluating a WBG operation) PID 586467 (IFC)
8 WBG Project Name (if IE is evaluating a WBG operation)
Kenya Health in Africa
9 Project TTL (if IE is evaluating a WBG operation) Njeri Mwaura
10 Intervention Accountability models including high-intensive inspections and public disclosure of health facility grading, and supportive supervision
11 Main Outcomes Quality of care and patient safety, prices and demand of health services
12 IE Unit of Intervention/Randomization Markets of health facilities
13 Number of IE Units of Intervention 250
14 IE Unit of Analysis Health facility
15 Number of IE Units of Analysis 1,000 health facilities
16 Number of Treatment Arms 2
17 IE Question 1 (Treatment Arm 1) What is the impact of high-intensive inspections and public disclosure of health facility grading on quality of care and patient safety, prices and demand of health services?
18 Method IE Question 1 Random assignment at the health market level
19 Mechanism tested in IE Question 1 Package
20 IE Question 2 (Treatment Arm 2) What is the impact of supportive supervision on quality of care and patient safety, prices and demand of health services?
21 Method IE Question 2 Random assignment at the health market level
22 Mechanism tested in IE Question 2 Package
23 Gender-specific treatment (Yes, No) No
24 Gender analysis (Yes, No) No
25 IE Team & Affiliations
Jishnu Das (DECHD, Lead Researcher), Guadalupe Bedoya (DECIE), Jorge Coarasa (GTCDR), Amy Dolinger (GTCDR), Ana Goicoechea (GTCDR) and Njeri Mwaura (GTCDR). The team is advised by Khama Rogo (GTCDR) and supported by Frank Wafula (GTCDR), Pamela Njuguna (GTCDR), Benjamin Daniels (DECHD), and Sherlene Chatterji (DECIE).
26 Estimated Budget (including research time) USD 1.94 million
27 CN Review Date July 2013
28 Estimated Timeframe for IE July 2013 – December 2016
29 Main Local Counterpart Institution(s) Ministry of Health (MOH), Regulatory Boards and Councils of the MOH, County Health Teams
1. EXECUTIVE SUMMARY Our study lies at the intersection of innovations in delivery and reforms of the mechanisms that govern health systems. Building on three years of work with medical boards and the Ministry of Health in Kenya, we propose to evaluate different models of health inspections and supportive supervision to improve patient safety and the quality of care in Kenyan private and public health facilities. There are three components to the evaluation. The first is the treatment. Facilities in the study will be inspected using a checklist developed as part of pre-project preparation with seven medical boards and councils in Kenya, the Ministry of Health and the private sector.
2 In the first treatment arm (henceforth, Arm 1) inspections will be
carried out by the government in all facilities in the (experimentally allocated) health markets. Following the inspection, health facilities in Arm 1 will be assigned a prominently displayed patient safety grade, with corresponding warnings and sanctions applied to non-compliant health facilities according to their risk category. In the second treatment arm (Arm 2), health facilities will receive private supportive supervision visits through an open contracting process where the firm will be nominated following their technical and financial proposals by an evaluation committee. In Arm 2 there will be no enforcement of warnings and sanctions but feedback and follow-up visits will be provided. The impact of intense inspections plus public disclosures in Arm 1 and supportive supervision in Arm 2 will be compared with a control group. Of note is that the control group will be a “business as usual” group that receives inspections with low intensity, but with low probability of inspections and lower probability of warnings and sanctions. This is consistent with the legal requirement that the boards and councils must inspect facilities against whom serious allegations of malpractice or patient safety violations have been levied. The second is the sample. In the study areas, facilities will be grouped in health “markets”, defined as geographical clusters where facilities are in close proximity to each other.
3 These health markets range in size in our study areas
from single clinics to markets with 39 facilities. The unit of treatment is always the health market and the impact of competition can be studied by examining differential impacts of the treatment across markets of different sizes. The third component is the measurement and evaluation of outcomes. Over the last 6 months, we developed, piloted and validated a series of new measurement tools for patient safety and quality of care applicable to the Kenyan context. Thus, our outcome measures will include patient safety as measured through the inspection checklist, but will also include the direct observation of patient safety (did the doctor wash his hands before treating the patient) and the treatment of standardized patients (when a surveyor trained to act like a patient presents before the doctor, what is the accuracy of the diagnosis and treatment that he/she receives). This will allow us to look at the impact of the treatment on the measures that are incentivized or supported (the checklist measures) as well as the impact on a broader set of outcomes that may be substitutes or complements with the checklist measure.
2. BACKGROUND AND KEY INSTITUTIONAL FEATURES The subject of analysis of this study is the regime for inspections for health facilities in Kenya, as well as variations proposed to the current regime. This section describes how the inspections system works right now, as well as critical institutional features related to its implementation.
2 See the attached note on the development of the checklist between 2011 and 2014. The final validation of the checklist
following the presentation of the pilot results from this project will determine the weighting of different components and is scheduled to be completed by August 2014. 3 We used data on the geographical locations of all registered facilities in Kenya to construct health markets using a K-means
clustering algorithm. Heuristically, the algorithm iteratively places health facilities into unique markets such that each market is defined by a distance—no facility in a market can be more than X Kilometers from the center of the health market, defined as the point equidistant from all facilities in the existing market. In all our computations, we use 4 Kilometers as the distance metric. In our pilot exit surveys in 43 facilities, we verified that 70 percent of patients arriving at a facility come from within that distance.
Investment Climate Impact Program
5
There are three main types of inspections that are conducted in the current regime: (1) inspections of new facilities before issuing licenses; (2) inspections of operating facilities due to complaints received, for instance, due to malpractice cases (i.e., reactive inspections), and (3) inspections to verify the quality of health providers. Due to capacity constraints mentioned previously, inspections in (3) which are closest to the subject of this study, occur with low probability in small geographic regions (inspectors go to this regions and inspect all health facilities in the surrounding areas based on the quota for the inspection period). The boards and councils and the Ministry of Health that are responsible for the inspections, must supervise them from their headquarters in Nairobi, since there is no regional network of inspectors established. Currently, there are seven regulatory boards and councils (Medical Practitioners and Dentists Board, Clinical Officers Council, Nursing Council of Kenya, Radiation Protection Board, Pharmacy and Poisons Board, Nutrition Council, and the Kenya Medical Laboratory Technicians and Technologists Board). On July of 2012, the Medical Practitioners and Dentists Board issued a Joint Health Inspections Checklist, which was developed in cooperation between different stakeholders from the private and public sectors and with support from the IFC’s Kenya Health in Africa project. This Checklist contains a set of minimum standards with quality of care and patient safety and aims to create a more transparent inspection system, and enhance communication and accountability between health inspectors and health facilities in the private sector. It also intends to decrease the burden from the previous system where each one of the boards and councils conducted individual inspections. Last October, as part of this project, all regulatory boards, the Ministry of Health, and the private sector signed the Windsor Declaration, a commitment to work on improving inspections, developing a risk-based scoring system and consumer signaling mechanisms as well as evaluating rigorously different inspections regimes developed in this proposal. A technical group with representation from all stakeholders has been meeting regularly and advancing on all these fronts. This technical group builds on one year of field experience implementing the gazetted Joint Health Inspections Checklist and is making further improvements to the checklist through an implementation manual that reduces discretion and introduces a consistent scoring system. There was also agreement that a clear set of risk-based warnings and sanctions is needed. By the time this report was being written, the technical working group was finalizing the new Joint Health Inspection Checklist now to be applied both in private and public health facilities, a scoring system and a warnings and sanctions system that will define the new regulatory framework that the impact evaluation will use for its implementation (please refer to Checklist Process Note for more details). Kenya stands out in the region and among other low-income countries for at least three reasons that make it an ideal test case for this study: (i) Kenya is one of the only countries that has standardized and national figures to diagnose the magnitude and characteristics of the problem; (ii) although not well known, levels of medical knowledge among health care providers in Kenya are high, relative not only to other countries in Sub-Saharan Africa, but also compared to countries like India: diagnostic accuracy of health providers is about 72 percent across 5 different illnesses, compared to 57 percent in Tanzania, and 34 percent in Senegal (World Bank SDI, 2010-2012), and (iii) the main stakeholders are committed to the process, as is shown in the Windsor Declaration, the continuous work from the technical group on the regulatory reform, and the support from and participation of the County representatives and their health teams.
3. LITERATURE REVIEW AND KNOWLEDGE GAPS A growing body of experimental evidence points to the effectiveness of audits and monitoring (accompanied by rewards or sanctions) in improving the performance of service providers (Olken 2007; Duflo, Hanna, and Ryan 2012 and; Zamboni and Litschig 2013). Investing in better governance and monitoring of service providers may be an important component of improving state capacity for service delivery in low-income countries (Besley and Persson 2009; Muralidharan, Niehaus, and Sukhtankar 2014). Further, where the audit and monitoring functions are directly linked to consumer choice, additional incentives through consumer demand have been further shown to improve outcomes. Leslie and Jin (2009) and Andrabi, Das and Khwaja (2013) both show that public disclosure of information (without further intervention) improves market outcomes by increasing quality and decreasing price.
Finally, the public disclosure of information is an important administrative function that can play a role in quality improvements in both the public and the private sector. This is a particularly attractive proposition since it provides clear policy guidance on potential levers to improve private sector performance—a key challenge that is increasingly under focus in Kenya and other low-income countries.
4
The impact evaluation seeks to fill several knowledge gaps:
1. The first knowledge gap that this study will fill is the role of inspections as a viable policy lever that affects service provision in the public and private sector. Frequent calls for more inspections and greater regulation are not backed by systematic data on the overall impact of such measures, particularly in the private sector.
5 In Kenya one concern is that inspections may not work because they become a
mechanism for extracting rents rather than improving quality–this imposes a cost to the facility only if the rent-extraction is correlated with the quality deficit, but whether this is indeed the case is unclear. Compounding the problem is that the precise design for inspections to improve patient safety and the quality of care is unclear. For instance, should inspections be purely punitive, or is a mix of punishment and reward better? Should mentoring be a part of the inspection process?
2. How to improve patient safety and quality of care in resource poor settings is the second knowledge gap that this study addresses. Patient safety and quality of care are integral to the policy debate in low-income countries but the lack of effective systems to regulate, measure, and improve the quality of care places severe limits on evidence-based decision making. This is particularly worrisome because recent data suggest very low levels of patient safety and poor quality of care. In Kenya (one of the only low-income countries with a national survey on patient safety), only 2% of health facilities in 2012 were compliant with minimum standards on patient safety indicators related to protocols and patient safety systems.
6 In India, a standardized patient survey shows high rates of under-provision and over-treatment
in both the public and private sector (Das et al., 2012).7
Perhaps because of these intrinsic uncertainties, the capacity to conduct inspections on a regular basis is low–in Kenya 10 to 15 percent of all health facilities are scheduled to be inspected this year (from over 9,500 health facilities in the country), and in the Africa region, out of 45 countries with de jure inspection regimes, only 5 countries report actually carrying out inspections (World Bank, 2011).
3. The third knowledge gap that this study fills is the impact of inspections and monitoring when they are designed and conducted as they would be in a fully scale-up government-led program. Conducting such an evaluation in a “stand-alone” manner would arguably yield greater scientific validity, but lower potential for scale-up. In contrast, the inspection system that will be evaluated and the evaluation design itself has been built through consensus with multiple medical boards and the Ministry of Health in Kenya over a 3-year long process. It therefore addresses specific concerns that have been raised in Kenya–and other low-income countries–on the benefits and forms of different inspection regimes, and introduces basic incentives for quality improvement for health care providers and stakeholders. This country-led approach evaluates the process as it would work when fully scaled up and therefore has strong predictive power.
4 In Kenya, close to half of all registered facilities are private. Of these, one-third are Faith Based Organizations or Non-
Governmental Organizations and the remaining are secular private facilities. Among the poorest quintile in Kenya, 47% of households seek care at a private facility when a child is sick (Barnes et al., 2010). 5 In fact, we cannot find a single systematic evaluation of the impacts of regulation and greater inspections in the literature on
quality of care in low-income countries. 6 IFC-WHO Kenya Minimum Patient Safety Standards Compliance Survey (2012)
7 A replication of the Indian study in China showed comparable levels of (poor) quality (Sylvia et al., 2014).
Investment Climate Impact Program
7
4. POLICY RELEVANCE The policy challenge that the impact evaluation research seeks to address lies at the intersection of governance and health. As mentioned previously, globally and in Kenya there is little evidence on (a) whether and how the administrative function of regulation—in this case through inspections and monitoring coupled with public disclosures–affects consumer and producer behavior in health markets in low-income countries; (b) how these systems operate when they are “at scale”; (c) how the effects obtained thereof compare to those from the use of supportive supervision—which has been the dominant intervention for quality improvements in the health care sector; and (d) whether these systems can be used to improve quality of care in public as well as in private providers. Addressing these issues at the global and country level is critical. As we will show below, quality of care and patient safety is a significant concern that affects the health of populations in most resource-poor settings and although inspections and monitoring are frequently proposed policy actions, there is little evidence to support these policy recommendations. In the United States, the key milestone on patient safety was the Institute of Medicine report (Kohn, Corrigan and Donaldson, 1999) and this evaluation has the potential to both highlight the issues of patient safety and quality of care in resource poor settings and suggest potential policy levers that can improve these key process outcomes in the health care sector.
8
Appropriate policy towards the private sector is an increasing concern but the lack of systematic evidence again hampers policy action. The results from this study will thus provide guidance on key issues pertaining to the design of health system governance and administration and the role of producer and consumer incentives in the improvement of quality. A crucial policy-relevant implication of this study is the potential to affect health outcomes in Kenya, which may be replicated across the Africa region in general using similar mechanisms of action. More broadly, for low-income countries the results from this impact evaluation will provide:
A. The viability and impacts of policy actions linked to inspections and monitoring for quality improvement in public and private clinics;
B. The differential impacts of such actions on patient choice, quality and prices in public and private facilities C. The relative impacts of inspections with public disclosure of information versus supportive supervision for
improving quality; D. A set of tools and instruments that can be broadly deployed both in surveys of quality and in the design of
inspection systems across diverse low-income settings.
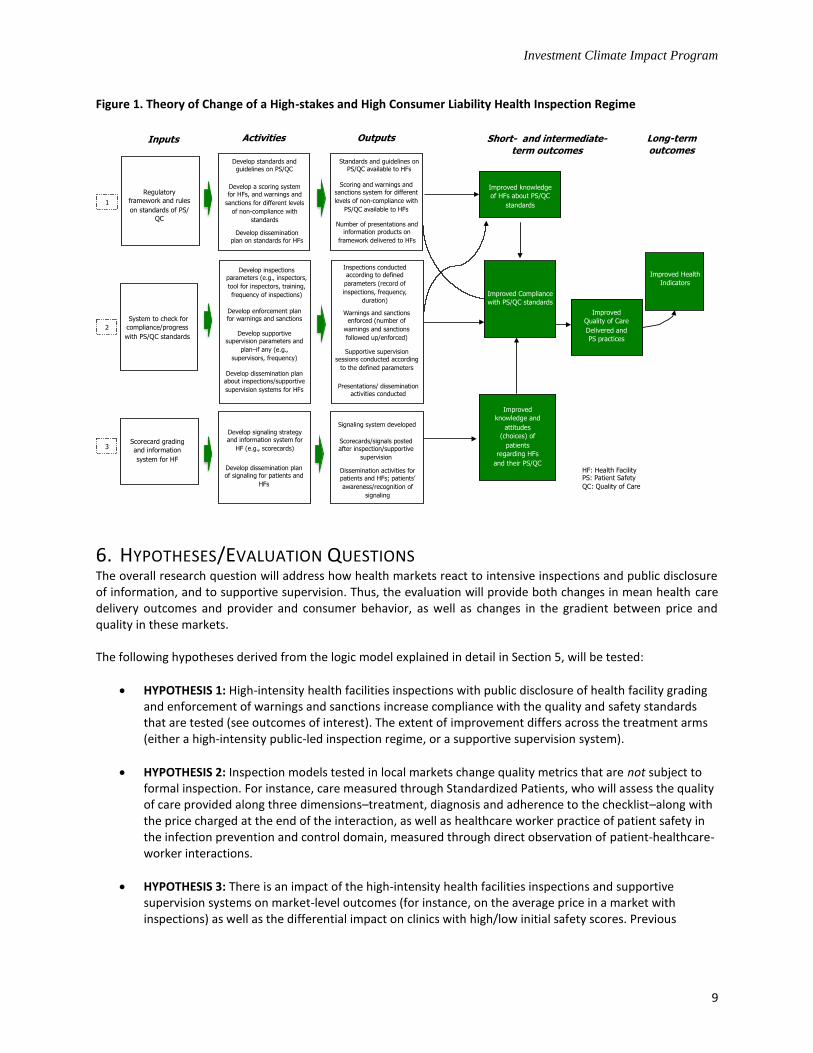
5. THEORY OF CHANGE The evaluation targets all health facilities in three counties of Kenya (around 1,000 or 10% of the total number of health facilities in the country). It will have three arms, each of which is expected to affect quality of care and patient safety for all the population in their catchment areas. The details on the treatment arms are discussed in Section 8. The control group will be the “Business-as-usual” Low-intensity Health Inspections Regime, the first treatment arm will be a High-intensity Public Health Inspections Regime with Public Disclosure of the health facility’s score, and the second arm will be a Private System of Supportive Supervision. There are three components across these arms: (1) a regulatory framework accompanied by clear guidelines on the minimum patient safety standards that facilities are expected to comply with; (2) a monitoring system to track compliance with minimum quality of care and patient safety standards over time; and (3) a scoring and information report card system to publicize health facilities’ compliance with minimum patient safety standards.
8 A memorable comparison is the comparison of patient to airline safety, whereby iatrogenic injuries from patient
hospitalizations was the “equivalent of three jumbo-jet crashes every two days” (Leape, 1994).
Investment Climate Impact Program
8
Each treatment arm will include 2 or 3 of these components. Intervention activities are defined by these three components as follows:
(1) A regulatory framework accompanied by clear guidelines on the minimum quality of care and patient safety standards: Activities in this component include the streamlining of the Checklist, the development of a detailed implementation manual, a score system to grade health facilities and a system of warnings and sanctions for non-compliant HFs. All these activities have been taking place during the last several months, from a process that started some years ago (please refer to Checklist Process Note for further details). The new regulatory framework is schedule to be completed by the end of August 2014.
(2) A monitoring system to track compliance with minimum quality of care and patient safety standards: This component includes activities related to the definition of the parameters for the inspections and the supportive supervision, including who the inspectors/supervisors will be, how often the inspections/supportive supervision will take place, and the system to enforce the warnings and sanctions developed in (1). Several of these elements have been defined, and a planning meeting with the participant counties and the MOH is schedule for August/September 2014.
(3) A scoring and information report card system to publicize health facilities’ compliance with minimum quality of care and patient safety standards: The scoring system is part of the regulatory framework from (1), and the report card system will be developed consistent with that scoring in a way that effectively communicates to patients the status of the health facilities.
Figure 1 presents a simplified theory of change behind the broad intervention to be evaluated, including its main components/inputs, activities, outputs, and the hypothesized causal chain to select outcomes of interest. The main assumption behind this theory of change is that the combination of two or more of these components leads to inspection/supportive supervision systems that provide incentives for health facilities to comply with/increase quality of care and patient safety standards (i.e., clear rules of the game, good information systems, a working system of warnings and sanctions, an effective supportive supervision, as well as a consumer liability system through the scorecard grading that create costs/benefits that incentivize health facilities to improve quality of care and patient safety). For instance, activities and outputs from component (1) are expected to affect the knowledge of the health facilities in terms of quality and patient safety, which is a necessary (although not sufficient) condition to affect compliance with the standards. Activities and outputs in component (2) are expected to directly affect compliance by creating incentives (and costs) for noncompliance. Finally, the third component is expected to affect consumer demand, which in turn may lead to changes in provider behavior and a reallocation of demand to facilities with higher patient safety scores In the long-term, better quality of care contributes to improvements in the health outcomes of the population served by health facilities. We examine the impact of the interventions on a triad of measures that takes into account our setting with public and private providers: Quality and Patient Safety in the market, Quantity in the market and Prices in the market. The first set of outcomes are intermediate outcomes in the continuum of patient safety and quality of healthcare services measured through (A) compliance with a quality of care and patient safety checklist; (B) compliance with key infection control measures in doctor-patient interactions; (C) accuracy of diagnosis and treatment as evaluated through the use of standardized patients; (D) prevalence of unnecessary or harmful medication; and (E) prevalence of substandard drugs. Consumer and provider behavior are further measured through (A) patient loads in different health facilities and (B) prices charged to patients for consultations and laboratory procedures.
Figure 1. Theory of Change of a High-stakes and High Consumer Liability Health Inspection Regime
6. HYPOTHESES/EVALUATION QUESTIONS The overall research question will address how health markets react to intensive inspections and public disclosure of information, and to supportive supervision. Thus, the evaluation will provide both changes in mean health care delivery outcomes and provider and consumer behavior, as well as changes in the gradient between price and quality in these markets. The following hypotheses derived from the logic model explained in detail in Section 5, will be tested:
HYPOTHESIS 1: High-intensity health facilities inspections with public disclosure of health facility grading and enforcement of warnings and sanctions increase compliance with the quality and safety standards that are tested (see outcomes of interest). The extent of improvement differs across the treatment arms (either a high-intensity public-led inspection regime, or a supportive supervision system).
HYPOTHESIS 2: Inspection models tested in local markets change quality metrics that are not subject to formal inspection. For instance, care measured through Standardized Patients, who will assess the quality of care provided along three dimensions–treatment, diagnosis and adherence to the checklist–along with the price charged at the end of the interaction, as well as healthcare worker practice of patient safety in the infection prevention and control domain, measured through direct observation of patient-healthcare-worker interactions.
HYPOTHESIS 3: There is an impact of the high-intensity health facilities inspections and supportive supervision systems on market-level outcomes (for instance, on the average price in a market with inspections) as well as the differential impact on clinics with high/low initial safety scores. Previous
Activities
Develop standards and guidelines on PS/QC
Improved
Quality of Care
Delivered and
PS practices
Short- and intermediate-term outcomes
Improved knowledge
of HFs about PS/QC
standards
Improved Health
Indicators
Inputs
Regulatory
framework and rules
on standards of PS/
QC
1
System to check for
compliance/progress
with PS/QC standards
2
Scorecard grading
and information
system for HF
3
Improved
knowledge and
attitudes
(choices) of
patients
regarding HFs
and their PS/QC
Develop a scoring system for HFs, and warnings and
sanctions for different levels
of non-compliance with
standards
Develop dissemination plan on standards for HFs
Develop inspections parameters (e.g., inspectors,
tool for inspectors, training,
frequency of inspections)
Develop enforcement plan for warnings and sanctions
Develop supportive supervision parameters and
plan–if any (e.g.,
supervisors, frequency)
Develop dissemination plan about inspections/supportive
supervision systems for HFs
Develop signaling strategy and information system for
HF (e.g., scorecards)
Develop dissemination plan of signaling for patients and
HFs
Improved Compliance
with PS/QC standards
Long-term
outcomes
HF: Health Facility PS: Patient Safety
QC: Quality of Care
Outputs
Standards and guidelines on PS/QC available to HFs
Scoring and warnings and sanctions system for different
levels of non-compliance with
PS/QC available to HFs
Number of presentations and information products on
framework delivered to HFs
Inspections conducted according to defined
parameters (record of
inspections, frequency,
duration)
Warnings and sanctions enforced (number of
warnings and sanctions
followed up/enforced)
Supportive supervision sessions conducted according
to the defined parameters
Presentations/ dissemination activities conducted
Signaling system developed
Scorecards/signals posted after inspection/supportive
supervision
Dissemination activities for patients and HFs; patients’
awareness/recognition of
signaling
Investment Climate Impact Program
10
literature on such report cards in settings outside health care (Jin and Leslie, 2003; Andrabi, Das and Khwaja, 2013) shows that prices, quality and quantity adjust when such information is provided.
Together, the tests to these hypotheses will allow the study to answer key questions regarding health facilities inspections and how they should be carried out in this context. The following are the evaluation questions, resulting from the hypotheses, which are aligned with the treatment arms:
What is the impact of government-led high-intensity inspections and public disclosure of health facility grading and enforcement of warnings and sanctions on compliance of health facilities with minimum quality and patient safety standards, quality indicators of health care delivery that were not inspected (including quality indicators measured through standardized patients and direct observation of select patient safety practices), prices and demand?
What is the impact of a private supportive system for health facilities on compliance of health facilities with minimum quality and patient safety standards, quality indicators of health care delivery that were not inspected, prices and demand?
7. MAIN OUTCOMES OF INTEREST We examine the impact of the intervention on a triad of outcome groups that are important in settings with public and private providers: Quality and Patient Safety in the market, Quantity in the market and Prices in the market. Quality and Patient Safety will be measured through five main indicators that gauge diverse dimensions of quality and patient safety at different points in the continuum of the health care chain: (1) Adherence to a Checklist developed by the regulators and that includes indicators of quality and patient safety related to protocols, infrastructure, and equipment at the HF level; (2) Adherence to patient safety practices related to infection prevention and control; (3) Adherence to case-specific checklists of essential and recommended care for four medical cases; and (4) Prevalence of substandard medicines. Quantity (demand) of care services will be measured through patient flow records from health facilities and administrative data, and prices will be measured through patient exit surveys. Below is a list of the main outcomes of interest for this analysis, as well as the source and the method of data collection used in each case.
Adherence to a Checklist of quality of care and patient safety standards. This is a Checklist for Singular/Joint Inspections for Public and Private Medical Institutions (henceforth Checklist), which has been developed by a technical working group (TWG) including the regulatory bodies under the Ministry of Health, the private sector, and other stakeholders. This Checklist includes indicators of infrastructure, equipment, staff characteristics, and protocols to measure quality and patient safety across all units of a HF, and hence it allows measuring how HFs stand with respect to the standards set by the regulation. The results are mapped into a score and the measure of adherence we will use is the score as a percentage of the maximum score possible for each HF. We developed an electronic version of this Checklist. Data will be collected through surveys to the HF in-charge and staff, as well as through observation and verification during the surveys following closely the protocols that inspectors follow when they conduct inspections.
Adherence to patient safety practices related to infection prevention, and control (IPC) in primary care,9
which are measured by direct observation of select practices in the consultation room and the laboratory. These outcomes will measure adherence to patient safety practices for three groups: (i) hand hygiene, (ii) safe injection practices, and (iii) sterilization of equipment and waste management. This selection was based on their high-value (i.e. strong link to health-care infections), high frequency of opportunities (i.e.,
9 We use the term primary care to distinguish inpatient and outpatient care. A better term would be a “patient seeking
ambulatory care.”
Investment Climate Impact Program
11
points in time during the care chain when a patient safety practice should be performed to avoid likely adverse events), and feasibility to develop valid, reliable, and generalizable indicators in the planned time and conditions.
Adherence to case-specific checklists of essential and recommended care for 4 medical cases. This dimension of quality of care and patient safety is measured through Standardized Patients, which allows us to gauge the extent of correct treatment (both under and over-treatment) in these facilities. The method of Standardized Patients (SPs) was used in the first large-scale population study in India in 2008-2009 (See, e.g., Das et al., 2012). SPs are people from the local community who are extensively trained to present the same case to multiple providers. To assess the quality of care, SPs are trained to recall all history questions, examinations, and diagnoses. They are debriefed with a structured questionnaire within one hour of the interaction. The quality of medical advice is assessed by the time spent with patients, by providers’ adherence to case-specific checklists of essential and recommended care, the likelihood of correct diagnosis, and the appropriateness of treatment. SPs will undergo an exit survey where the data on their interaction with the doctor is recorded.
For the study, a pilot is undergoing to develop and test the clinical cases for Kenya, fine tune the scripts and survey instruments for those cases, and develop finalized field SPs instruments along with a detailed instruction manual for SPs and field enumerators for future scaled-up data collection. For this component, we worked with an advisory board constituted by the Ministry of Health to tailor tracer conditions to the Kenyan setting and are currently piloting the approach in Nairobi. The four tracer conditions satisfy the criteria of relevance (high incidence in low-income settings), low risk to SPs (for instance, from invasive examinations), and established medical protocols with clear triage, management and treatment checklists. For three of the four cases (asthma, diarrhea and TB) the Ministry of Health has developed and disseminated diagnostic and treatment guidelines. For the fourth (unstable angina) these guidelines have not yet been developed or disseminated so that the cardiology department at Nairobi Hospital consulted European and American diagnostic and treatment guidelines. These cases had previously been developed and validated in India and later in China. Therefore, using the same tracer conditions allowed for speedier development, allowing the team to focus on context-specificity and facilitated comparisons with other countries.
Prevalence of unnecessary or harmful medications, which is measured through the analysis of the drug prescriptions collected by the SPs described previously. The prescriptions will be compared to the guidelines developed for the four SP cases and the instances of unnecessary or harmful medications will be recorded based on medical judgment.
Prevalence of substandard medicines for primary care patients, which is measured through tests of the medicines collected by the SPs described previously. The collectors (SPs) will pose as patients who have come to the pharmacy (potentially within the health facility where they sought care, since most HFs in Kenya have a pharmacy or a store where they dispense drugs)
10 to purchase medicines that have been
prescribed as part of their interaction. This will minimize bias due to vendors refusing to supply samples or concealing what they knew/ suspected to be poor quality. The WHO Guidelines for Sampling of Pharmaceutical Products and related materials will be adhered during storage and transportation of samples.
Price of services at health facilities. The data on prices will come from a short survey that will be collected from patients from various demographic characteristics exiting the health facilities, as well as from SPs. In large health facilities, sampling of patients will be done randomly using a skip routine. Based
10
We have now piloted the substandard medicine question in a pilot of standardized patients among 40 health facilities. The protocol that we followed was that the patient purchased the medicine from the nearest pharmacy where it was available, if the facility did not have a pharmacy
Investment Climate Impact Program
12
on the pilot results, in small facilities with low traffic, a skip routine is impractical as the quota of patient exit surveys (8) is close to the average number of patients in a regular day.
Quantity (demand) of health care services: The data on demand corresponds to the number of patients in the last complete month at the time of the survey, collected at the facility level through a HF survey from the forms reported to the MOH, or from the HFs alternative record system. We were encouraged to find during the pilot that collecting this data (as well as prices) was not a problem in the field. These data will be also retrieved from administrative records from the MOH that collects select monthly indicators for the majority of HFs to cross check. According to the MOH, the compliance with the basic aggregate figures is around 90%.
Other Intermediate Level Indicators The individual outcomes used to build the previous key outcome indicators constitute a set of intermediate indicators. For instance, the Checklist in the first bullet contains disaggregated indicators on infrastructure, protocols, equipment and staff, the case-specific checklists contain several measures of quality and patient safety, and the infection, prevention and control measures include diverse measures of hand hygiene, safe injections practices and sterilization and waste management. Additional information will also be collected including other characteristics of health facilities, staff and patients. Among the HF indicators are services availability, accreditation and other supervision services the HFs may be receiving. Additional staff characteristics include education level, school, and salary, while the patient indicators include socioeconomic measures, health care alternatives, time and means to access the health facility, details about their interaction with the health providers, and their level of satisfaction with the services provided. Other intermediate level outcomes will include knowledge tests to patients about the score of the health facilities and what they mean, as well as to inhabitants of the market-areas where the intervention is taking place to assess how knowledge is being affected. A monitoring system to check for adherence protocols and implementation will be in place. Both the inspections and the assessments in the supportive supervision arm will be conducted electronically, as will be the plan for each HF and the assessment of the advances. Furthermore, as one part of the project, we have regularly visited health facilities and compiled field notes from unstructured interviews. We will continue to do so and will incorporate discussions on the barriers to improvement and actions that the health facilities are taking to improve quality.
8. EVALUATION DESIGN AND SAMPLING STRATEGY This evaluation uses a cluster randomized experimental design to estimate the causal impact of the interventions, where the clusters are markets of health facilities, and the cluster size is the market size, or number of health facilities per cluster. All local markets of health facilities in the three counties–Kakamega, Kilifi, and Meru–will be randomized into treatment and control groups, taking into consideration the size of the market, and is thus a reason why our estimate would be a population impact estimate. These three counties were chosen after an extensive consultation with representatives of the Kenyan county health executives, based on prior analysis of health markets in all Kenyan counties. Specifically, we constructed health markets in each county and highlighted the counties that contained markets with diverse sizes. In some counties like Turkana, there were few markets with more than one health facility (typically in the arid Northern counties) and evaluations from these counties would not be predictive of performance in denser health markets. In other counties, such as Mombasa, most health facilities are in markets with a large number of other health facilities. In such counties, the predictive power of the evaluation for smaller markets is poor. Ten counties satisfied our technical criteria of health markets with diverse sizes. The analysis and counties were discussed with the county health executives, who decided the ultimate study areas (refer to Brief on County Selection for more details).
The choice of a cluster-randomized experimental design stems from the nature of the intervention and the relevance of capturing the effect of the intervention at the market level. Particularly, the treatment applied to one health facility is thought to have potential spillovers on geographically proximate health facilities through consumer demand. Therefore, the cluster-randomized design was selected because of the potential spillover at the market-level, and the policy-relevance of these level impacts in terms of quality of care and patient safety, quantity and prices. The markets are defined at this stage by geographic delimitations. In a recent pilot with 360 patients surveyed we find that around 70% of the respondents live 4 km or closer from the health facility they visited. Using this distance, we apply a clustering algorithm called the K-means algorithm that identifies markets of health facilities by the nearest center, conditional on the K-distance to the center. Our algorithm stops creating new clusters when all facilities are within the predefined distance (4 km) from their respective market center. Based on this exercise, we estimate there are about 250 such markets in the three counties selected, with diverse market size ranging from singletons to markets with 2, 3, 4, 5 or more health facilities (see Market Analysis Note for more details). An appropriate randomized design with balance between treatment and control groups provides the independent assumption between treatment status and the outcomes of interest required to identify the causal impact of the interventions. A potential risk of a cluster-randomized design in terms of bias of the estimates stems from unbalances due to important differences across the clusters that may be correlated to the impact of the intervention (e.g. in our case the fact that the markets are of different sizes may have significantly different quality based on the size of the market). We address this risk through appropriate stratification, which will also improve the precision of the estimates. The variables for the stratification will be selected after the baseline is collected, and before the randomization takes place. A potential spillover effect in control markets is a possibility. We will have to deal with this as the experiment continues. We think the concern is particularly salient in areas where markets are hard to define—many patients “bypass” facilities to visit those that are further, especially when using public transport such as Matatus on market days. In this case, we will have to think of a “control” market as one where the signal on quality is missing, and therefore consumers have to infer the quality from other observable characteristics. We can try and elicit direct information on this (for instance, in asking about perceived quality for control markets in exit surveys that are already planned) or formally model inference in missing data through multiple imputation methods. It is hard at this point to say what is going to happen; we think the best way to deal with this important issue is to put in place data collection mechanisms that allow us to check how demand is responding on a timely basis. Thus, we are working with the counties to see if their data on usage (which comes monthly) reflect actual usage, and if so, whether these can be used to monitor such spillovers. If so, we can answer questions like “Does demand increase in markets that are graded relative to the control groups” (subject to the usual identification concerns in these spillover specifications). It is possible that in spite of the randomized design and stratification, differences between treatment and control clusters remain due to chance or different take-up or response rates of the health facilities. These differences in observed (or other unobserved) characteristics represent a problem if they are correlated with the treatment status and the outcomes of interest. Special care is being taken in the design of the questionnaires to collect relevant information that can be used to make appropriate corrections (e.g. for instance, modeling selection or participation) if at all needed to obtain unbiased estimators. Finally, ex ante, we are not powered to detect smaller changes by subgroups, since the sample size is determined by the census of facilities in the 3 counties where we are working. Ex post, we will look at sub-group analysis, especially by ownership and “level”.
The IE will have a control group and two treatment arms: (a) the control group will be the “Business-as-usual” Health Inspections Regime; (b) the first arm will be the High-intensity Public Health Inspections Regime; and (c) the second arm will be a Supportive Supervision Regime. All groups will share a well-developed regulatory framework and standardized guidelines to conduct inspections and assessments, and will be to the extent possible revenue-neutral (that is, the same amount of money will be spent on each) but will differ in the following important features:
Control Group (Counterfactual): "Business-as-usual" Health Inspections Regime Health facilities in this group will operate under the current regime for health inspections, where inspections are low-probability events. Under this regime, the probability of being inspected during the year is around 10% and the inspections are carried out by board members and staff from the MOH and different regulatory bodies who are mobilized from Nairobi to the specified location. This arm will act as a counterfactual, measuring what would happen with compliance with the quality of care and patient safety standards and the other outcomes of interest, if the current regime of low-probability inspections, and an improved regulatory framework are in place. We note that a “pure” control group cannot be implemented in this setting, since patient complaints and malpractice have to be investigated as a matter of due course. Additionally, as part of this project, the regulatory framework is being improved with an enhanced Checklist and implementation manual, a scoring system to grade health facilities and system of warnings and sanctions for noncompliant health facilities. This regulatory framework will likely apply to the entire country so the counterfactual will also have an improved regulatory regime.
Arm 1: High-intensity of Public Health Inspections Regime with Public Disclosure of Quality Score In this regime inspections will be proactive and every facility in this arm will be inspected with certainty. Regional teams of full-time inspectors will be deployed to inspect all health facilities in the markets assigned to this pilot. The MOH and regulatory bodies will be responsible for training and supervising the regional teams and the full-time inspectors will be accountable to them. In practice, this means that the facilities in the markets assigned to this arm 2 will be inspected with a probability of 100% by teams of dedicated inspectors that report to the boards and councils and the boards and councils will use their legal authority to enforce any sanctions as a consequence of the inspection. The frequency of the inspections will be once a year with appropriate follow-ups (due to warnings and sanctions) and responses from health facilities for re-inspection if they want a change in their risk categorization. This intervention arm will be operating for a year. There will be a dissemination campaign for patients to introduce them to the warnings and sanctions.
11 Appropriate governance mechanisms will be
incorporated into the contracts to ensure this pilot mimics to the extent possible what would happen if the regulatory bodies had the resources to create a cadre of dedicated inspectors and deploy them in regional teams to cover one or more counties. At the end of the inspection, each facility will be assigned a letter-grade (provisionally A through D) that will be prominently posted on the health facility door. Fraud control mechanisms will be put in place to ensure that clinics do not alter the information on the clinic door. The scoring system has been developed by the regulators as part of this project, and a warnings and sanctions system for non-compliant health facilities is also under development. Therefore, the high-intensity feature, and the public disclosure of the HF quality status contain incentives and information that by and large were not available for the markets before. We are fully aware and cognizant of the worry that this prominent display may be corrupted and are currently working with the Ministry of Health and the chosen study regions to study various options. As a policy study, one of our objectives is to ensure that the ultimate model is scalable and we recognize that
11
At the end of each inspection, the HF receives a copy of the Checklist filled in by the inspectors so they will know in detail why they got the grade they did. This also acts as a feedback system, and provides a potential improvement plan since the way the Checklist is itemized will allow facilities to parse out the specific areas for improvement. Additionally, the way the warnings are designed now implies that they will also have a deadline and a plan of what needs to be improved in the short term (before the next warning follow-up, or to get out of the sanction). However, inspections are not by nature a supportive supervision system itself, and that is why we are testing a more supported process in another arm.
Investment Climate Impact Program
15
this may lead to a (technically) sub-optimal choice with some corruption. We will study the corruption of the grade display as one outcome of the study. We have agreed with the Ministry of Health and the County Health Executives that the work will be completed in 3 counties and have spoken to the county executives on this concern. The final system is still being worked out and two options have been proposed. First, the posted grade will include a number that patients can send an SMS to, and from which they will receive an immediate SMS confirming the Grade that the facility received. We are investigating the option that they can, at that point, report back the grade that they saw with heavy penalties if the grade had been altered. In addition, in each of these counties (surprisingly) the county teams are fairly active in visiting health facilities—something we verified by visiting multiple health facilities and checking visitor’s log books which showed visits by the county health team on a regular basis (even in remote locations). Finally, we will build in random checks in markets verifying grades.
Arm 2: Private Supportive Supervision Regime A private sector organization assesses compliance with the joint health inspections checklist and provides monitoring and mentoring in the markets assigned to this pilot. Participation in these assessments will be voluntary and the private organization will not have authority to enforce sanctions. However, it will have a contractual obligation to offer the assessment to all facilities in these markets and will provide a certain degree of coaching to health facilities on how to improve patient safety. Assessors will be trained and supervised by the private sector organization and will be fully accountable to it. No Joint Health Inspections will be carried out in these markets during the one year of implementation of the intervention. This intervention will be operating for one year. Since supportive supervision activities and assessments are private (not disclosed), a valid question is why other facilities in the market would have an incentive to “not fall behind.” This is an important question that is, in itself, a research issue. Whether quality improvements through supportive supervision leads to changes in demand clearly relates to the observability of these changes for the marginal consumer; to the extent that they are completely unobservable, there may not be changes in demand—and this in itself suggests that there is no market reward for the improvement—although there may be a health reward if patient safety has increased. Alternatively, facilities may use other methods to “signal” that they have received supportive supervision, and this affect consumer demand. We are not wedded to any particular outcome on this front, and it may well be that supportive supervision improves quality of care and patient safety, but this is not reflected in consumer demand. In one RCT that Das has just completed, unqualified providers were trained but they were not given certificates etc., and saw a 20% rise in demand, suggesting that at least some aspects of quality are rewarded in the market. Similarly, SafeCare, a Dutch-based quality improvement firm claims that the clinics it works with see significant increases in demand, so there may be some effects.
A few ancillary issues that “might” affect the interpretation of our results follow:
A valid concern is the extent to which a one-year intervention length of exposure is long enough to observe impacts. A longer intervention and follow-up timeframe would be ideal. We are planning on raising additional funding sources to follow-up if we see during our monitoring that this is turning out to be a serious issue. The issue of health facilities not being able to buy equipment in the short term is particularly salient, since if the intervention is “off” the budget cycle for public facility purchase requisitions, there is a risk that the improvement happens only in the next budget cycle. Having said that, there are reasonable expectations that a facility could improve through small changes that require greater effort but not necessarily greater resources. Our pilot results among 40 health facilities highlight that most facilities score in the lower half of the distribution and there are significant changes that they can make where major investments are not required (for instance, color coding waste-bins or calibrating lab equipment). These will show up as improvements in the checklist, although it is an open question whether this shows up in changes in actual practice—something we will be able to assess during the follow-up.
Investment Climate Impact Program
16
Ideally, we would like to keep this a budget-neutral process, so that all treatment arms receive the same budget to operationalize the inspections/assessments. We can give them the same budget, but cannot address the fungible nature of money in each institution.
12
High-intensity of Public Health Inspections Regime with Public Disclosure of Quality Score, will be implemented by the regulators, and health facilities cannot refuse an inspection. The second treatment arm offers free supportive supervision to health facilities, which is a reason why this arm could also potentially report a higher take-up. Further, considering that all health facilities in each market will be subject to the same regime, they will also have an incentive to not fall behind if other health facilities are in the program.
If there is no change in demand, it could be because (A) people did not understand the information or (B) demand is not responsive to patient safety. We will not be able to say, but we can mitigate this risk somewhat by conducting a number of focus groups discussions prior to deciding on the precise form of the report cards. Campaigns to publicly disseminated facility regulations at the health facility and client/customer level are components that will require careful consideration (including the materials, the communication strategy to target the different audiences, and the communication strategy to deliver the messages). For instance, the HF-level campaigns are likely to be delivered (among other) in a monthly meeting that counties have with all HFs.
8.2 SAMPLE SIZE CALCULATIONS As mentioned previously, a key feature of this study is that all the health facilities in the three participating counties–Kakamega, Kilifi, and Meru–will be part of the analysis. Hence, we do not have a sample of health facilities but the entire population of health facilities in these counties: around 250 markets (clusters), and around 940 health facilities, which naturally implies that the results will be representative of and valid for these three counties. The markets will be randomized equally into the three arms: each arm will consist of around 83 markets and 313 health facilities as the table below shows.
Table 1. Randomization of Markets
T1 Treatment 1
(83 markets, 313 health facilities)
T2 Treatment 2
(83 markets, 313 health facilities)
C Control group
(83 markets, 313 health facilities)
Minimum Detectable Effect The table below presents preliminary estimates of MDE for the 7 main outcomes of interest. Since the number of clusters and HFs is fixed, as it comprises all the possible in the three counties, the MDE becomes dependent on the other determining variables. Assuming power of 80% and confidence of 95%, the MDE varies between 0.19 and 0.27 standard deviation for all main outcomes. This represents changes of between 20% and 27% with respect to the mean reference. To our knowledge, there is no data to compare impacts of similar interventions. However, a random small-scale control trial in Uganda involving a community-based monitoring and accountability system with disclosure of public primary health facilities scores led to an increase in the summary HF score of 0.56
12
Originally, we had expressed a strong preference for revenue neutrality—that is, for an apples-with-apples comparison, it is desirable that the overall revenue outlay in Arm 1 and Arm 2 are similar. This is easier said than done. World Bank procurement systems do not currently allow for multiple financial and technical proposals from firms in open bidding and we cannot signal the price that we are willing to pay in our technical proposal. We are actively engaged in conversations on this front and will keep the team notified of how this may be solved, since this is a key issue in evaluations that compare multiple arms.
Investment Climate Impact Program
17
standard deviation compared to the control facilities, and select utilization and health outcomes improved between 33% and 46% compared to the control group (Bjorkman and Svenson, 2009).
Notes: Estimates assume intra-cluster correlation of 0.1; variation explained at the market level of 0.1; variation explained at the HF/HP level of 0.1; variation explained by a covariate at the market level of 0.1 (e.g., market size). Power of 0.8 and confidence of 95% are assumed in all cases. (1) KePSIE Data Pilot (2014). Score/maximum score for an equal weighting scoring system from the pilot of the Checklist for Singular/Joint Inspections for Public and Private Medical Institutions. (2) Based on results for India from Das et al (2012), adjusted for Kenya based in on-going pilot. (3) Based on statistics of Infection, Prevention and Control (IPC) Adherence from WHO reviews (2008, 2012), including hand hygiene, safe injection and sterilization practices. Sources are of different scope. (4) Based on results for India from Das et al (2012) (5) Based on data from counterfeit medicines for Kenya from the National Quality Control Laboratories (NQCL, 2005), and statistics from small-scale studies in sub-Saharan Africa that find prevalence ranging between 12% and 48% (see the compilation of KePSIE’s protocol and data instruments) (6) and (7) KePSIE Data Pilot (2014)
The estimates in the table below are based on conservative assumptions. At least two important additional adjustments will improve the precision of the estimates and decrease the MDE:
Stratification of the clusters based on information from the baseline, before the randomization takes place. This stratification will be based on a few variables that capture part of the between-cluster variation in the outcomes of interest and will help with the precision of the estimates.
Likely higher take-up rates. We assume below a HF take-up rate of 80%. However, as mentioned previously, the first treatment arm (High Intensity of Public Health Inspections Regime with Public Disclosure of Quality Score) is a regulatory treatment where HFs cannot refuse. HFs can refuse to be interviewed so we still budget for non-response but from the pilot experience, most HFs will consent to participate if the appropriate permits and notice has been processed. The second treatment arm offers
Investment Climate Impact Program
18
free supportive supervision to HFs, which is a reason why this arm could also potentially report a higher take-up. Further, the HFs have an incentive to not fall behind, especially considering that all HFs in each market will be subject to the same regime.
9. DATA COLLECTION We will use a combination of methods and instruments to collect the data, including surveys to health facilities, patients and health workers, covert observation of health workers provision of care (through Standardized Patients), overt observation of patient-health worker interactions, and administrative data. For the proposed quantitative data collection, three main activities are planned: (i) a pilot to develop and test all survey instruments (January-June 2014); (ii) a baseline data collection (starting August 2014); and (iii) a follow-up data collection. The follow-up data collection has been proposed to come 12 months after the baseline.
9.1 QUANTITATIVE INSTRUMENTS Four types of quantitative data collection will be included as following (please refer here to review the instruments that were used during the pilot):
1. Survey Data on Quality of Care Patient Safety Standards (Checklist and other indicators): An assessment of compliance with the minimum quality of care and patient safety standards will be collected through surveys to all health facilities in the treatment and comparison groups at baseline and then at a follow-up after the intervention takes place.
2. Standardized Patients to Measure Quality of Health Care Delivery: As mentioned previously, this data collection method consists of the use of unannounced Standardized Patients who are recruited, and extensively trained to present a consistent case of illness to diverse health care providers. This is considered a “golden standard,” among other reasons, because it reduces common biases from self-reported measures of quality of health care provision when real patients are surveyed, and also because it allows for valid comparisons across different facilities. Unlike prescription audits and vignettes, which measure clinical knowledge and competence, the use of SPs is an innovative approach that has been shown to accurately assess provider practice. This is important, since clinical practice can differ substantially from competence. This method was used in India to examine quality of care for angina, asthma and dysentery (Das et al., 2012). Findings show low levels of medical training, frequent incorrect diagnoses and prescribed treatments. Results from this study are contributing to establish benchmarks for the overall quality of care for specific cases and also for a more focused policy approach. For Standardized Patients (SPs), health care workers (HCWs) are randomly chosen (i.e., the SPs go to any HCW that is assigned to them).
3. Direct Observation of Patient Safety Practices: This data collection will take place through direct observation of the interaction between health care workers (HCWs) and patients while in consultation or in the laboratory. In most HFs, there are usually one or two HCWs in service. During the pilot, we split the time of the surveyors (5 hours in total) between the HCWs in service. For big HFs, we randomly chose up to 4 HCWs to be observed during the 5-hour period. Direct observation is currently considered the gold standard to measure compliance with infection, prevention and control standards such as hand hygiene and safety injection practices because this is the only method available that allows, for instance, registering opportunities and actions to assess the number of times and appropriate timing of actions in the sequence of care (The Joint Commission, 2013). This then allows the building of indicators that can be replicated and compared across diverse types of health providers. The disadvantage of this method is potential observation bias, which results from health providers changing their behavior because they are aware that they are being observed (the “Hawthorne Effect”). For the type of practices selected for this module, the prior about the low level of compliance with these practices, and the type of research
questions these indicators intend to answer, there is strong evidence that the advantages of overt observation exceed the disadvantages. The final analysis will include a discussion of the potential implication of observation bias in this case.
4. Survey Data on Prices and Quantities: Data on prices of select health services will come from two different sources. First, from the cases of standardized patients. Second, from a random survey on select services, collected from patients exiting public and private health facilities. Data on quantities will be collected at the health facility level.
9.2 MANAGEMENT OF DATA QUALITY Given the complexity of the exercise, we will take exceptional steps to ensure the quality of the data and complete confidentiality of the work to protect research subjects. In addition to including a full-time field coordinator, and developing a monitoring protocol with multiple checks during data collection, the quality of the data will be further enhanced through the following five activities:
1. Extensive pilots of data collection instruments: All data collection instruments were piloted by a survey firm and the WBG team, including: all stages of questionnaire development, logistic planning, electronic data entry systems, and implementation in the field. For instance, the pilot for the standardized patient instrument tool place, and three months of WBG staff support was allocated just for this exercise. As part of the exercise, the WBG team participated in the development of the cases, the training of standardized patients, and the implementation in the field. An “adverse events roster” was maintained to record any adverse event with the standardized patients and no event was reported.
2. Advisory Group: An advisory group composed of Kenyan medical professionals was contracted to provide key advice for the full term of the pilot. They helped develop the Standardized Patient cases, and also to served as a technical advisory group to finalize the clinical cases appropriate for the Kenyan context, and their corresponding scripts.
3. Training of Field Coordinator, Research Assistants, and Interviewers: Intensive training will be conducted by the WBG team, and personnel of the data collection firm through workshops and field visits. The training will include the following components: (i) theoretical, including the content of questionnaires and clinical cases; (ii) technical, including the use of tablets for completing electronic questionnaires; (iii) classroom practice; and (iv) field practice. Following the training, SPs, interviewers, supervisors, data editors and data managers will be evaluated based on their understanding of the questionnaires and their ability to correctly record data using the same test scenarios as used in the classroom practice. The training period will conclude only when the field teams have demonstrated mastery of the designated tasks, and decisions as to which field staff will take part in the data collection will be made on the basis of this training and evaluation. All training activities were piloted between January and June 2014.
4. Electronic data collection: This will allow checking in real time and therefore immediate corrections with surveyors. The data will be saved in a secured server with restricted access. Only authorized users will be able to retrieve reports. Protocols will be in place for audio recording of interviews and for using the audio interviews for second data entry to crosscheck against the first data entry during electronic data collection. The second entry will be conducted on a subset of the interviews as determined by the IFC/WB team. Procedures will also be specified for identifying and reconciling mismatches between first and second entry and for identifying and fixing errors in survey IDs. The protocol will also include a strategy for ensuring prompt feedback to field teams on any errors encountered and for organizing and logging questionnaires once entered.
5. External Quality Data Collection Auditing: All instruments of data collection will undergo external auditing to verify quality.
Investment Climate Impact Program
20
We believe that the combination of considerable advance planning, full team participation in the pilots and development of the modules and a well-functioning electronic data entry system will guarantee extremely high quality data. These are strategies that we have followed before, and the data from our previous work is universally regarded as extremely high quality.
9.3 ETHICAL ISSUES Extensive care will be taken to ensure that this study accounts for the rights and welfare of all participants involved. The research team already has obtained Human Subjects Certification through the U.S. National Institutes of Health. Enumerators will be chosen from a pool of experienced surveyors and receive intensive training on informed consent and confidentiality procedures. The research team, led by the Lead Researcher Jishnu Das, submitted the research protocol for review to AMREF ESRC on January 9, 2014. Following comments from the ESRC to the initial application, the research team responded to the comments on January 13, 2014 and this revised protocol was approved by the Committee on January 21, 2014 for a period of 1 year. Standardized Patients By nature, the use of Standardized Patients requires careful ethical consideration. We have extensive experience in foreseeing, managing and limiting any potential risks to both participants and medical providers. The first step begins in realizing the limitations of the types of cases that can be used in a given context. By necessity, all cases involving childhood illnesses and invasive exams are excluded as, in some contexts, even the use of a thermometer can cause a health risk to the SP. All final SP cases for this study will be developed in close collaboration with the technical advisory group, which includes a panel of medical professionals, to develop only those cases that are most relevant and safe in Kenya. Further, this study builds on similar studies using SPs in middle- and low-income countries and the lessons learned from those studies. A key concern with using SPs is the potential that they may be detected over the course of the study. In India, detection rates were less than one percent during the pilot phase, and no cases were detected in the main survey. In our pilot in Kenya, no cases were detected. Both in Kenya and India, during approximately 150 hours of training, SPs were coached by a professional standardized patient trainer, doctors, and an anthropologist to consistently portray the emotional, physical, and psychosocial aspects of the case and to accurately recall interactions with providers. All SPs were also thoroughly trained to make plausible excuses to avoid thermometers, needles, and pelvic exams and to hide medicines that doctors requested them to ingest in the clinic. The materials from the India study were used in substantial technical transfer for the Kenya study, including similar strategies to identify and mitigate potential harm. These activities were part of the pilot to develop clinical cases appropriate for the Kenyan context. The pilot started with the SP cases already developed for India (and tested in China based on the Indian instruments), for angina, asthma and dysentery (Das et al., 2012). All the steps described previously belonged to the identification stage, with emphasis on documenting and reporting what worked and what did not work. These insights constituted the basis of the fine-tuning of the final instruments to collect data for the study. Consent All subjects will be informed of the study design and consent will be obtained. For the surveys conducted, study participants will either be health care providers, health facility staff, SPs, or patients upon exiting a facility. Participants will be informed that the purpose of the study is to provide information on ways to improve patient safety and quality of care in Kenya, and will be given a copy of study information and consent forms, as well as contact information for any questions or concerns regarding their participation and the results of the study. For SPs, providers will be informed of the study design and given a timeline during which they can expect to be visited by one or more SPs, e.g. 4 to 6 weeks. For the patient safety surveys, enumerators will have a medical and/or nursing background and be attentive and responsive to the interview with the personnel of health facilities.
Investment Climate Impact Program
21
Confidentiality The information collected will remain secure and confidential. Participants will be assigned unique identification numbers, and survey forms will be immediately encrypted when completed by enumerators on electronic devices. All data will be transported as encrypted files and stored on a private server with restricted access. Any information related to the study will be stored in secure locations, and only the research team and data staff from the survey firm will have access to the study data. Identifying details collected as a part of the study will be removed during data cleaning, with only core research team having secure code for accessing personal information, and data will be analyzed anonymously to ensure that no participant can be personally identified in any publicly released data. WB/IFC staff will also perform visits at random to sampled locations to ensure that questionnaires are administered properly: informed consent has been taken; respondent is given the option of not responding to certain questions; and enumerators are asking questions in an appropriate way that both ensures the accuracy of data and preserves the dignity of respondents.
9.4 QUALITATIVE INSTRUMENTS Qualitative data collection will include: (i) activities with an anthropologist, who will work closely with the evaluation team to provide insight on the processes and products to be put in place as a part of the broader study; (ii) focus group discussions carried out with health facilities personnel to collect information on challenges during the implementation of the treatment arms, and (iii) focus group discussions with doctors and SPs through the development and fine-tuning of the SPs module.
9.5 IE IMPLEMENTATION MONITORING SYSTEM A monitoring system will be in place to track the implementation of the intervention. This will be facilitated by the use of electronic devices to conduct the inspections and the supportive supervision sessions in the two treatment arms. All other activities will also be tracked to assess the adherence to the plan and protocols, and investigate the characteristics of the treatment delivered. Data on the cost of the intervention of each treatment arm will be monitored closely. A plan of all of the resources required and the cost of the intervention will be part of a planning exercise to be held in September/October 2014 with the participant counties and the MOH. Following that exercise, the planning for the procurement of the services required for the arms will be developed and all the costs will be recorded as part of the implementation monitoring system.
10. DATA PROCESSING AND ANALYSIS
10.1 DATA CODING, ENTRY, AND EDITING Health facility and health care worker level data will be collected through interviews and observation; standardized patients and patients’ data will be collected through observation and face-to-face interviews using electronic questionnaires. This allows data entry to be done automatically in the field, and information to be available for analysis immediately after surveying. This implies that most data coding and labelling will take place during the design of the questionnaires. For the Practice of Patient Safety that will be paper-based using direct observation, protocols for data-entry have been developed. Data entry protocols developed aim to generate variables that correspond clearly and logically to the question labels used in the questionnaires alongside a coding strategy that maintains consistent, unique identifiers for matching data. There will also be procedures in place to back up and compile data regularly (by the data manager) and conduct spot-check, cleaning and archiving of data. This includes identifying redundant observations, ensuring all components are correctly linked and datasets can be merged cleanly, completing inventory of database, and completing electronic archiving of questionnaires.
Investment Climate Impact Program
22
Final databases of all completed data will be compiled with the appropriate unique identifiers (health facilities, health care workers, SPs, patients), clearly labeled variables and response options, and be supported by corresponding dictionaries. This will also include final response rates and replacement of health facilities, SPs or doctors from the original sample. The control checks and protocols developed for all coding, data entry and editing, will be reported in a technical annex. Data quality controls will be in place at two levels: internally and independently. The survey firm will conduct internal quality checks, including validation of error rates as all data is processed, back-checking 10% of the interviewers’ work by supervisors, and addressing data inconsistencies. Independently, all data will be hosted by the research team to ensure independent data-entry checks at multiple levels. The research team will provide oversight and closely monitor quality control at each stage of the research process by reviewing and approving developed study materials and tools, accompanying and witnessing field interviews and conducting joint supportive supervision visits to the field teams, as well as reviewing and approving a data analysis plan.
10.2 MODEL SPECIFICATION FOR QUANTITATIVE DATA ANALYSIS Equation (1) shows the general formula to estimate the impacts of the program. A simple mean difference of the outcomes of interest between the treatment and the comparison groups (or between both treatment groups) will suffice to estimate the impact of the program under a standard randomization. However, since the randomization is conducted at the local market level, equation (1) also includes some additional controls, in case the treatment and control groups are not balanced at the health facility level:
(1)
where Yit indicates any of the outcomes of interest (e.g., compliance with the minimum quality of care and patient safety standards) for facility i at time t (t=0,1) with t=0 marking the baseline and t=1 the follow-up; Ti is the treatment indicator that equals one for facilities belonging to the treatment groups and zero for facilities in the control group; Xit are a set of time-variable characteristics to control for, particularly, those that may differentiate treatment and control groups at baseline, and could be correlated to receiving treatment and to the outcomes of
interest; δ is the parameter of interest and represents the impact estimate; and it represents a set of random time-varying unobserved characteristics. This equation will be estimated through regression analysis with standard errors clustered at the local market level. The treatment estimators will correspond to the population treatment effects for the three counties as we will have the population and non-response is expected to be low. In the case there are dropouts we will be able to estimate intent-to-treat estimators, but this is more likely to happen for the supportive supervision arm since inspections are mandatory. To address multiple hypothesis testing we will use the Bonferroni correction. Variables at the market and health facility level will be collected to address potential selection due to attrition, non-response, take-up rate issues that arise for correlation between the treatment indicator and the outcomes of interest.
11. STUDY LIMITATIONS AND RISKS The major challenge of this study stems from significant coordination required to define and implement the diverse elements of the treatment arms, which are assumed to impact patient safety and quality of care. As mentioned previously, the design of these arms has been and will continue to be a join effort involving all the stakeholders (the MOH and the regulatory boards and councils, representatives of the private health care sector, and the IFC/WB impact evaluation team). Currently, there are diverse groups working on elements that will constitute inputs for this study, some of which are at the same time aligned with the MOH policy goals and strategy. Therefore, a well planning system, and a long-term dialogue and commitment of all key stakeholders represent the cornerstones of the strategy we have in place to address this issue.
Yit Ti Xit it
Investment Climate Impact Program
23
12. IE MANAGEMENT
12.1 EVALUATION TEAM AND MAIN COUNTERPARTS The IE team member are Guadalupe Bedoya (DECIE) Jorge Coarasa (GTCDR), Jishnu Das (DECHD), Amy Dolinger (GTCDR), Ana Goicoechea (GTCDR) and Njeri Mwaura (GTCDR). The team is advised by Khama Rogo (GTCDR) and supported by Frank Wafula (GTCDR), Pamela Njuguna (GTCDR), Benjamin Daniels (DECHD), and Sherlene Chatterji (DECIE). Below is the list of Government and Private sector Counterpart Representatives, and other local collaborators, followed by the bios of the IE team. These groups constitute the core participants and collaborators contributing to the development of all the inputs and material for the implementation and analysis of the study.
Table 3. Local Collaborators
Role Name Organization
Local Counterparts
Government and Private sector Counterpart Representatives
Dr. Pacifica Onyancha Quality Assurance and Regulations
Dr. Charles Kandie Division of Health Standards and Quality Assurance, Ministry of Health
Linda Komen Nutrition Council
James Owuor Pharmacy and Poisons Board
Evelyn Rotich Nursing Council of Kenya
Sarah Thandi Radiation Protection Board
Dr. Amit Thakker Kenya Healthcare Federation (KHF)
Peter Sewe Clinical Officers Council
Daniel Yumbya Medical Practitioners and Dentists Board
Andes Zavai Kenya Medical Laboratory Technicians and Technologists Board
Standardized Patients
Advisory Committee Dr. Charles Kandie MOH
John Kabanya MOH
Dr. Fatmah Abdallah MOH
Sarah Chuchu MOH
Rahab Maina MOH
Dr. Izaq Odong MOH
Dr. Rachel Nyamai MOH
Dr. Njeri Mwaura IFC
Prof. Ruth Nduati University of Nairobi
Drug Testing Protocol and Pilot Dr. Bernard Olayo MD, MPH IFC
Checklist and Regulatory Framework
Technical Working Group Dr. Loise Mutai MPDB
Mrs. Mary Nyamboki NCK
Mr. Peter Sewe COC
Mr. Peter Kagiri RPB
Dr. Amit Thakker KHF
Mrs. Betty Samburu NC
Mr. John Kabanya MOH/DHSQR
Mrs. Mildred Wasike Public Health
Mrs. Idah Ombura KMLTTB (TBC)
Dr. James Owuor PPB (TBC)
Investment Climate Impact Program
24
KePSIE Team Bios
Jishnu Das (Lead Researcher) is a Lead Economist in the Development Economics Research Group (Human Development and Public Services Team) at The World Bank and a Visiting Scholar at The Center for Policy Research, New Delhi. He received his Ph.D. from Harvard University in Economics in 2001. Since joining the World Bank, Jishnu has worked on issues related to the delivery of basic services, particularly health and education. His work draws upon data collected in Zambia (education), India (health and education), Pakistan (education) and Paraguay (health). His recent research focuses on the quality of health care (Journal of Economic Perspectives, Health Affairs, and the Journal of Development Economics); correlates of mental health (World Bank Economic Review, forthcoming, and Social Science and Medicine); the link between teacher absenteeism and student test-scores (Journal of Human Resources); and the structure of educational provision in Pakistan (Comparative Education Review). In 2006, his work on religious education in Pakistan received the George Bereday Award from the Comparative and International Education Society. He also works on natural disasters in the context of an earthquake that hit Northern India and Pakistan in October 2005. He co-founded the website www.risepak.com to help coordinate relief in the aftermath of the quake. The website was awarded the Stockholm Challenge Award (2006) for the best ICT project in the public administration category. Guadalupe Bedoya (Co-Principal Investigator) is an Economist in the Development Economics Research Group (Development Impact Evaluation Unit, DIME) at the World Bank. She received a Master’s degree in Economics and Public Policy from Princeton University in 2007, and a Ph.D. in Public Policy from the University of Chicago in 2011. Guadalupe has over 8 years of work experience in economic analysis, policy design, and impact evaluation. Her current work includes designing, analyzing, and supervising diverse impact evaluations across multiple sectors and countries, aiming to understand what works, and especially why interventions may or may not work, with the overarching goal of building knowledge to improve policy effectiveness. Before joining DIME, Guadalupe worked at the Ministry of Finance and the Department of Economic Planning in Colombia; the Inter-American Development Bank in the U.S., and also conducted fieldwork in diverse microfinance organizations in India. Jorge Coarasa (Health in Africa Expert and Management Support) is a Senior Economist with the World Bank Group Investment Climate Department where he focuses on private participation in health and education. He started with the WBG at the IFC office in Nairobi where he managed the Health in Africa Initiative Advisory Services projects in Kenya, Nigeria and Tanzania. Before joining IFC he was a Deputy Director General with the Ministry of Social Development of the Mexican Government. He oversaw the strategic planning of 18 national social programs aimed at increasing access to health, education and social protection for the poor. He has been a consultant on human development issues with the World Bank and the UN, a teacher at a rural teacher training college in Mozambique and a management consultant with Deloitte Mr. Coarasa Holds graduate degrees in Economics from ITAM in Mexico City, International Relations from Universidad Complutense de Madrid and Public Administration from Harvard University. Benjamin Daniels (Research Assistant) works at the World Bank’s Development Economics Research Group. He joined the World Bank after completing a degree in economics at Pomona College in 2011, investigating inequalities in children's outcomes after the 2005 Pakistan earthquake. He received his master's degree in Economics and Philosophy from the London School of Economics in 2013, and worked as research assistant at the Grantham Institute there, studying the socioeconomic patterns of domestic solar subsidies. He has since returned to the World Bank and plans to apply to Ph.D. programs in 2014. Amy Dolinger (Field Coordinator) works in the IFC’s Investment Climate group. She graduated from the Paul H. Nitze School of Advanced International Studies at Johns Hopkins University with a Master’s degree in international development and economics. She has also worked as a Research and Policy Summer Associate with Innovations for Poverty Action (IPA) in Malawi, and was a U.S. Peace Corps volunteer in Morocco. Ana Goicoechea (Impact Evaluation Project Manager) is a Senior Private Sector Development Specialist in the World Bank Group Investment Climate Department. She currently leads the Investment Climate Impact Program, managing a cluster of about 10 impact evaluations that aim at assessing the impacts of various regulatory reforms
that are relevant for private sector growth. She has over 10 years of experience in the World Bank Group with a focus on impact evaluation, results-based management, and policy analysis on infrastructure and private sector development. She has an educational background in economics and international development and holds a Masters in Public Policy from the University of Maryland. Racheal Njeri Mwaura (Kenya Health in Africa Project Team Leader) recently joined the World Bank Group and manages the Health in Africa Initiative Advisory services project in Kenya. Prior to joining IFC, she was a programme manager at African Medical Research Foundation (AMREF) – where she managed two large national programs focusing on strengthening the national HIV&AIDS M&E framework and health care provider capacity and strengthening organizational and technical capacity of community based organizations through a grant making and capacity building programme. She was also the gender focal point at AMREF Kenya. She also worked at the Ministry of health in Kenya, in the sector monitoring and planning department at national level and as a District Medical Officer of Health in charge of all health service delivery and provision where working jointly with stakeholders she significantly improved the health outcome indicators of the district. She is also the national assistant secretary of the Kenya National Medical Women’s Association. Dr Mwaura holds a medical degree from Makerere University, Kampala Uganda and a postgraduate diploma and masters of Science in Public health from London School of Hygiene and Tropical Medicine – University of London. Khama Rogo (Kenya Health in Africa) is Lead Health Sector Specialist with the World Bank and Head of the World Bank Group's Health in Africa Initiative. Prior to his WB career, he taught Obstetrics and Gynecology at the University of Nairobi, before becoming the Vice President of Medical Affairs Africa for Ipas. A native of Kenya, Prof Rogo received his MD and M.MED from the University of Nairobi and earned a Fellowship and PhD in Gynecologic Oncology in Sweden. A prominent advocate and global authority on reproductive health issues, he is a visiting professor at several universities and author of over 100 papers and book chapters. He has been a consultant to WHO, UNFPA, UNICEF, USAID, and DFID, and advisor to many other bilateral and unilateral international organizations. Prof. Rogo is past president of the Kenya Medical Association and Kenya Obstetrical and Gynecological Society. He was also the chairman of Kenya's National Council for Population and Development, and served on the Gender Advisory Panel of WHO, the Advisory Committee of the David and Lucile Packard Foundation, and the board of the Center for African Family Studies. He is currently on the board of INTRAHEALTH, among other responsibilities.
12.2 WORK PLAN AND DELIVERABLES
Table 4. Milestones, Deliverables, and Estimated Timeline
Milestones Deliverables Completion Date
Methodology note Note November 15, 2012
Peer reviewed Concept Note Concept Note July 2013
Data collection plan and pilot TORs Questionnaires
June 31, 2014
Pilot Data Analysis and Adjusted Instruments
Pilot Reports and Adjusted Instruments
August 30, 2014
Data collection (Baseline) Cleaned data Dictionaries
December 30, 2014
First data analysis
Presentation Data file Do files Baseline report
April 30, 2015
Implementation Plan for intervention
Rollout plan October 30, 2015
Implementation of intervention aligned to evaluation
Monitoring reports verifying treatment and control status
Data collection (Follow-up) Cleaned data Dictionaries
May 30, 2016
Final report and policy notes
Technical note Policy note Data file Do files
August 30, 2016
Dissemination of findings Presentations September - December, 2016
12.3 BUDGET The total budget for the IE is USD$1.95 million including all the staff time of the IE team. So far we have secured about 72 percent of this budget including resources from the project, part of the IE team time by their units, and other external funding. Below is the budget by category.
Table 5. Total Budget per Category
Category USD %
Staff $562,300 29%
STC/STT/ETC $283,300 15%
Data Collection $827,736 43%
Travel $232,450 12%
Workshop $39,799 2%
Total $1,945,585 100%
13. PLAN FOR USING DATA AND EVIDENCE FROM THE STUDY There are four sets of audiences who would benefit from this study. The primary audience includes the relevant government agencies in Kenya who would use the evidence generated from the study to directly inform policy decisions regarding systems that improve patient safety and quality of care. In addition, the consumer signaling mechanism that would be developed as part of this study would also inform the general Kenyan public as they choose a health facility. Besides the primary clients, the study results would also inform policy makers and regulatory authorities in other countries who are also looking to understand the best way to improve patient safety and quality of care in their respective countries. And finally, the study will also inform the larger development community supporting programs to improve health systems around the world, as well as those looking at governance related issues, particularly centered on inspection processes. As mentioned previously, this study has benefitted immensely from the long-term relationship that has been built with the Kenyan government and the private healthcare sector in the country as part of the Health in Africa Initiative (HIA), a five-year program established by the World Bank Group in 2009. The HIA Kenya project, and now the impact evaluation team have been providing technical support to the government. In the study, steps have been taken to ensure that the policymakers, stakeholders and researchers are engaged throughout the study period, so that the study remains relevant from a policy perspective. As part of the study, several working groups with representation from all stakeholders have been formed and workshops with participation from all stakeholders convened. The workshops and working groups allow for consensus building and setting up a constant feedback mechanism, as by sharing project outcomes and fine-tuning the study based on feedback, the team will ensure that the impact evaluation is directly linked to policy outcomes.
Investment Climate Impact Program
27
Given the complexity of the study, care has been taken to ensure that the intermediate and final outcomes from the study are shared with the relevant audiences in the best possible way. The dissemination strategy thus designed is centered on three pillars:
1. Preparation of Reports/Papers and Briefs: The World Bank Group team will prepare technical reports with data analysis as well as policy briefs for non-technical audiences after the completion of baseline and follow-up data collection. These reports and briefs will be published in both, electronic and hard copy form.
2. Workshops:13
The team will organize national workshops following the completion of major reports (baseline and end-line) with the participation of the MOH, the regulatory boards, the private sector and other stakeholders to share the results. In addition to providing a mechanism for disseminating findings, these workshops will serve as a platform for consensus building. Besides this, the results will be presented at international forums (seminars, conferences, WB workshops), and internal global practices. The dissemination strategy will use the local network and the international network that starts with the Health in Africa project that is ongoing in 8 countries in Africa.
3. Media dissemination: Results stories as well as information campaigns to inform consumers in
participating counties about patient safety will be distributed through the media.
13
Two relevant workshops recently took place. In November 2012, client representatives, researchers, and WBG operational staff gathered for a week in Paris to better understand impact evaluation concepts and start discussions around KePSIE design in a workshop organized by the Investment Climate Impact Program in collaboration with DIME. In October 2013, a larger group of stakeholders, including the seven regulatory boards and the MOH, gathered in Nairobi and agreed on pursuing further the impact evaluation to make policy decisions on inspection reforms in order to maximize patient safety and quality of care.
Investment Climate Impact Program
28
14. REFERENCES Andrabi, Tahir, Das, Jishnu and Khwaja, Asim Ijaz (2013). Report Cards: The Impact of Providing School and Child
Test Scores on Educational Markets. Submitted. Electronic document, retrieved on July 28, 2014 from: http://www.povertyactionlab.org/publication/report-cards-impact-providing-school-and-child-test-scores-educational-markets
Barnes, Jeff, O’Hanlon, B., Feeley III, F., McKeon, K., Gitonga, N., Decker, C. (2010). Private Health Sector Assessment in Kenya. World Bank, Working Paper No. 193. Electronic document, retrieved on July 28, 2014 from: http://pdf.usaid.gov/pdf_docs/PNADS739.pdf.
Besley, Timothy and Persson, Torsten (2007). The Origins of State Capacity: Property Rights, Taxation, and Politics. The National Bureau of Economic Research, Working Paper No. 13028. Electronic document, retrieved on July 28, 2014 from: http://www.nber.org/papers/w13028.pdf.
Bjorkman, Martina and Svenson, Jakob (2009). Power to the People: Evidence from a Randomzied Field Experiment on Community-Based Monitoring in Uganda. The Quarterly Journal of Economics, 124(2): 735-69. Electronic document, retrieved on July 28, 2014 from: http://qje.oxfordjournals.org/content/124/2/735.full.pdf+html.
Das, Jishnu, Holla, Alaka, Das Veena, Mohanan, Manoj, Tabak, Diana, and Chan, Brian. (2012) “In Urban and rural India, A Standardized Patient Study Showed Low Levels of Provider Training and Huge Quality Gaps.” Health Affairs. December. Electronic document, retrieved on July 28, 2014 from: http://content.healthaffairs.org/content/31/12/2774.full.pdf+html.
Duflo, Esther, Hanna, Rema and Ryan, Stephen P (2012). Incentives Work: Getting Teachers to Come to School. American Economic Review 102(4): 1241-78. Electronic document, retrieved on July 28, 2014 from: http://pubs.aeaweb.org/doi/pdfplus/10.1257/aer.102.4.1241.
World Health Organization (2008) “Revised Injection Safety Assessment Tool. Tool C – Revised.” Electronic document, retrieved on February 14, 2014 from: http://www.who.int/injection_safety/Injection_safety_final-web.pdf?ua=1.
World Health Organization (2008) “Hand Hygiene in Outpatient and Long-term Care Facilities.” Electronic
document, retrieved on February 18, 2014 from: http://apps.who.int/iris/bitstream/10665/78060/1/9789241503372_eng.pdf?ua=1. World Health Organization (2010) “Best Practices for Injections and Related Procedures Toolkit.” Electronic
document, retrieved on March 6, 2014 from: http://whqlibdoc.who.int/publications/2010/9789241599252_eng.pdf
World Health Organization (2012) “Safer Primary Care: A Global Challenge.” Electronic document, retrieved on
March 6, 2014 from: http://www.who.int/patientsafety/summary_report_of_primary_care_consultation.pdf
Jin, Ginger Zhe and Phillip Leslie (2003). The Effect of Information on Product Quality: Evidence from Restaurant
Hygiene Grade Cards. Quarterly Journal of Economics 118(2): 409-451. Electronic document, retrieved on July 28, 2014 from: http://qje.oxfordjournals.org/content/118/2/409.full.pdf+html.
Kohn LT, Corrigan JM, Donaldson MS, editors (1999). To err is human: building a safer health system. Washington,
DC: National Academy Press, Institute of Medicine. Electronic document, retrieved on July 28, 2014 from: http://www.fluentmedical.com/docs/To_Err_Is_Human.pdf.
Leape, Lucian L (1994). Error in Medicine. The Journal of the American Medical Association, 272(23): 1851-57. Electronic document, retrieved on July 28, 2014 from: http://hospitalmedicine.ucsf.edu/improve/literature/error_in_medicine_leape_jama.pdf.
Leslie, Phillip and Jin, Ginger Zhe (2009). Reputation Incentives for Restaurant Hygiene. American Economic Journal
(Microeconomics) 1(1): 237-67. Electronic document, retrieved on July 28, 2014 from: http://pubs.aeaweb.org/doi/pdfplus/10.1257/mic.1.1.237.
Muralidharan, Karthik, Niehaus, Paul and Sukhtankar, Sandip (2014). Payments Infrastructure and the Performance of Public Programs: Evidence from Biometric Smartcards in India. The National Bureau of Economic Research, Working Paper No. 19999. Electronic document, retrieved on July 28, 2014 from: http://www.nber.org/papers/w19999.pdf.
Sylvia, Sean, Shi, Yaojiang, Xue, Hao, Tian, Xin, Wang, Huan, Liu, Qingmei, Medina, Alexis and Rozelle, Scott (2014). Survey Using Incognito Standardized Patients Shows Poor Quality Care in China’s Rural Clinics. Health Policy and Planning 29(4): 1-12. Electronic document, retrieved on July 28, 2014 from: http://www.ncbi.nlm.nih.gov/pubmed/24653216.
The Joint Commission (2013). “Accreditation Standards.” Electronic document, retrieved on July 28, 2014 from: www.jointcommission.org/standards.
The World Bank. (2011). Healthy Partnerships: How Governments Can Engage the Private Sector to Improve Health in Africa. Electronic document, retrieved on July 28, 2014 from: https://www.wbginvestmentclimate.org/advisory-services/health/upload/Healthy-Partnerships_Full-Rpt-bkmarks-2.pdf.
Olken, Benjamin A (2007). Monitoring Corruption: Evidence from a Field Experiment in Indonesia. Journal of Political Economy 115(2): 200-249. Electronic document, retrieved on July 28, 2014 from: http://unpan1.un.org/intradoc/groups/public/documents/un-dpadm/unpan041963.pdf.
Zamboni, Yves and Litschig, Stephan (2013). Audit Risk and Rent Extraction: Evidence from a Randomized Evaluation in Brazil. Barcelona Graduate School of Economics, Working Paper No. 554. Electronic document, retrieved on July 28, 2014 from: http://www.econ.upf.edu/docs/papers/downloads/1270.pdf.
Datasets
IFC-WHO Kenya Minimum Patient Safety Standards Compliance Survey (2012)