22
TSX:TML Advancing Toward Production in Ontario TREASURY METALS March 2015 www.treasurymetals.com
TSX:TML
Advancing Toward Production
in Ontario TREASURY METALS
March 2015
www.treasurymetals.com
+
FORWARD-LOOKING STATEMENTS + This presentation contains projections and forward-looking information that involve various risks and uncertainties regarding
future events. Such forward-looking information can include without limitation statements based on current expectations involving a number of risks and uncertainties and are not guarantees of future performance of the Corporation. These risks and uncertainties could cause actual results and the Corporation’s plans and objectives to differ materially from those expressed in the forward-looking information. Actual results and future events could differ materially from anticipated in such information. These and all subsequent written and oral forward-looking information are based on estimates and opinions of management on the dates they are made and expressly qualified in their entirety by this notice. The Corporation assumes no obligation to update forward-looking information should circumstances or management’s estimates or opinions change. This presentation contains projections and forward looking information that involve various risks and uncertainties regarding future events. Such forward looking information can include without limitation statements based on current expectations involving a number of risks and uncertainties and are not guarantees of future performance of the Corporation. These risks and uncertainties could cause actual results and the Corporation’s plans and objectives to differ materially from those expressed in the forward-looking information. Actual results and future events could differ materially from anticipated in such information. These and all subsequent written and oral forward-looking information are based on estimates and opinions of management on the dates they are made and expressly qualified in their entirety by this notice. The Corporation assumes no obligation to update forward-looking information should circumstances or management’s estimates or opinions change. Technical information in this presentation has been reviewed and approved by Mark Wheeler, P. Eng. who is the Qualified Person for the Goliath Gold Project under the definitions established by National Instrument 43-101.
2
+
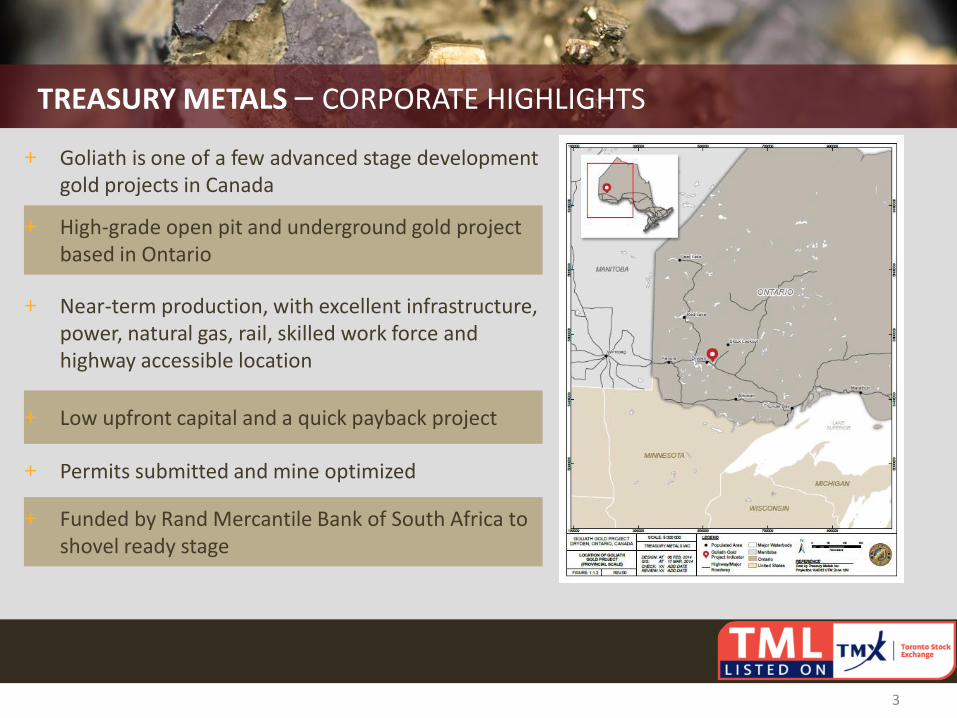
+ Goliath is one of a few advanced stage development gold projects in Canada
+ High-grade open pit and underground gold project based in Ontario
+ Near-term production, with excellent infrastructure, power, natural gas, rail, skilled work force and highway accessible location
+ Low upfront capital and a quick payback project
+ Permits submitted and mine optimized
+ Funded by Rand Mercantile Bank of South Africa to shovel ready stage
TREASURY METALS – CORPORATE HIGHLIGHTS
3
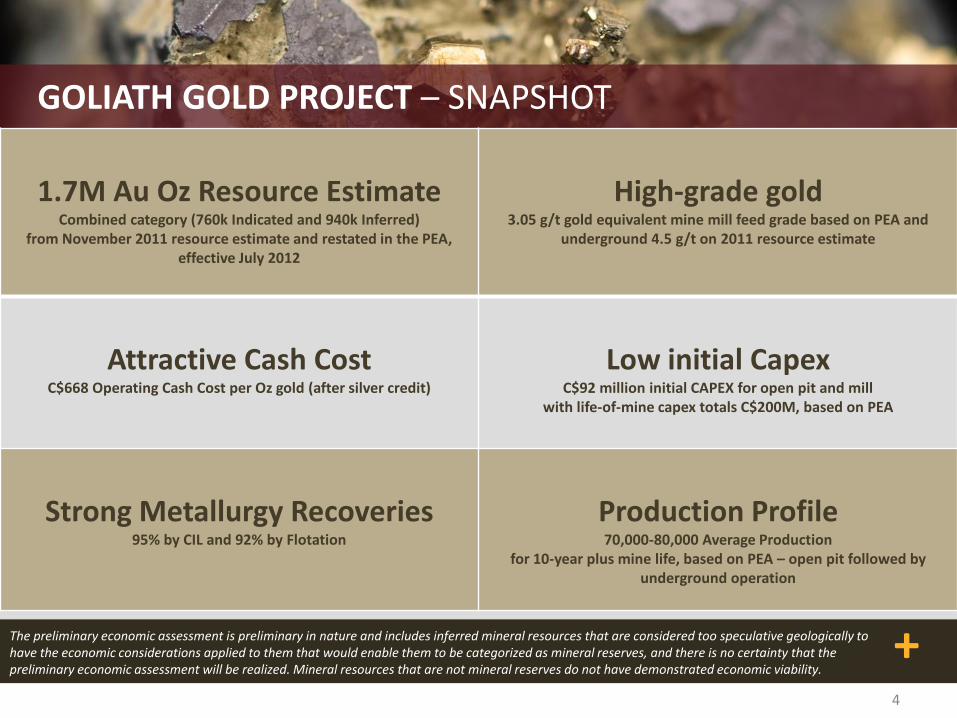
+ The preliminary economic assessment is preliminary in nature and includes inferred mineral resources that are considered too speculative geologically to have the economic considerations applied to them that would enable them to be categorized as mineral reserves, and there is no certainty that the preliminary economic assessment will be realized. Mineral resources that are not mineral reserves do not have demonstrated economic viability.
GOLIATH GOLD PROJECT – SNAPSHOT
4
1.7M Au Oz Resource Estimate
Combined category (760k Indicated and 940k Inferred) from November 2011 resource estimate and restated in the PEA,
effective July 2012
High-grade gold
3.05 g/t gold equivalent mine mill feed grade based on PEA and underground 4.5 g/t on 2011 resource estimate
Attractive Cash Cost
C$668 Operating Cash Cost per Oz gold (after silver credit)
Low initial Capex
C$92 million initial CAPEX for open pit and mill with life-of-mine capex totals C$200M, based on PEA
Strong Metallurgy Recoveries
95% by CIL and 92% by Flotation
Production Profile 70,000-80,000 Average Production
for 10-year plus mine life, based on PEA – open pit followed by underground operation
+
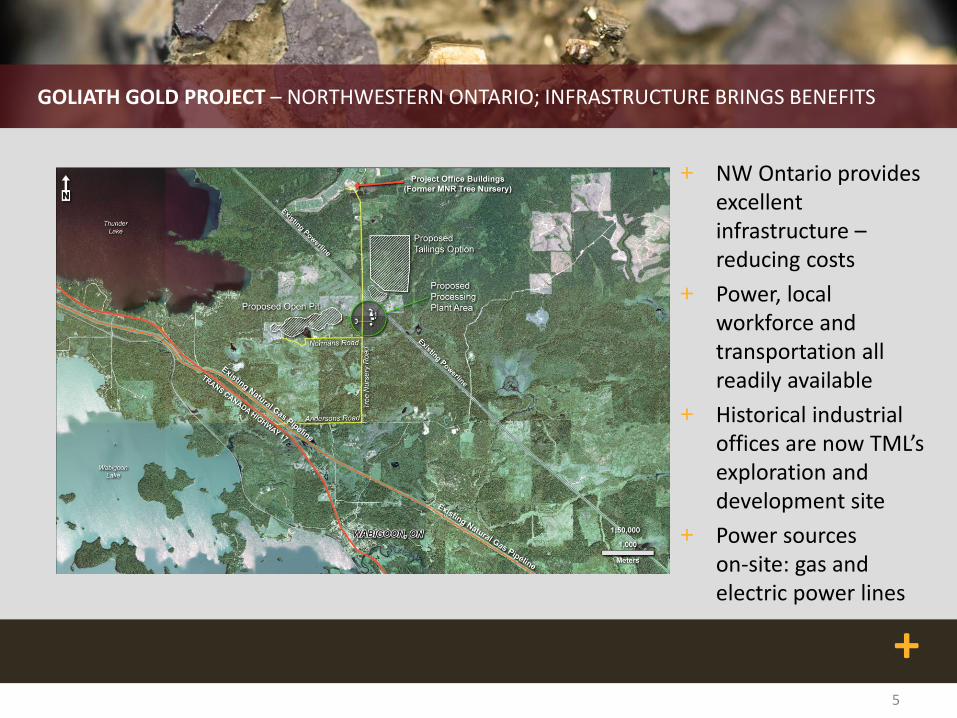
GOLIATH GOLD PROJECT – NORTHWESTERN ONTARIO; INFRASTRUCTURE BRINGS BENEFITS
5
+ NW Ontario provides excellent infrastructure – reducing costs
+ Power, local workforce and transportation all readily available
+ Historical industrial offices are now TML’s exploration and development site
+ Power sources on-site: gas and electric power lines
+ 6
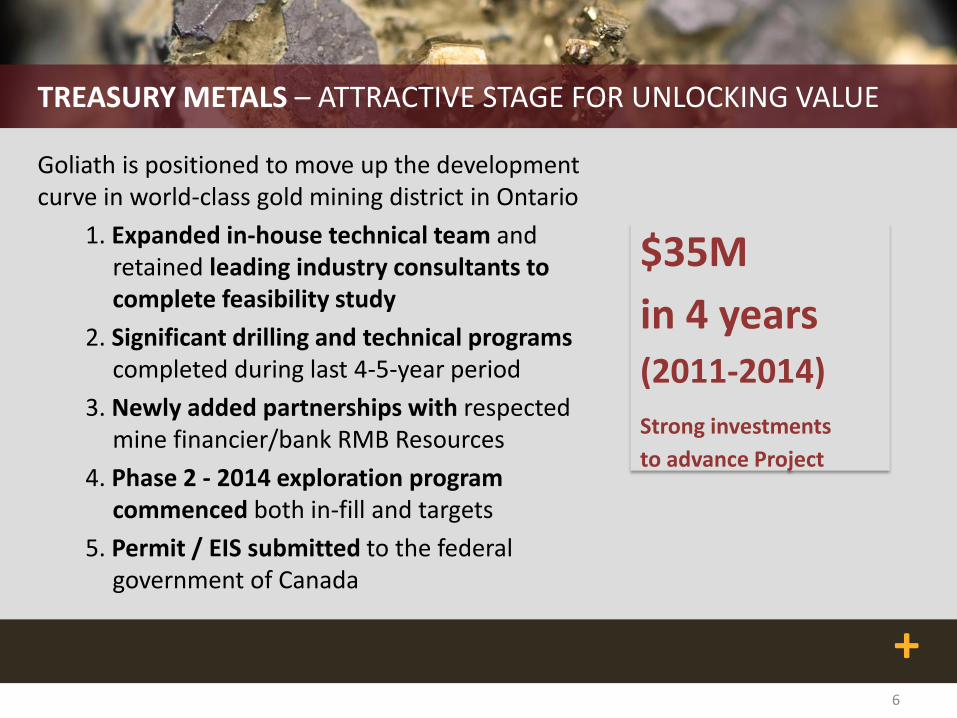
TREASURY METALS – ATTRACTIVE STAGE FOR UNLOCKING VALUE
Goliath is positioned to move up the development curve in world-class gold mining district in Ontario
1. Expanded in-house technical team and retained leading industry consultants to complete feasibility study
2. Significant drilling and technical programs completed during last 4-5-year period
3. Newly added partnerships with respected mine financier/bank RMB Resources
4. Phase 2 - 2014 exploration program commenced both in-fill and targets
5. Permit / EIS submitted to the federal government of Canada
6
$35M
in 4 years (2011-2014)
Strong investments
to advance Project
+
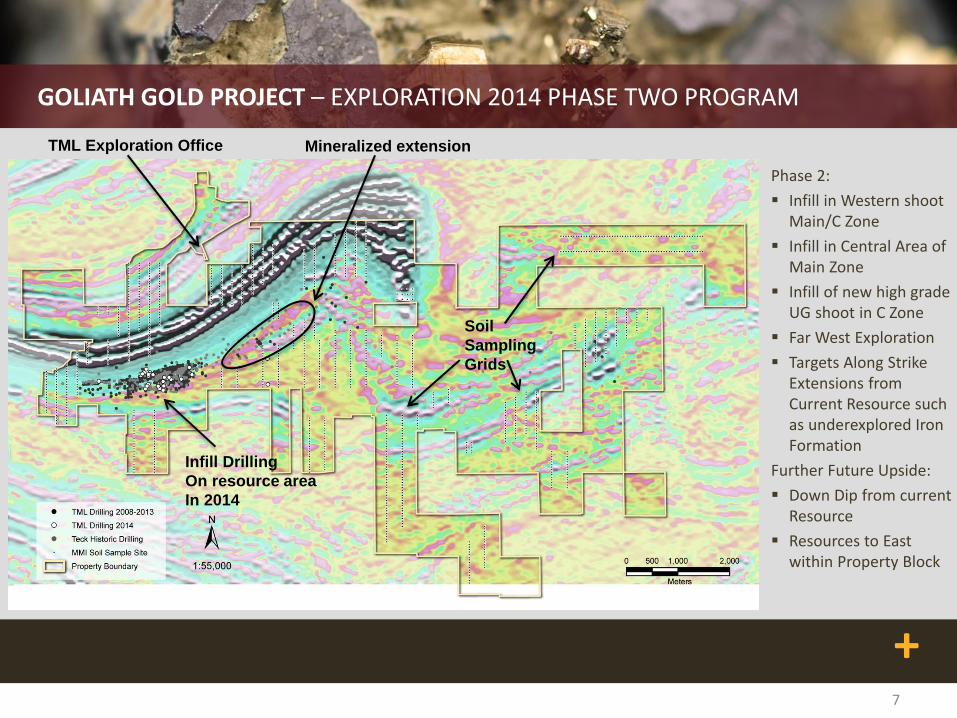
GOLIATH GOLD PROJECT – EXPLORATION 2014 PHASE TWO PROGRAM
7
Phase 2:
Infill in Western shoot Main/C Zone
Infill in Central Area of Main Zone
Infill of new high grade UG shoot in C Zone
Far West Exploration
Targets Along Strike Extensions from Current Resource such as underexplored Iron Formation
Further Future Upside:
Down Dip from current Resource
Resources to East within Property Block
TML Exploration Office Mineralized extension
Soil
Sampling
Grids
Infill Drilling
On resource area
In 2014
+
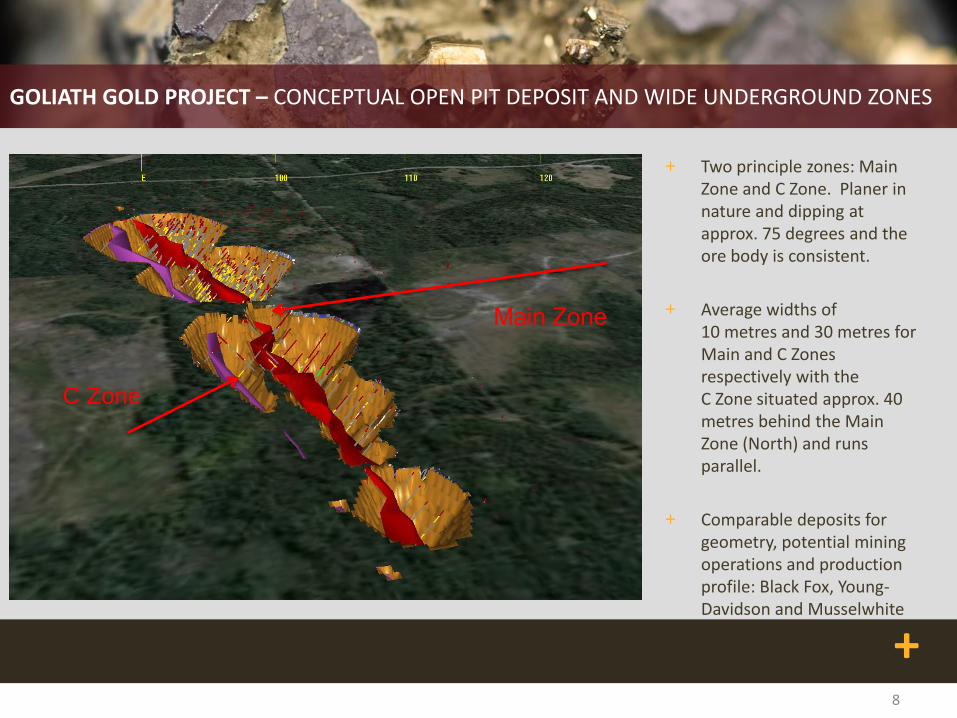
GOLIATH GOLD PROJECT – CONCEPTUAL OPEN PIT DEPOSIT AND WIDE UNDERGROUND ZONES
+ Two principle zones: Main Zone and C Zone. Planer in nature and dipping at approx. 75 degrees and the ore body is consistent.
+ Average widths of 10 metres and 30 metres for Main and C Zones respectively with the C Zone situated approx. 40 metres behind the Main Zone (North) and runs parallel.
+ Comparable deposits for geometry, potential mining operations and production profile: Black Fox, Young-Davidson and Musselwhite
8
C Zone
+
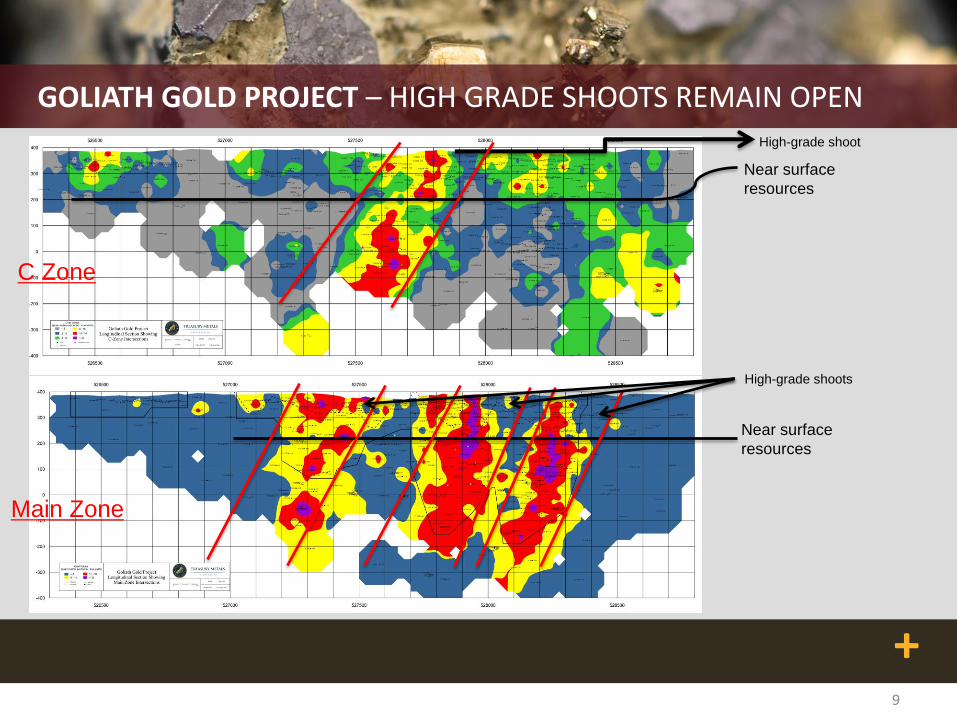
GOLIATH GOLD PROJECT – HIGH GRADE SHOOTS REMAIN OPEN
9
C Zone
Main Zone
Near surface
resources
Near surface
resources
High-grade shoots
High-grade shoot
+
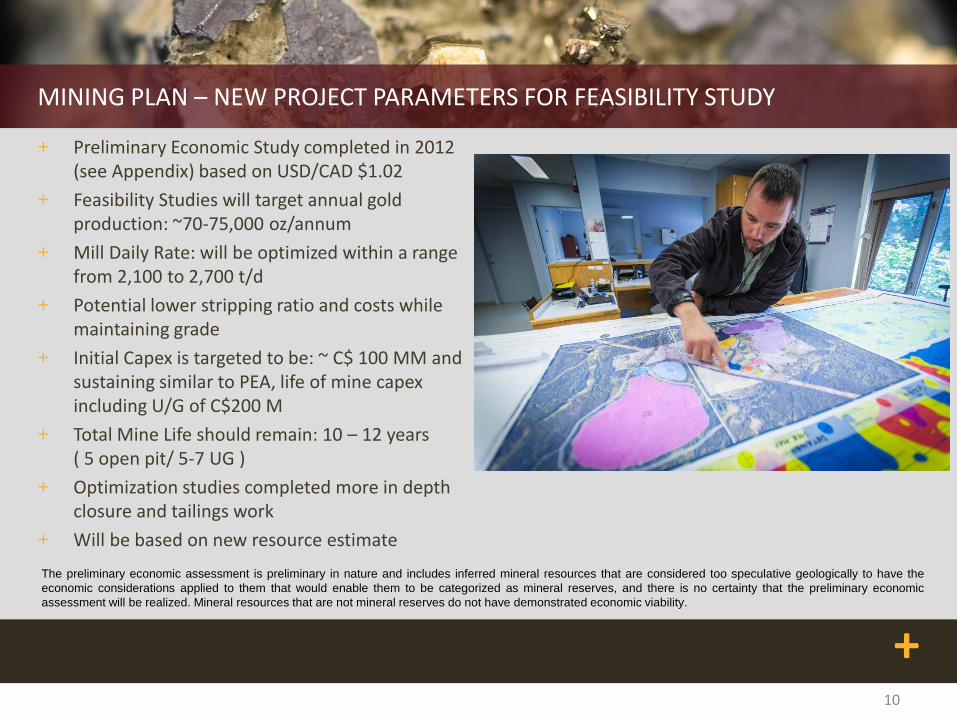
MINING PLAN – NEW PROJECT PARAMETERS FOR FEASIBILITY STUDY
+ Preliminary Economic Study completed in 2012 (see Appendix) based on USD/CAD $1.02
+ Feasibility Studies will target annual gold production: ~70-75,000 oz/annum
+ Mill Daily Rate: will be optimized within a range from 2,100 to 2,700 t/d
+ Potential lower stripping ratio and costs while maintaining grade
+ Initial Capex is targeted to be: ~ C$ 100 MM and sustaining similar to PEA, life of mine capex including U/G of C$200 M
+ Total Mine Life should remain: 10 – 12 years ( 5 open pit/ 5-7 UG )
+ Optimization studies completed more in depth closure and tailings work
+ Will be based on new resource estimate
10
The preliminary economic assessment is preliminary in nature and includes inferred mineral resources that are considered too speculative geologically to have the
economic considerations applied to them that would enable them to be categorized as mineral reserves, and there is no certainty that the preliminary economic
assessment will be realized. Mineral resources that are not mineral reserves do not have demonstrated economic viability.

+
GOLIATH GOLD PROJECT – ALL-IN SUSTAINING COSTS AND POTENTIAL CANADIAN $ INFLUENCE ON COSTS
1Cash Costs and AISC based on Corporate PEA. AISC based on World Gold Council definition. Closure costs were adjusted higher from PEA numbers to better reflect recent Ontario project examples
11
C$1,500 - C$1,600
Higher Canadian gold price and firmer USD gold price
Input Costs declining to neutral
Energy, Employment and Construction
~C$668 per Oz
cash costs (after silver credit)
AISC Summary (US$/oz using C$1.02=US$1.00)
On-Site Mining & Rehandle C$707.19
Preproduction Capital C$129.38
On-Site and Corporate G&A C$23.46
Refining C$13.87
Royalties (Government and Project) C$45.65
Sustaining / Underground Development
C$124.59
Closure C$18.92
Silver Credit -$62.64
AISC 1 C$1,000.40
+
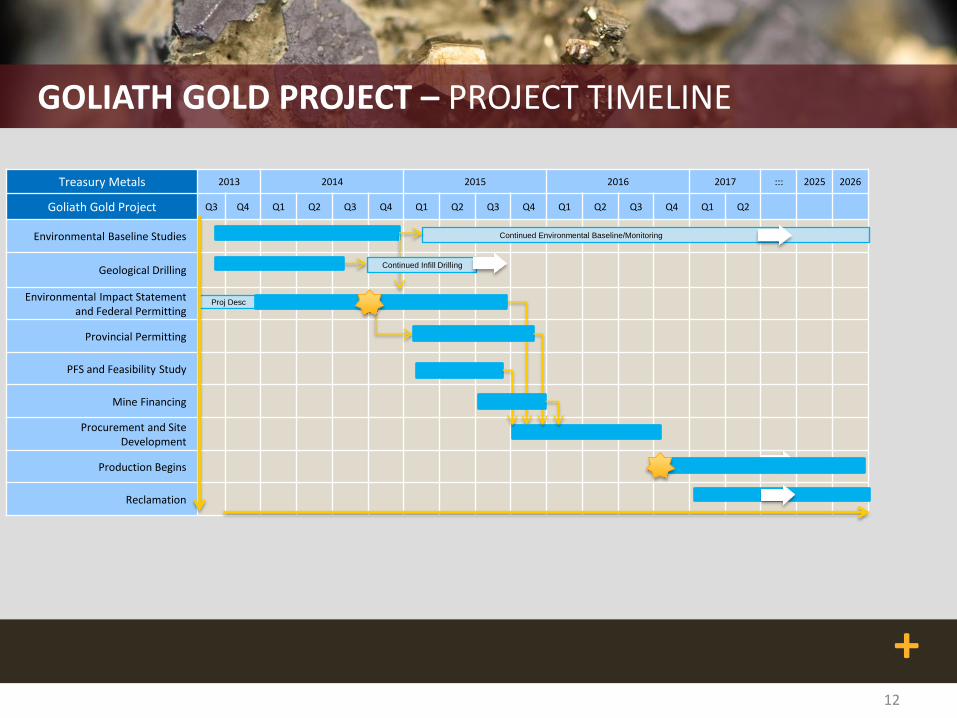
Treasury Metals 2013 2014 2015 2016 2017 ::: 2025 2026
Goliath Gold Project Q3 Q4 Q1 Q2 Q3 Q4 Q1 Q2 Q3 Q4 Q1 Q2 Q3 Q4 Q1 Q2
Environmental Baseline Studies
Geological Drilling
Environmental Impact Statement and Federal Permitting
Provincial Permitting
PFS and Feasibility Study
Mine Financing
Procurement and Site Development
Production Begins
Reclamation
GOLIATH GOLD PROJECT – PROJECT TIMELINE
12
Continued Environmental Baseline/Monitoring
Proj Desc
Continued Infill Drilling
+
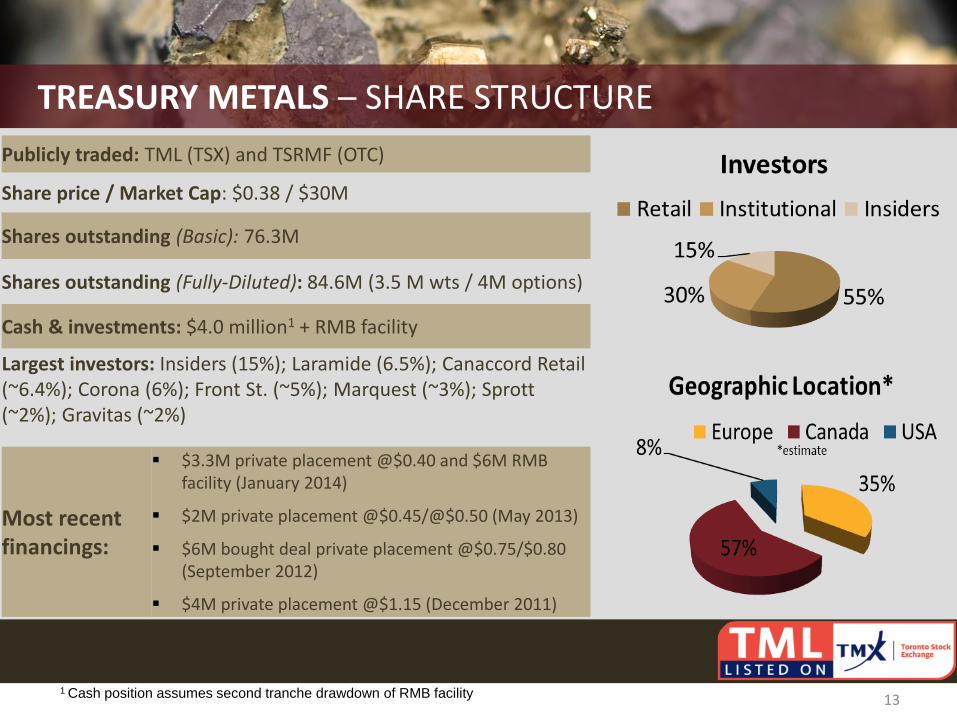
Publicly traded: TML (TSX) and TSRMF (OTC)
Share price / Market Cap: $0.38 / $30M
Shares outstanding (Basic): 76.3M
Shares outstanding (Fully-Diluted): 84.6M (3.5 M wts / 4M options)
Cash & investments: $4.0 million1 + RMB facility
Largest investors: Insiders (15%); Laramide (6.5%); Canaccord Retail (~6.4%); Corona (6%); Front St. (~5%); Marquest (~3%); Sprott (~2%); Gravitas (~2%)
TREASURY METALS – SHARE STRUCTURE
13 1 Cash position assumes second tranche drawdown of RMB facility
Most recent financings:
$3.3M private placement @$0.40 and $6M RMB facility (January 2014)
$2M private placement @$0.45/@$0.50 (May 2013)
$6M bought deal private placement @$0.75/$0.80 (September 2012)
$4M private placement @$1.15 (December 2011)
+
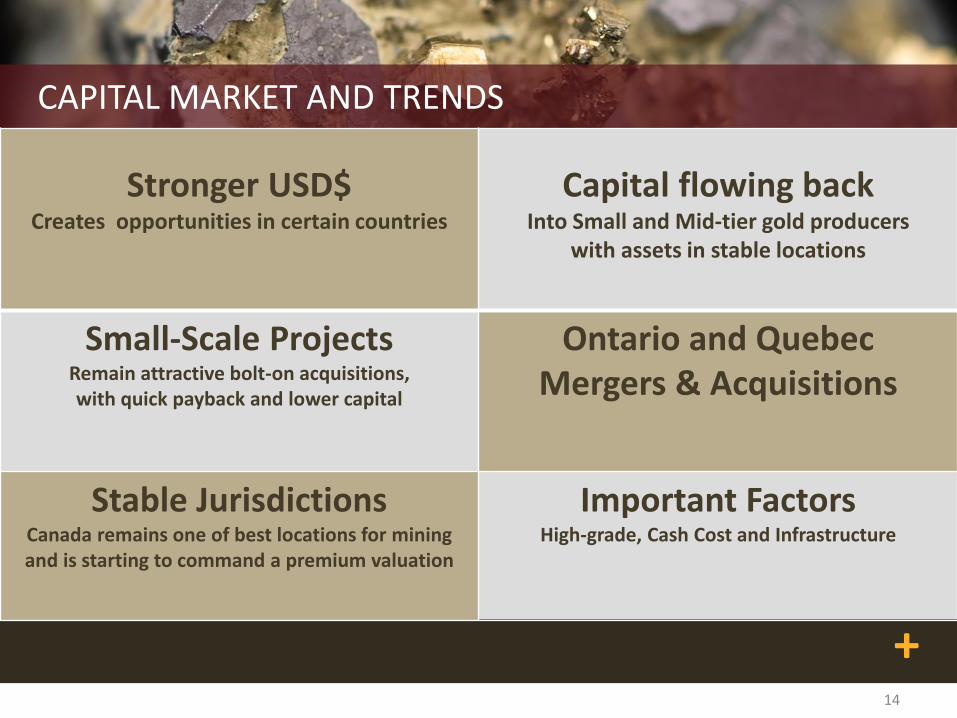
CAPITAL MARKET AND TRENDS
14
Stronger USD$ Creates opportunities in certain countries
Capital flowing back Into Small and Mid-tier gold producers
with assets in stable locations
Small-Scale Projects Remain attractive bolt-on acquisitions, with quick payback and lower capital
Ontario and Quebec Mergers & Acquisitions
Stable Jurisdictions Canada remains one of best locations for mining and is starting to command a premium valuation
Important Factors High-grade, Cash Cost and Infrastructure
+
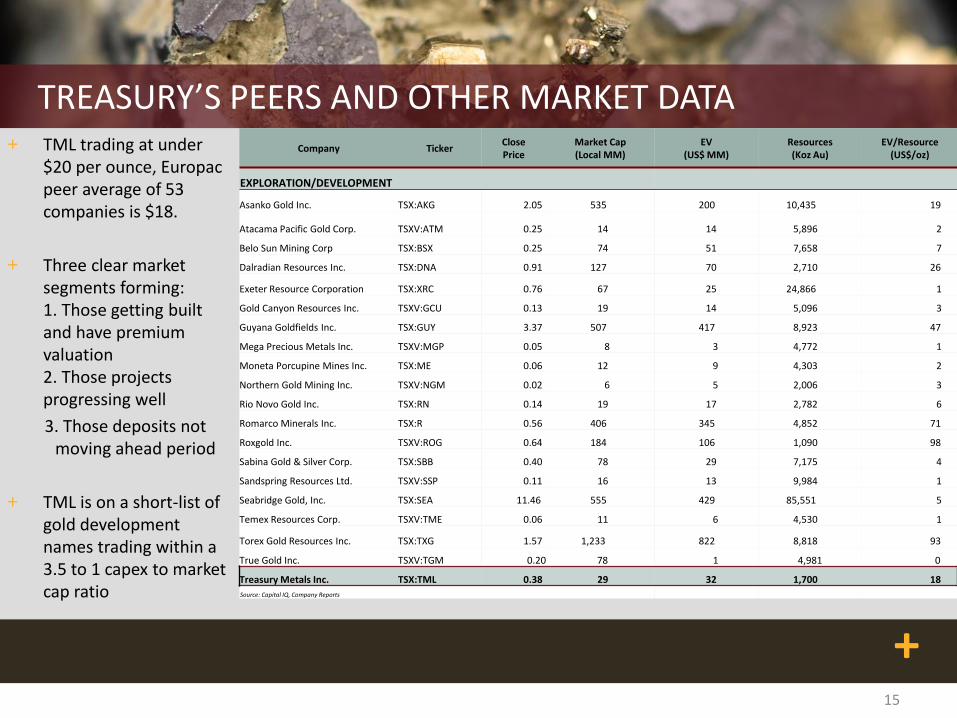
TREASURY’S PEERS AND OTHER MARKET DATA + TML trading at under
$20 per ounce, Europac peer average of 53 companies is $18.
+ Three clear market segments forming: 1. Those getting built and have premium valuation 2. Those projects progressing well
3. Those deposits not moving ahead period
+ TML is on a short-list of gold development names trading within a 3.5 to 1 capex to market cap ratio
15
Company Ticker Close Price
Market Cap (Local MM)
EV (US$ MM)
Resources (Koz Au)
EV/Resource (US$/oz)
EXPLORATION/DEVELOPMENT
Asanko Gold Inc. TSX:AKG 2.05 535 200 10,435 19
Atacama Pacific Gold Corp. TSXV:ATM 0.25 14 14 5,896 2
Belo Sun Mining Corp TSX:BSX 0.25 74 51 7,658 7
Dalradian Resources Inc. TSX:DNA 0.91 127 70 2,710 26
Exeter Resource Corporation TSX:XRC 0.76 67 25 24,866 1
Gold Canyon Resources Inc. TSXV:GCU 0.13 19 14 5,096 3
Guyana Goldfields Inc. TSX:GUY 3.37 507 417 8,923 47
Mega Precious Metals Inc. TSXV:MGP 0.05 8 3 4,772 1
Moneta Porcupine Mines Inc. TSX:ME 0.06 12 9 4,303 2
Northern Gold Mining Inc. TSXV:NGM 0.02 6 5 2,006 3
Rio Novo Gold Inc. TSX:RN 0.14 19 17 2,782 6
Romarco Minerals Inc. TSX:R 0.56 406 345 4,852 71
Roxgold Inc. TSXV:ROG 0.64 184 106 1,090 98
Sabina Gold & Silver Corp. TSX:SBB 0.40 78 29 7,175 4
Sandspring Resources Ltd. TSXV:SSP 0.11 16 13 9,984 1
Seabridge Gold, Inc. TSX:SEA 11.46 555 429 85,551 5
Temex Resources Corp. TSXV:TME 0.06 11 6 4,530 1
Torex Gold Resources Inc. TSX:TXG 1.57 1,233 822 8,818 93
True Gold Inc. TSXV:TGM 0.20 78 1 4,981 0
Treasury Metals Inc. TSX:TML 0.38 29 32 1,700 18
Source: Capital IQ, Company Reports
+
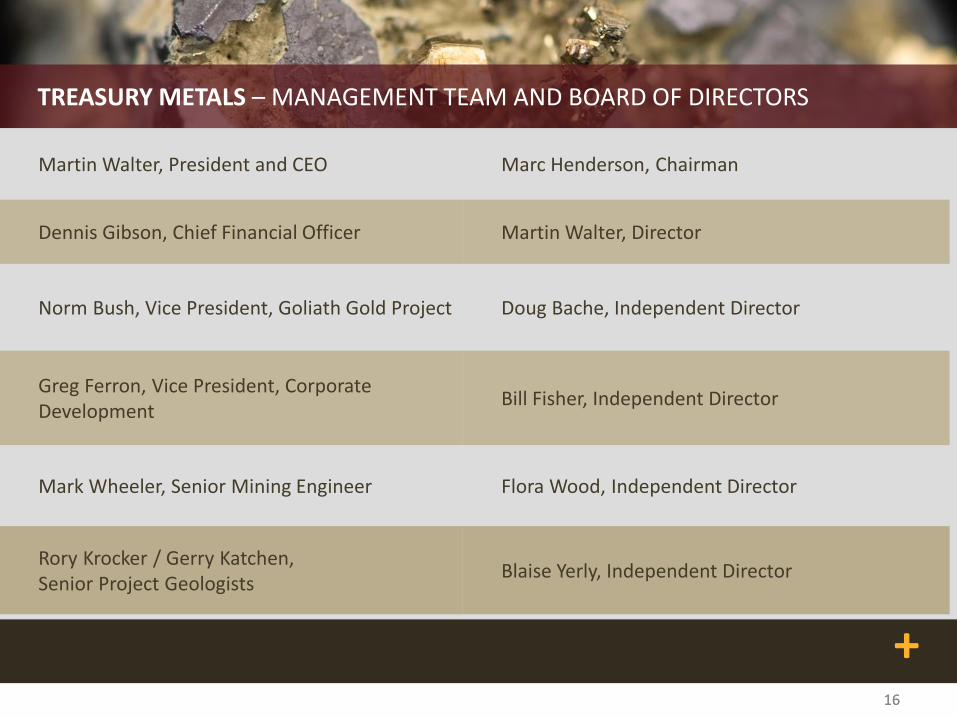
TREASURY METALS – MANAGEMENT TEAM AND BOARD OF DIRECTORS
Martin Walter, President and CEO Marc Henderson, Chairman
Dennis Gibson, Chief Financial Officer Martin Walter, Director
Norm Bush, Vice President, Goliath Gold Project Doug Bache, Independent Director
Greg Ferron, Vice President, Corporate Development
Bill Fisher, Independent Director
Mark Wheeler, Senior Mining Engineer Flora Wood, Independent Director
Rory Krocker / Gerry Katchen, Senior Project Geologists
Blaise Yerly, Independent Director
16 16
+ 17
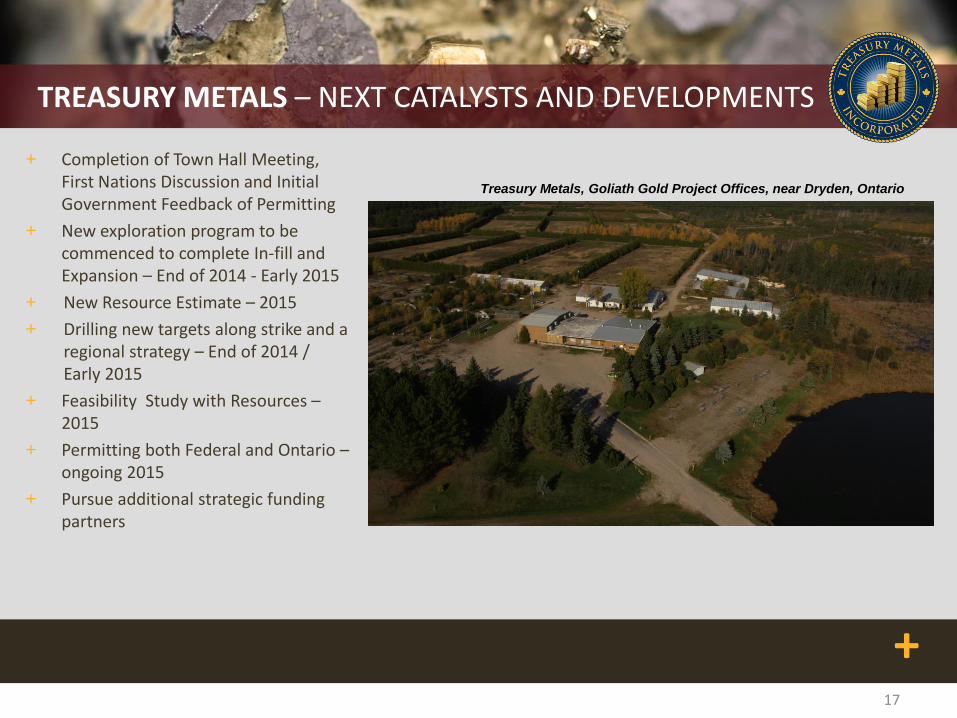
TREASURY METALS – NEXT CATALYSTS AND DEVELOPMENTS
+ Completion of Town Hall Meeting, First Nations Discussion and Initial Government Feedback of Permitting
+ New exploration program to be commenced to complete In-fill and Expansion – End of 2014 - Early 2015
+ New Resource Estimate – 2015
+ Drilling new targets along strike and a regional strategy – End of 2014 / Early 2015
+ Feasibility Study with Resources – 2015
+ Permitting both Federal and Ontario – ongoing 2015
+ Pursue additional strategic funding partners
17
Treasury Metals, Goliath Gold Project Offices, near Dryden, Ontario
+ 18
CONTACT INFO
Martin Walter
President and CEO
416.214.4654 [email protected]
Toronto Office: 416.214.4654 or 1.855.664.4654 (toll-free)
Dryden Office: 807.938.6961
www.treasurymetals.com
Greg Ferron
VP, Corp. Development
416.214.4654 [email protected]
18
+
TECHNICAL DATA APPENDIX
19
+
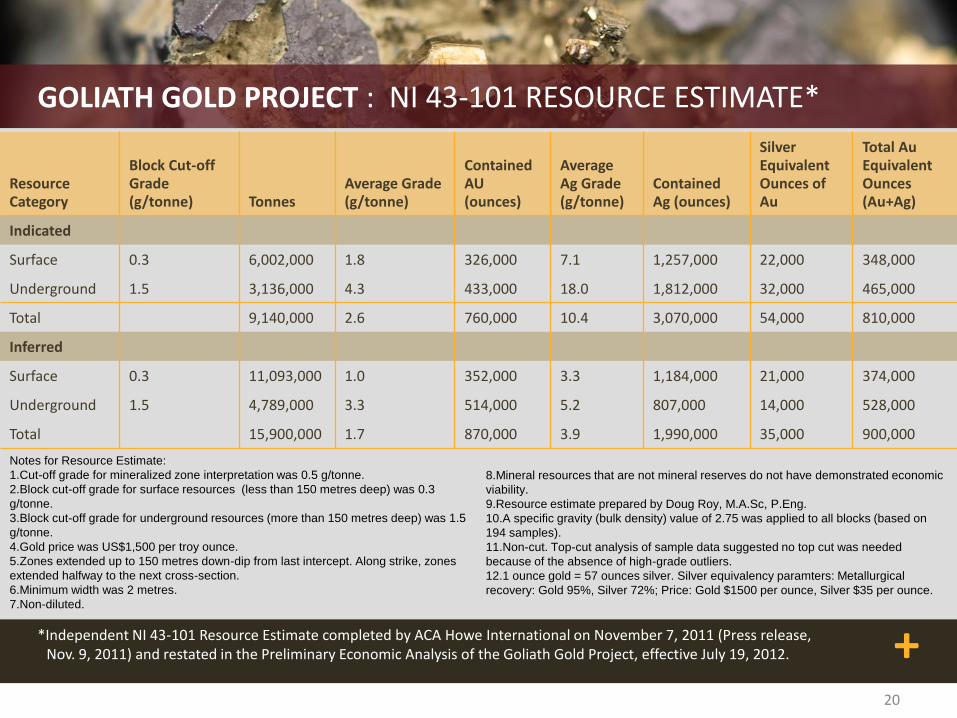
GOLIATH GOLD PROJECT : NI 43-101 RESOURCE ESTIMATE*
Resource Category
Block Cut-off Grade (g/tonne) Tonnes
Average Grade (g/tonne)
Contained AU (ounces)
Average Ag Grade (g/tonne)
Contained Ag (ounces)
Silver Equivalent Ounces of Au
Total Au Equivalent Ounces (Au+Ag)
Indicated
Surface 0.3 6,002,000 1.8 326,000 7.1 1,257,000 22,000 348,000
Underground 1.5 3,136,000 4.3 433,000 18.0 1,812,000 32,000 465,000
Total 9,140,000 2.6 760,000 10.4 3,070,000 54,000 810,000
Inferred
Surface 0.3 11,093,000 1.0 352,000 3.3 1,184,000 21,000 374,000
Underground 1.5 4,789,000 3.3 514,000 5.2 807,000 14,000 528,000
Total 15,900,000 1.7 870,000 3.9 1,990,000 35,000 900,000
*Independent NI 43-101 Resource Estimate completed by ACA Howe International on November 7, 2011 (Press release, Nov. 9, 2011) and restated in the Preliminary Economic Analysis of the Goliath Gold Project, effective July 19, 2012.
20
Notes for Resource Estimate:
1.Cut-off grade for mineralized zone interpretation was 0.5 g/tonne.
2.Block cut-off grade for surface resources (less than 150 metres deep) was 0.3
g/tonne.
3.Block cut-off grade for underground resources (more than 150 metres deep) was 1.5
g/tonne.
4.Gold price was US$1,500 per troy ounce.
5.Zones extended up to 150 metres down-dip from last intercept. Along strike, zones
extended halfway to the next cross-section.
6.Minimum width was 2 metres.
7.Non-diluted.
8.Mineral resources that are not mineral reserves do not have demonstrated economic
viability.
9.Resource estimate prepared by Doug Roy, M.A.Sc, P.Eng.
10.A specific gravity (bulk density) value of 2.75 was applied to all blocks (based on
194 samples).
11.Non-cut. Top-cut analysis of sample data suggested no top cut was needed
because of the absence of high-grade outliers.
12.1 ounce gold = 57 ounces silver. Silver equivalency paramters: Metallurgical
recovery: Gold 95%, Silver 72%; Price: Gold $1500 per ounce, Silver $35 per ounce.
+
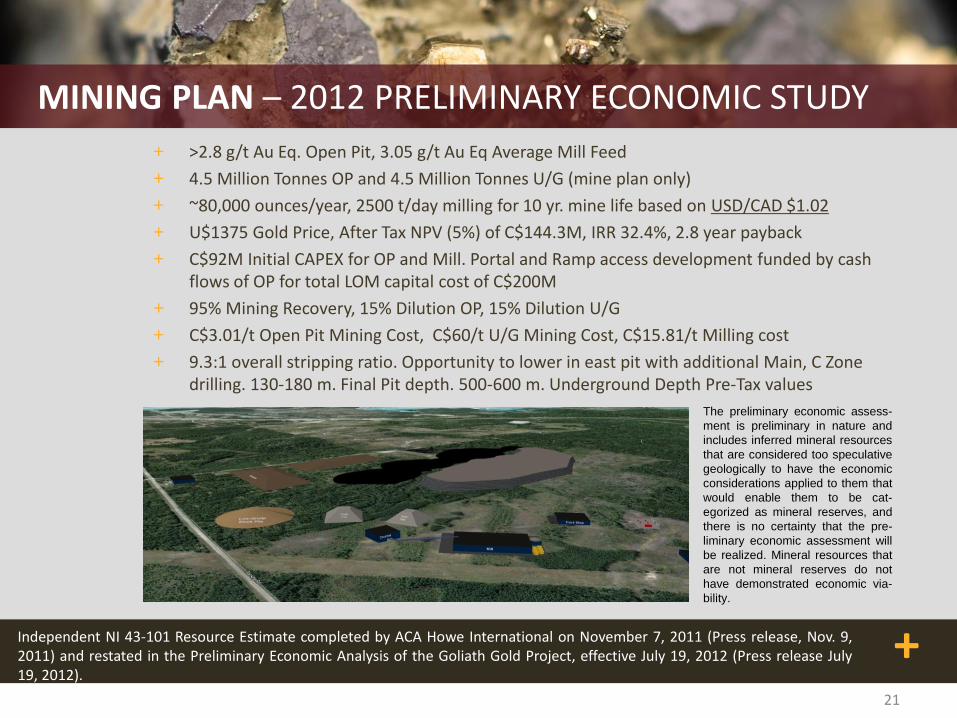
MINING PLAN – 2012 PRELIMINARY ECONOMIC STUDY
+ >2.8 g/t Au Eq. Open Pit, 3.05 g/t Au Eq Average Mill Feed
+ 4.5 Million Tonnes OP and 4.5 Million Tonnes U/G (mine plan only)
+ ~80,000 ounces/year, 2500 t/day milling for 10 yr. mine life based on USD/CAD $1.02
+ U$1375 Gold Price, After Tax NPV (5%) of C$144.3M, IRR 32.4%, 2.8 year payback
+ C$92M Initial CAPEX for OP and Mill. Portal and Ramp access development funded by cash flows of OP for total LOM capital cost of C$200M
+ 95% Mining Recovery, 15% Dilution OP, 15% Dilution U/G
+ C$3.01/t Open Pit Mining Cost, C$60/t U/G Mining Cost, C$15.81/t Milling cost
+ 9.3:1 overall stripping ratio. Opportunity to lower in east pit with additional Main, C Zone drilling. 130-180 m. Final Pit depth. 500-600 m. Underground Depth Pre-Tax values
21
The preliminary economic assess-
ment is preliminary in nature and
includes inferred mineral resources
that are considered too speculative
geologically to have the economic
considerations applied to them that
would enable them to be cat-
egorized as mineral reserves, and
there is no certainty that the pre-
liminary economic assessment will
be realized. Mineral resources that
are not mineral reserves do not
have demonstrated economic via-
bility.
Independent NI 43-101 Resource Estimate completed by ACA Howe International on November 7, 2011 (Press release, Nov. 9, 2011) and restated in the Preliminary Economic Analysis of the Goliath Gold Project, effective July 19, 2012 (Press release July 19, 2012).
+
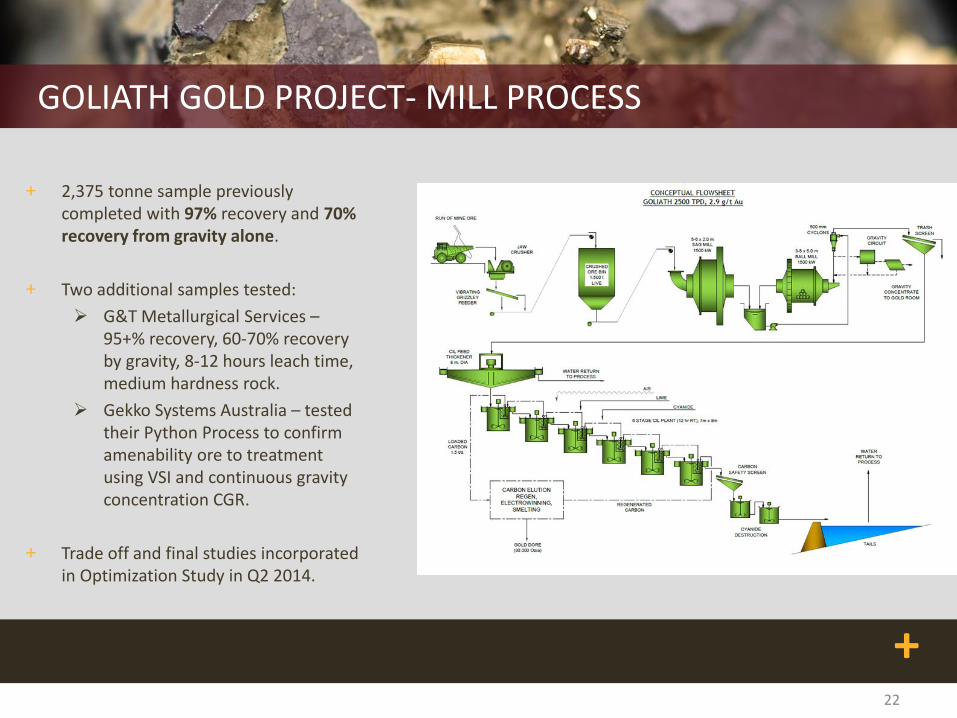
GOLIATH GOLD PROJECT- MILL PROCESS
+ 2,375 tonne sample previously completed with 97% recovery and 70% recovery from gravity alone.
+ Two additional samples tested:
G&T Metallurgical Services – 95+% recovery, 60-70% recovery by gravity, 8-12 hours leach time, medium hardness rock.
Gekko Systems Australia – tested their Python Process to confirm amenability ore to treatment using VSI and continuous gravity concentration CGR.
+ Trade off and final studies incorporated in Optimization Study in Q2 2014.
22


