Introduction CT is routinely used in a diagnostic radiology department to help radiologists with a variety of disease conditions. Conventional CT uses Hounsfield units (HU) as a mechanism to differentiate between different tissues within the body. As a result, many different tissues with different chemical composition (or effective atomic number) and different densities may have overlapping HU values at a given peak tube voltage (kVp), making it difficult to differentiate between tissues. The two main mechanisms contributing to CT attenuation coefficients of materials are the photoelectric effect and Compton scattering. These effects are both energy- and material- dependent. The photoelectric effect predominates at lower photon energies and is heavily energy- dependent, while Compton scattering has a much weaker energy dependency than the photoelectric effect and dominates at high photon energies. The relative strength of photoelectric and Compton components also depend on atomic numbers. The photoelectric effect dominates the overall attenuation of high atomic number atoms such as iodine, while Compton dominates the attenuation of low atomic number atoms such as water (hydrogen and oxygen). Spectral CT measures the difference in attenuation of X-rays at two energy levels, high and low. Data collected simultaneously from these two energy levels can be used to determine the Compton scatter and photoelectric components of X-ray attenuation. These components, taken together, provide additional information about tissue density and atomic number that can be used to separate tissues with similar attenuation in a conventional image. Computed Tomography White paper Advantages of a spectral detector-based CT system 1
Transcript
Introduction
CT is routinely used in a diagnostic radiology
department to help radiologists with a variety
of disease conditions. Conventional CT uses
Hounsfield units (HU) as a mechanism to
differentiate between different tissues within
the body. As a result, many different tissues
with different chemical composition (or effective
atomic number) and different densities may have
overlapping HU values at a given peak tube voltage
(kVp), making it difficult to differentiate between
tissues. The two main mechanisms contributing
to CT attenuation coefficients of materials are the
photoelectric effect and Compton scattering.
These effects are both energy- and material-
dependent. The photoelectric effect predominates
at lower photon energies and is heavily energy-
dependent, while Compton scattering has a much
weaker energy dependency than the photoelectric
effect and dominates at high photon energies.
The relative strength of photoelectric and Compton
components also depend on atomic numbers.
The photoelectric effect dominates the overall
attenuation of high atomic number atoms such as
iodine, while Compton dominates the attenuation
of low atomic number atoms such as water
(hydrogen and oxygen). Spectral CT measures the
difference in attenuation of X-rays at two energy
levels, high and low. Data collected simultaneously
from these two energy levels can be used to
determine the Compton scatter and photoelectric
components of X-ray attenuation. These
components, taken together, provide additional
information about tissue density and atomic
number that can be used to separate tissues with
similar attenuation in a conventional image.
ComputedTomography
White paper
Advantages of a spectral detector-based CT system
1
Approaches to spectral image generationThe two primary modes of generating spectral
images are source-based and detector-based.
Source-based imaging
Source-based approaches use two different X-ray
spectra (high and low energy), from two sources,
or from a single source in a modulated fashion, to
generate the two energy levels needed to create a
spectral scan. Source-based methods include dual-
source, kV-switching, twin beam and dual-spin.
• Dual-source CT uses two separate tubes
integrated in the same scanner and operated at
two different tube voltages.
• Fast kV-switching involves switching single tube
potential to acquire interleaved data at two
different tube voltages.
• Slow kV-switching involves switching the tube
potential to acquire data at two different tube
voltages with different kV settings per rotation.
• Twin beam shares the X-ray beam in the scanner
with two different filters to generate two different
spectra.
• Dual-spiral or dual-spin CT acquires two
successive spiral or axial scans at different kVp
and mA levels from a single source.
All source-based techniques require the clinician
to preselect patients for dual-energy scanning.
Because the acquisition of spectral data is
dependent on the X-ray tube, certain trade-offs
have to be made with respect to special modes,
image quality and dose penalties. Some examples
are slower rotation speed and reduced spatial
resolution in fast kV-switching mode; longer
scan time (low pitch) in slow kV- switching, in
twin beam modes and in dual-source scanners
(fast, high pitch scan); and giving up temporal
resolution (1/4 rotation acquisition with two
tube-detector systems) and field of view in dual-
source scanners.
Detector-based spectral imaging
Unlike source-based spectral options, detector-
based approaches simultaneously absorb and
differentiate high and low energy, available in a
single polyenergetic X-ray beam, at the detector
level. Spectral results are acquired within a single
scan without the need for special modes.
There are several advantages to detector-based
spectral imaging.
• The clinician can adhere to the familiar
conventional workflow, while retaining the same
dose setting and usage of dose management
tools, as well as the same rotation speed and
pitch setting.
• The patient is scanned as usual and a true
conventional image is generated, which is
identical to conventional CT scanners.
• Full spectral information can be generated in
addition to the true conventional images. The
clinician only needs to select the generation
of spectral information in addition to the
conventional data. A retrospective reconstruction
of the spectral information is also possible in
case spectral data were not requested in the
original reconstruction. Spectral is always on and
always available.
2 3
Comparison of source-based and detector-based spectral imaging
Features in spectral mode
Dual-source (DSCT)
Fast kV-switching (KVSCT)
Slow kV-switching
Twin-beam Dual-spiral or dual-spin
Detector-based spectral (DBSCT)
How it works Special spectral mode must be preselected:
2 tubes
70-100/140-150 kVp
Special spectral mode must be preselected:
fast kV-switching
80/140 kV from one projection to the next
Special spectral mode must be preselected:
slow kV-switching
80/140 kVp from one rotation to the next
Special spectral mode must be preselected:
X-ray beam split in 2 along Z axis with 2 different filtrations for low and high energy
Special spectral mode must be preselected:
1st spin at 80 kVp
2nd spin at 140 kVp
No special spectral mode required:
spectral is always on
Scan at 120 kVp or 140 kVp
dose-neutral
Spectral mode Prospective Prospective Prospective Prospective Prospective Prospective and retrospective
Image space Image space Image space Projection space
120 kVp conventional image
No No No No No Yes
Dose modulation available
Yes No Yes Yes Yes Yes; tube mA modulation
FOV Limited Full Full Full Full Full
Temporal resolution (for cardiac scanning)
Reduced to same as single-source scanner with same rotation speed as in spectral mode; information for the 2 detectors cannot be combined to build a single image with 2 times better temporal resolution
Reduced as fastest rotation speed not available with spectral mode
Not available for cardiac scanning
Not available for cardiac scanning
Not available for cardiac scanning
Full; no limitations
4
Table 1. A comparison of detector-based and source-based spectral approaches.
Advantages of a detector-based systemRadiation dose
The detector-based approach of the Philips IQon
Spectral CT system allows the user full access
to all dose management tools available in the
conventional scanning mode, at all times. Even
when collecting spectral information, the IQon
Spectral CT adheres to the Philips DoseWise
approach, which is a set of techniques, programs
and practices based on the ALARA (as Low As
Reasonably Achievable) principle to support
outstanding image quality at low dose. During
scanning, tube current modulation is used to change
the X-ray dose during the rotation and along the
scanned body, based on body regions. Image
quality for each diagnostic task is specified by the
DoseRight Index (DRI) for various scanning regions,
to allow for appropriate dose to maintain consistent
image quality within a single acquisition and
between patients.
• Personalized doses for individual patients
are suggested by the DoseRight automatic
current selection.
• Longitudinal dose modulation is achieved
using the DoseRight Z-DOM, which adjusts the
tube current-time product (mAs) in the z-axis
according to a patient’s size and shape.
• DoseRight 3D-DOM (three-dimensional dose
modulation) combines angular and longitudinal
patient information to modulate dose in
three dimensions (x-y-z-axis). It incorporates
modulation of tube current-time product (mAs)
according to changes in individual patient’s size
and shape in the transverse (x-y-axis; angular)
direction during helical scans, in addition
to changes in the craniocaudal or caudocranial
(z-axis; longitudinal) direction, as the
tube rotates.
• Liver DRI is organ-based dose modulation that
allows setting a different target image quality
on the liver area than on the rest of the scan.
During the acquisition, mAs value is modulated
to account for the variations in patient body
attenuation as with standard AEC but with
different target image quality in the liver area than
in the rest of the scan, such as chest or pelvis. The
liver is automatically detected on the surview
and better image quality is required for the
assessment of the liver due to its lower contrast.
• Brain DRI is the same as liver DRI, but for head
indication. Note that to benefit from the spectral
result added value, you need to set your protocols
to 120 kVp and reduced mAs for the same CTDI if
the initial protocol was with lower kVp. This can
be done for most protocols to the limit of 0.9 mGy,
corresponding to the lowest value available with
120 kVp. Lower CTDI protocols can still be used as
on conventional scans but will not benefit from
spectral information.
• Conventional images can use the full range
of reconstruction options such as iDose4 and
iterative reconstruction IMR, as in conventional
(single-energy) CT scanners. IMR can also be
used for reduced patient dose while keeping the
desired image quality.*
• Similarly, the spectral results can use noise
suppression strength, named “Spectral-level.”
The resulting noise suppression of a specific
spectral level is rather similar to the impact of
iDose4 at same level.
Spectral is always onIQon Spectral CT is a detection-based spectral CT;
therefore, spectral information is available for each
and every scan (at 120 or 140 kVp). There are three
methods to generate the spectral data.
1. Generate DICOMs of the spectral results
that are planned to be used, for example
monoenergetic (MonoE) results as a part of
exam card on the scanner. These results will be
sent to PACS, similarly to conventional images
and can be used by any PACS and any viewer.
Exam cards can include the type of spectral
results to be generated.
2. Save SBI (spectral base images) along with
the conventional images. This generates a
compressed DICOM series from which all spectral
results can be generated. SBI can be read by the
IntelliSpace Portal thin client application and by
the Spectral Magic Glass on PACS (sMGoP).
A checkbox in the recon menu (and in the exam
card setting) activates SBI saving.
3. Retrospective spectral reconstruction in case
no spectral information was generated during
the original reconstruction but needed later on,
and can be used as long as the raw data of the
case is available.
The recommended mode is a combination of (1)
and (2) for the relevant reconstructions. Send the
spectral results that are in routine use (per scan
type, etc.) as regular DICOM series, and generate
SBI to enable other spectral results that may be
retrospectively required.
5
*In clinical practice, the use of IMR may reduce CT patient dose depending on the clinical task, patient size, anatomical location, and clinical practice. A
consultation with a radiologist and a physicist should be made to determine the appropriate dose to obtain diagnostic image quality for the particular clinical
task. Lower image noise, improved spatial resolution, improved low-contrast detectability, and/or dose reduction, were tested using reference body protocols.
All metrics were tested on phantoms. Dose reduction assessments were performed using 0.8 mm slices, and tested on the MITA CT IQ Phantom (CCT183, The
Phantom Laboratory), using human observers. Data on file.
Comparison of source-based and detector-based spectral imaging
Features in spectral mode
Dual-source (DSCT)
Fast kV-switching (KVSCT)
Slow kV-switching
Twin-beam Dual-spiral or dual-spin
Detector-based spectral (DBSCT)
Scan time Increased to same as single-source – ultra high pitch scanning combining the 2 helix from the 2 detectors not possible in spectral mode as with different tube voltage – or even more to get enough image quality on low energy acquisition
Increased as fastest rotation speed not available with spectral mode
At least 2 times more than conventional
At least 2 times more than conventional
At least 2 times more than conventional
Same as conventional
Obese patient Limited due to low quality for kVp acquisition and reduced energy separation if using higher kVp for low energy (100/150Sn)
Very limited due to low quality for 80 kVp acquisition
Very limited due to low quality for 80 kVp acquisition
Very limited due to low loss power in tube filtrations
Very limited due to low quality for 80 kVp acquisition
No limitations
Spectral image qualityEnergy separation and spectral separation
Spectral performance of the scanners determines
the quality of spectral results. The energy
separation between the high- and the low-energy
spectrums as well as the noise level within the
detected signal from each spectrum determine the
spectral performance.
The energy separation is the difference in effective
energies between the two measured attenuations
that will allow spectral analysis. In principle, the
lower energy spectrum measures the low-energy
attenuation, dominated by the photoelectric
effect, and the higher energy spectrum measures
the high-energy attenuation, dominated by the
Compton scattering effect. The choice of the
low- and high-energy spectrums is limited by the
available spectra from the X-ray tube. For example,
the 80 kVp spectrum overlaps the 140 kVp
spectrum. The difference in average or effective
energies depends on the tube filtration as well as
on patient size. A dual-source scanner allows using
70 kVp for the low-energy spectrum and up to 150
kVp with specific filtration to increase the average
energy of the high-energy spectrum. The problem
of 70 kVp is that for average and large patients,
most of the X-rays are absorbed by the patient,
irradiating him or her and resulting in poor signal
on the detector. Higher energy spectrums from 80,
90 or even 100 kVp are then needed, reducing the
energy separation.
However, energy separation is not the only
parameter that drives the quality of the spectral
results. Signal-to-noise ratio (SNR) determines
the ability to use the dual-energy data and derive
quality spectral results. In the case of dual-energy
spectral analysis, the signal is the difference in
attenuation between the low- and high-energy
spectrums. The noise is the square root of the sum
of the variances. Therefore, the signal with the
higher noise dominates the SNR. Using low kVp for
the low-energy spectrum usually leads to high noise,
impacting the overall SNR. Another noise source,
only relevant for the dual-source DECT, is cross-
scatter. The dominant effect is radiation from tube-1
that is scattered from the surface of the scanned
body and captured by the detection system of
tube-2 (and vice versa). The detection system
captures both the desired attenuated radiation from
its dedicated X-ray source (primary signal), and the
un-attenuated scattered radiation from the other
X-ray source. Proper algorithms can estimate and
subtract the scattered radiation from the primary
signal, however, the noise of the scattered radiation
is added to the noise of the primary signal.
In dual-layer detector-based spectral CT, the low-
and high-energy spectrums have more overlap
compared with source-based DECT. Therefore, the
energy separation is lower than the separation
of dual-source CT. However, the noise of the low-
and high-energy spectrums is comparable, and
there is no cross-scatter noise. In addition, the
low- and high-energy data are simultaneously
acquired (perfectly aligned in space and time)
enabling projection domain spectral analysis
which has inherent advantages over image domain
analysis (Figure 1). A publication from Maaß et
al. demonstrates that material decomposition
is inherently better in projection domain as
compared to image domain.1
IQon Spectral CT spectral decomposition
and reconstruction include noise suppression
methods based on proper noise modeling and
specific iterative techniques resulting with high
SNR. This results in high-quality spectral results
as demonstrated by the comparison studies
published by Sellerer et al.2, or Hua et al.3 in
comparison to Almeida et al.4
Spatial and temporal coherence and projection
based versus image based spectral results
Detector-based spectral imaging has the advantage
of simultaneously acquired (spatially and temporally)
measurements of high- and low-energy projection
data sets, across the two detector layers. This
enables spectral decomposition at the projection
domain, which has an inherent advantage over
image-domain decomposition. The noise of the
coherent spectral data is almost purely quantum
(Poisson) noise. The noise characteristics, including
spectral anti-correlative noise, are fed into model
6 7
based iterative methods, which effectively suppress
image noise of all spectral results. One of the unique
advantages of this approach is low image noise at
low keV monoenergetic images and hence CNR
keeps improving as MonoE energy is reduced.
Low noise virtual monoenergetic image (VMI) for
improved CNR
The advantage of spectral detector CT in terms of
low image noise over the whole range of VMI was
further demonstrated in an independent study,
conducted by Sellerer et al.2 comparing the different
spectral image generation approaches.
In this study, a semi-anthropomorphic abdomen
phantom was imaged using a spectral detector CT
(IQon), a dual-source dual-energy system (DSCT), and
a fast kVp-switching dual-energy system (KVSCT).
Scans were acquired for three patient sizes at CTDIvol
levels of 10 mGy, 20 mGy and 30 mGy. Noise and
quantitative accuracy of HU and iodine concentration
were evaluated for a range of monoenergetic images.
The results of the study demonstrated important
differences among approaches.
• A steep increase in image noise was observed for
keV levels below 80 keV for fast kVp-switching
and dual-source approaches, while the change in
noise was rather low in the case of detector-based
approach (Figure 2).
• Virtual monoenergetic image quality was comparable
for detector-based and dual-source based
approaches for spectral imaging at mid- to high-
energy levels, and image quality was significantly
reduced for the fast kVp-switching approach.
Why such good results despite limited energy separation? Spectral separation versus energy separation
IdealNo noise
RealNoise spreading the effective measurements
RealNoise spreading the effective measurementswith noise reduction thanks to projection domain spectral analysis
Energy separation
Spectral separation
Material A
Material B
Figure 1. Spectral separation and noise.
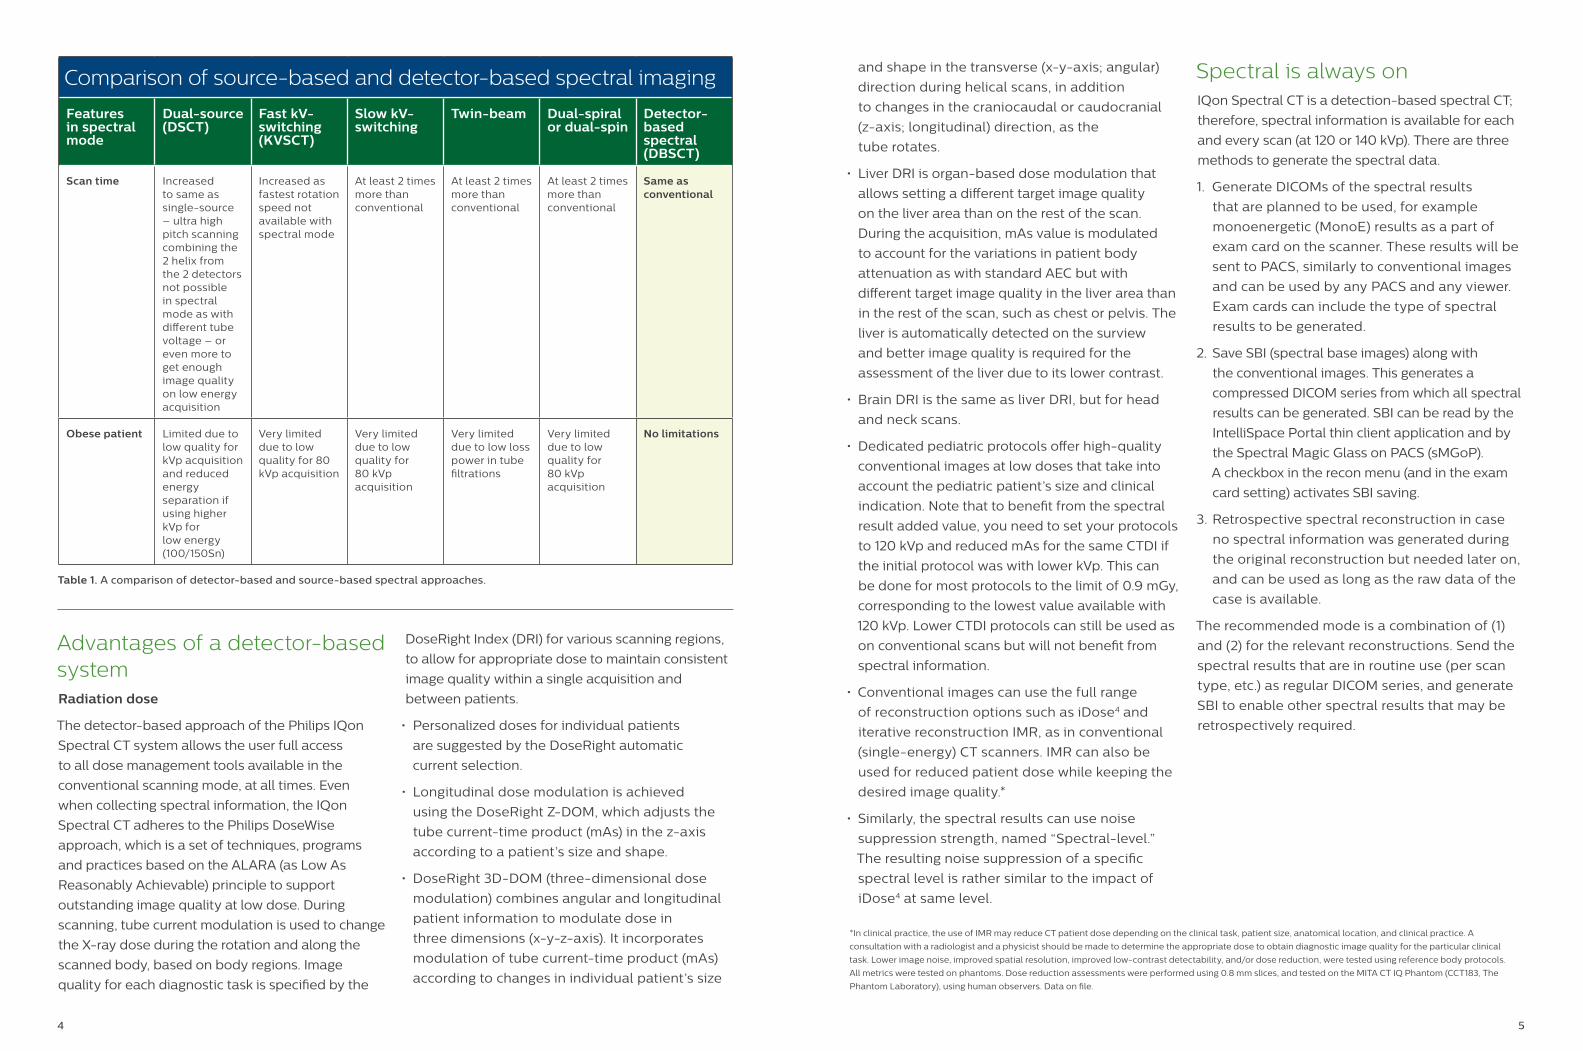
Mean value percentage of noise increase
8
Improved iodine enhancement at low keV – attenuation (HU)
Att
en
ua
tio
n (
HU
)
Att
en
ua
tio
n (
HU
)
Att
en
ua
tio
n (
HU
)
Conventional CT Dual energy CT;Monochromatic energy (keV)
0
100
200
300
400
500
600
700
800
900
1000
1100
1200
1300
1400
0
100
200
300
400
500
600
700
800
900
1000
1100
1200
1300
1400
0
100
200
300
400
500
600
700
800
900
1000
1100
1200
1300
1400
80kVp 120kVp 40 50 60 70
40keV
50keV
60keV80kVp
Reference
472.2
311.8(Reference)
629.6
419.1
293.0
987.7
Conventional CT Dual energy CT;Monochromatic energy (keV)
80kVp 120kVp 40 50 60 70
40keV
50keV
60keV80kVp
Reference
530.9
327.1(Reference)
767.7
515.9
359.2
1177.2
Conventional CT Dual energy CT;Monochromatic energy (keV)
70kVp 120kVp 40 50 60 70
40keV
50keV
60keV
70kVp
Reference
724.0
361.0(Reference)
831.2
561.9
395.8
1274.0
Conventional CT Dual energy CT;Monochromatic energy (keV)
80kVp 120kVp 40 50 60 70
40keV
50keV
60keV
70keV
80kVpReference
23.6
28.2(Reference)
62.9
49.8
39.0
80.4
CN
R
CN
R
CN
R
0
10
20
30
40
50
60
70
80
90
0
10
20
30
40
50
60
70
80
90
0
10
20
30
40
50
60
70
80
90
Conventional CT Dual energy CT;Monochromatic energy (keV)
70kVp 120kVp 40 50 60 70
40keV 50keV60keV
70keV70kVp
Reference52.2
46.2(Reference)
55.653.4
50.0
56.7
Conventional CT Dual energy CT;Monochromatic energy (keV)
80kVp 120kVp 40 50 60 70
40keV
50keV 60keV 70keV
80kVp
Reference25.0
20.3(Reference)
14.817.3 18.9
15.6
Att
en
ua
tio
n (
HU
)
Att
en
ua
tio
n (
HU
)
Att
en
ua
tio
n (
HU
)
Conventional CT Dual energy CT;Monochromatic energy (keV)
0
100
200
300
400
500
600
700
800
900
1000
1100
1200
1300
1400
0
100
200
300
400
500
600
700
800
900
1000
1100
1200
1300
1400
0
100
200
300
400
500
600
700
800
900
1000
1100
1200
1300
1400
80kVp 120kVp 40 50 60 70
40keV
50keV
60keV80kVp
Reference
472.2
311.8(Reference)
629.6
419.1
293.0
987.7
Conventional CT Dual energy CT;Monochromatic energy (keV)
80kVp 120kVp 40 50 60 70
40keV
50keV
60keV80kVp
Reference
530.9
327.1(Reference)
767.7
515.9
359.2
1177.2
Conventional CT Dual energy CT;Monochromatic energy (keV)
70kVp 120kVp 40 50 60 70
40keV
50keV
60keV
70kVp
Reference
724.0
361.0(Reference)
831.2
561.9
395.8
1274.0
Conventional CT Dual energy CT;Monochromatic energy (keV)
80kVp 120kVp 40 50 60 70
40keV
50keV
60keV
70keV
80kVpReference
23.6
28.2(Reference)
62.9
49.8
39.0
80.4
CN
R
CN
R
CN
R
0
10
20
30
40
50
60
70
80
90
0
10
20
30
40
50
60
70
80
90
0
10
20
30
40
50
60
70
80
90
Conventional CT Dual energy CT;Monochromatic energy (keV)
70kVp 120kVp 40 50 60 70
40keV 50keV60keV
70keV70kVp
Reference52.2
46.2(Reference)
55.653.4
50.0
56.7
Conventional CT Dual energy CT;Monochromatic energy (keV)
80kVp 120kVp 40 50 60 70
40keV
50keV 60keV 70keV
80kVp
Reference25.0
20.3(Reference)
14.817.3 18.9
15.6
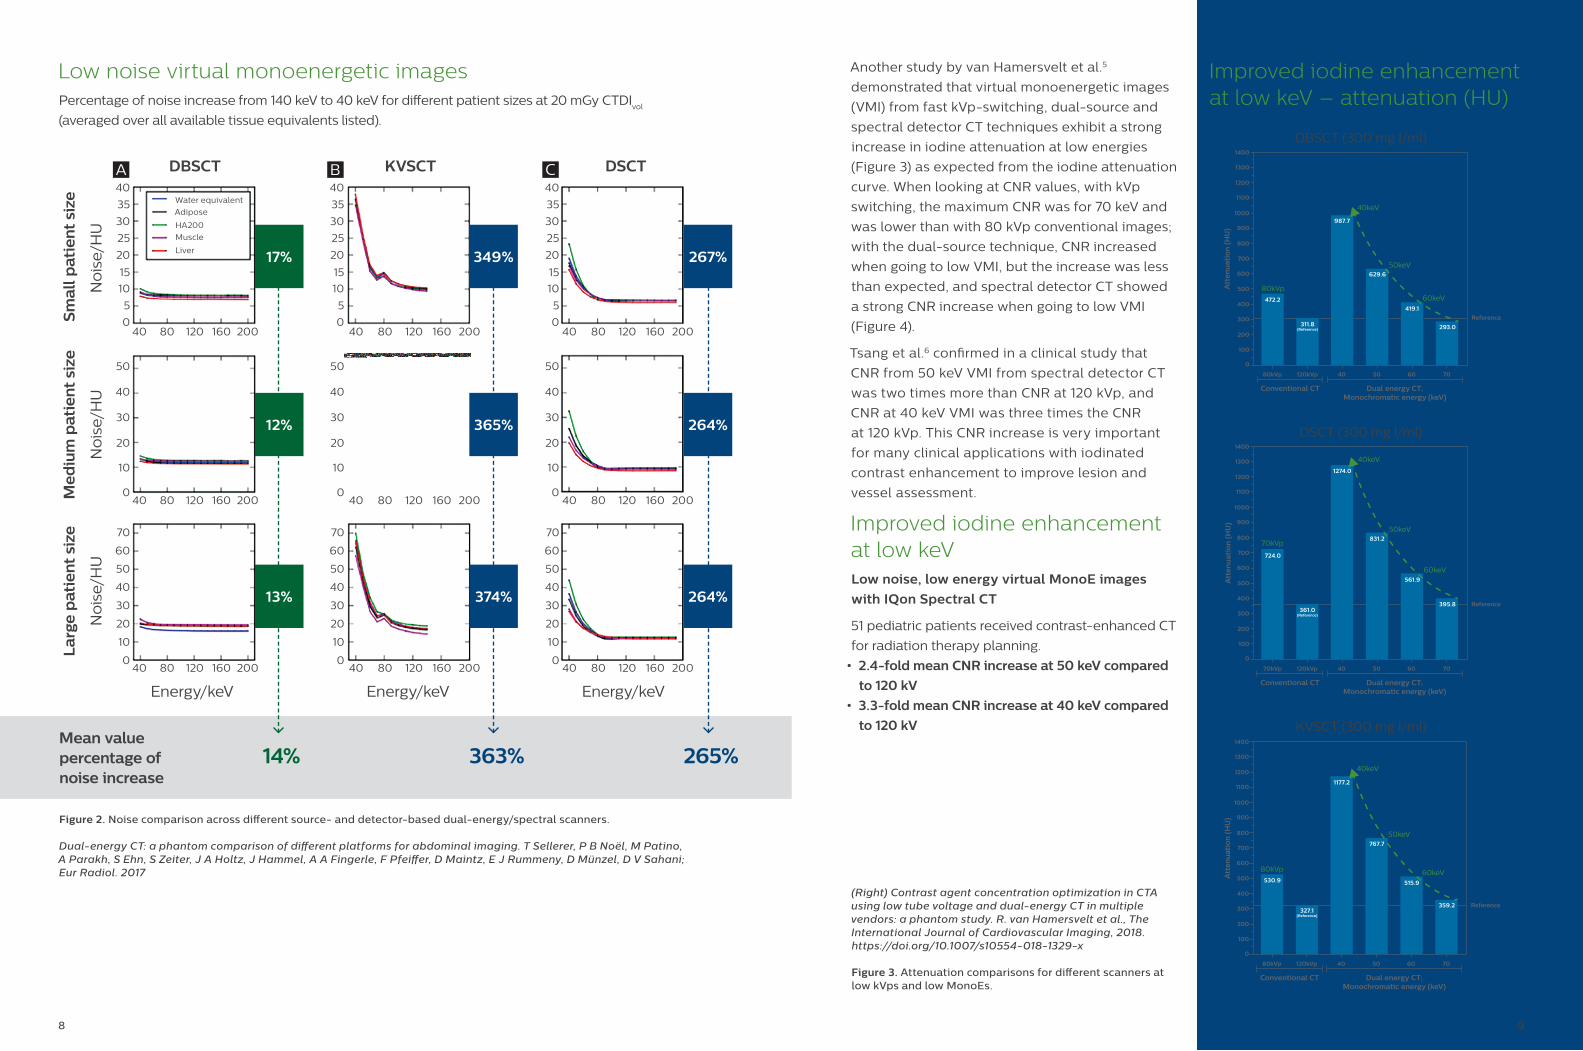
(Right) Contrast agent concentration optimization in CTA using low tube voltage and dual-energy CT in multiple vendors: a phantom study. R. van Hamersvelt et al., The International Journal of Cardiovascular Imaging, 2018. https://doi.org/10.1007/s10554-018-1329-x
Figure 3. Attenuation comparisons for different scanners at low kVps and low MonoEs.
9
Another study by van Hamersvelt et al.5
demonstrated that virtual monoenergetic images
(VMI) from fast kVp-switching, dual-source and
spectral detector CT techniques exhibit a strong
increase in iodine attenuation at low energies
(Figure 3) as expected from the iodine attenuation
curve. When looking at CNR values, with kVp
switching, the maximum CNR was for 70 keV and
was lower than with 80 kVp conventional images;
with the dual-source technique, CNR increased
when going to low VMI, but the increase was less
than expected, and spectral detector CT showed
a strong CNR increase when going to low VMI
(Figure 4).
Tsang et al.6 confirmed in a clinical study that
CNR from 50 keV VMI from spectral detector CT
was two times more than CNR at 120 kVp, and
CNR at 40 keV VMI was three times the CNR
at 120 kVp. This CNR increase is very important
for many clinical applications with iodinated
contrast enhancement to improve lesion and
vessel assessment.
Improved iodine enhancement at low keVLow noise, low energy virtual MonoE images
with IQon Spectral CT
51 pediatric patients received contrast-enhanced CT
for radiation therapy planning.
• 2.4-fold mean CNR increase at 50 keV compared
to 120 kV
• 3.3-fold mean CNR increase at 40 keV compared
to 120 kV
Figure 2. Noise comparison across different source- and detector-based dual-energy/spectral scanners.
Dual-energy CT: a phantom comparison of different platforms for abdominal imaging. T Sellerer, P B Noël, M Patino, A Parakh, S Ehn, S Zeiter, J A Holtz, J Hammel, A A Fingerle, F Pfeiffer, D Maintz, E J Rummeny, D Münzel, D V Sahani; Eur Radiol. 2017
No
ise/
HU
Med
ium
pat
ien
t si
ze
No
ise/
HU
17%
Sm
all p
atie
nt
size
DBSCT KVSCT DSCT
No
ise/
HU
La
rge
pat
ien
t si
ze
Energy/keVEnergy/keVEnergy/keV
Low noise virtual monoenergetic images Percentage of noise increase from 140 keV to 40 keV for different patient sizes at 20 mGy CTDI
vol
(averaged over all available tissue equivalents listed).
349% 267%
12%
13%
14% 363% 265%
365%
374%
264%
264%
10 11
Temporal resolution
The temporal resolution on IQon Spectral CT is
as low as 34 mSec using adaptive multicycle
reconstruction, and since there is not a spectral
mode to acquire spectral data, there is no
compromise in temporal resolution for IQon Spectral
CT. This is not the case for the source-based
dual-energy scanners where temporal resolution
in dual-energy mode is compromised as compared
to conventional scans, which could be due to
slowing down the scanner for kVp switching or not
having high pitch mode or flash mode of scanning
due to two tubes operating at two different kVps.
Scan timeScan times on IQon Spectral CT are the same
whether you are acquiring conventional data
or spectral data. There is no special scan mode
for spectral, and therefore, the scan parameters
(including the scan time) are the same.
As for source-based systems, the scan time is longer
when the system is operating in dual-energy mode
as compared to conventional scans. This change in
scan time can be attributed to several acquisition
parameters that need to be changed when the
system operates in dual-energy mode e.g., rotation
time has to increase, and pitch has to be decreased
in order to obtain dual-energy data.
True conventional imagesBecause IQon Spectral CT is a detection-
based spectral CT system, it generates true,
uncompromised, conventional images that are
essentially identical to single-energy CT. One simply
adds the data from the low- and high-energy layers
into a combined signal similar to a conventional
(single-energy) detector. This is a unique capability
of the dual-layer spectral CT scanner. Moreover,
spectral information is enabled for scans at 120 kVp,
which is the tube voltage that is used in the majority
of the scans. Source-based dual-energy systems
scan at two different kVps (70 kVp to 150 kVp), and
they then create a 120 kVp-like image using image
reconstruction and processing techniques or only
provide the low- and high-energy images.
Moving to true quantitative imagingPublication by Sellerer et al.2 showed that in
abdomen phantom studies, detector-based and
fast kVp-switching approaches deliver comparable
absolute errors of measured iodine concentration.
The mean errors in source-based spectral CT are
notably larger. The root mean standard deviation
(RMSD) of iodine concentrations was lowest
for the detector-based approach in eight of the
nine patient size/dose configurations tested, and
comparable to the kVp-switching approach of
spectral imaging in the ninth configuration. All
three platforms show very good correlation
between measured and true iodine concentration.
However, IQon shows the lowest error range of
0.42 compared to 1.15 for KVSCT and 1.88 for DSCT.
Detector-based spectral CT is superb compared to
the other techniques for large patient size phantom
and low dose (Figure 5.)Figure 5. Root mean square deviation (RMSD) of observed iodine concentrations (with respect to true values) for different measurement configurations and CT systems. Deviations are given in mg/ml.
Moving to true quantitative imagingQuantitative iodine perfusion
Conventional CT Dual energy CT;Monochromatic energy (keV)
0
100
200
300
400
500
600
700
800
900
1000
1100
1200
1300
1400
0
100
200
300
400
500
600
700
800
900
1000
1100
1200
1300
1400
0
100
200
300
400
500
600
700
800
900
1000
1100
1200
1300
1400
80kVp 120kVp 40 50 60 70
40keV
50keV
60keV80kVp
Reference
472.2
311.8(Reference)
629.6
419.1
293.0
987.7
Conventional CT Dual energy CT;Monochromatic energy (keV)
80kVp 120kVp 40 50 60 70
40keV
50keV
60keV80kVp
Reference
530.9
327.1(Reference)
767.7
515.9
359.2
1177.2
Conventional CT Dual energy CT;Monochromatic energy (keV)
70kVp 120kVp 40 50 60 70
40keV
50keV
60keV
70kVp
Reference
724.0
361.0(Reference)
831.2
561.9
395.8
1274.0
Conventional CT Dual energy CT;Monochromatic energy (keV)
80kVp 120kVp 40 50 60 70
40keV
50keV
60keV
70keV
80kVpReference
23.6
28.2(Reference)
62.9
49.8
39.0
80.4
CN
R
CN
R
CN
R
0
10
20
30
40
50
60
70
80
90
0
10
20
30
40
50
60
70
80
90
0
10
20
30
40
50
60
70
80
90
Conventional CT Dual energy CT;Monochromatic energy (keV)
70kVp 120kVp 40 50 60 70
40keV 50keV60keV
70keV70kVp
Reference52.2
46.2(Reference)
55.653.4
50.0
56.7
Conventional CT Dual energy CT;Monochromatic energy (keV)
80kVp 120kVp 40 50 60 70
40keV
50keV 60keV 70keV
80kVp
Reference25.0
20.3(Reference)
14.817.3 18.9
15.6
Att
en
ua
tio
n (
HU
)
Att
en
ua
tio
n (
HU
)
Att
en
ua
tio
n (
HU
)Conventional CT Dual energy CT;
Monochromatic energy (keV)
0
100
200
300
400
500
600
700
800
900
1000
1100
1200
1300
1400
0
100
200
300
400
500
600
700
800
900
1000
1100
1200
1300
1400
0
100
200
300
400
500
600
700
800
900
1000
1100
1200
1300
1400
80kVp 120kVp 40 50 60 70
40keV
50keV
60keV80kVp
Reference
472.2
311.8(Reference)
629.6
419.1
293.0
987.7
Conventional CT Dual energy CT;Monochromatic energy (keV)
80kVp 120kVp 40 50 60 70
40keV
50keV
60keV80kVp
Reference
530.9
327.1(Reference)
767.7
515.9
359.2
1177.2
Conventional CT Dual energy CT;Monochromatic energy (keV)
70kVp 120kVp 40 50 60 70
40keV
50keV
60keV
70kVp
Reference
724.0
361.0(Reference)
831.2
561.9
395.8
1274.0
Conventional CT Dual energy CT;Monochromatic energy (keV)
80kVp 120kVp 40 50 60 70
40keV
50keV
60keV
70keV
80kVpReference
23.6
28.2(Reference)
62.9
49.8
39.0
80.4
CN
R
CN
R
CN
R
0
10
20
30
40
50
60
70
80
90
0
10
20
30
40
50
60
70
80
90
0
10
20
30
40
50
60
70
80
90
Conventional CT Dual energy CT;Monochromatic energy (keV)
70kVp 120kVp 40 50 60 70
40keV 50keV60keV
70keV70kVp
Reference52.2
46.2(Reference)
55.653.4
50.0
56.7
Conventional CT Dual energy CT;Monochromatic energy (keV)
80kVp 120kVp 40 50 60 70
40keV
50keV 60keV 70keV
80kVp
Reference25.0
20.3(Reference)
14.817.3 18.9
15.6
Att
en
ua
tio
n (
HU
)
Att
en
ua
tio
n (
HU
)
Att
en
ua
tio
n (
HU
)
Conventional CT Dual energy CT;Monochromatic energy (keV)
0
100
200
300
400
500
600
700
800
900
1000
1100
1200
1300
1400
0
100
200
300
400
500
600
700
800
900
1000
1100
1200
1300
1400
0
100
200
300
400
500
600
700
800
900
1000
1100
1200
1300
1400
80kVp 120kVp 40 50 60 70
40keV
50keV
60keV80kVp
Reference
472.2
311.8(Reference)
629.6
419.1
293.0
987.7
Conventional CT Dual energy CT;Monochromatic energy (keV)
80kVp 120kVp 40 50 60 70
40keV
50keV
60keV80kVp
Reference
530.9
327.1(Reference)
767.7
515.9
359.2
1177.2
Conventional CT Dual energy CT;Monochromatic energy (keV)
70kVp 120kVp 40 50 60 70
40keV
50keV
60keV
70kVp
Reference
724.0
361.0(Reference)
831.2
561.9
395.8
1274.0
Conventional CT Dual energy CT;Monochromatic energy (keV)
80kVp 120kVp 40 50 60 70
40keV
50keV
60keV
70keV
80kVpReference
23.6
28.2(Reference)
62.9
49.8
39.0
80.4
CN
R
CN
R
CN
R
0
10
20
30
40
50
60
70
80
90
0
10
20
30
40
50
60
70
80
90
0
10
20
30
40
50
60
70
80
90
Conventional CT Dual energy CT;Monochromatic energy (keV)
70kVp 120kVp 40 50 60 70
40keV 50keV60keV
70keV70kVp
Reference52.2
46.2(Reference)
55.653.4
50.0
56.7
Conventional CT Dual energy CT;Monochromatic energy (keV)
80kVp 120kVp 40 50 60 70
40keV
50keV 60keV 70keV
80kVp
Reference25.0
20.3(Reference)
14.817.3 18.9
15.6
Improved iodine enhancement at low keV – CNRIQon low noise MonoE images translate the
benefit at low energy in strong CNR increase.
(Left) Contrast agent concentration optimization in CTA using low tube voltage and dual-energy CT in multiple vendors: a phantom study. R. van Hamersvelt et al., The International Journal of Cardiovascular Imaging, 2018. https://doi.org/10.1007/s10554-018-1329-x
Figure 4. CNR comparisons for different scanners at low kVps and low MonoEs.
12
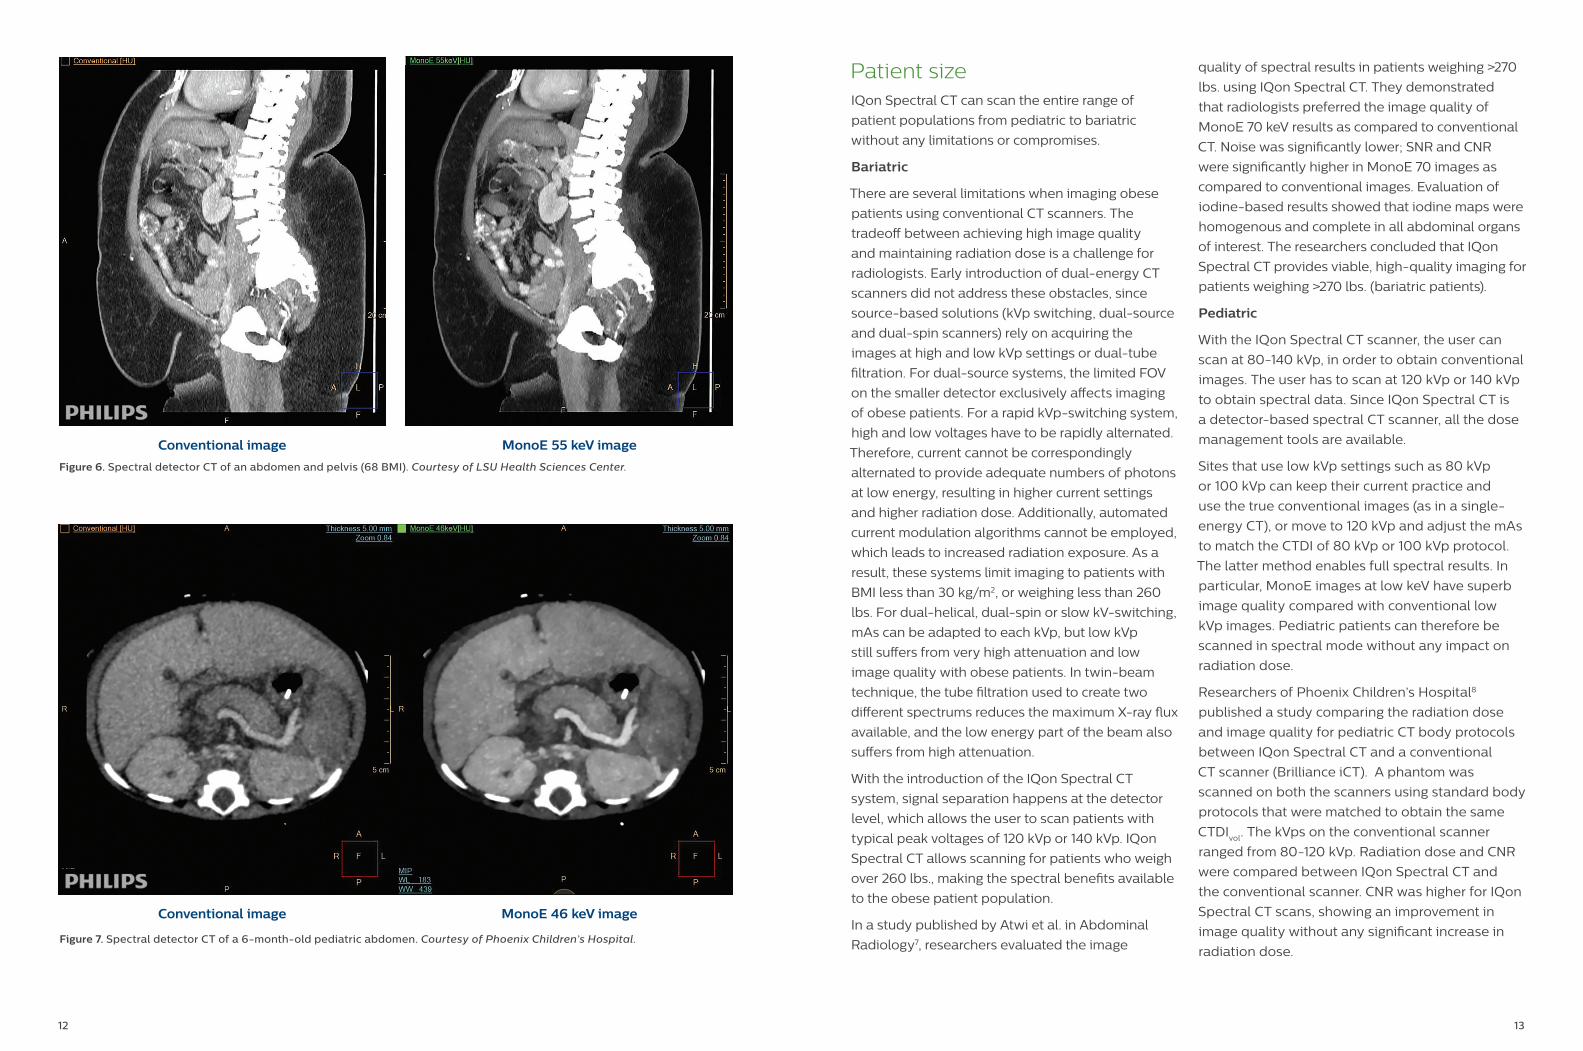
Patient sizeIQon Spectral CT can scan the entire range of
patient populations from pediatric to bariatric
without any limitations or compromises.
Bariatric
There are several limitations when imaging obese
patients using conventional CT scanners. The
tradeoff between achieving high image quality
and maintaining radiation dose is a challenge for
radiologists. Early introduction of dual-energy CT