European Journal of Pharmaceutical Sciences, 7 (1998) 5–16 Advantages of Artificial Neural Networks (ANNs) as alternative modelling technique for data sets showing non-linear relationships using data from a galenical study on a solid dosage form a, b a c * Jacques Bourquin , Heinz Schmidli , Peter van Hoogevest , Hans Leuenberger a Pharmaceutical and Analytical Development, Novartis Pharma AG, K-401.2.67, CH-4002 Basel, Switzerland b Mathematical Applications, Novartis Services AG, Basel, Switzerland c College of Pharmacy, University of Basel, Basel, Switzerland Received 3 February 1997; accepted 11 September 1997 Abstract Artificial Neural Networks (ANN) methodology was used to assess experimental data from a tablet compression study showing highly non-linear relationships (i.e. measurements of ejection forces) and compared to classical modelling technique (i.e. Response Surface Methodology, RSM). These kinds of relationships are known to be difficult to model using classical methods. The aim of this investigation was to quantitatively describe the achieved degree of data fitting and predicting abilities of the developed models. The comparison between the ANN and RSM was carried out both graphically and numerically. For comparing the goodness of fit, all data were used, whereas for the goodness of prediction the data were split into a learning and a validation data set. Better results were achieved for the model using ANN methodology with regard to data fitting and predicting ability. All determined ejection properties were mainly influenced by the concentration of magnesium stearate and silica aerogel, whereas the other factors showed very much lower effects. Important relationships could be recognised from the ANN model only, whereas the RSM model ignored them. The ANN methodology represents a useful alternative to classical modelling techniques when applied to variable data sets presenting non-linear relationships. 1998 Elsevier Science B.V. All rights reserved. Keywords: Artificial Neural Networks (ANNs); Comparison of modelling techniques; Associating networks; Response Surface Methodology (RSM); Non-linear relationships; Tablet compression study; Pharmaceutical technology 1. Introduction The aim of the galenical study was to quantitatively characterise the influence of each excipient’s concentration The application of Artificial Neural Networks (ANNs) in on the ejection and residual forces during tablet ejection. the field of pharmaceutical development and optimisation of dosage forms has recently gained interest in the pharmaceutical literature (Hussain et al., 1991, 1994; 2. Materials and methods Murtoniemi et al., 1993, 1994a,b; McCall et al., 1994; ¨ Turkoglu et al., 1995; Merkku et al., 1995; Kesavan, 1995; 2.1. Dosage form Ebube et al., 1995; Richardson and Barlow, 1996; Zupancic Bozic, 1996). In some of these papers the ANN For this study the tablets were produced using the direct modelling methodology was successfully compared to compression method. The tablets contained the following classical statistical methods. ingredients: Silica aerogel (Aerosil 200 , Cabot, Sugro In this paper the modelling abilities of the ANN AG, Basel, Switzerland), microcrystalline cellulose (Avicel ¨ methodology are compared to those of classical statistical PH 102 , FMC Ireland; Selectchemie AG, Zurich Switzer- methods using typical data sets gained from a galenical land), magnesium stearate (FACI Italy; Schweizerhall study and showing highly non-linear relationships. Chemische Fabrik AG, Basel, Switzerland), low substi- tuted sodium carboxymethylcellulose (Nymcel ZSB-10 * modified , Metsa-Serla, Mimox AG, Zollikon, Switzer- Corresponding author. Tel.: (41-61) 696-47-21; fax: (41-61) 696-69- 81; e-mail: [email protected]land) and an established model drug substance. All in- 0928-0987 / 98 / $ – see front matter 1998 Elsevier Science B.V. All rights reserved. PII: S0928-0987(97)10028-8
Transcript
European Journal of Pharmaceutical Sciences, 7 (1998) 5–16
Advantages of Artificial Neural Networks (ANNs) as alternative modellingtechnique for data sets showing non-linear relationships using data from a
galenical study on a solid dosage forma , b a c*Jacques Bourquin , Heinz Schmidli , Peter van Hoogevest , Hans Leuenberger
cCollege of Pharmacy, University of Basel, Basel, Switzerland
Received 3 February 1997; accepted 11 September 1997
Abstract
Artificial Neural Networks (ANN) methodology was used to assess experimental data from a tablet compression study showing highlynon-linear relationships (i.e. measurements of ejection forces) and compared to classical modelling technique (i.e. Response SurfaceMethodology, RSM). These kinds of relationships are known to be difficult to model using classical methods. The aim of thisinvestigation was to quantitatively describe the achieved degree of data fitting and predicting abilities of the developed models. Thecomparison between the ANN and RSM was carried out both graphically and numerically. For comparing the goodness of fit, all datawere used, whereas for the goodness of prediction the data were split into a learning and a validation data set. Better results were achievedfor the model using ANN methodology with regard to data fitting and predicting ability. All determined ejection properties were mainlyinfluenced by the concentration of magnesium stearate and silica aerogel, whereas the other factors showed very much lower effects.Important relationships could be recognised from the ANN model only, whereas the RSM model ignored them. The ANN methodologyrepresents a useful alternative to classical modelling techniques when applied to variable data sets presenting non-linear relationships. 1998 Elsevier Science B.V. All rights reserved.
1. Introduction The aim of the galenical study was to quantitativelycharacterise the influence of each excipient’s concentration
The application of Artificial Neural Networks (ANNs) in on the ejection and residual forces during tablet ejection.the field of pharmaceutical development and optimisationof dosage forms has recently gained interest in thepharmaceutical literature (Hussain et al., 1991, 1994; 2. Materials and methodsMurtoniemi et al., 1993, 1994a,b; McCall et al., 1994;
¨Turkoglu et al., 1995; Merkku et al., 1995; Kesavan, 1995; 2.1. Dosage formEbube et al., 1995; Richardson and Barlow, 1996;Zupancic Bozic, 1996). In some of these papers the ANN For this study the tablets were produced using the directmodelling methodology was successfully compared to compression method. The tablets contained the following
classical statistical methods. ingredients: Silica aerogel (Aerosil 200 , Cabot, SugroIn this paper the modelling abilities of the ANN AG, Basel, Switzerland), microcrystalline cellulose (Avicel
¨methodology are compared to those of classical statistical PH 102 , FMC Ireland; Selectchemie AG, Zurich Switzer-methods using typical data sets gained from a galenical land), magnesium stearate (FACI Italy; Schweizerhallstudy and showing highly non-linear relationships. Chemische Fabrik AG, Basel, Switzerland), low substi-
* modified , Metsa-Serla, Mimox AG, Zollikon, Switzer-Corresponding author. Tel.: (41-61) 696-47-21; fax: (41-61) 696-69-81; e-mail: [email protected] land) and an established model drug substance. All in-
0928-0987/98/$ – see front matter 1998 Elsevier Science B.V. All rights reserved.PI I : S0928-0987( 97 )10028-8
6 J. Bourquin et al. / European Journal of Pharmaceutical Sciences 7 (1998) 5 –16
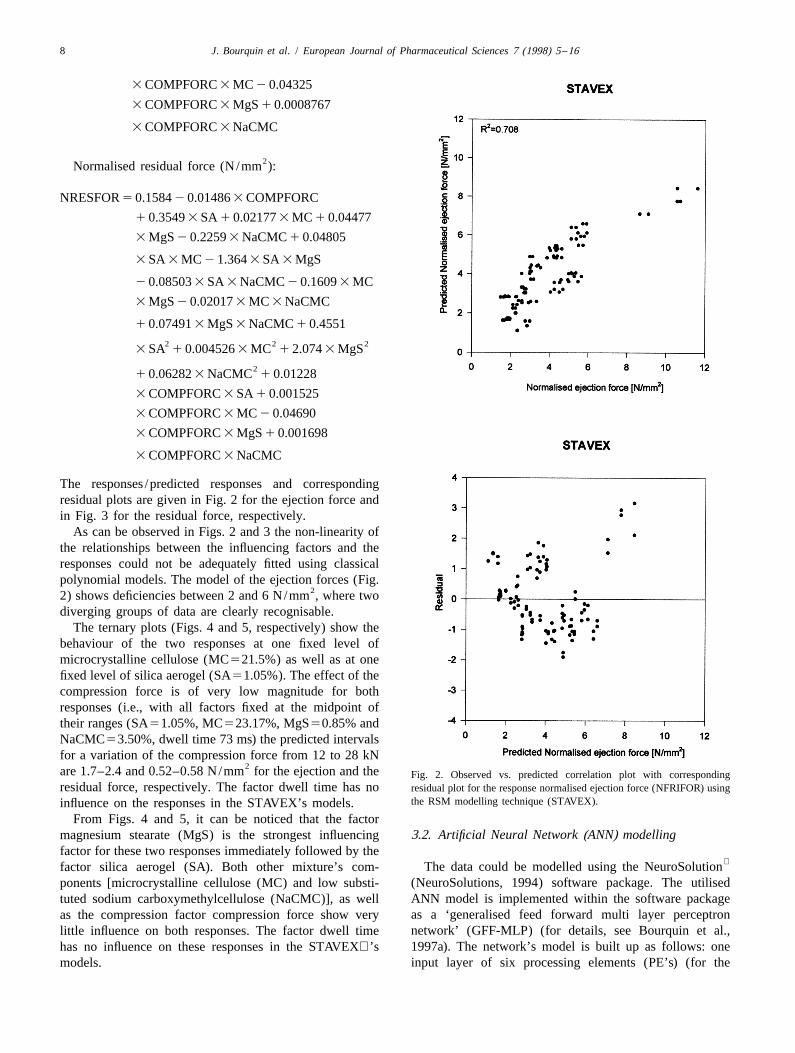
gredients up to the magnesium stearate were passed • The magnesium stearate (MgS) concentration may varythrough a 1 mm sieve (Frewitt MGL, Frewitt Fabrique de between 0.2 and 1.5%.Machines SA, Granges-Paccot, Switzerland) and mixed for • The low substituted sodium carboxymethylcellulose10 min using a drum mixer (Turbula T10B, Willy A. (NaCMC) concentration may vary between 2.5 andBachofen AG Maschinenfabrik, Basel, Switzerland); after 7.5%.admixing the magnesium stearate through a 0.8 mm • The compression force (COMPFORC) may vary be-handsieve the mixtures were mixed for an additional 1 tween 12 and 28 kN.min. The mixtures were compressed to 280 mg with 9 mm • The dwell time (DWELLTI) may vary for the excenterround and flat punches having bevelled edges and a score machine between 60 and 85 ms.on one side. The compression was carried out using asingle punch excenter compression machine (instrumented Using these constraints the expert system proposed aKorsch EK0, Korsch Berlin; Mapag Maschinen AG, Bern, Vertex centroid design composed of 28 experiments andSwitzerland) at different compression forces (12, 20 and requiring, 16 unique mixtures.28 kN) and speeds (high/ low). On the basis of this experimental design and using the
16 unique mixtures (plus one additional mixture fromorientary trials) (see Table 1), the actual plan has been2.2. Ejection and residual forcesexpanded as follows: for each of the 17 mixtures thefollowing 6 trials were run: 2 compression speeds, eachThe ejection force is defined as the force which iswith 3 compression forces resulting in 102 trials (see thenecessary for ejecting the tablet out of the matrix and isdesign data set in Appendix A).measured on the lower punch of the machine using a piezo The data were modelled using either the STAVEXelectric load washer. The residual force is defined as thesoftware package which implements the classical responsemeasured force on the lower punch after relaxing of the surface methodology (RSM) or using the NeuroSolutionsupper punch but before ejection of the tablet. These values(NeuroSolutions, 1994) software package which uses theare normalised by dividing them through the surface inartificial neural network (ANN) methodology.2contact with the matrix, giving results in N/mm , i.e. no
To compare the performance of the models the follow-longer a force but a pressure measurement (NFRIFOR anding indexes and graphical representations were computed:NRESFOR, n53 measurements).
22.3. Experimental design and data modelling • The squared correlation coefficient R defined as:
SSE2One aim of this study is to quantitatively characterise ]]S DR 5 1 2 (1)TSSthe influence of each excipient’s concentration on theejection and residual forces during ejection. Where SSE is the sum of squared error between the
For that purpose an experimental plan showing quantita- models’ predictions and the target values (i.e. true-,tive changes of the excipients concentration, keeping measured values resp.). SSM is the sum of squareddosage strength and total tablets weight constant was error of the model, i.e. the sum of the squared errordesigned. All processing parameters for the preparation ofthe mixtures were kept constant (i.e. batch size, mixer Table 1
Mixtures compositionstype, mixing times and sieves). The mixtures were com-pressed onto an instrumented excenter compression ma- Mix No. SA (%) MC (%) MgS (%) NaCMC (%)chine.
1 2.00 17.57 1.50 7.50The original experimental plan was set up using a 2 2.00 18.22 0.85 7.50
statistical expert system software: STAVEX (see refer- 3 1.05 18.52 1.50 7.504 2.00 18.87 0.20 7.50ences). The following constraints were given to the statisti-5 0.10 19.47 1.50 7.50cal expert system:6 0.10 20.12 0.85 7.507 0.10 20.77 0.20 7.508 2.00 21.37 0.20 5.009 2.00 22.57 1.50 2.50• The total weight of the tablet has to be kept constant at
10 0.71 23.21 1.07 3.57280 mg.11 2.00 23.22 0.85 2.50• The dosage strength has to be kept constant at 200 mg12 2.00 23.87 0.20 2.50
(71.43%) of drug substance. 13 0.10 24.47 1.50 2.50• The silica aerogel (SA) concentration may vary be- 14 1.19 24.69 0.20 2.50
15 0.10 25.50 0.20 2.77tween 0.1 and 2%.16 0.24 25.50 0.20 2.64• The microcrystalline cellulose (MC) concentration may17 0.10 25.47 0.50 2.50vary between 10 and 25.5% (q.s.).
J. Bourquin et al. / European Journal of Pharmaceutical Sciences 7 (1998) 5 –16 7
between the models’ predictions and the average of thetarget values. And TSS is the total squared error definedas TSS5SSE1SSM. Consequently, a perfect fit is
2 2given when R 51 and there is no fit when R 50.• Measured values vs. predictions scatter plot.• Predictions vs. model residuals plot (i.e. residual de-
fined as the difference between predicted and measuredvalue).
• Ternary plots of the responses.
In order to control the performance of the models and toavoid any overfitting of the data, we computed for each ofthe responses the best possible correlation coefficient (max
2 2R ). Max R is given by the quality of the responsemeasurements and is defined as follows:
2S2 ]max R 5 1 2 (2)2S 0
2where S is the averaged variance of the repeated measure-2ments and S is the variance of the means. Thus, the0
models are not showing overfitting as long as the achieved2 2R coefficients do not surpass the value of max R .
3. Results and discussion
The ejection and residual forces have been determinedusing an instrumented single punch excenter compressionmachine (EK0) onto three tablets (n53) (for the data seeAppendix A).
First the raw data (means of three measurements) havebeen analyzed with regard to correlation patterns. Fig. 1shows the correlation between the normalised ejectionforce (NFRIFOR) and normalised residual force (NRES-FOR) and each possibly influencing factor.
Some correlation could be found between the ejectionforce resp. residual force and the concentration of mag-nesium stearate (MGS) (negative correlation) as well as theconcentration of silica aerogel (SA) (positive correlation).It can be noticed that these relationships are non-linear. Nocorrelation could be found with the two compressionfactors dwell time (DWELLTI) and compression force(COMPFORC), or with the remaining compounds of the
Fig. 1. Correlation matrices for the responses normalised ejection-mixtures (MC, NACMC).(NFRIFOR) and residual force (NRESFOR) and the influencing factors.
3.1. Statistical RSM modelling
3 SA 3 MC 2 0.7718 3 SA 3 MgSThese data were analyzed with the STAVEX software2 0.08350 3 SA 3 NaCMC 2 0.2019 3 MCusing a user-defined plan describing the 102 trials. The
analysis resulted in full quadratic models with unimportant 3 MgS 2 0.03058 3 MC 3 NaCMC( p-value.0.05) terms eliminated: 2
1 0.07208 3 NaCMC 1 0.011771 0.1452 3 SA 1 0.05515 3 MC 2 0.48113 MgS 2 0.2432 3 NaCMC 2 0.007135 3 COMPFORC 3 SA 1 0.001499
8 J. Bourquin et al. / European Journal of Pharmaceutical Sciences 7 (1998) 5 –16
3 COMPFORC 3 MC 2 0.04325
3 COMPFORC 3 MgS 1 0.0008767
3 COMPFORC 3 NaCMC
2Normalised residual force (N/mm ):
NRESFOR 5 0.1584 2 0.01486 3 COMPFORC
1 0.3549 3 SA 1 0.02177 3 MC 1 0.04477
3 MgS 2 0.2259 3 NaCMC 1 0.04805
3 SA 3 MC 2 1.364 3 SA 3 MgS
2 0.08503 3 SA 3 NaCMC 2 0.1609 3 MC
3 MgS 2 0.02017 3 MC 3 NaCMC
1 0.07491 3 MgS 3 NaCMC 1 0.45512 2 2
3 SA 1 0.004526 3 MC 1 2.074 3 MgS2
1 0.06282 3 NaCMC 1 0.01228
3 COMPFORC 3 SA 1 0.001525
3 COMPFORC 3 MC 2 0.04690
3 COMPFORC 3 MgS 1 0.001698
3 COMPFORC 3 NaCMC
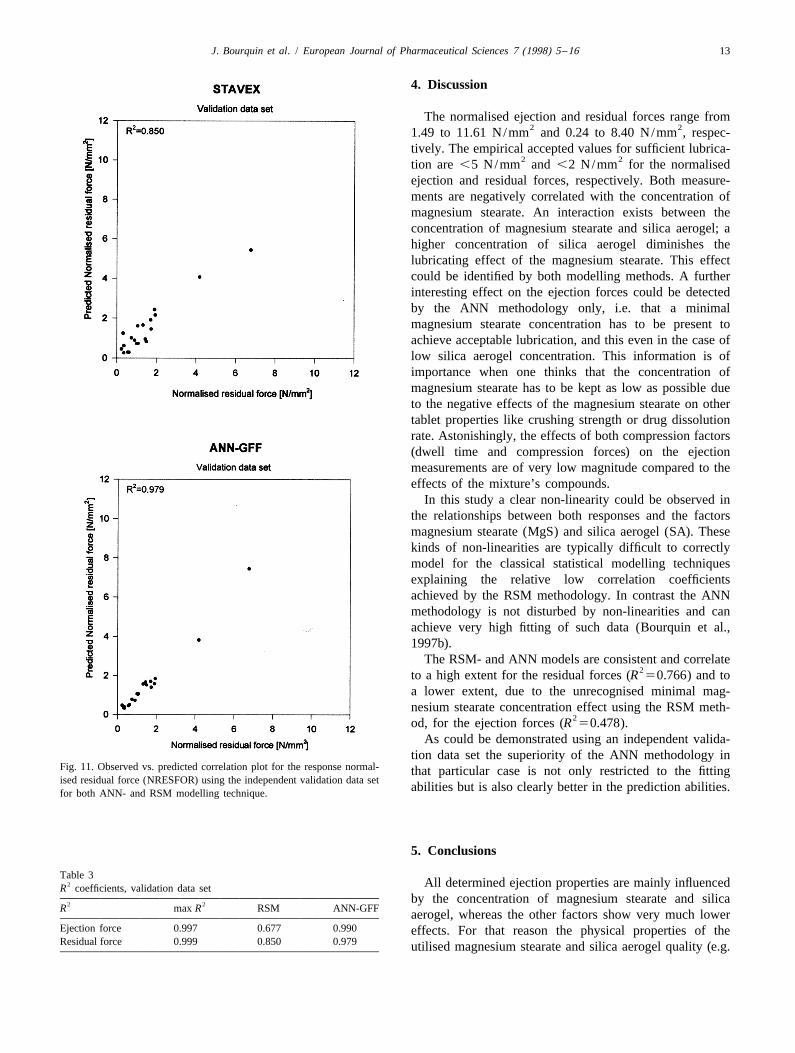
The responses /predicted responses and correspondingresidual plots are given in Fig. 2 for the ejection force andin Fig. 3 for the residual force, respectively.
As can be observed in Figs. 2 and 3 the non-linearity ofthe relationships between the influencing factors and theresponses could not be adequately fitted using classicalpolynomial models. The model of the ejection forces (Fig.
22) shows deficiencies between 2 and 6 N/mm , where twodiverging groups of data are clearly recognisable.
The ternary plots (Figs. 4 and 5, respectively) show thebehaviour of the two responses at one fixed level ofmicrocrystalline cellulose (MC521.5%) as well as at onefixed level of silica aerogel (SA51.05%). The effect of thecompression force is of very low magnitude for bothresponses (i.e., with all factors fixed at the midpoint oftheir ranges (SA51.05%, MC523.17%, MgS50.85% andNaCMC53.50%, dwell time 73 ms) the predicted intervalsfor a variation of the compression force from 12 to 28 kN
2are 1.7–2.4 and 0.52–0.58 N/mm for the ejection and the Fig. 2. Observed vs. predicted correlation plot with correspondingresidual force, respectively. The factor dwell time has no residual plot for the response normalised ejection force (NFRIFOR) using
the RSM modelling technique (STAVEX).influence on the responses in the STAVEX’s models.From Figs. 4 and 5, it can be noticed that the factor
3.2. Artificial Neural Network (ANN) modellingmagnesium stearate (MgS) is the strongest influencingfactor for these two responses immediately followed by the
The data could be modelled using the NeuroSolutionfactor silica aerogel (SA). Both other mixture’s com-(NeuroSolutions, 1994) software package. The utilisedponents [microcrystalline cellulose (MC) and low substi-ANN model is implemented within the software packagetuted sodium carboxymethylcellulose (NaCMC)], as wellas a ‘generalised feed forward multi layer perceptronas the compression factor compression force show verynetwork’ (GFF-MLP) (for details, see Bourquin et al.,little influence on both responses. The factor dwell time1997a). The network’s model is built up as follows: onehas no influence on these responses in the STAVEX’sinput layer of six processing elements (PE’s) (for themodels.
J. Bourquin et al. / European Journal of Pharmaceutical Sciences 7 (1998) 5 –16 9
Fig. 3. Observed vs. predicted correlation plot with correspondingresidual plot for the response normalised residual force (NRESFOR)
Fig. 4. Ternary plots of the normalised ejection force (NFRIFOR) vs.using the RSM modelling technique (STAVEX).mixtures factors using the RSM modelling technique (STAVEX).
factors SA, MC, MgS, NaCMC, dwell time and compres- the hyperbolic tangent function as activation function, ansion force), one hidden layer of 12 PE’s (starting from output layer of two PE’s (for the responses normalisedKolmogorov’s theorem that states that twice the number of ejection and residual forces) also using a hyperbolicparameters plus one is enough PE’s for mapping any tangent function as the activation function, and, finally, afunction, i.e. here six parameters (i.e. SA, MC, MgS, ‘short-cut’ connection between the input and output layerNaCMC, dwell time and compression force) give 13 (see Fig. 6).hidden PE’s (Hecht-Nielsen, 1987), the PE’s were reduced The network has been trained using the Delta-rule backto 12 units in order to reduce the risk of overfitting) using propagation of errors including the momentum term. The
10 J. Bourquin et al. / European Journal of Pharmaceutical Sciences 7 (1998) 5 –16
Fig. 6. GFF-MLP Model for the normalised ejection- and residual forcesdata set.
value no longer decreased but began to increase (i.e. beginof overfitting).
The network showing the best fit (i.e. smallest MSE)was then selected for the model comparison.
The responses /predicted responses are given in Fig. 7for the ejection and residual force, respectively.
As can be observed in Fig. 7 the non-linearity of therelationships between the influencing factors and theresponses could almost perfectly be fitted using ANNmethodology. The model of the ejection forces does not
2show any deficiencies between 2 and 6 N/mm , as was thecase for the RSM model where two diverging groups ofdata were clearly recognisable.
The effect of the compression force is of very lowmagnitude for both responses (i.e., with all factors fixed atthe midpoint of their ranges (SA51.05%, MC523.17%,MgS50.85% and NaCMC53.50%, Dwell time 73 ms) thepredicted intervals for a variation of the compression force
2from 12 to 28 kN are 3.2–4.0 and 1.35–1.04 N/mm forthe ejection and the residual force, respectively. The effectof the dwell time is also of very low magnitude for bothresponses (i.e., with all factors fixed at the midpoint) thepredicted intervals for a variation of the dwell time from
260 to 85 ms are 4.3–3.9 and 1.44–1.49 N/mm for thenormalised ejection and residual force, respectively.
From the ternary plots (Figs. 8 and 9), it can be noticedthat the factor magnesium stearate (MgS) is the strongestinfluencing factor for the responses immediately followedby the factor silica aerogel (SA). Both other mixture’scomponents [microcrystalline cellulose (MC) and low
Fig. 5. Ternary plots of the normalised residual force (NRESFOR) vs. substituted sodium carboxymethylcellulose (NaCMC)], asmixtures factors using the RSM modelling technique (STAVEX). well as the compression factors dwell time and compres-
sion force show very little influences on both responses.analysis was carried out using a part of the data set (i.e. 87 From Fig. 8 it can additionally be observed that a minimalsamples) for training of the network’s weights. The MgS concentration is needed to achieve low ejectionstopped training method was applied using a separate test forces even in the case of low SA concentration.data set. As test data set we utilised the remaining 15samples for reliability assessment. The network was 3.3. Comparison of the modelling techniquestrained 10 times, each time using new random sets ofinitial network’s weights. The error [i.e. mean squared To stress the robustness of the developed models anerror, MSE (MSE5SSE/n)] of the test data set has been analysis has been carried out using a reduced (80 samples)monitored and the training was stopped as soon as this learning (or model development) data set and an indepen-
J. Bourquin et al. / European Journal of Pharmaceutical Sciences 7 (1998) 5 –16 11
Fig. 7. Observed vs. predicted correlation plot for the responses normal-ised ejection force (NFRIFOR) and residual force (NRESFOR) using theANN modelling technique (ANN-GFF). Fig. 8. Ternary plots of the normalised ejection force (NFRIFOR) vs.
mixtures factors using the ANN modelling technique (ANN-GFF).
dent validation data set (22 samples, randomly chosen).The models were developed as described above but As can be observed in Figs. 10 and 11 the non-linearityutilising the reduced learning data set (i.e. statistical RSM of the relationships between the influencing factors and themodelling with 80 samples and ANN modelling with 68 responses in the validation data set could very well besamples as training and 12 as test data set). fitted using the ANN methodology (ANN-GFF) whereas
The responses /predicted responses for the independent the RSM models (STAVEX, 1995) show deficienciesvalidation data set are given in Fig. 10 for the normalised especially for the ejection forces’ model. Thus, the sameejection force and in Fig. 11 for the residual force, trends as those observed with the full data set could berespectively. confirmed using an independent validation data set.
12 J. Bourquin et al. / European Journal of Pharmaceutical Sciences 7 (1998) 5 –16
Fig. 10. Observed vs. predicted correlation plot for the response normal-ised ejection force (NFRIFOR) using the independent validation data setFig. 9. Ternary plots of the normalised residual force (NRESFOR) vs.for both RSM- and ANN modelling techniques.mixtures factors using the ANN modelling technique (ANN-GFF).
Table 222The comparison of the correlation coefficients (R , see R coefficients, full data set
Tables 2 and 3) of both methods show a clear superiority2 2R max R RSM ANN-GFF2of the ANN model (i.e. achieving R coefficients near to
2 Ejection force 0.997 0.708 0.997max R ) compared to the classical RSM modelling tech-Residual force 0.999 0.849 0.998nique.
J. Bourquin et al. / European Journal of Pharmaceutical Sciences 7 (1998) 5 –16 13
4. Discussion
The normalised ejection and residual forces range from2 21.49 to 11.61 N/mm and 0.24 to 8.40 N/mm , respec-
tively. The empirical accepted values for sufficient lubrica-2 2tion are ,5 N/mm and ,2 N/mm for the normalised
ejection and residual forces, respectively. Both measure-ments are negatively correlated with the concentration ofmagnesium stearate. An interaction exists between theconcentration of magnesium stearate and silica aerogel; ahigher concentration of silica aerogel diminishes thelubricating effect of the magnesium stearate. This effectcould be identified by both modelling methods. A furtherinteresting effect on the ejection forces could be detectedby the ANN methodology only, i.e. that a minimalmagnesium stearate concentration has to be present toachieve acceptable lubrication, and this even in the case oflow silica aerogel concentration. This information is ofimportance when one thinks that the concentration ofmagnesium stearate has to be kept as low as possible dueto the negative effects of the magnesium stearate on othertablet properties like crushing strength or drug dissolutionrate. Astonishingly, the effects of both compression factors(dwell time and compression forces) on the ejectionmeasurements are of very low magnitude compared to theeffects of the mixture’s compounds.
In this study a clear non-linearity could be observed inthe relationships between both responses and the factorsmagnesium stearate (MgS) and silica aerogel (SA). Thesekinds of non-linearities are typically difficult to correctlymodel for the classical statistical modelling techniquesexplaining the relative low correlation coefficientsachieved by the RSM methodology. In contrast the ANNmethodology is not disturbed by non-linearities and canachieve very high fitting of such data (Bourquin et al.,1997b).
The RSM- and ANN models are consistent and correlate2to a high extent for the residual forces (R 50.766) and to
a lower extent, due to the unrecognised minimal mag-nesium stearate concentration effect using the RSM meth-
2od, for the ejection forces (R 50.478).As could be demonstrated using an independent valida-
tion data set the superiority of the ANN methodology inFig. 11. Observed vs. predicted correlation plot for the response normal- that particular case is not only restricted to the fittingised residual force (NRESFOR) using the independent validation data set
abilities but is also clearly better in the prediction abilities.for both ANN- and RSM modelling technique.
5. Conclusions
Table 32 All determined ejection properties are mainly influencedR coefficients, validation data set
by the concentration of magnesium stearate and silica2 2R max R RSM ANN-GFF aerogel, whereas the other factors show very much lower
Ejection force 0.997 0.677 0.990 effects. For that reason the physical properties of theResidual force 0.999 0.850 0.979 utilised magnesium stearate and silica aerogel quality (e.g.
14 J. Bourquin et al. / European Journal of Pharmaceutical Sciences 7 (1998) 5 –16
their specific surface area) are of importance for the ping of tablets). Therefore, further investigations on thebehaviour of the mixtures under compression. usefulness of this methodology in the pharmaceutical
In this study the ANN methodology shows a clear technology area are necessary.superiority as modelling technique, in comparison toclassical statistical modelling methods, for data sets show-ing non-linear relationships, and this for both data fitting Acknowledgementsand prediction abilities.
For the formulator important relationships could be JB would like to thank Dr. H. Schmidli, Prof Dr. P. vanrecognised from the ANN model only, whereas the RSM Hoogevest and Prof. Dr. H. Leuenberger for their valuablemodel ignored them. help in the review of this paper, as well as Dr. H. Rettig,
The ANN methodology represents a real alternative to former Head of pharmaceutical development at Ciba-Geigyclassical statistical modelling techniques for data sets Ltd. Basel, for supporting this investigation. Furthermore,showing non-linearities. Such kinds of relationships are not the technical assistance of Mr. R. Friedli’s laboratory teamunusual in the pharmaceutical technology field (e.g. cap- (Novartis Pharma AG, Basel) is acknowledged.
Appendix A
Ejection and residual forces data set
SA MC MgS NaCMC Dwell time Compression Normalised R.S.D. normal- Normalised R.S.D. normal-(%) (%) (%) (%) (ms) force residual force ised residual ejection force ised ejection
2 2(kN) (N/mm ) force (n53)(%) (N/mm ) force (n53)(%)
J. Bourquin et al. / European Journal of Pharmaceutical Sciences 7 (1998) 5 –16 15
SA MC MgS NaCMC Dwell time Compression Normalised R.S.D. normal- Normalised R.S.D. normal-(%) (%) (%) (%) (ms) force residual force ised residual ejection force ised ejection
2 2(kN) (N/mm ) force (n53)(%) (N/mm ) force (n53)(%)
16 J. Bourquin et al. / European Journal of Pharmaceutical Sciences 7 (1998) 5 –16
SA MC MgS NaCMC Dwell time Compression Normalised R.S.D. normal- Normalised R.S.D. normal-(%) (%) (%) (%) (ms) force residual force ised residual ejection force ised ejection
2 2(kN) (N/mm ) force (n53)(%) (N/mm ) force (n53)(%)
Historical formulation data analysis using neural networks. Pharma-Referencesceutical Research 11 (10 suppl.), 170.
Merkku, P.J., Antikainen, O.K., Mannermaa, J.P., Yliruusi, J.K., Oy, L.,Bourquin, J., Schmidli, H., Van Hoogevest, P., Leuenberger, H., 1997. 1995. Comparison of two regression models and neural networks in
Basic concepts of artificial neural networks (ANN) in the application fluidised bed data analysis. Pharmaceutical Research 12 (9 suppl.),to pharmaceutical development. Pharmaceutical Development and 188.Technology 2 (2), 95–109. Murtoniemi, E., Merkku, P., Yliruusi, J., 1993. Comparison of four
Bourquin, J., Schmidli, H., Van Hoogevest, P., Leuenberger, H., 1997. different Neural network training algorithms in modelling the fluidizedApplication of artificial neural networks (ANN) in the development of bed granulation process. Laboratory Microcomputer 12 (3), 69–76.solid dosage forms. Pharmaceutical Development and Technology 2 ¨Murtoniemi, E., Yliruusi, J., Kinnunen, P., Merkku, P., Leiviska, K., 1994.(2), 111–121. The advantages by the use of neural networks in modelling the
Ebube, N.K., Meyer, M.C., McCall, T., 1995. Application of artificial fluidized bed granulation process. Int. J. Pharm. 108, 155–164.intelligence to pharmaceutical product development: A systematic ¨Murtoniemi, E., Merkku, P., Kinnunen, P., Leiviska, K., Yliruusi, J., 1994.approach to the selection of training data. Pharmaceutical Research 12 Effect of neural network topology and training end point in modelling(9 suppl.), 144. the fluidized bed granulation process. Int. J. Pharm. 110, 101–108.
Hecht-Nielsen, R., 1987. Kolmogorov’s mapping neural network exist- NeuroSolutions, Consultant version 2.14, 1994, NeuroDimension Inc.,ence theorem. Proc. 1st IEEE Intl. Joint Conf. on Neural Networks, Gainesville, FL, USA.San Diego, 21–24 June 1987, pp. III-11–14. Richardson, C.J., Barlow, D.J., 1996. Neural network computer simula-
Hussain, A.S., Xuanqjang, Y., Johnson, R.D., 1991. Application of neural tion of aerosols. Journal of Pharmacy and Pharmacology 48 (6),computing in pharmaceutical product development. Pharm. Res. 8, 581–591.1248–1252. STAVEX Expert System, STAtisitische Versuchsplanung mit EXper-
Hussain, A.S., Shivanand, P., Johnson, R.D., 1994. Application of neural tensystem, Version 4.1, Mathematical Applications, 1995, CSU In-computing in pharmaceutical product development: Computer aided formation Services 7.1, Ciba-Geigy, Basel.formulation design. Drug Development and Industrial Pharmacy 20 ¨Turkoglu, M., Ozarslan, R., Sakr, A., 1995. Artificial neural network(10), 1739–1752. analysis of a direct compression tabletting study. Eur. J. Pharm.
Kesavan, J.G., 1995. Approaches to the modelling of tablet processing Biopharm. 41 (5), 315–322.and stability of solid dosage forms (pharmaceutical formulation, neural Zupancic Bozic, D., 1996. Optimisation of dissolution using artificialnetworks, solid state). Diss. Abstr. Int. 56 (2B), 762. neural network. Farmacevtski Vestnik 47 (spec. issue), 185–186.